Cities with the Largest Celtic Community in the United States
RELATED REPORTS & OPTIONS
Celtic
United States
Compare Cities
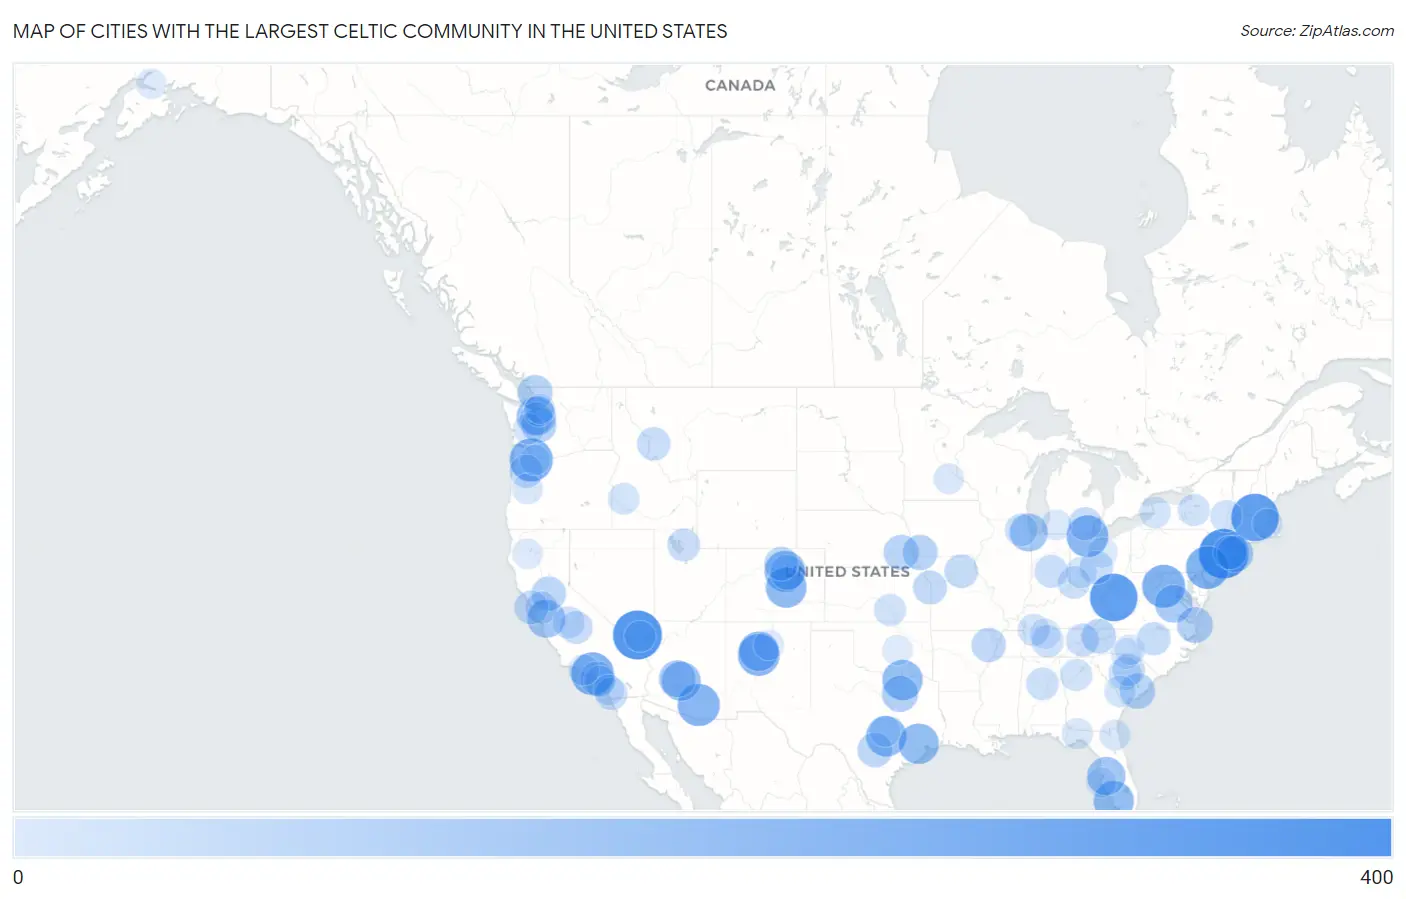
Map of Cities with the Largest Celtic Community in the United States
0
400
Cities with the Largest Celtic Community in the United States
| City | Celtic | vs State | vs National | |
| 1. | New York | 357 | 2,360(15.13%)#1 | 48,447(0.74%)#1 |
| 2. | Las Vegas | 347 | 776(44.72%)#1 | 48,447(0.72%)#2 |
| 3. | Fitchburg | 326 | 1,367(23.85%)#1 | 48,447(0.67%)#3 |
| 4. | South Charleston | 326 | 752(43.35%)#1 | 48,447(0.67%)#4 |
| 5. | Portland | 261 | 1,387(18.82%)#1 | 48,447(0.54%)#5 |
| 6. | Front Royal | 258 | 1,720(15.00%)#1 | 48,447(0.53%)#6 |
| 7. | Philadelphia | 256 | 1,398(18.31%)#1 | 48,447(0.53%)#7 |
| 8. | Los Angeles | 255 | 4,237(6.02%)#1 | 48,447(0.53%)#8 |
| 9. | Tucson | 244 | 1,409(17.32%)#1 | 48,447(0.50%)#9 |
| 10. | Toledo | 240 | 1,816(13.22%)#1 | 48,447(0.50%)#10 |
| 11. | Albuquerque | 239 | 762(31.36%)#1 | 48,447(0.49%)#11 |
| 12. | Denver | 226 | 1,770(12.77%)#1 | 48,447(0.47%)#12 |
| 13. | Colorado Springs | 223 | 1,770(12.60%)#2 | 48,447(0.46%)#13 |
| 14. | Austin | 220 | 3,826(5.75%)#1 | 48,447(0.45%)#14 |
| 15. | Houston | 219 | 3,826(5.72%)#2 | 48,447(0.45%)#15 |
| 16. | Island Walk | 218 | 3,110(7.01%)#1 | 48,447(0.45%)#16 |
| 17. | Sherman | 217 | 3,826(5.67%)#3 | 48,447(0.45%)#17 |
| 18. | Rio Rancho | 207 | 762(27.17%)#2 | 48,447(0.43%)#18 |
| 19. | Seattle | 202 | 2,275(8.88%)#1 | 48,447(0.42%)#19 |
| 20. | Phoenix | 200 | 1,409(14.19%)#2 | 48,447(0.41%)#20 |
| 21. | Bloomingdale | 189 | 3,110(6.08%)#2 | 48,447(0.39%)#21 |
| 22. | Morgan Hill | 184 | 4,237(4.34%)#2 | 48,447(0.38%)#22 |
| 23. | Chicago | 183 | 762(24.02%)#1 | 48,447(0.38%)#23 |
| 24. | Lake Land Or | 177 | 1,720(10.29%)#2 | 48,447(0.37%)#24 |
| 25. | Surprise | 167 | 1,409(11.85%)#3 | 48,447(0.34%)#25 |
| 26. | Islip | 161 | 2,360(6.82%)#2 | 48,447(0.33%)#26 |
| 27. | Dallas | 156 | 3,826(4.08%)#4 | 48,447(0.32%)#27 |
| 28. | Virginia Beach | 152 | 1,720(8.84%)#3 | 48,447(0.31%)#28 |
| 29. | Goose Creek | 144 | 1,122(12.83%)#1 | 48,447(0.30%)#29 |
| 30. | Lincoln | 142 | 327(43.43%)#1 | 48,447(0.29%)#30 |
| 31. | Bellingham | 141 | 2,275(6.20%)#2 | 48,447(0.29%)#31 |
| 32. | Bonney Lake | 141 | 2,275(6.20%)#3 | 48,447(0.29%)#32 |
| 33. | Shenandoah | 141 | 419(33.65%)#1 | 48,447(0.29%)#33 |
| 34. | Aurora | 137 | 1,770(7.74%)#3 | 48,447(0.28%)#34 |
| 35. | San Antonio | 135 | 3,826(3.53%)#5 | 48,447(0.28%)#35 |
| 36. | Huntington Beach | 134 | 4,237(3.16%)#3 | 48,447(0.28%)#36 |
| 37. | Sacramento | 132 | 4,237(3.12%)#4 | 48,447(0.27%)#37 |
| 38. | Greeneville | 131 | 1,044(12.55%)#1 | 48,447(0.27%)#38 |
| 39. | Trumann | 130 | 387(33.59%)#1 | 48,447(0.27%)#39 |
| 40. | Longmont | 123 | 1,770(6.95%)#4 | 48,447(0.25%)#40 |
| 41. | Overland Park | 122 | 576(21.18%)#1 | 48,447(0.25%)#41 |
| 42. | San Francisco | 120 | 4,237(2.83%)#5 | 48,447(0.25%)#42 |
| 43. | Hicksville | 120 | 2,360(5.08%)#3 | 48,447(0.25%)#43 |
| 44. | Macon | 118 | 644(18.32%)#1 | 48,447(0.24%)#44 |
| 45. | Columbus | 114 | 1,816(6.28%)#2 | 48,447(0.24%)#45 |
| 46. | Corvallis | 114 | 261(43.68%)#1 | 48,447(0.24%)#46 |
| 47. | Durham | 113 | 1,478(7.65%)#1 | 48,447(0.23%)#47 |
| 48. | Salem | 113 | 1,387(8.15%)#2 | 48,447(0.23%)#48 |
| 49. | Ann Arbor | 112 | 1,581(7.08%)#1 | 48,447(0.23%)#49 |
| 50. | Indianapolis | 110 | 814(13.51%)#1 | 48,447(0.23%)#50 |
| 51. | White Center | 110 | 2,275(4.84%)#4 | 48,447(0.23%)#51 |
| 52. | Knoxville | 109 | 1,044(10.44%)#2 | 48,447(0.22%)#52 |
| 53. | Mendham Borough | 109 | 746(14.61%)#1 | 48,447(0.22%)#53 |
| 54. | Sanger | 108 | 4,237(2.55%)#6 | 48,447(0.22%)#54 |
| 55. | South Ogden | 107 | 394(27.16%)#1 | 48,447(0.22%)#55 |
| 56. | Columbia | 106 | 1,122(9.45%)#2 | 48,447(0.22%)#56 |
| 57. | San Diego | 104 | 4,237(2.45%)#7 | 48,447(0.21%)#57 |
| 58. | Bartlett | 104 | 762(13.65%)#2 | 48,447(0.21%)#58 |
| 59. | Vestavia Hills | 102 | 659(15.48%)#1 | 48,447(0.21%)#59 |
| 60. | Lugoff | 102 | 1,122(9.09%)#3 | 48,447(0.21%)#60 |
| 61. | Cincinnati | 101 | 1,816(5.56%)#3 | 48,447(0.21%)#61 |
| 62. | Danville | 99 | 4,237(2.34%)#8 | 48,447(0.20%)#62 |
| 63. | Murfreesboro | 98 | 1,044(9.39%)#3 | 48,447(0.20%)#63 |
| 64. | Clarksville | 97 | 1,044(9.29%)#4 | 48,447(0.20%)#64 |
| 65. | Madera | 97 | 4,237(2.29%)#9 | 48,447(0.20%)#65 |
| 66. | Wichita | 96 | 576(16.67%)#2 | 48,447(0.20%)#66 |
| 67. | Sandy Springs | 95 | 1,579(6.02%)#1 | 48,447(0.20%)#67 |
| 68. | Nedrow | 95 | 2,360(4.03%)#4 | 48,447(0.20%)#68 |
| 69. | Albany | 94 | 2,360(3.98%)#5 | 48,447(0.19%)#69 |
| 70. | Boise City | 89 | 395(22.53%)#1 | 48,447(0.18%)#70 |
| 71. | Allendale | 89 | 1,122(7.93%)#4 | 48,447(0.18%)#71 |
| 72. | Buffalo | 88 | 2,360(3.73%)#6 | 48,447(0.18%)#72 |
| 73. | Sunrise Manor | 85 | 776(10.95%)#2 | 48,447(0.18%)#73 |
| 74. | Newport Beach | 85 | 4,237(2.01%)#10 | 48,447(0.18%)#74 |
| 75. | Beavercreek | 85 | 1,816(4.68%)#4 | 48,447(0.18%)#75 |
| 76. | Four Square Mile | 84 | 1,770(4.75%)#5 | 48,447(0.17%)#76 |
| 77. | Leander | 83 | 3,826(2.17%)#6 | 48,447(0.17%)#77 |
| 78. | Tallahassee | 82 | 3,110(2.64%)#3 | 48,447(0.17%)#78 |
| 79. | Jacksonville | 80 | 3,110(2.57%)#4 | 48,447(0.17%)#79 |
| 80. | Camarillo | 80 | 4,237(1.89%)#11 | 48,447(0.17%)#80 |
| 81. | Olympia | 80 | 2,275(3.52%)#5 | 48,447(0.17%)#81 |
| 82. | Charlotte | 77 | 1,478(5.21%)#2 | 48,447(0.16%)#82 |
| 83. | Springfield | 77 | 1,387(5.55%)#3 | 48,447(0.16%)#83 |
| 84. | Encinitas | 75 | 4,237(1.77%)#12 | 48,447(0.15%)#84 |
| 85. | Mattawan | 75 | 1,581(4.74%)#2 | 48,447(0.15%)#85 |
| 86. | Hendersonville | 74 | 1,044(7.09%)#5 | 48,447(0.15%)#86 |
| 87. | Eastmont | 74 | 2,275(3.25%)#6 | 48,447(0.15%)#87 |
| 88. | Elko New Market | 74 | 680(10.88%)#1 | 48,447(0.15%)#88 |
| 89. | Anchorage | 73 | 197(37.06%)#1 | 48,447(0.15%)#89 |
| 90. | Gresham | 73 | 1,387(5.26%)#4 | 48,447(0.15%)#90 |
| 91. | Mansfield | 73 | 1,816(4.02%)#5 | 48,447(0.15%)#91 |
| 92. | Lake Worth Beach | 73 | 3,110(2.35%)#5 | 48,447(0.15%)#92 |
| 93. | Shawnee | 73 | 723(10.10%)#1 | 48,447(0.15%)#93 |
| 94. | Bayshore Gardens | 73 | 3,110(2.35%)#6 | 48,447(0.15%)#94 |
| 95. | Boston | 72 | 1,367(5.27%)#2 | 48,447(0.15%)#95 |
| 96. | Weaverville | 72 | 4,237(1.70%)#13 | 48,447(0.15%)#96 |
| 97. | Athens-Clarke County Unified Government (Balance) | 71 | 1,579(4.50%)#2 | 48,447(0.15%)#97 |
| 98. | Concord | 71 | 1,478(4.80%)#3 | 48,447(0.15%)#98 |
| 99. | Santa Fe | 71 | 762(9.32%)#3 | 48,447(0.15%)#99 |
| 100. | Cavalero | 71 | 2,275(3.12%)#7 | 48,447(0.15%)#100 |
Common Questions
What are the Top 10 Cities with the Largest Celtic Community in the United States?
Top 10 Cities with the Largest Celtic Community in the United States are:
#1
357
#2
347
#3
326
#4
326
#5
261
#6
258
#7
256
#8
255
#9
244
#10
240
What city has the Largest Celtic Community in the United States?
New York has the Largest Celtic Community in the United States with 357.
What is the Total Celtic Population in the United States?
Total Celtic Population in the United States is 48,447.