Cities with the Highest Percentage of Immigrants from Brazil in the United States
RELATED REPORTS & OPTIONS
Brazil
United States
Compare Cities
Map of Cities with the Highest Percentage of Immigrants from Brazil in the United States
0.00%
20.00%
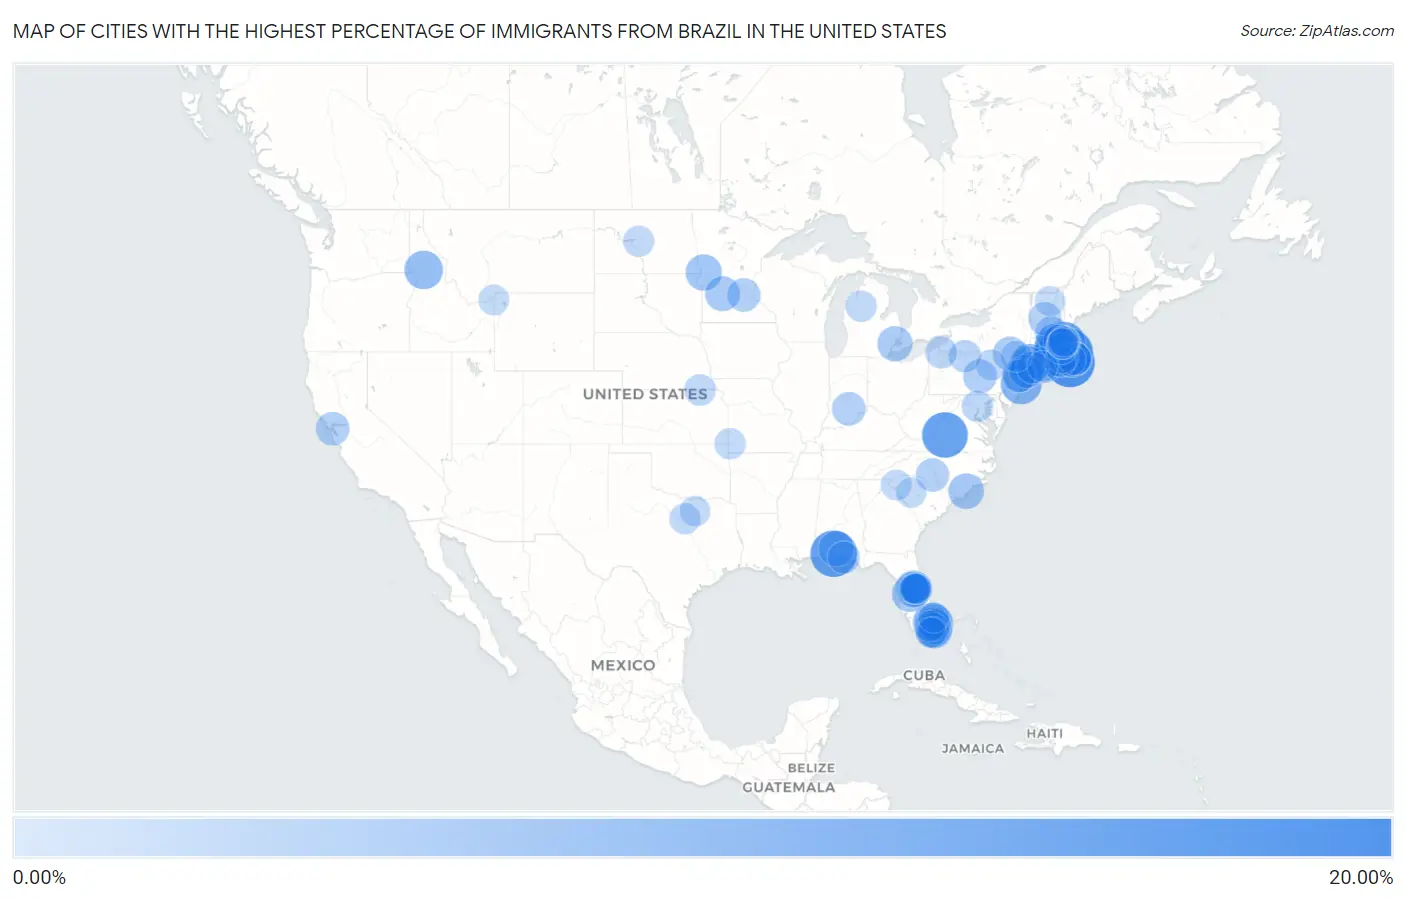
Cities with the Highest Percentage of Immigrants from Brazil in the United States
| City | Brazil | vs State | vs National | |
| 1. | Vineyard Haven | 15.97% | 1.33%(+14.6)#-1 | 0.17%(+15.8)#0 |
| 2. | North Plymouth | 15.21% | 1.33%(+13.9)#0 | 0.17%(+15.0)#1 |
| 3. | Floridatown | 13.92% | 0.57%(+13.4)#-1 | 0.17%(+13.8)#2 |
| 4. | Big Island | 13.26% | 0.094%(+13.2)#-1 | 0.17%(+13.1)#3 |
| 5. | Everett | 12.04% | 1.33%(+10.7)#3 | 0.17%(+11.9)#83 |
| 6. | Milford | 11.77% | 1.33%(+10.4)#15 | 0.17%(+11.6)#980 |
| 7. | Marlborough | 11.02% | 1.33%(+9.69)#60 | 0.17%(+10.9)#3,025 |
| 8. | Framingham | 10.80% | 1.33%(+9.47)#61 | 0.17%(+10.6)#3,026 |
| 9. | Long Branch | 9.90% | 0.50%(+9.40)#21 | 0.17%(+9.74)#3,027 |
| 10. | Clayville | 9.80% | 0.26%(+9.55)#-1 | 0.17%(+9.64)#3,028 |
| 11. | Bethel | 9.02% | 0.71%(+8.32)#-1 | 0.17%(+8.85)#3,029 |
| 12. | Watergate | 8.64% | 0.57%(+8.07)#0 | 0.17%(+8.47)#3,030 |
| 13. | Deerfield Beach | 8.46% | 0.57%(+7.89)#165 | 0.17%(+8.29)#3,031 |
| 14. | Kooskia | 8.22% | 0.044%(+8.18)#-1 | 0.17%(+8.06)#3,032 |
| 15. | Pleasant Valley | 7.49% | 0.71%(+6.79)#0 | 0.17%(+7.33)#3,033 |
| 16. | Indian Creek | 7.41% | 0.57%(+6.84)#166 | 0.17%(+7.24)#3,034 |
| 17. | East Newark Borough | 7.32% | 0.50%(+6.82)#33 | 0.17%(+7.15)#3,035 |
| 18. | Barnstable Town | 7.09% | 1.33%(+5.76)#62 | 0.17%(+6.93)#3,036 |
| 19. | Horizon West | 6.99% | 0.57%(+6.42)#167 | 0.17%(+6.83)#3,037 |
| 20. | Golden Beach | 6.75% | 0.57%(+6.18)#168 | 0.17%(+6.58)#3,038 |
| 21. | Polk City | 6.69% | 0.57%(+6.12)#169 | 0.17%(+6.52)#3,039 |
| 22. | Tintah | 6.67% | 0.052%(+6.61)#-1 | 0.17%(+6.50)#3,040 |
| 23. | Westbrook Center | 6.56% | 0.71%(+5.86)#2 | 0.17%(+6.39)#3,041 |
| 24. | Cos Cob | 6.30% | 0.71%(+5.59)#3 | 0.17%(+6.13)#3,042 |
| 25. | Northchase | 6.26% | 0.080%(+6.18)#-1 | 0.17%(+6.09)#3,043 |
| 26. | Plymouth | 6.13% | 1.33%(+4.80)#63 | 0.17%(+5.96)#3,044 |
| 27. | Quinebaug | 6.13% | 0.71%(+5.43)#4 | 0.17%(+5.96)#3,045 |
| 28. | Berrydale | 6.11% | 0.57%(+5.54)#170 | 0.17%(+5.94)#3,046 |
| 29. | Coconut Creek | 5.92% | 0.57%(+5.35)#171 | 0.17%(+5.75)#3,047 |
| 30. | Grosse Pointe Farms | 5.88% | 0.074%(+5.80)#-1 | 0.17%(+5.71)#3,048 |
| 31. | Danbury | 5.77% | 0.71%(+5.07)#10 | 0.17%(+5.60)#3,049 |
| 32. | Blomkest | 5.75% | 0.052%(+5.69)#0 | 0.17%(+5.58)#3,050 |
| 33. | Malden | 5.62% | 1.33%(+4.29)#64 | 0.17%(+5.45)#3,051 |
| 34. | Doctor Phillips | 5.56% | 0.57%(+4.99)#172 | 0.17%(+5.40)#3,052 |
| 35. | Livingston Manor | 5.33% | 0.15%(+5.18)#-1 | 0.17%(+5.16)#3,053 |
| 36. | Kearny | 5.14% | 0.50%(+4.64)#58 | 0.17%(+4.97)#3,054 |
| 37. | Ellerslie | 5.01% | 0.17%(+4.84)#-1 | 0.17%(+4.85)#3,055 |
| 38. | Port Trevorton | 4.93% | 0.10%(+4.83)#-1 | 0.17%(+4.76)#3,056 |
| 39. | Tiburon | 4.88% | 0.14%(+4.75)#609 | 0.17%(+4.72)#3,719 |
| 40. | Freetown | 4.84% | 0.039%(+4.80)#-1 | 0.17%(+4.67)#3,720 |
| 41. | Byram | 4.79% | 0.71%(+4.08)#11 | 0.17%(+4.62)#3,721 |
| 42. | Greenwood | 4.72% | 0.052%(+4.66)#1 | 0.17%(+4.55)#3,722 |
| 43. | Union | 4.71% | 0.50%(+4.21)#82 | 0.17%(+4.54)#3,723 |
| 44. | South Yarmouth | 4.68% | 1.33%(+3.34)#65 | 0.17%(+4.51)#3,724 |
| 45. | Wilder | 4.65% | 0.052%(+4.60)#-1 | 0.17%(+4.48)#3,725 |
| 46. | Aquadale | 4.65% | 0.080%(+4.57)#0 | 0.17%(+4.48)#3,726 |
| 47. | Hudson | 4.55% | 1.33%(+3.22)#66 | 0.17%(+4.38)#3,727 |
| 48. | Trumbull Center | 4.43% | 0.71%(+3.73)#12 | 0.17%(+4.26)#3,728 |
| 49. | Bennington | 4.35% | 0.21%(+4.13)#-1 | 0.17%(+4.18)#3,729 |
| 50. | Hunters Creek | 4.33% | 0.57%(+3.76)#173 | 0.17%(+4.17)#3,730 |
| 51. | Newark | 4.32% | 0.50%(+3.83)#83 | 0.17%(+4.16)#3,731 |
| 52. | Candlewood Orchards | 4.27% | 0.71%(+3.57)#13 | 0.17%(+4.11)#3,732 |
| 53. | Celebration | 4.24% | 0.57%(+3.67)#174 | 0.17%(+4.07)#3,733 |
| 54. | West Yarmouth | 4.18% | 1.33%(+2.85)#67 | 0.17%(+4.01)#3,734 |
| 55. | Pompano Beach | 4.10% | 0.57%(+3.53)#175 | 0.17%(+3.93)#3,735 |
| 56. | Destin | 3.98% | 0.57%(+3.41)#176 | 0.17%(+3.81)#3,736 |
| 57. | Bridgeport | 3.95% | 0.71%(+3.25)#14 | 0.17%(+3.78)#3,737 |
| 58. | Revere | 3.94% | 1.33%(+2.61)#68 | 0.17%(+3.77)#3,738 |
| 59. | Sweden Valley | 3.92% | 0.10%(+3.82)#0 | 0.17%(+3.75)#3,739 |
| 60. | Oak Bluffs | 3.88% | 1.33%(+2.55)#69 | 0.17%(+3.71)#3,740 |
| 61. | Lauderdale By The Sea | 3.66% | 0.57%(+3.09)#177 | 0.17%(+3.49)#3,741 |
| 62. | Columbus | 3.64% | 0.10%(+3.54)#1 | 0.17%(+3.48)#3,742 |
| 63. | Falmouth | 3.63% | 1.33%(+2.30)#70 | 0.17%(+3.46)#3,743 |
| 64. | Orlovista | 3.57% | 0.57%(+3.00)#178 | 0.17%(+3.41)#3,744 |
| 65. | Aventura | 3.57% | 0.57%(+3.00)#248 | 0.17%(+3.40)#3,745 |
| 66. | Oakland | 3.53% | 0.57%(+2.96)#249 | 0.17%(+3.36)#3,746 |
| 67. | Watchung Borough | 3.51% | 0.50%(+3.01)#84 | 0.17%(+3.34)#3,747 |
| 68. | Lakes West | 3.46% | 0.71%(+2.76)#15 | 0.17%(+3.29)#3,748 |
| 69. | Napanoch | 3.44% | 0.15%(+3.29)#0 | 0.17%(+3.27)#3,749 |
| 70. | Oketo | 3.36% | 0.067%(+3.29)#-1 | 0.17%(+3.19)#3,750 |
| 71. | Fall River | 3.35% | 1.33%(+2.02)#71 | 0.17%(+3.19)#3,751 |
| 72. | Aspen Hill | 3.34% | 0.19%(+3.14)#33 | 0.17%(+3.17)#3,752 |
| 73. | Newport East | 3.33% | 0.26%(+3.07)#0 | 0.17%(+3.17)#3,753 |
| 74. | Route 7 Gateway | 3.27% | 0.71%(+2.57)#16 | 0.17%(+3.10)#3,754 |
| 75. | Key Biscayne | 3.22% | 0.57%(+2.65)#250 | 0.17%(+3.05)#3,755 |
| 76. | Saugus | 3.20% | 1.33%(+1.87)#72 | 0.17%(+3.04)#3,756 |
| 77. | Turtle Lake | 3.18% | 0.028%(+3.15)#-1 | 0.17%(+3.01)#3,757 |
| 78. | Annetta North | 3.18% | 0.085%(+3.10)#-1 | 0.17%(+3.01)#3,758 |
| 79. | Cliffside Park Borough | 3.18% | 0.50%(+2.68)#85 | 0.17%(+3.01)#3,759 |
| 80. | Shoal Creek Drive | 3.18% | 0.030%(+3.15)#-1 | 0.17%(+3.01)#3,760 |
| 81. | Lake City | 3.13% | 0.074%(+3.06)#0 | 0.17%(+2.97)#3,761 |
| 82. | Bay Hill | 3.12% | 0.57%(+2.55)#251 | 0.17%(+2.95)#3,762 |
| 83. | Murray | 3.11% | 0.71%(+2.41)#17 | 0.17%(+2.94)#3,763 |
| 84. | Pikes Creek | 3.08% | 0.10%(+2.98)#2 | 0.17%(+2.91)#3,764 |
| 85. | Norwood | 3.05% | 1.33%(+1.72)#73 | 0.17%(+2.88)#3,765 |
| 86. | Weston | 3.04% | 0.57%(+2.47)#252 | 0.17%(+2.88)#3,766 |
| 87. | Lowell | 3.00% | 1.33%(+1.67)#74 | 0.17%(+2.84)#3,767 |
| 88. | Tangelo Park | 2.99% | 0.57%(+2.43)#253 | 0.17%(+2.83)#3,768 |
| 89. | Clinton | 2.99% | 0.71%(+2.28)#18 | 0.17%(+2.82)#3,769 |
| 90. | Somerville | 2.94% | 1.33%(+1.61)#75 | 0.17%(+2.78)#3,770 |
| 91. | Pendleton | 2.89% | 0.10%(+2.78)#-1 | 0.17%(+2.72)#3,771 |
| 92. | Orlando | 2.88% | 0.57%(+2.31)#254 | 0.17%(+2.72)#3,772 |
| 93. | West Yellowstone | 2.88% | 0.025%(+2.85)#-1 | 0.17%(+2.71)#3,773 |
| 94. | Medford | 2.86% | 1.33%(+1.53)#76 | 0.17%(+2.69)#3,774 |
| 95. | Plantation Mobile Home Park | 2.86% | 0.57%(+2.29)#255 | 0.17%(+2.69)#3,775 |
| 96. | Hackberry | 2.76% | 0.085%(+2.68)#95 | 0.17%(+2.59)#3,776 |
| 97. | Peabody | 2.75% | 1.33%(+1.42)#77 | 0.17%(+2.58)#3,777 |
| 98. | South Miami | 2.74% | 0.57%(+2.17)#256 | 0.17%(+2.57)#3,778 |
| 99. | East Burke | 2.73% | 0.052%(+2.68)#0 | 0.17%(+2.56)#3,779 |
| 100. | Silverstreet | 2.72% | 0.10%(+2.62)#0 | 0.17%(+2.55)#3,780 |
Common Questions
What are the Top 10 Cities with the Highest Percentage of Immigrants from Brazil in the United States?
Top 10 Cities with the Highest Percentage of Immigrants from Brazil in the United States are:
#1
15.97%
#2
15.21%
#3
13.92%
#4
13.26%
#5
12.04%
#6
11.77%
#7
11.02%
#8
10.80%
#9
9.90%
#10
9.80%
What city has the Highest Percentage of Immigrants from Brazil in the United States?
Vineyard Haven has the Highest Percentage of Immigrants from Brazil in the United States with 15.97%.
What is the Percentage of Immigrants from Brazil in the United States?
Percentage of Immigrants from Brazil in the United States is 0.17%.