Pennsylvania Map & Demographics
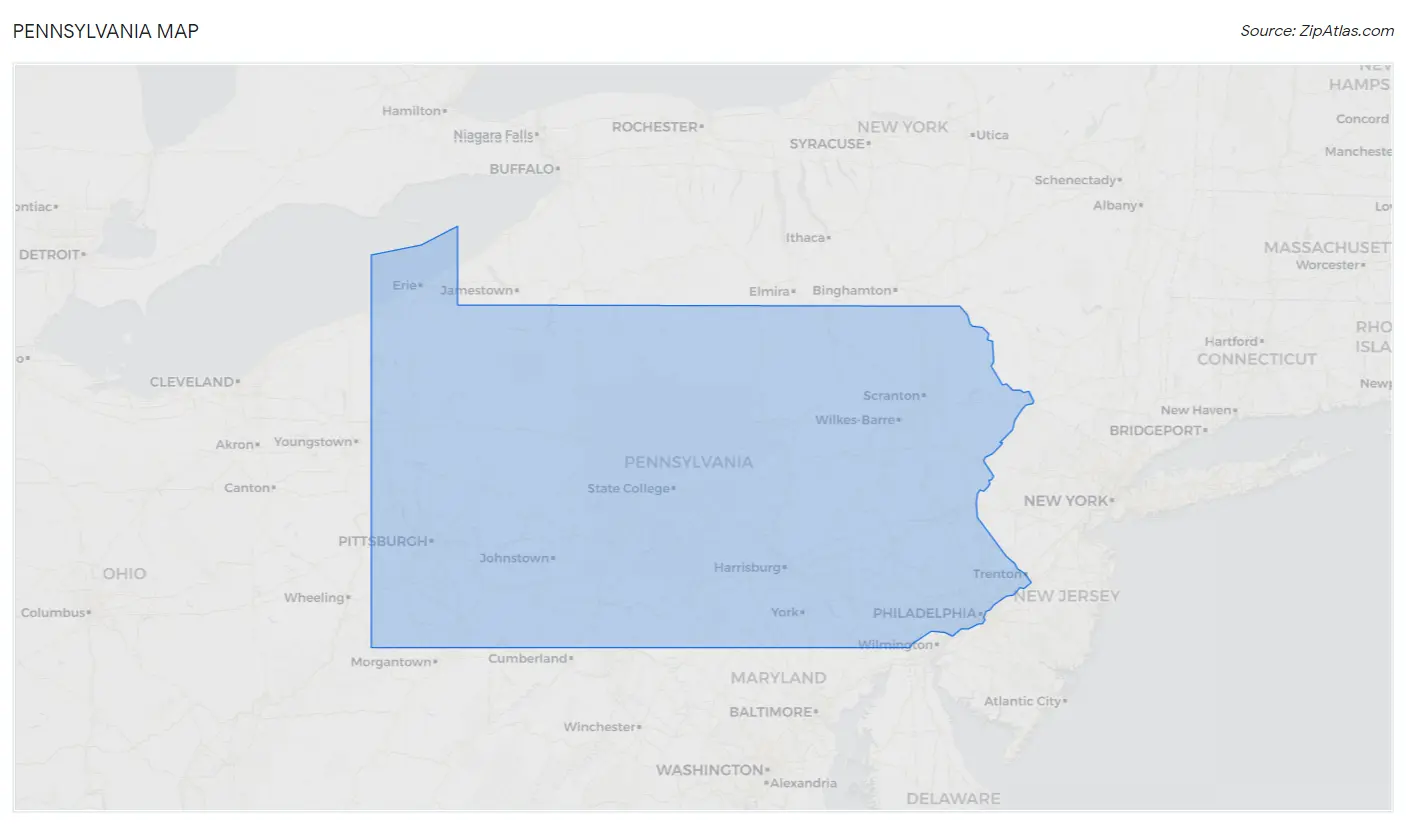
Pennsylvania Map
Pennsylvania Overview
Dec 12, 1787
INCORPORATED
46,055
TOTAL AREA [ SQ MI ]
44,739
LAND AREA [ SQ MI ]
1,316
WATER AREA [ SQ MI ]
1,100
ELEVATION AVG [ FT ]
3,213
ELEVATION HIGH [ FT ]
Sea Level
ELEVATION LOW [ FT ]
290.3
POP DENSITY [ PPL / SQ MI ]
$41,234
PER CAPITA INCOME
$93,685
AVG FAMILY INCOME
$73,170
AVG HOUSEHOLD INCOME
30.8%
WAGE / INCOME GAP [ % ]
69.2¢/ $1
WAGE / INCOME GAP [ $ ]
$10,914
FAMILY INCOME DEFICIT
0.47
INEQUALITY / GINI INDEX
19124
LARGEST ZIP CODE
Philadelphia
LARGEST CITY
Philadelphia County
LARGEST COUNTY
12,989,208
TOTAL POPULATION
6,410,766
MALE POPULATION
6,578,442
FEMALE POPULATION
97.45
MALES / 100 FEMALES
102.62
FEMALES / 100 MALES
40.8
MEDIAN AGE
3.0
AVG FAMILY SIZE
2.4
AVG HOUSEHOLD SIZE
6,691,863
LABOR FORCE [ PEOPLE ]
62.9%
PERCENT IN LABOR FORCE
5.4%
UNEMPLOYMENT RATE
Income in Pennsylvania
Income Overview in Pennsylvania
Per Capita Income in Pennsylvania is $41,234, while median incomes of families and households are $93,685 and $73,170 respectively.
| Characteristic | Number | Measure |
| Per Capita Income | 12,989,208 | $41,234 |
| Median Family Income | 3,277,894 | $93,685 |
| Mean Family Income | 3,277,894 | $121,721 |
| Median Household Income | 5,193,727 | $73,170 |
| Mean Household Income | 5,193,727 | $100,837 |
| Income Deficit | 3,277,894 | $10,914 |
| Wage / Income Gap (%) | 12,989,208 | 30.81% |
| Wage / Income Gap ($) | 12,989,208 | 69.19¢ per $1 |
| Gini / Inequality Index | 12,989,208 | 0.47 |
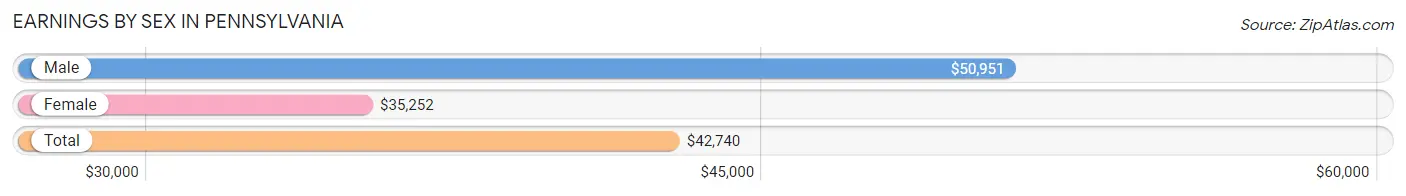
Earnings by Sex in Pennsylvania
Average Earnings in Pennsylvania are $42,740, $50,951 for men and $35,252 for women, a difference of 30.8%.
| Sex | Number | Average Earnings |
| Male | 3,669,571 (52.2%) | $50,951 |
| Female | 3,356,500 (47.8%) | $35,252 |
| Total | 7,026,071 (100.0%) | $42,740 |
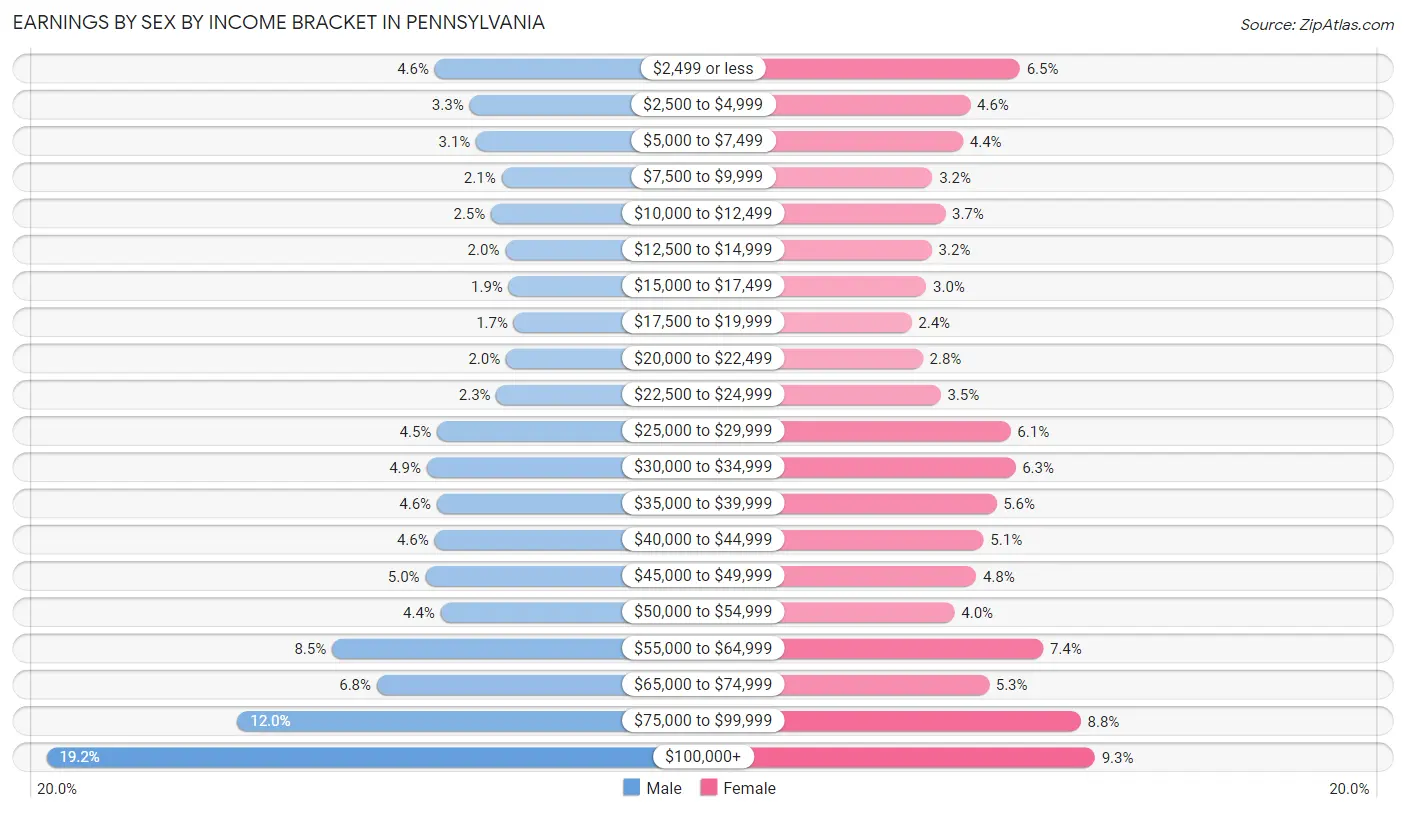
Earnings by Sex by Income Bracket in Pennsylvania
The most common earnings brackets in Pennsylvania are $100,000+ for men (703,727 | 19.2%) and $100,000+ for women (311,660 | 9.3%).
| Income | Male | Female |
| $2,499 or less | 169,744 (4.6%) | 217,521 (6.5%) |
| $2,500 to $4,999 | 122,025 (3.3%) | 155,229 (4.6%) |
| $5,000 to $7,499 | 113,125 (3.1%) | 145,997 (4.3%) |
| $7,500 to $9,999 | 77,997 (2.1%) | 107,336 (3.2%) |
| $10,000 to $12,499 | 92,293 (2.5%) | 123,498 (3.7%) |
| $12,500 to $14,999 | 72,858 (2.0%) | 106,778 (3.2%) |
| $15,000 to $17,499 | 68,222 (1.9%) | 99,788 (3.0%) |
| $17,500 to $19,999 | 61,310 (1.7%) | 81,116 (2.4%) |
| $20,000 to $22,499 | 71,924 (2.0%) | 95,357 (2.8%) |
| $22,500 to $24,999 | 85,208 (2.3%) | 117,744 (3.5%) |
| $25,000 to $29,999 | 166,511 (4.5%) | 205,786 (6.1%) |
| $30,000 to $34,999 | 180,732 (4.9%) | 211,697 (6.3%) |
| $35,000 to $39,999 | 166,986 (4.5%) | 187,909 (5.6%) |
| $40,000 to $44,999 | 170,147 (4.6%) | 171,752 (5.1%) |
| $45,000 to $49,999 | 182,694 (5.0%) | 162,610 (4.8%) |
| $50,000 to $54,999 | 161,937 (4.4%) | 135,187 (4.0%) |
| $55,000 to $64,999 | 311,220 (8.5%) | 246,777 (7.3%) |
| $65,000 to $74,999 | 249,447 (6.8%) | 178,704 (5.3%) |
| $75,000 to $99,999 | 441,464 (12.0%) | 294,054 (8.8%) |
| $100,000+ | 703,727 (19.2%) | 311,660 (9.3%) |
| Total | 3,669,571 (100.0%) | 3,356,500 (100.0%) |
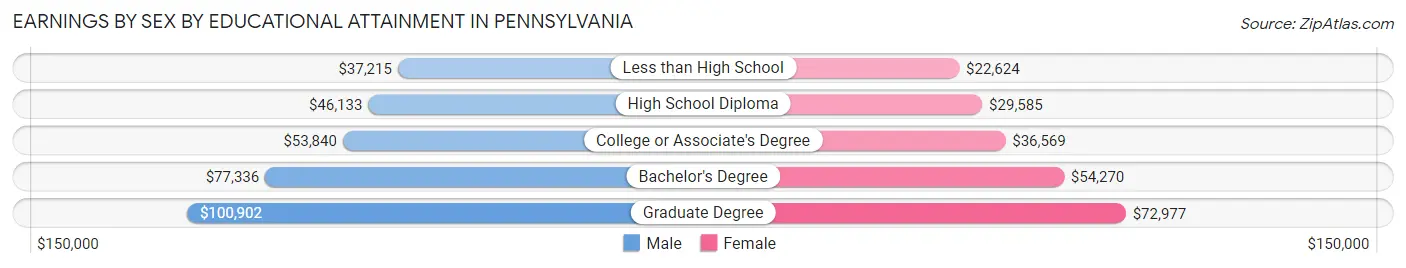
Earnings by Sex by Educational Attainment in Pennsylvania
Average earnings in Pennsylvania are $57,878 for men and $41,404 for women, a difference of 28.5%. Men with an educational attainment of graduate degree enjoy the highest average annual earnings of $100,902, while those with less than high school education earn the least with $37,215. Women with an educational attainment of graduate degree earn the most with the average annual earnings of $72,977, while those with less than high school education have the smallest earnings of $22,624.
| Educational Attainment | Male Income | Female Income |
| Less than High School | $37,215 | $22,624 |
| High School Diploma | $46,133 | $29,585 |
| College or Associate's Degree | $53,840 | $36,569 |
| Bachelor's Degree | $77,336 | $54,270 |
| Graduate Degree | $100,902 | $72,977 |
| Total | $57,878 | $41,404 |
Family Income in Pennsylvania
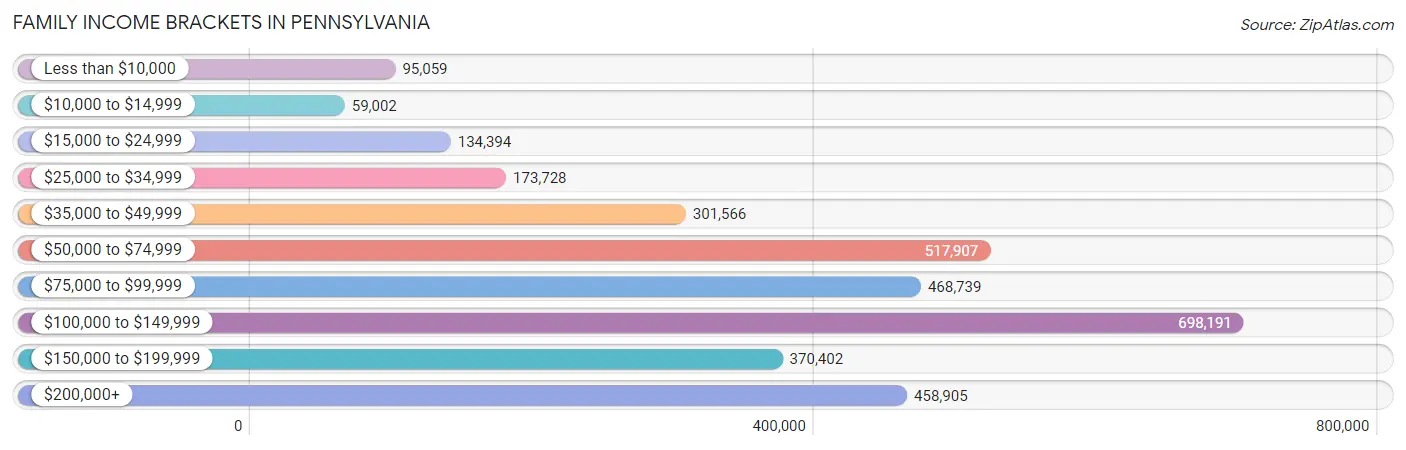
Family Income Brackets in Pennsylvania
According to the Pennsylvania family income data, there are 698,191 families falling into the $100,000 to $149,999 income range, which is the most common income bracket and makes up 21.3% of all families. Conversely, the $10,000 to $14,999 income bracket is the least frequent group with only 59,002 families (1.8%) belonging to this category.
| Income Bracket | # Families | % Families |
| Less than $10,000 | 95,059 | 2.9% |
| $10,000 to $14,999 | 59,002 | 1.8% |
| $15,000 to $24,999 | 134,394 | 4.1% |
| $25,000 to $34,999 | 173,728 | 5.3% |
| $35,000 to $49,999 | 301,566 | 9.2% |
| $50,000 to $74,999 | 517,907 | 15.8% |
| $75,000 to $99,999 | 468,739 | 14.3% |
| $100,000 to $149,999 | 698,191 | 21.3% |
| $150,000 to $199,999 | 370,402 | 11.3% |
| $200,000+ | 458,905 | 14.0% |
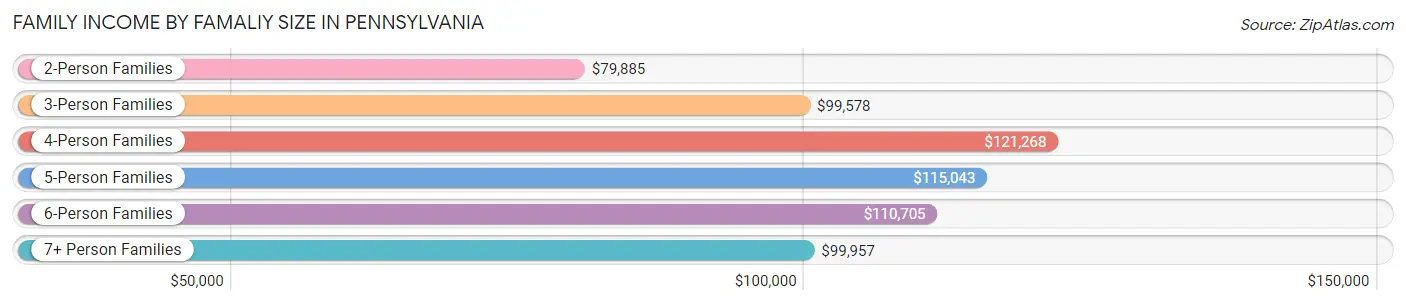
Family Income by Famaliy Size in Pennsylvania
4-person families (567,766 | 17.3%) account for the highest median family income in Pennsylvania with $121,268 per family, while 2-person families (1,614,835 | 49.3%) have the highest median income of $39,942 per family member.
| Income Bracket | # Families | Median Income |
| 2-Person Families | 1,614,835 (49.3%) | $79,885 |
| 3-Person Families | 730,882 (22.3%) | $99,578 |
| 4-Person Families | 567,766 (17.3%) | $121,268 |
| 5-Person Families | 238,080 (7.3%) | $115,043 |
| 6-Person Families | 79,115 (2.4%) | $110,705 |
| 7+ Person Families | 47,216 (1.4%) | $99,957 |
| Total | 3,277,894 (100.0%) | $93,685 |
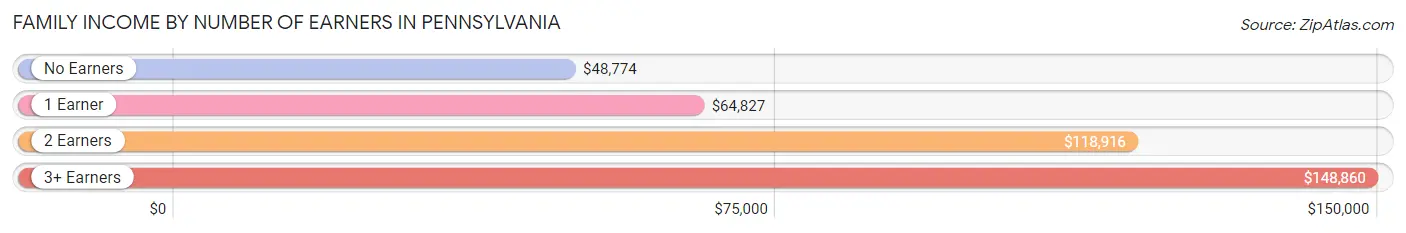
Family Income by Number of Earners in Pennsylvania
The median family income in Pennsylvania is $93,685, with families comprising 3+ earners (406,182) having the highest median family income of $148,860, while families with no earners (512,121) have the lowest median family income of $48,774, accounting for 12.4% and 15.6% of families, respectively.
| Number of Earners | # Families | Median Income |
| No Earners | 512,121 (15.6%) | $48,774 |
| 1 Earner | 995,624 (30.4%) | $64,827 |
| 2 Earners | 1,363,967 (41.6%) | $118,916 |
| 3+ Earners | 406,182 (12.4%) | $148,860 |
| Total | 3,277,894 (100.0%) | $93,685 |
Household Income in Pennsylvania
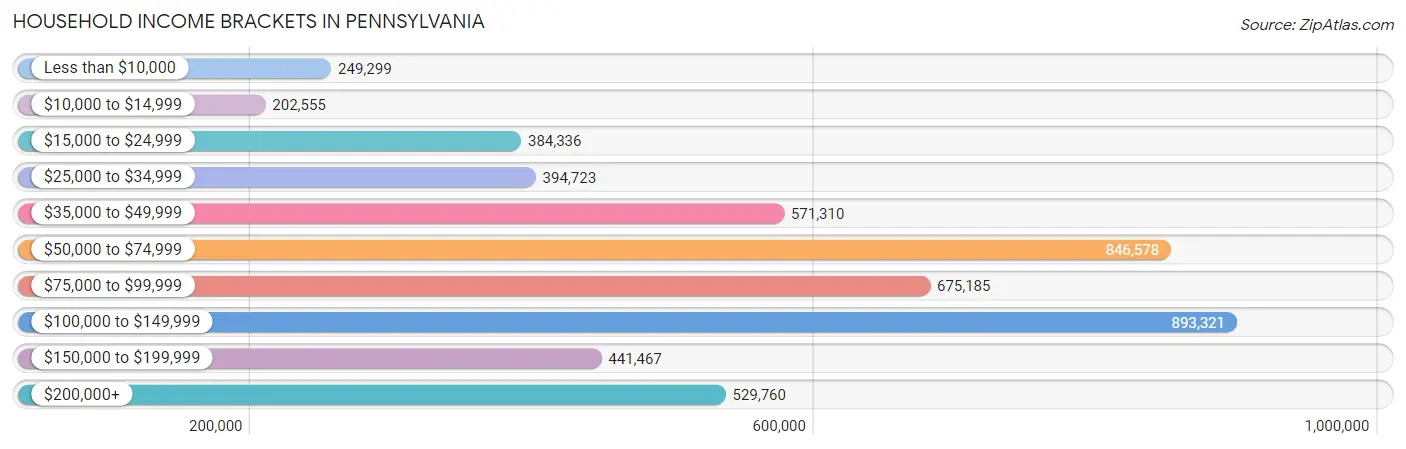
Household Income Brackets in Pennsylvania
With 893,321 households falling in the category, the $100,000 to $149,999 income range is the most frequent in Pennsylvania, accounting for 17.2% of all households. In contrast, only 202,555 households (3.9%) fall into the $10,000 to $14,999 income bracket, making it the least populous group.
| Income Bracket | # Households | % Households |
| Less than $10,000 | 249,299 | 4.8% |
| $10,000 to $14,999 | 202,555 | 3.9% |
| $15,000 to $24,999 | 384,336 | 7.4% |
| $25,000 to $34,999 | 394,723 | 7.6% |
| $35,000 to $49,999 | 571,310 | 11.0% |
| $50,000 to $74,999 | 846,578 | 16.3% |
| $75,000 to $99,999 | 675,185 | 13.0% |
| $100,000 to $149,999 | 893,321 | 17.2% |
| $150,000 to $199,999 | 441,467 | 8.5% |
| $200,000+ | 529,760 | 10.2% |
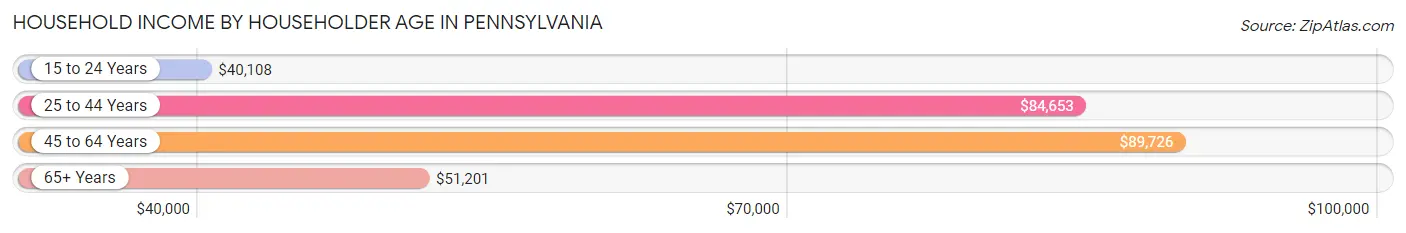
Household Income by Householder Age in Pennsylvania
The median household income in Pennsylvania is $73,170, with the highest median household income of $89,726 found in the 45 to 64 years age bracket for the primary householder. A total of 1,947,108 households (37.5%) fall into this category. Meanwhile, the 15 to 24 years age bracket for the primary householder has the lowest median household income of $40,108, with 157,803 households (3.0%) in this group.
| Income Bracket | # Households | Median Income |
| 15 to 24 Years | 157,803 (3.0%) | $40,108 |
| 25 to 44 Years | 1,561,441 (30.1%) | $84,653 |
| 45 to 64 Years | 1,947,108 (37.5%) | $89,726 |
| 65+ Years | 1,527,375 (29.4%) | $51,201 |
| Total | 5,193,727 (100.0%) | $73,170 |
Poverty in Pennsylvania
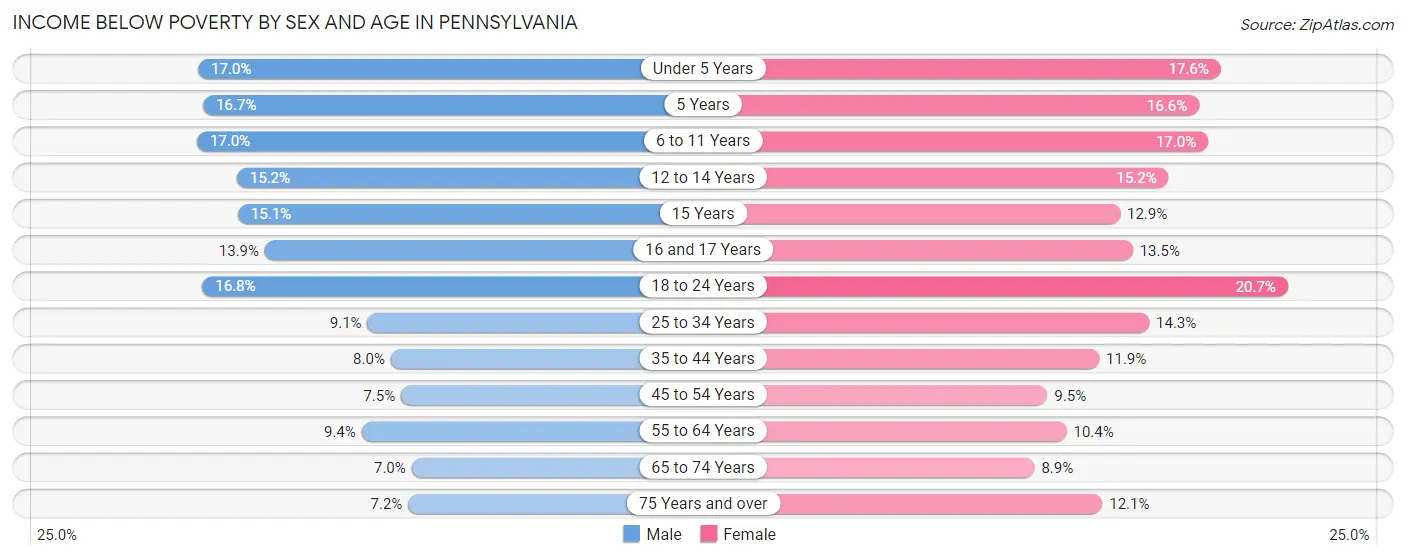
Income Below Poverty by Sex and Age in Pennsylvania
With 10.6% poverty level for males and 12.9% for females among the residents of Pennsylvania, 6 to 11 year old males and 18 to 24 year old females are the most vulnerable to poverty, with 75,885 males (17.0%) and 100,816 females (20.7%) in their respective age groups living below the poverty level.
| Age Bracket | Male | Female |
| Under 5 Years | 58,653 (17.0%) | 58,105 (17.6%) |
| 5 Years | 12,103 (16.7%) | 10,934 (16.6%) |
| 6 to 11 Years | 75,885 (17.0%) | 72,801 (17.0%) |
| 12 to 14 Years | 35,865 (15.1%) | 33,963 (15.2%) |
| 15 Years | 12,585 (15.1%) | 9,868 (12.9%) |
| 16 and 17 Years | 21,898 (13.9%) | 20,582 (13.5%) |
| 18 to 24 Years | 86,106 (16.8%) | 100,816 (20.7%) |
| 25 to 34 Years | 76,397 (9.1%) | 118,143 (14.3%) |
| 35 to 44 Years | 62,014 (8.0%) | 92,641 (11.9%) |
| 45 to 54 Years | 59,652 (7.5%) | 76,074 (9.5%) |
| 55 to 64 Years | 82,449 (9.4%) | 95,705 (10.4%) |
| 65 to 74 Years | 46,233 (7.0%) | 65,109 (8.9%) |
| 75 Years and over | 28,265 (7.2%) | 69,593 (12.1%) |
| Total | 658,105 (10.6%) | 824,334 (12.9%) |
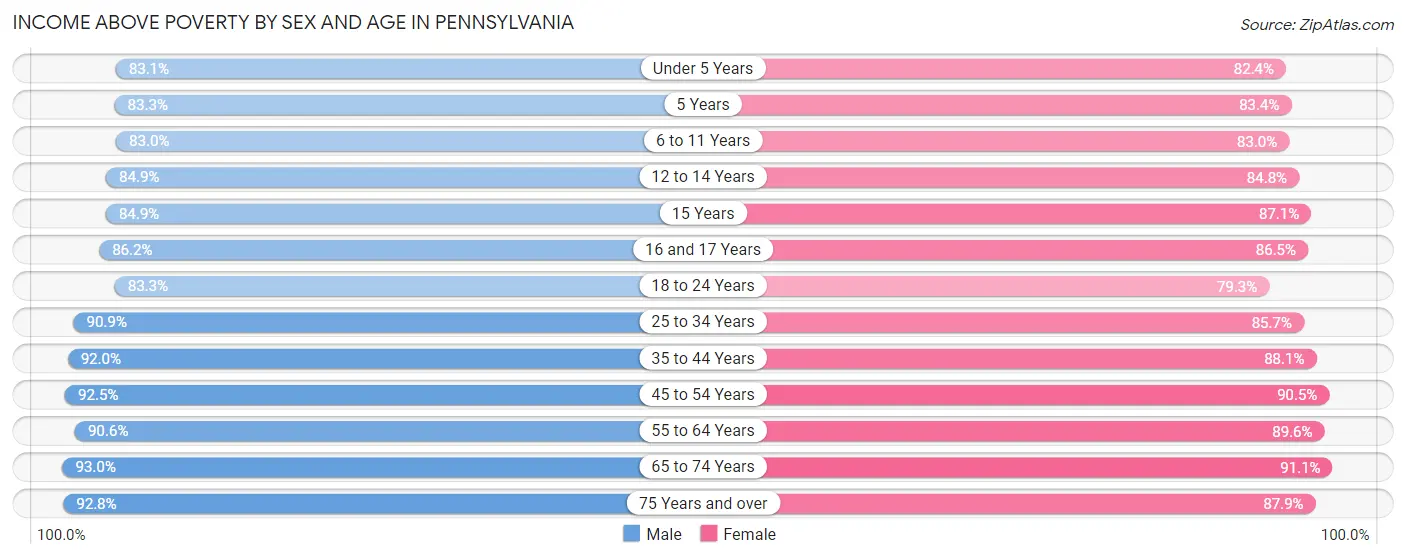
Income Above Poverty by Sex and Age in Pennsylvania
According to the poverty statistics in Pennsylvania, males aged 65 to 74 years and females aged 65 to 74 years are the age groups that are most secure financially, with 93.0% of males and 91.1% of females in these age groups living above the poverty line.
| Age Bracket | Male | Female |
| Under 5 Years | 287,317 (83.1%) | 272,353 (82.4%) |
| 5 Years | 60,271 (83.3%) | 55,026 (83.4%) |
| 6 to 11 Years | 370,387 (83.0%) | 355,605 (83.0%) |
| 12 to 14 Years | 200,834 (84.9%) | 190,023 (84.8%) |
| 15 Years | 70,741 (84.9%) | 66,594 (87.1%) |
| 16 and 17 Years | 136,177 (86.2%) | 131,828 (86.5%) |
| 18 to 24 Years | 427,835 (83.3%) | 386,367 (79.3%) |
| 25 to 34 Years | 763,982 (90.9%) | 710,336 (85.7%) |
| 35 to 44 Years | 712,370 (92.0%) | 682,984 (88.1%) |
| 45 to 54 Years | 732,599 (92.5%) | 721,721 (90.5%) |
| 55 to 64 Years | 798,146 (90.6%) | 822,118 (89.6%) |
| 65 to 74 Years | 610,441 (93.0%) | 663,544 (91.1%) |
| 75 Years and over | 364,070 (92.8%) | 506,017 (87.9%) |
| Total | 5,535,170 (89.4%) | 5,564,516 (87.1%) |
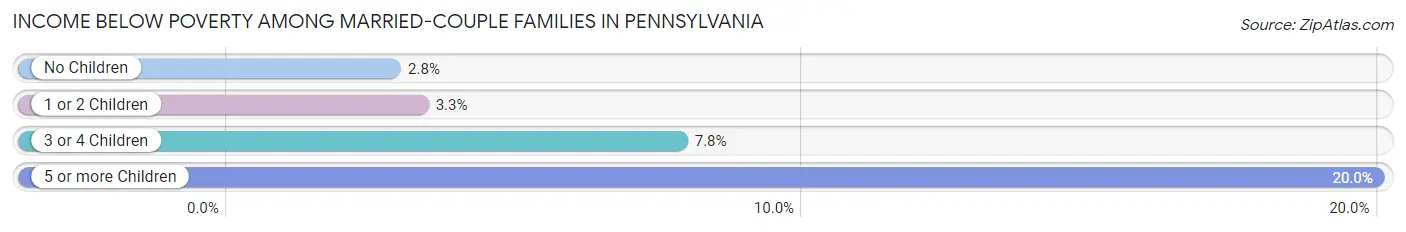
Income Below Poverty Among Married-Couple Families in Pennsylvania
The poverty statistics for married-couple families in Pennsylvania show that 3.5% or 84,169 of the total 2,431,979 families live below the poverty line. Families with 5 or more children have the highest poverty rate of 20.0%, comprising of 3,577 families. On the other hand, families with no children have the lowest poverty rate of 2.8%, which includes 43,002 families.
| Children | Above Poverty | Below Poverty |
| No Children | 1,471,897 (97.2%) | 43,002 (2.8%) |
| 1 or 2 Children | 703,604 (96.7%) | 24,164 (3.3%) |
| 3 or 4 Children | 157,966 (92.2%) | 13,426 (7.8%) |
| 5 or more Children | 14,343 (80.0%) | 3,577 (20.0%) |
| Total | 2,347,810 (96.5%) | 84,169 (3.5%) |
Income Below Poverty Among Single-Parent Households in Pennsylvania
According to the poverty data in Pennsylvania, 12.4% or 29,964 single-father households and 24.5% or 148,051 single-mother households are living below the poverty line. Among single-father households, those with 5 or more children have the highest poverty rate, with 681 households (43.2%) experiencing poverty. Likewise, among single-mother households, those with 5 or more children have the highest poverty rate, with 4,851 households (73.1%) falling below the poverty line.
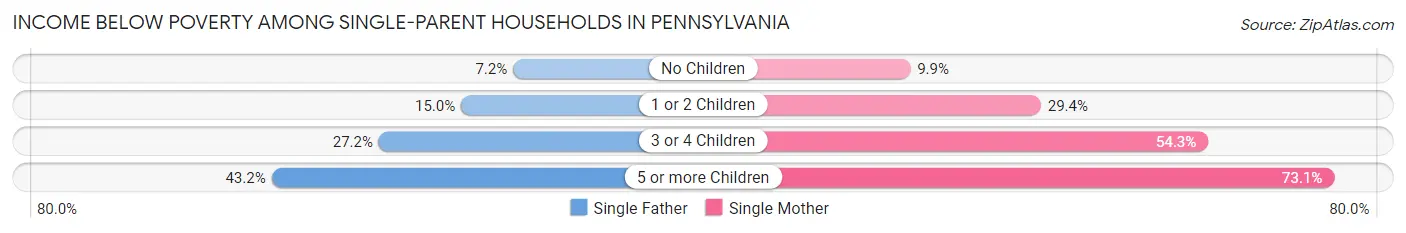
| Children | Single Father | Single Mother |
| No Children | 8,027 (7.2%) | 23,991 (9.9%) |
| 1 or 2 Children | 16,702 (15.0%) | 87,498 (29.4%) |
| 3 or 4 Children | 4,554 (27.2%) | 31,711 (54.3%) |
| 5 or more Children | 681 (43.2%) | 4,851 (73.1%) |
| Total | 29,964 (12.4%) | 148,051 (24.5%) |
Income Below Poverty Among Married-Couple vs Single-Parent Households in Pennsylvania
The poverty data for Pennsylvania shows that 84,169 of the married-couple family households (3.5%) and 178,015 of the single-parent households (21.0%) are living below the poverty level. Within the married-couple family households, those with 5 or more children have the highest poverty rate, with 3,577 households (20.0%) falling below the poverty line. Among the single-parent households, those with 5 or more children have the highest poverty rate, with 5,532 household (67.3%) living below poverty.
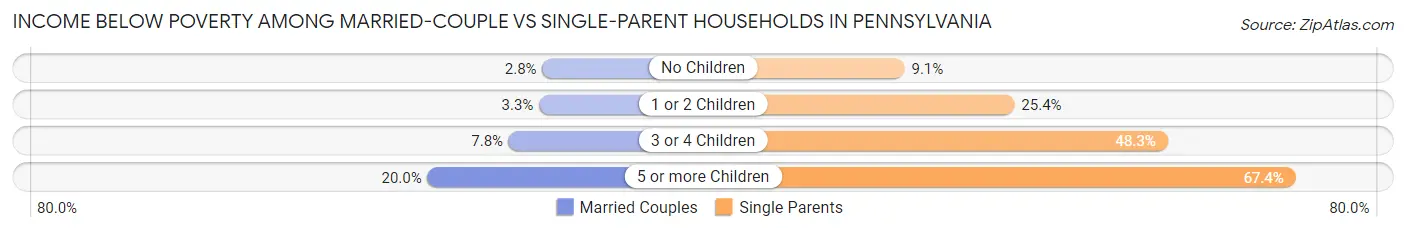
| Children | Married-Couple Families | Single-Parent Households |
| No Children | 43,002 (2.8%) | 32,018 (9.1%) |
| 1 or 2 Children | 24,164 (3.3%) | 104,200 (25.4%) |
| 3 or 4 Children | 13,426 (7.8%) | 36,265 (48.3%) |
| 5 or more Children | 3,577 (20.0%) | 5,532 (67.3%) |
| Total | 84,169 (3.5%) | 178,015 (21.0%) |
Largest Zip Codes by Population in Pennsylvania
The largest zip codes in Pennsylvania by population are 19124 (72,919), 19120 (71,360), 17603 (67,891), 19111 (67,149), and 19143 (63,186).
1.19124
72,919 (0.56%)
2.19120
71,360 (0.55%)
3.17603
67,891 (0.52%)
4.19111
67,149 (0.52%)
5.19143
63,186 (0.49%)
6.19446
60,659 (0.47%)
7.19134
60,229 (0.46%)
8.19149
58,741 (0.45%)
9.19020
56,746 (0.44%)
10.17601
56,164 (0.43%)
11.15601
55,917 (0.43%)
12.19320
55,321 (0.43%)
13.17331
54,942 (0.42%)
14.19140
53,996 (0.42%)
15.19104
53,679 (0.41%)
16.19067
53,320 (0.41%)
17.19382
53,117 (0.41%)
18.18102
51,640 (0.40%)
19.19335
51,126 (0.39%)
20.19380
50,494 (0.39%)
21.19148
50,324 (0.39%)
22.17602
50,184 (0.39%)
23.15301
50,183 (0.39%)
24.18103
48,344 (0.37%)
25.19464
47,913 (0.37%)
26.19144
47,454 (0.37%)
27.15642
46,855 (0.36%)
28.18104
46,259 (0.36%)
29.19139
46,041 (0.35%)
30.17543
45,393 (0.35%)
Largest Cities by Population in Pennsylvania
The largest cities in Pennsylvania by population are Philadelphia (1,593,208), Pittsburgh (303,843), Allentown (125,292), Erie (94,826), and Reading (94,601).
1,593,208 (12.27%)
303,843 (2.34%)
125,292 (0.96%)
4.Erie
94,826 (0.73%)
5.Reading
94,601 (0.73%)
76,555 (0.59%)
7.Scranton
76,119 (0.59%)
57,970 (0.45%)
51,152 (0.39%)
10.Harrisburg
50,055 (0.39%)
11.York
44,782 (0.34%)
12.Wilkes Barre
44,123 (0.34%)
13.Altoona
43,821 (0.34%)
40,902 (0.31%)
35,712 (0.27%)
16.Bethel Park
33,275 (0.26%)
17.Chester
33,048 (0.25%)
18.Hazleton
29,671 (0.23%)
19.Drexel Hill
29,231 (0.23%)
20.Easton
28,883 (0.22%)
21.Monroeville
28,517 (0.22%)
22.Williamsport
27,755 (0.21%)
23.Plum borough
27,032 (0.21%)
24.Lebanon
26,679 (0.21%)
24,423 (0.19%)
23,356 (0.18%)
27.Allison Park
22,701 (0.17%)
21,917 (0.17%)
29.New Castle
21,863 (0.17%)
21,266 (0.16%)
Largest Counties by Population in Pennsylvania
The largest counties in Pennsylvania by population are Philadelphia County (1,593,208), Allegheny County (1,245,310), Montgomery County (856,399), Bucks County (645,163), and Delaware County (575,312).
1,593,208 (12.27%)
1,245,310 (9.59%)
856,399 (6.59%)
645,163 (4.97%)
575,312 (4.43%)
553,202 (4.26%)
536,474 (4.13%)
457,051 (3.52%)
428,483 (3.30%)
374,110 (2.88%)
354,414 (2.73%)
325,396 (2.51%)
314,299 (2.42%)
286,108 (2.20%)
15.Erie County
270,495 (2.08%)
261,269 (2.01%)
215,672 (1.66%)
209,631 (1.61%)
194,562 (1.50%)
168,128 (1.29%)
167,629 (1.29%)
158,665 (1.22%)
156,084 (1.20%)
143,258 (1.10%)
143,201 (1.10%)
133,263 (1.03%)
128,417 (0.99%)
28.Blair County
122,640 (0.94%)
114,022 (0.88%)
110,600 (0.85%)
Race in Pennsylvania
The most populous races in Pennsylvania are White / Caucasian (10,010,379 | 77.1%), Black / African American (1,407,814 | 10.8%), and Hispanic or Latino (1,055,108 | 8.1%).
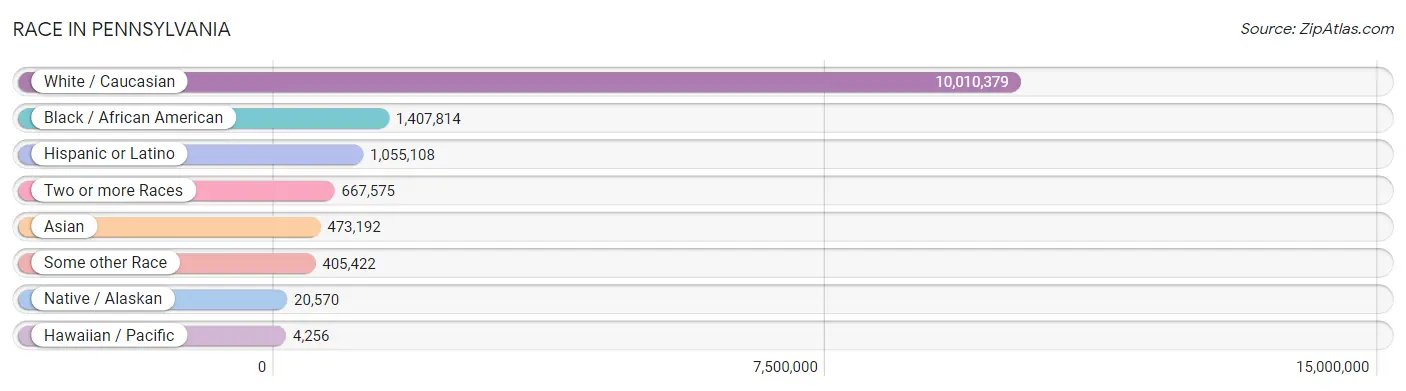
| Race | # Population | % Population |
| Asian | 473,192 | 3.6% |
| Black / African American | 1,407,814 | 10.8% |
| Hawaiian / Pacific | 4,256 | 0.0% |
| Hispanic or Latino | 1,055,108 | 8.1% |
| Native / Alaskan | 20,570 | 0.2% |
| White / Caucasian | 10,010,379 | 77.1% |
| Two or more Races | 667,575 | 5.1% |
| Some other Race | 405,422 | 3.1% |
| Total | 12,989,208 | 100.0% |
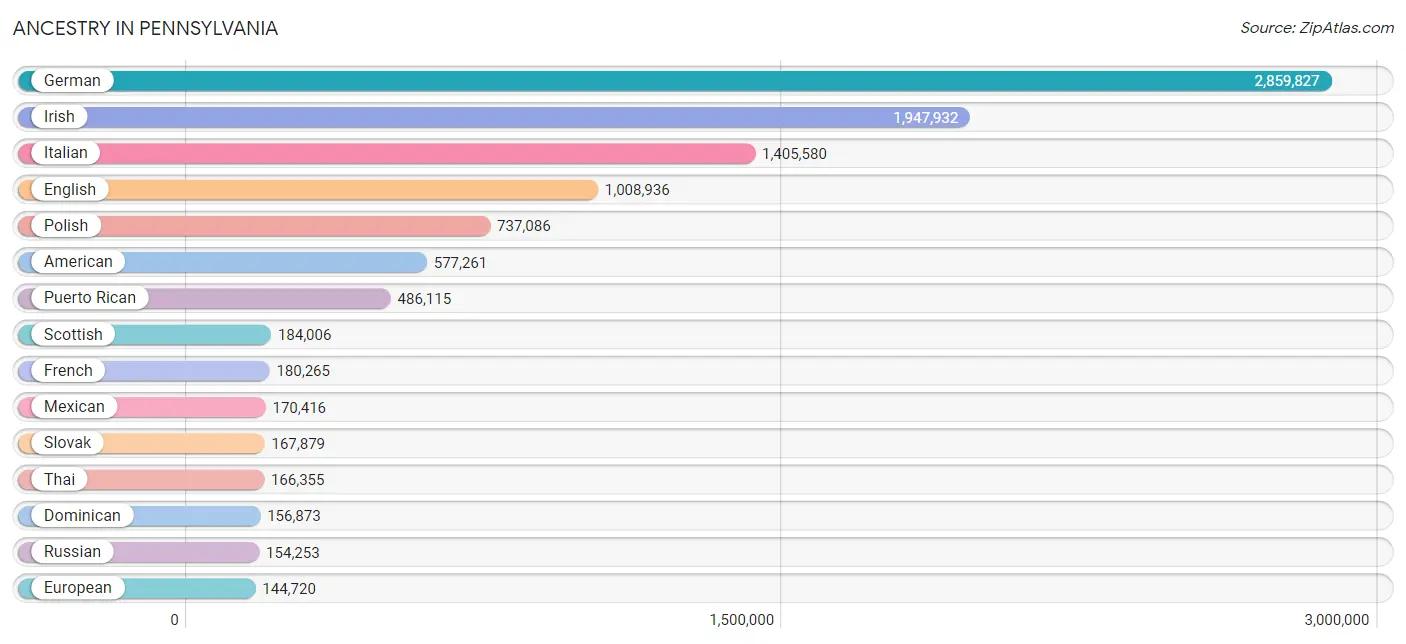
Ancestry in Pennsylvania
The most populous ancestries reported in Pennsylvania are German (2,859,827 | 22.0%), Irish (1,947,932 | 15.0%), Italian (1,405,580 | 10.8%), English (1,008,936 | 7.8%), and Polish (737,086 | 5.7%), together accounting for 61.3% of all Pennsylvania residents.
| Ancestry | # Population | % Population |
| Afghan | 1,852 | 0.0% |
| African | 67,313 | 0.5% |
| Alaska Native | 252 | 0.0% |
| Alaskan Athabascan | 88 | 0.0% |
| Albanian | 10,132 | 0.1% |
| Aleut | 48 | 0.0% |
| Alsatian | 459 | 0.0% |
| American | 577,261 | 4.4% |
| Apache | 1,049 | 0.0% |
| Arab | 77,963 | 0.6% |
| Arapaho | 11 | 0.0% |
| Argentinean | 7,197 | 0.1% |
| Armenian | 9,766 | 0.1% |
| Assyrian / Chaldean / Syriac | 195 | 0.0% |
| Australian | 2,682 | 0.0% |
| Austrian | 44,727 | 0.3% |
| Bahamian | 854 | 0.0% |
| Bangladeshi | 1,880 | 0.0% |
| Barbadian | 2,298 | 0.0% |
| Basque | 746 | 0.0% |
| Belgian | 9,207 | 0.1% |
| Belizean | 910 | 0.0% |
| Bermudan | 528 | 0.0% |
| Bhutanese | 18,192 | 0.1% |
| Blackfeet | 5,361 | 0.0% |
| Bolivian | 1,401 | 0.0% |
| Brazilian | 12,043 | 0.1% |
| British | 51,670 | 0.4% |
| British West Indian | 2,179 | 0.0% |
| Bulgarian | 3,783 | 0.0% |
| Burmese | 51,787 | 0.4% |
| Cajun | 554 | 0.0% |
| Cambodian | 930 | 0.0% |
| Canadian | 13,382 | 0.1% |
| Cape Verdean | 623 | 0.0% |
| Carpatho Rusyn | 2,540 | 0.0% |
| Celtic | 1,398 | 0.0% |
| Central American | 66,817 | 0.5% |
| Central American Indian | 11,574 | 0.1% |
| Cherokee | 22,238 | 0.2% |
| Cheyenne | 154 | 0.0% |
| Chickasaw | 248 | 0.0% |
| Chilean | 4,888 | 0.0% |
| Chinese | 131 | 0.0% |
| Chippewa | 763 | 0.0% |
| Choctaw | 833 | 0.0% |
| Colombian | 28,280 | 0.2% |
| Colville | 5 | 0.0% |
| Comanche | 411 | 0.0% |
| Costa Rican | 4,512 | 0.0% |
| Cree | 85 | 0.0% |
| Creek | 341 | 0.0% |
| Croatian | 43,215 | 0.3% |
| Crow | 131 | 0.0% |
| Cuban | 24,884 | 0.2% |
| Cypriot | 450 | 0.0% |
| Czech | 42,110 | 0.3% |
| Czechoslovakian | 19,939 | 0.2% |
| Danish | 15,778 | 0.1% |
| Delaware | 2,001 | 0.0% |
| Dominican | 156,873 | 1.2% |
| Dutch | 141,012 | 1.1% |
| Dutch West Indian | 130 | 0.0% |
| Eastern European | 61,701 | 0.5% |
| Ecuadorian | 19,521 | 0.2% |
| Egyptian | 11,474 | 0.1% |
| English | 1,008,936 | 7.8% |
| Estonian | 1,049 | 0.0% |
| Ethiopian | 6,761 | 0.1% |
| European | 144,720 | 1.1% |
| Fijian | 104 | 0.0% |
| Filipino | 4,785 | 0.0% |
| Finnish | 7,986 | 0.1% |
| French | 180,265 | 1.4% |
| French American Indian | 631 | 0.0% |
| French Canadian | 23,676 | 0.2% |
| German | 2,859,827 | 22.0% |
| German Russian | 523 | 0.0% |
| Ghanaian | 4,820 | 0.0% |
| Greek | 59,172 | 0.5% |
| Guamanian / Chamorro | 1,276 | 0.0% |
| Guatemalan | 20,886 | 0.2% |
| Guyanese | 3,609 | 0.0% |
| Haitian | 24,452 | 0.2% |
| Hmong | 13 | 0.0% |
| Honduran | 15,790 | 0.1% |
| Hopi | 80 | 0.0% |
| Houma | 162 | 0.0% |
| Hungarian | 112,372 | 0.9% |
| Icelander | 795 | 0.0% |
| Indian (Asian) | 133,991 | 1.0% |
| Indonesian | 2,318 | 0.0% |
| Inupiat | 297 | 0.0% |
| Iranian | 6,922 | 0.1% |
| Iraqi | 2,977 | 0.0% |
| Irish | 1,947,932 | 15.0% |
| Iroquois | 3,149 | 0.0% |
| Israeli | 4,159 | 0.0% |
| Italian | 1,405,580 | 10.8% |
| Jamaican | 38,585 | 0.3% |
| Japanese | 18,688 | 0.1% |
| Jordanian | 1,932 | 0.0% |
| Kenyan | 2,957 | 0.0% |
| Kiowa | 9 | 0.0% |
| Korean | 51,816 | 0.4% |
| Laotian | 5,158 | 0.0% |
| Latvian | 3,030 | 0.0% |
| Lebanese | 22,723 | 0.2% |
| Liberian | 10,832 | 0.1% |
| Lithuanian | 63,027 | 0.5% |
| Lumbee | 741 | 0.0% |
| Luxembourger | 558 | 0.0% |
| Macedonian | 1,317 | 0.0% |
| Malaysian | 4,034 | 0.0% |
| Maltese | 857 | 0.0% |
| Marshallese | 14 | 0.0% |
| Menominee | 35 | 0.0% |
| Mexican | 170,416 | 1.3% |
| Mexican American Indian | 4,631 | 0.0% |
| Mongolian | 1,175 | 0.0% |
| Moroccan | 5,339 | 0.0% |
| Native Hawaiian | 4,990 | 0.0% |
| Navajo | 1,419 | 0.0% |
| New Zealander | 516 | 0.0% |
| Nicaraguan | 3,628 | 0.0% |
| Nigerian | 15,202 | 0.1% |
| Northern European | 10,645 | 0.1% |
| Norwegian | 42,626 | 0.3% |
| Okinawan | 282 | 0.0% |
| Osage | 34 | 0.0% |
| Ottawa | 102 | 0.0% |
| Paiute | 59 | 0.0% |
| Pakistani | 5,889 | 0.1% |
| Palestinian | 3,285 | 0.0% |
| Panamanian | 5,177 | 0.0% |
| Paraguayan | 842 | 0.0% |
| Pennsylvania German | 118,716 | 0.9% |
| Peruvian | 13,374 | 0.1% |
| Pima | 165 | 0.0% |
| Polish | 737,086 | 5.7% |
| Portuguese | 21,255 | 0.2% |
| Potawatomi | 280 | 0.0% |
| Pueblo | 24 | 0.0% |
| Puerto Rican | 486,115 | 3.7% |
| Puget Sound Salish | 19 | 0.0% |
| Romanian | 17,592 | 0.1% |
| Russian | 154,253 | 1.2% |
| Salvadoran | 16,525 | 0.1% |
| Samoan | 1,490 | 0.0% |
| Scandinavian | 17,031 | 0.1% |
| Scotch-Irish | 125,419 | 1.0% |
| Scottish | 184,006 | 1.4% |
| Seminole | 641 | 0.0% |
| Senegalese | 699 | 0.0% |
| Serbian | 17,292 | 0.1% |
| Shoshone | 180 | 0.0% |
| Sierra Leonean | 2,805 | 0.0% |
| Sioux | 1,975 | 0.0% |
| Slavic | 13,570 | 0.1% |
| Slovak | 167,879 | 1.3% |
| Slovene | 14,087 | 0.1% |
| Somali | 1,046 | 0.0% |
| South African | 2,193 | 0.0% |
| South American | 86,105 | 0.7% |
| South American Indian | 1,593 | 0.0% |
| Soviet Union | 242 | 0.0% |
| Spaniard | 15,684 | 0.1% |
| Spanish | 13,198 | 0.1% |
| Spanish American | 452 | 0.0% |
| Spanish American Indian | 208 | 0.0% |
| Sri Lankan | 51,748 | 0.4% |
| Subsaharan African | 128,301 | 1.0% |
| Sudanese | 1,058 | 0.0% |
| Swedish | 90,662 | 0.7% |
| Swiss | 68,348 | 0.5% |
| Syrian | 15,682 | 0.1% |
| Taiwanese | 160 | 0.0% |
| Thai | 166,355 | 1.3% |
| Tlingit-Haida | 130 | 0.0% |
| Tohono O'Odham | 31 | 0.0% |
| Tongan | 310 | 0.0% |
| Trinidadian and Tobagonian | 8,298 | 0.1% |
| Turkish | 8,626 | 0.1% |
| U.S. Virgin Islander | 880 | 0.0% |
| Ugandan | 713 | 0.0% |
| Ukrainian | 104,028 | 0.8% |
| Uruguayan | 1,797 | 0.0% |
| Ute | 82 | 0.0% |
| Venezuelan | 8,009 | 0.1% |
| Vietnamese | 7,121 | 0.1% |
| Welsh | 139,964 | 1.1% |
| West Indian | 10,676 | 0.1% |
| Yakama | 44 | 0.0% |
| Yaqui | 87 | 0.0% |
| Yugoslavian | 9,564 | 0.1% |
| Yup'ik | 11 | 0.0% |
| Zimbabwean | 287 | 0.0% | View All 197 Rows |
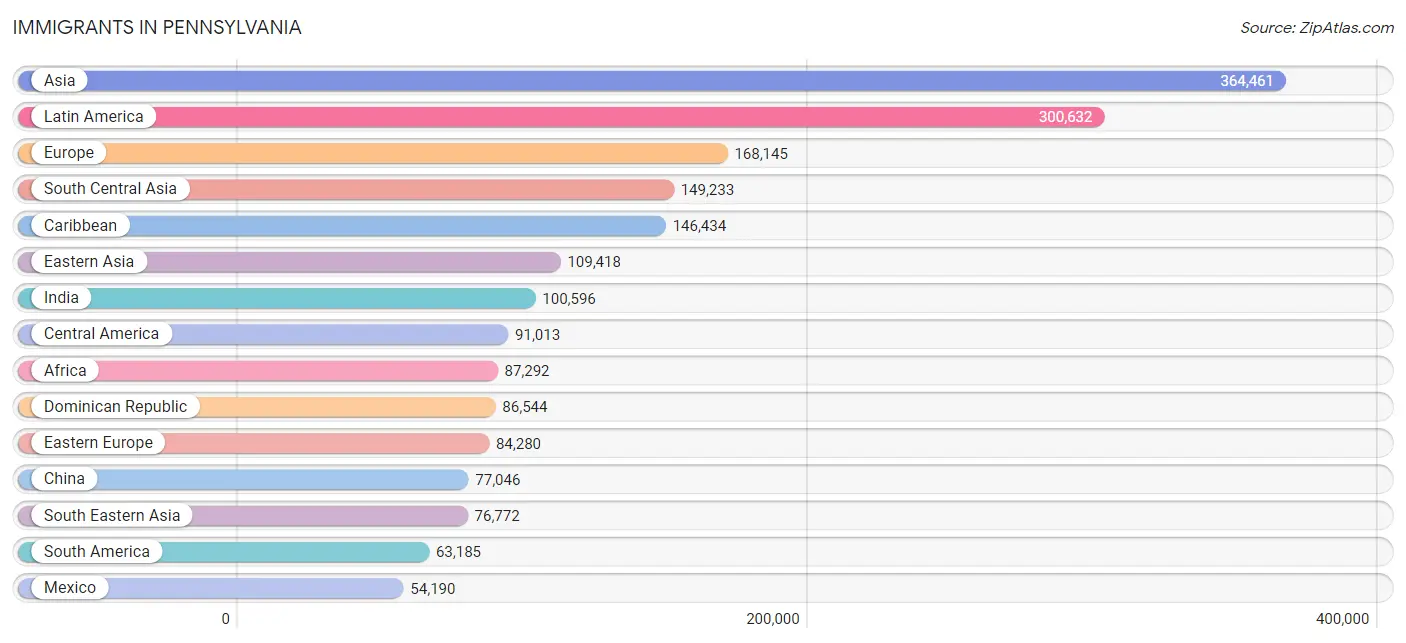
Immigrants in Pennsylvania
The most numerous immigrant groups reported in Pennsylvania came from Asia (364,461 | 2.8%), Latin America (300,632 | 2.3%), Europe (168,145 | 1.3%), South Central Asia (149,233 | 1.1%), and Caribbean (146,434 | 1.1%), together accounting for 8.7% of all Pennsylvania residents.
| Immigration Origin | # Population | % Population |
| Afghanistan | 1,467 | 0.0% |
| Africa | 87,292 | 0.7% |
| Albania | 6,351 | 0.1% |
| Argentina | 4,113 | 0.0% |
| Armenia | 466 | 0.0% |
| Asia | 364,461 | 2.8% |
| Australia | 2,506 | 0.0% |
| Austria | 1,152 | 0.0% |
| Azores | 233 | 0.0% |
| Bahamas | 564 | 0.0% |
| Bangladesh | 8,772 | 0.1% |
| Barbados | 1,292 | 0.0% |
| Belarus | 4,068 | 0.0% |
| Belgium | 699 | 0.0% |
| Belize | 579 | 0.0% |
| Bolivia | 1,010 | 0.0% |
| Bosnia and Herzegovina | 3,273 | 0.0% |
| Brazil | 13,077 | 0.1% |
| Bulgaria | 2,319 | 0.0% |
| Cabo Verde | 42 | 0.0% |
| Cambodia | 9,386 | 0.1% |
| Cameroon | 2,325 | 0.0% |
| Canada | 17,032 | 0.1% |
| Caribbean | 146,434 | 1.1% |
| Central America | 91,013 | 0.7% |
| Chile | 2,470 | 0.0% |
| China | 77,046 | 0.6% |
| Colombia | 13,823 | 0.1% |
| Congo | 731 | 0.0% |
| Costa Rica | 3,132 | 0.0% |
| Croatia | 750 | 0.0% |
| Cuba | 6,036 | 0.1% |
| Czechoslovakia | 1,916 | 0.0% |
| Denmark | 649 | 0.0% |
| Dominica | 2,729 | 0.0% |
| Dominican Republic | 86,544 | 0.7% |
| Eastern Africa | 15,890 | 0.1% |
| Eastern Asia | 109,418 | 0.8% |
| Eastern Europe | 84,280 | 0.6% |
| Ecuador | 10,035 | 0.1% |
| Egypt | 7,272 | 0.1% |
| El Salvador | 7,727 | 0.1% |
| England | 9,205 | 0.1% |
| Eritrea | 554 | 0.0% |
| Ethiopia | 4,658 | 0.0% |
| Europe | 168,145 | 1.3% |
| Fiji | 98 | 0.0% |
| France | 4,424 | 0.0% |
| Germany | 18,065 | 0.1% |
| Ghana | 5,368 | 0.0% |
| Greece | 5,438 | 0.0% |
| Grenada | 842 | 0.0% |
| Guatemala | 13,268 | 0.1% |
| Guyana | 4,519 | 0.0% |
| Haiti | 15,224 | 0.1% |
| Honduras | 8,463 | 0.1% |
| Hong Kong | 3,245 | 0.0% |
| Hungary | 2,267 | 0.0% |
| India | 100,596 | 0.8% |
| Indonesia | 3,736 | 0.0% |
| Iran | 4,204 | 0.0% |
| Iraq | 2,395 | 0.0% |
| Ireland | 4,198 | 0.0% |
| Israel | 3,416 | 0.0% |
| Italy | 16,884 | 0.1% |
| Jamaica | 22,612 | 0.2% |
| Japan | 4,648 | 0.0% |
| Jordan | 1,981 | 0.0% |
| Kazakhstan | 1,124 | 0.0% |
| Kenya | 4,946 | 0.0% |
| Korea | 27,433 | 0.2% |
| Kuwait | 707 | 0.0% |
| Laos | 2,153 | 0.0% |
| Latin America | 300,632 | 2.3% |
| Latvia | 550 | 0.0% |
| Lebanon | 2,601 | 0.0% |
| Liberia | 12,910 | 0.1% |
| Lithuania | 908 | 0.0% |
| Malaysia | 1,902 | 0.0% |
| Mexico | 54,190 | 0.4% |
| Micronesia | 56 | 0.0% |
| Middle Africa | 5,179 | 0.0% |
| Moldova | 1,138 | 0.0% |
| Morocco | 4,483 | 0.0% |
| Nepal | 6,855 | 0.1% |
| Netherlands | 2,004 | 0.0% |
| Nicaragua | 1,752 | 0.0% |
| Nigeria | 10,709 | 0.1% |
| North Macedonia | 290 | 0.0% |
| Northern Africa | 16,849 | 0.1% |
| Northern Europe | 28,221 | 0.2% |
| Norway | 582 | 0.0% |
| Oceania | 3,690 | 0.0% |
| Pakistan | 11,211 | 0.1% |
| Panama | 1,902 | 0.0% |
| Peru | 6,690 | 0.1% |
| Philippines | 21,039 | 0.2% |
| Poland | 12,172 | 0.1% |
| Portugal | 3,185 | 0.0% |
| Romania | 5,598 | 0.0% |
| Russia | 15,272 | 0.1% |
| Saudi Arabia | 2,533 | 0.0% |
| Scotland | 1,747 | 0.0% |
| Senegal | 449 | 0.0% |
| Serbia | 924 | 0.0% |
| Sierra Leone | 3,949 | 0.0% |
| Singapore | 826 | 0.0% |
| Somalia | 712 | 0.0% |
| South Africa | 2,787 | 0.0% |
| South America | 63,185 | 0.5% |
| South Central Asia | 149,233 | 1.1% |
| South Eastern Asia | 76,772 | 0.6% |
| Southern Europe | 28,264 | 0.2% |
| Spain | 2,635 | 0.0% |
| Sri Lanka | 1,144 | 0.0% |
| St. Vincent and the Grenadines | 687 | 0.0% |
| Sudan | 1,563 | 0.0% |
| Sweden | 1,115 | 0.0% |
| Switzerland | 826 | 0.0% |
| Syria | 5,121 | 0.0% |
| Taiwan | 6,097 | 0.1% |
| Thailand | 4,593 | 0.0% |
| Trinidad and Tobago | 7,224 | 0.1% |
| Turkey | 4,441 | 0.0% |
| Uganda | 1,139 | 0.0% |
| Ukraine | 19,841 | 0.2% |
| Uruguay | 1,061 | 0.0% |
| Uzbekistan | 4,491 | 0.0% |
| Venezuela | 5,742 | 0.0% |
| Vietnam | 31,542 | 0.2% |
| West Indies | 797 | 0.0% |
| Western Africa | 40,910 | 0.3% |
| Western Asia | 27,662 | 0.2% |
| Western Europe | 27,213 | 0.2% |
| Yemen | 231 | 0.0% |
| Zaire | 1,033 | 0.0% |
| Zimbabwe | 662 | 0.0% | View All 137 Rows |
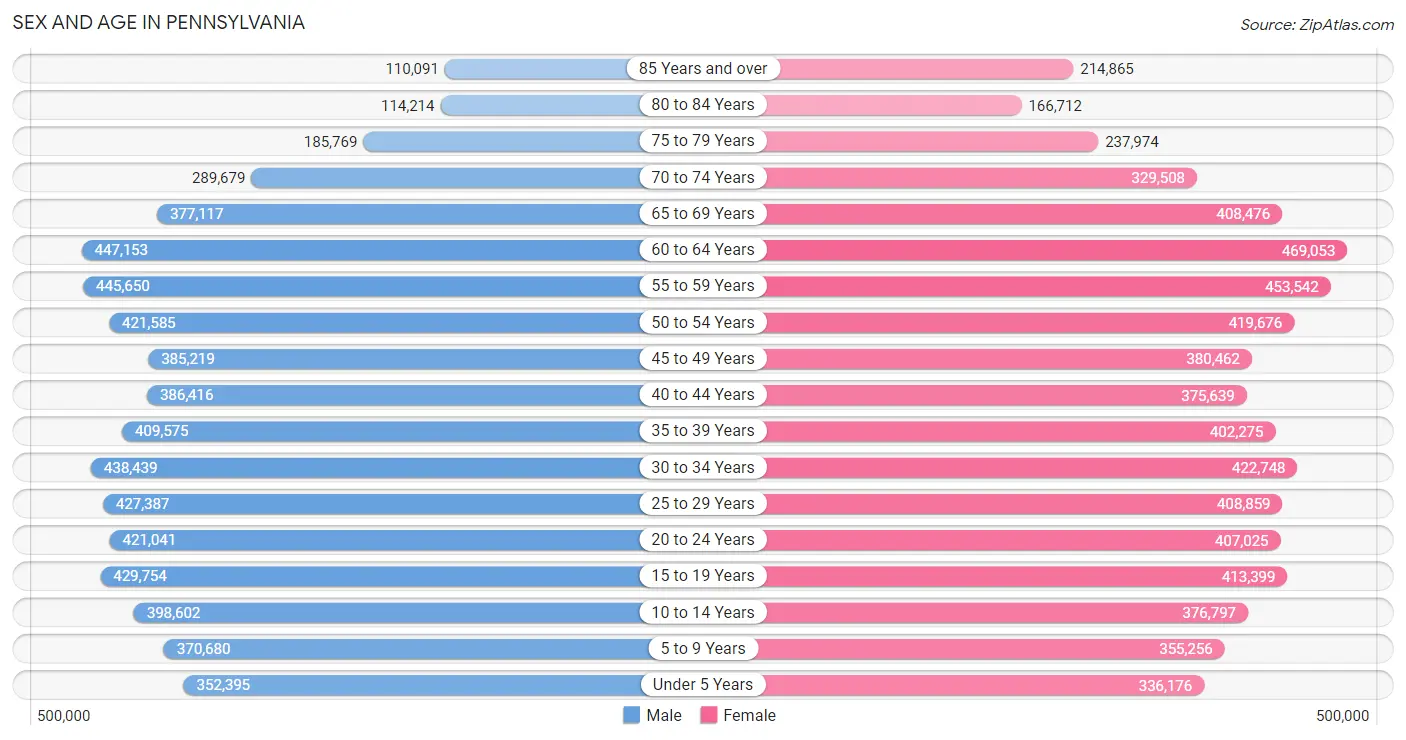
Sex and Age in Pennsylvania
Sex and Age in Pennsylvania
The most populous age groups in Pennsylvania are 60 to 64 Years (447,153 | 7.0%) for men and 60 to 64 Years (469,053 | 7.1%) for women.
| Age Bracket | Male | Female |
| Under 5 Years | 352,395 (5.5%) | 336,176 (5.1%) |
| 5 to 9 Years | 370,680 (5.8%) | 355,256 (5.4%) |
| 10 to 14 Years | 398,602 (6.2%) | 376,797 (5.7%) |
| 15 to 19 Years | 429,754 (6.7%) | 413,399 (6.3%) |
| 20 to 24 Years | 421,041 (6.6%) | 407,025 (6.2%) |
| 25 to 29 Years | 427,387 (6.7%) | 408,859 (6.2%) |
| 30 to 34 Years | 438,439 (6.8%) | 422,748 (6.4%) |
| 35 to 39 Years | 409,575 (6.4%) | 402,275 (6.1%) |
| 40 to 44 Years | 386,416 (6.0%) | 375,639 (5.7%) |
| 45 to 49 Years | 385,219 (6.0%) | 380,462 (5.8%) |
| 50 to 54 Years | 421,585 (6.6%) | 419,676 (6.4%) |
| 55 to 59 Years | 445,650 (7.0%) | 453,542 (6.9%) |
| 60 to 64 Years | 447,153 (7.0%) | 469,053 (7.1%) |
| 65 to 69 Years | 377,117 (5.9%) | 408,476 (6.2%) |
| 70 to 74 Years | 289,679 (4.5%) | 329,508 (5.0%) |
| 75 to 79 Years | 185,769 (2.9%) | 237,974 (3.6%) |
| 80 to 84 Years | 114,214 (1.8%) | 166,712 (2.5%) |
| 85 Years and over | 110,091 (1.7%) | 214,865 (3.3%) |
| Total | 6,410,766 (100.0%) | 6,578,442 (100.0%) |
Families and Households in Pennsylvania
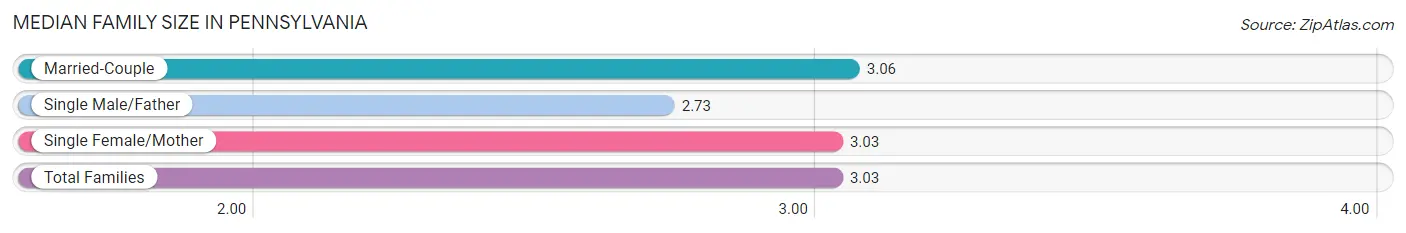
Median Family Size in Pennsylvania
The median family size in Pennsylvania is 3.03 persons per family, with married-couple families (2,431,979 | 74.2%) accounting for the largest median family size of 3.06 persons per family. On the other hand, single male/father families (241,054 | 7.3%) represent the smallest median family size with 2.73 persons per family.
| Family Type | # Families | Family Size |
| Married-Couple | 2,431,979 (74.2%) | 3.06 |
| Single Male/Father | 241,054 (7.3%) | 2.73 |
| Single Female/Mother | 604,861 (18.4%) | 3.03 |
| Total Families | 3,277,894 (100.0%) | 3.03 |
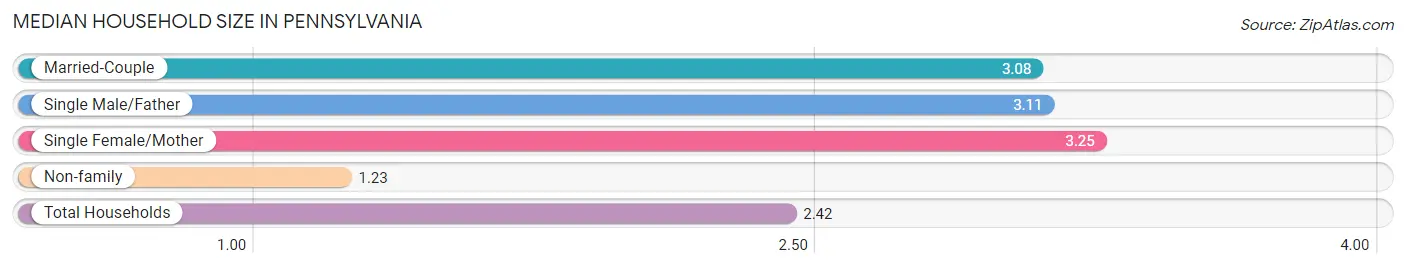
Median Household Size in Pennsylvania
The median household size in Pennsylvania is 2.42 persons per household, with single female/mother households (604,861 | 11.7%) accounting for the largest median household size of 3.25 persons per household. non-family households (1,915,833 | 36.9%) represent the smallest median household size with 1.23 persons per household.
| Household Type | # Households | Household Size |
| Married-Couple | 2,431,979 (46.8%) | 3.08 |
| Single Male/Father | 241,054 (4.6%) | 3.11 |
| Single Female/Mother | 604,861 (11.7%) | 3.25 |
| Non-family | 1,915,833 (36.9%) | 1.23 |
| Total Households | 5,193,727 (100.0%) | 2.42 |
Household Size by Marriage Status in Pennsylvania
Out of a total of 5,193,727 households in Pennsylvania, 3,277,894 (63.1%) are family households, while 1,915,833 (36.9%) are nonfamily households. The most numerous type of family households are 2-person households, comprising 1,517,282, and the most common type of nonfamily households are 1-person households, comprising 1,571,675.
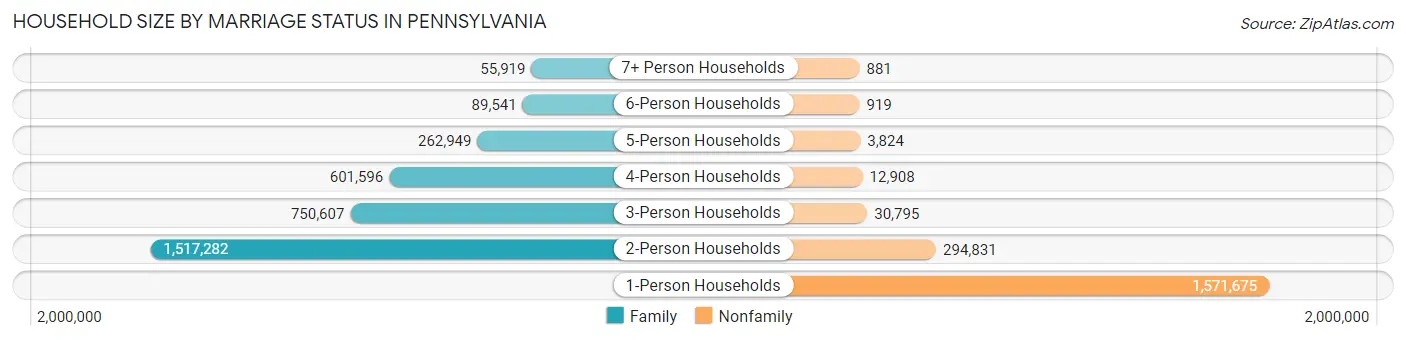
| Household Size | Family Households | Nonfamily Households |
| 1-Person Households | - | 1,571,675 (30.3%) |
| 2-Person Households | 1,517,282 (29.2%) | 294,831 (5.7%) |
| 3-Person Households | 750,607 (14.4%) | 30,795 (0.6%) |
| 4-Person Households | 601,596 (11.6%) | 12,908 (0.3%) |
| 5-Person Households | 262,949 (5.1%) | 3,824 (0.1%) |
| 6-Person Households | 89,541 (1.7%) | 919 (0.0%) |
| 7+ Person Households | 55,919 (1.1%) | 881 (0.0%) |
| Total | 3,277,894 (63.1%) | 1,915,833 (36.9%) |
Female Fertility in Pennsylvania
Fertility by Age in Pennsylvania
Average fertility rate in Pennsylvania is 51.0 births per 1,000 women. Women in the age bracket of 20 to 34 years have the highest fertility rate with 85.0 births per 1,000 women. Women in the age bracket of 20 to 34 years acount for 72.0% of all women with births.
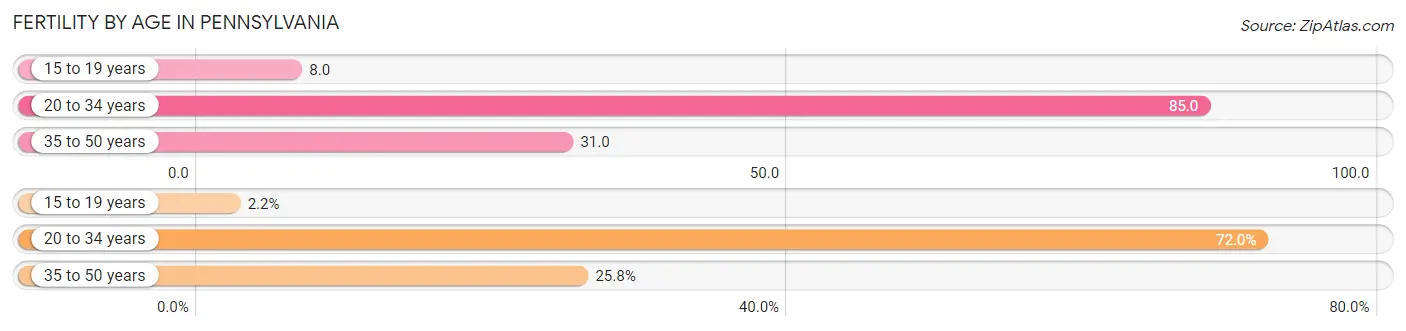
| Age Bracket | Women with Births | Births / 1,000 Women |
| 15 to 19 years | 3,251 (2.2%) | 8.0 |
| 20 to 34 years | 105,546 (72.0%) | 85.0 |
| 35 to 50 years | 37,866 (25.8%) | 31.0 |
| Total | 146,663 (100.0%) | 51.0 |
Fertility by Age by Marriage Status in Pennsylvania
67.4% of women with births (146,663) in Pennsylvania are married. The highest percentage of unmarried women with births falls into 15 to 19 years age bracket with 93.0% of them unmarried at the time of birth, while the lowest percentage of unmarried women with births belong to 35 to 50 years age bracket with 19.9% of them unmarried.
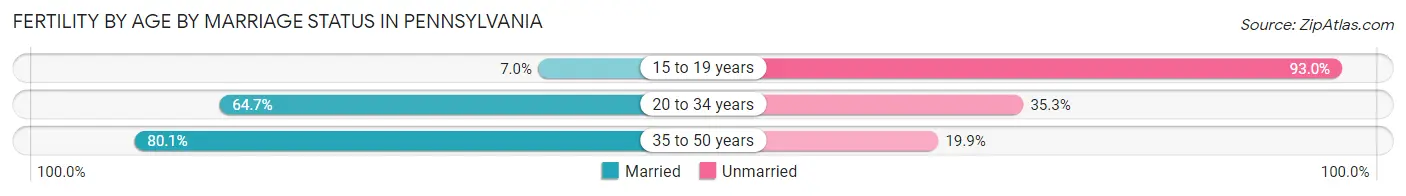
| Age Bracket | Married | Unmarried |
| 15 to 19 years | 228 (7.0%) | 3,023 (93.0%) |
| 20 to 34 years | 68,288 (64.7%) | 37,258 (35.3%) |
| 35 to 50 years | 30,331 (80.1%) | 7,535 (19.9%) |
| Total | 98,851 (67.4%) | 47,812 (32.6%) |
Fertility by Education in Pennsylvania
Average fertility rate in Pennsylvania is 51.0 births per 1,000 women. Women with the education attainment of graduate degree have the highest fertility rate of 65.0 births per 1,000 women, while women with the education attainment of less than high school have the lowest fertility at 34.0 births per 1,000 women. Women with the education attainment of college or associate's degree represent 25.7% of all women with births.
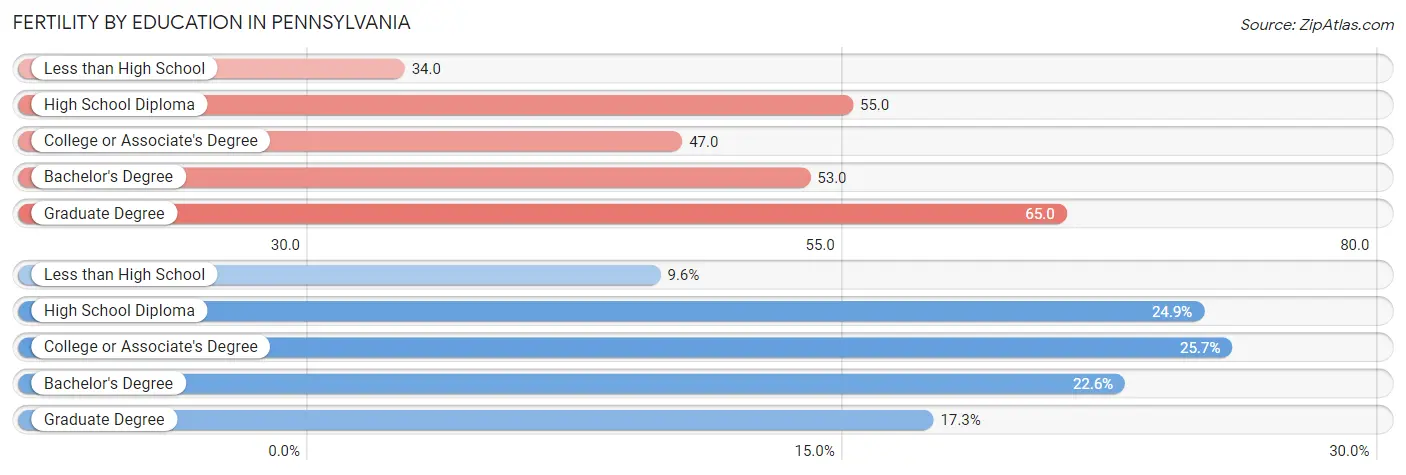
| Educational Attainment | Women with Births | Births / 1,000 Women |
| Less than High School | 14,064 (9.6%) | 34.0 |
| High School Diploma | 36,457 (24.9%) | 55.0 |
| College or Associate's Degree | 37,626 (25.7%) | 47.0 |
| Bachelor's Degree | 33,201 (22.6%) | 53.0 |
| Graduate Degree | 25,315 (17.3%) | 65.0 |
| Total | 146,663 (100.0%) | 51.0 |
Fertility by Education by Marriage Status in Pennsylvania
32.6% of women with births in Pennsylvania are unmarried. Women with the educational attainment of graduate degree are most likely to be married with 91.2% of them married at childbirth, while women with the educational attainment of high school diploma are least likely to be married with 56.7% of them unmarried at childbirth.
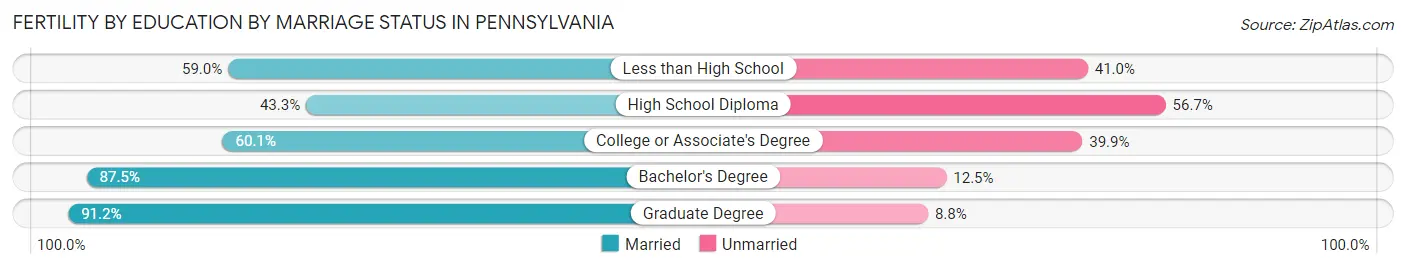
| Educational Attainment | Married | Unmarried |
| Less than High School | 8,298 (59.0%) | 5,766 (41.0%) |
| High School Diploma | 15,786 (43.3%) | 20,671 (56.7%) |
| College or Associate's Degree | 22,613 (60.1%) | 15,013 (39.9%) |
| Bachelor's Degree | 29,051 (87.5%) | 4,150 (12.5%) |
| Graduate Degree | 23,087 (91.2%) | 2,228 (8.8%) |
| Total | 98,851 (67.4%) | 47,812 (32.6%) |
Employment Characteristics in Pennsylvania
Employment by Class of Employer in Pennsylvania
Among the 6,200,303 employed individuals in Pennsylvania, private company employees (4,228,930 | 68.2%), not-for-profit organizations (770,375 | 12.4%), and local government employees (371,285 | 6.0%) make up the most common classes of employment.
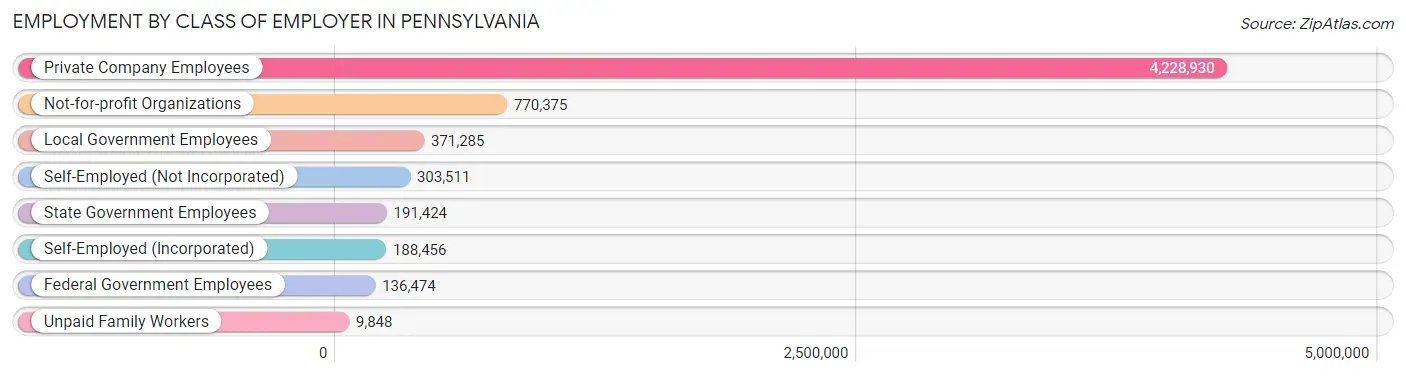
| Employer Class | # Employees | % Employees |
| Private Company Employees | 4,228,930 | 68.2% |
| Self-Employed (Incorporated) | 188,456 | 3.0% |
| Self-Employed (Not Incorporated) | 303,511 | 4.9% |
| Not-for-profit Organizations | 770,375 | 12.4% |
| Local Government Employees | 371,285 | 6.0% |
| State Government Employees | 191,424 | 3.1% |
| Federal Government Employees | 136,474 | 2.2% |
| Unpaid Family Workers | 9,848 | 0.2% |
| Total | 6,200,303 | 100.0% |
Employment Status by Age in Pennsylvania
According to the labor force statistics for Pennsylvania, out of the total population over 16 years of age (10,638,892), 62.9% or 6,691,863 individuals are in the labor force, with 5.4% or 361,361 of them unemployed. The age group with the highest labor force participation rate is 25 to 29 years, with 85.1% or 711,645 individuals in the labor force. Within the labor force, the 16 to 19 years age range has the highest percentage of unemployed individuals, with 14.2% or 41,494 of them being unemployed.
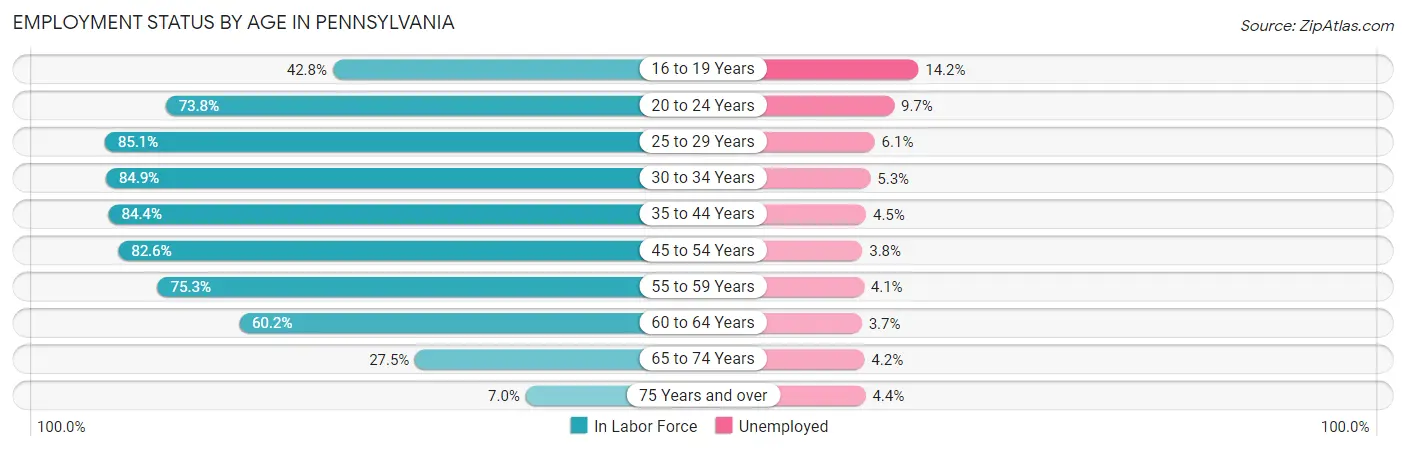
| Age Bracket | In Labor Force | Unemployed |
| 16 to 19 Years | 292,214 (42.8%) | 41,494 (14.2%) |
| 20 to 24 Years | 611,113 (73.8%) | 59,278 (9.7%) |
| 25 to 29 Years | 711,645 (85.1%) | 43,410 (6.1%) |
| 30 to 34 Years | 731,148 (84.9%) | 38,751 (5.3%) |
| 35 to 44 Years | 1,328,376 (84.4%) | 59,777 (4.5%) |
| 45 to 54 Years | 1,327,334 (82.6%) | 50,439 (3.8%) |
| 55 to 59 Years | 677,092 (75.3%) | 27,761 (4.1%) |
| 60 to 64 Years | 551,556 (60.2%) | 20,408 (3.7%) |
| 65 to 74 Years | 386,314 (27.5%) | 16,225 (4.2%) |
| 75 Years and over | 72,074 (7.0%) | 3,171 (4.4%) |
| Total | 6,691,863 (62.9%) | 361,361 (5.4%) |
Employment Status by Educational Attainment in Pennsylvania
According to labor force statistics for Pennsylvania, 79.6% of individuals (5,328,168) out of the total population between 25 and 64 years of age (6,693,678) are in the labor force, with 4.5% or 239,768 of them being unemployed. The group with the highest labor force participation rate are those with the educational attainment of bachelor's degree or higher, with 88.8% or 2,168,377 individuals in the labor force. Within the labor force, individuals with less than high school education have the highest percentage of unemployment, with 8.4% or 23,269 of them being unemployed.
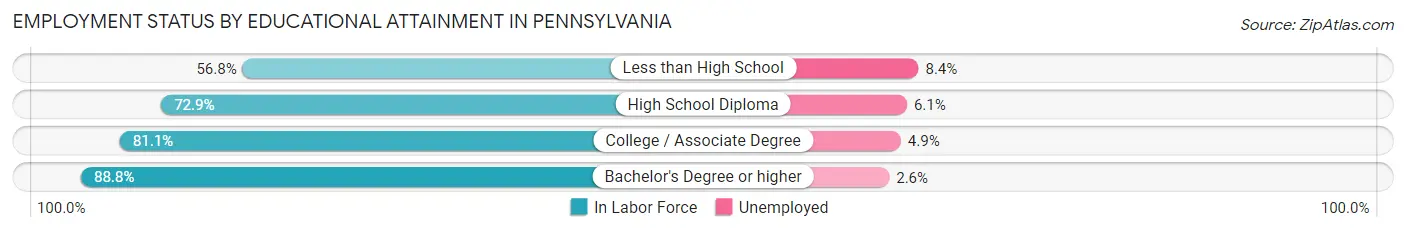
| Educational Attainment | In Labor Force | Unemployed |
| Less than High School | 277,010 (56.8%) | 40,966 (8.4%) |
| High School Diploma | 1,496,767 (72.9%) | 125,244 (6.1%) |
| College / Associate Degree | 1,387,572 (81.1%) | 83,836 (4.9%) |
| Bachelor's Degree or higher | 2,168,377 (88.8%) | 63,489 (2.6%) |
| Total | 5,328,168 (79.6%) | 301,216 (4.5%) |
Employment Occupations by Sex in Pennsylvania
Management, Business, Science and Arts Occupations
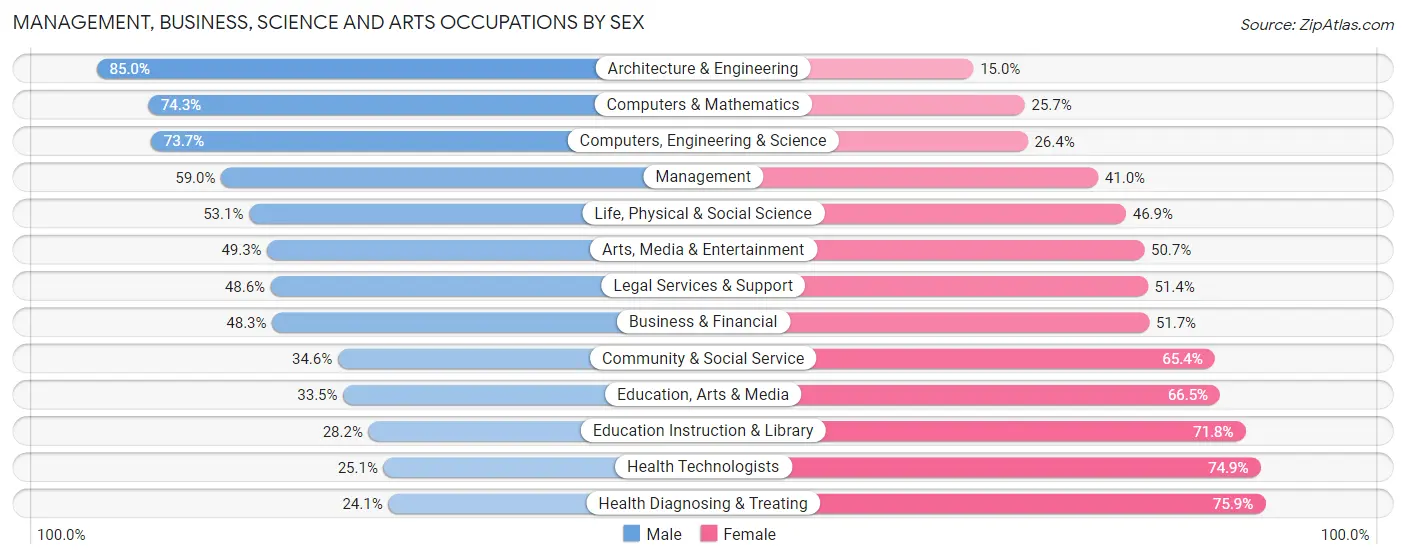
The most common Management, Business, Science and Arts occupations in Pennsylvania are Community & Social Service (706,560 | 11.2%), Management (658,606 | 10.4%), Health Diagnosing & Treating (464,724 | 7.3%), Computers, Engineering & Science (413,467 | 6.5%), and Education Instruction & Library (390,075 | 6.2%).

Management, Business, Science and Arts Occupations by Sex
Within the Management, Business, Science and Arts occupations in Pennsylvania, the most male-oriented occupations are Architecture & Engineering (85.0%), Computers & Mathematics (74.3%), and Computers, Engineering & Science (73.7%), while the most female-oriented occupations are Health Diagnosing & Treating (75.9%), Health Technologists (74.9%), and Education Instruction & Library (71.8%).
| Occupation | Male | Female |
| Management | 388,331 (59.0%) | 270,275 (41.0%) |
| Business & Financial | 180,017 (48.3%) | 192,582 (51.7%) |
| Computers, Engineering & Science | 304,531 (73.7%) | 108,936 (26.4%) |
| Computers & Mathematics | 153,824 (74.3%) | 53,316 (25.7%) |
| Architecture & Engineering | 109,641 (85.0%) | 19,400 (15.0%) |
| Life, Physical & Social Science | 41,066 (53.1%) | 36,220 (46.9%) |
| Community & Social Service | 244,601 (34.6%) | 461,959 (65.4%) |
| Education, Arts & Media | 44,599 (33.5%) | 88,501 (66.5%) |
| Legal Services & Support | 35,270 (48.6%) | 37,267 (51.4%) |
| Education Instruction & Library | 110,037 (28.2%) | 280,038 (71.8%) |
| Arts, Media & Entertainment | 54,695 (49.3%) | 56,153 (50.7%) |
| Health Diagnosing & Treating | 111,935 (24.1%) | 352,789 (75.9%) |
| Health Technologists | 79,764 (25.1%) | 238,306 (74.9%) |
| Total (Category) | 1,229,415 (47.0%) | 1,386,541 (53.0%) |
| Total (Overall) | 3,304,082 (52.3%) | 3,017,929 (47.7%) |
Services Occupations
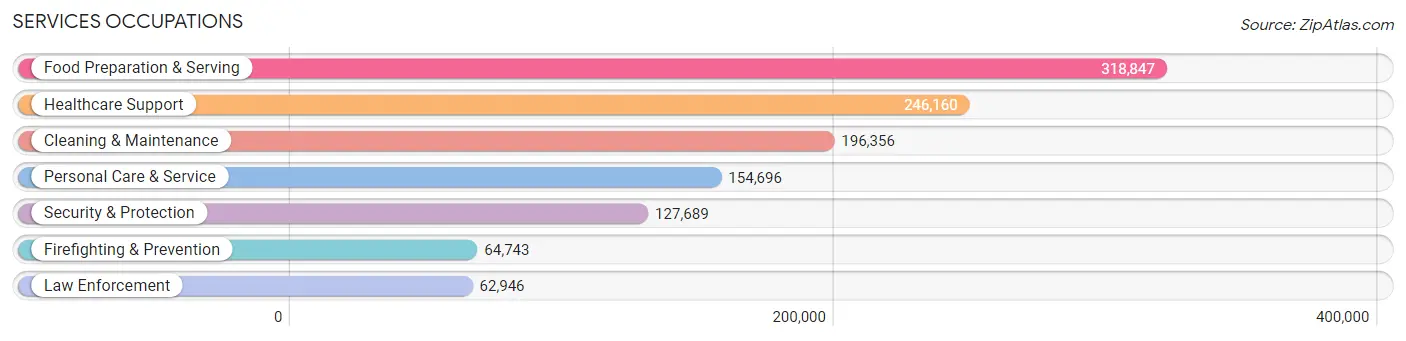
The most common Services occupations in Pennsylvania are Food Preparation & Serving (318,847 | 5.0%), Healthcare Support (246,160 | 3.9%), Cleaning & Maintenance (196,356 | 3.1%), Personal Care & Service (154,696 | 2.5%), and Security & Protection (127,689 | 2.0%).
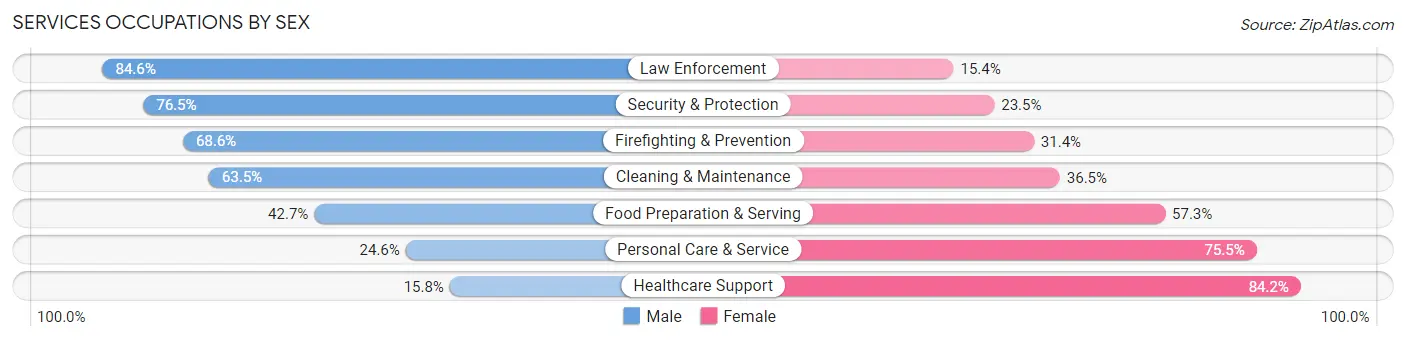
Services Occupations by Sex
Within the Services occupations in Pennsylvania, the most male-oriented occupations are Law Enforcement (84.6%), Security & Protection (76.5%), and Firefighting & Prevention (68.6%), while the most female-oriented occupations are Healthcare Support (84.2%), Personal Care & Service (75.4%), and Food Preparation & Serving (57.3%).
| Occupation | Male | Female |
| Healthcare Support | 38,935 (15.8%) | 207,225 (84.2%) |
| Security & Protection | 97,667 (76.5%) | 30,022 (23.5%) |
| Firefighting & Prevention | 44,439 (68.6%) | 20,304 (31.4%) |
| Law Enforcement | 53,228 (84.6%) | 9,718 (15.4%) |
| Food Preparation & Serving | 136,009 (42.7%) | 182,838 (57.3%) |
| Cleaning & Maintenance | 124,688 (63.5%) | 71,668 (36.5%) |
| Personal Care & Service | 37,975 (24.5%) | 116,721 (75.4%) |
| Total (Category) | 435,274 (41.7%) | 608,474 (58.3%) |
| Total (Overall) | 3,304,082 (52.3%) | 3,017,929 (47.7%) |
Sales and Office Occupations
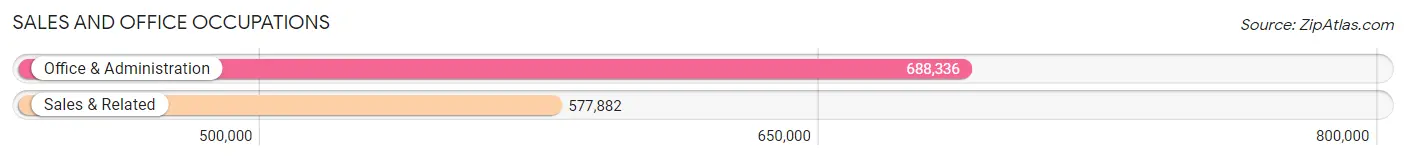
The most common Sales and Office occupations in Pennsylvania are Office & Administration (688,336 | 10.9%), and Sales & Related (577,882 | 9.1%).
Sales and Office Occupations by Sex
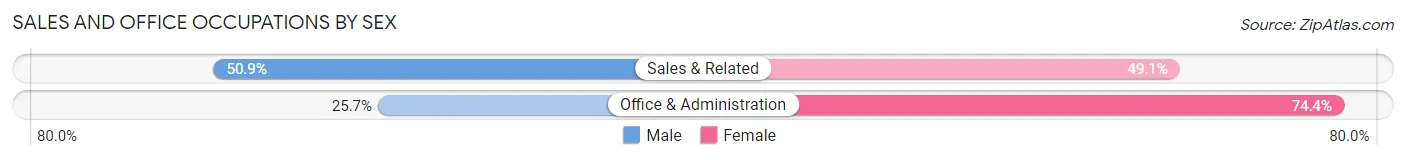
| Occupation | Male | Female |
| Sales & Related | 294,242 (50.9%) | 283,640 (49.1%) |
| Office & Administration | 176,558 (25.7%) | 511,778 (74.4%) |
| Total (Category) | 470,800 (37.2%) | 795,418 (62.8%) |
| Total (Overall) | 3,304,082 (52.3%) | 3,017,929 (47.7%) |
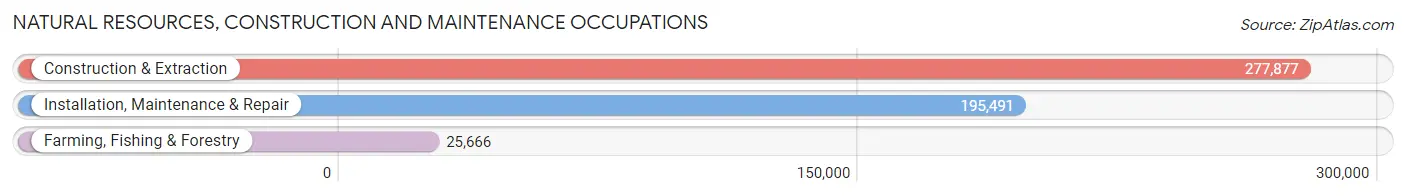
Natural Resources, Construction and Maintenance Occupations
The most common Natural Resources, Construction and Maintenance occupations in Pennsylvania are Construction & Extraction (277,877 | 4.4%), Installation, Maintenance & Repair (195,491 | 3.1%), and Farming, Fishing & Forestry (25,666 | 0.4%).
Natural Resources, Construction and Maintenance Occupations by Sex
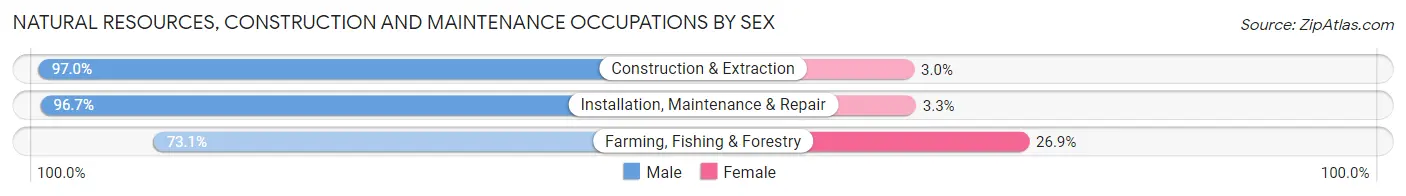
| Occupation | Male | Female |
| Farming, Fishing & Forestry | 18,766 (73.1%) | 6,900 (26.9%) |
| Construction & Extraction | 269,649 (97.0%) | 8,228 (3.0%) |
| Installation, Maintenance & Repair | 188,995 (96.7%) | 6,496 (3.3%) |
| Total (Category) | 477,410 (95.7%) | 21,624 (4.3%) |
| Total (Overall) | 3,304,082 (52.3%) | 3,017,929 (47.7%) |
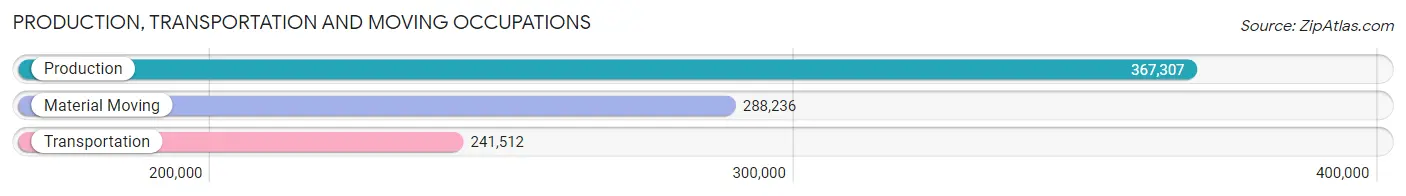
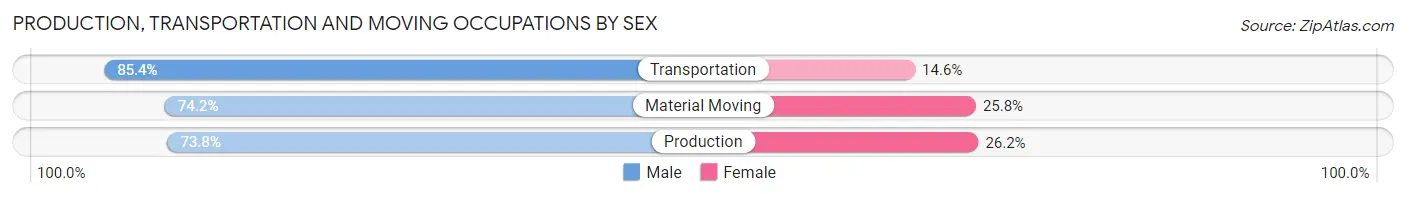
Production, Transportation and Moving Occupations
The most common Production, Transportation and Moving occupations in Pennsylvania are Production (367,307 | 5.8%), Material Moving (288,236 | 4.6%), and Transportation (241,512 | 3.8%).
Production, Transportation and Moving Occupations by Sex
| Occupation | Male | Female |
| Production | 270,985 (73.8%) | 96,322 (26.2%) |
| Transportation | 206,219 (85.4%) | 35,293 (14.6%) |
| Material Moving | 213,979 (74.2%) | 74,257 (25.8%) |
| Total (Category) | 691,183 (77.0%) | 205,872 (23.0%) |
| Total (Overall) | 3,304,082 (52.3%) | 3,017,929 (47.7%) |
Employment Industries by Sex in Pennsylvania
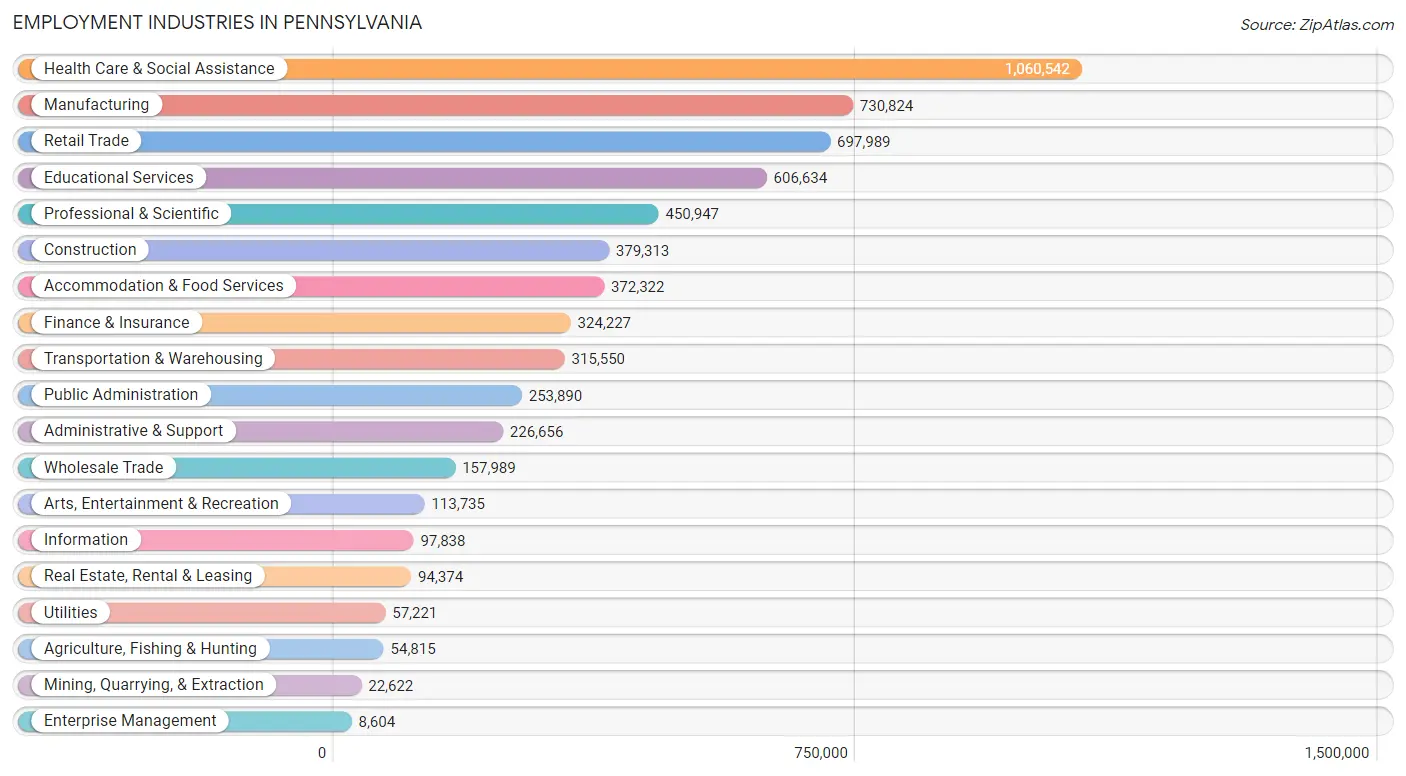
Employment Industries in Pennsylvania
The major employment industries in Pennsylvania include Health Care & Social Assistance (1,060,542 | 16.8%), Manufacturing (730,824 | 11.6%), Retail Trade (697,989 | 11.0%), Educational Services (606,634 | 9.6%), and Professional & Scientific (450,947 | 7.1%).
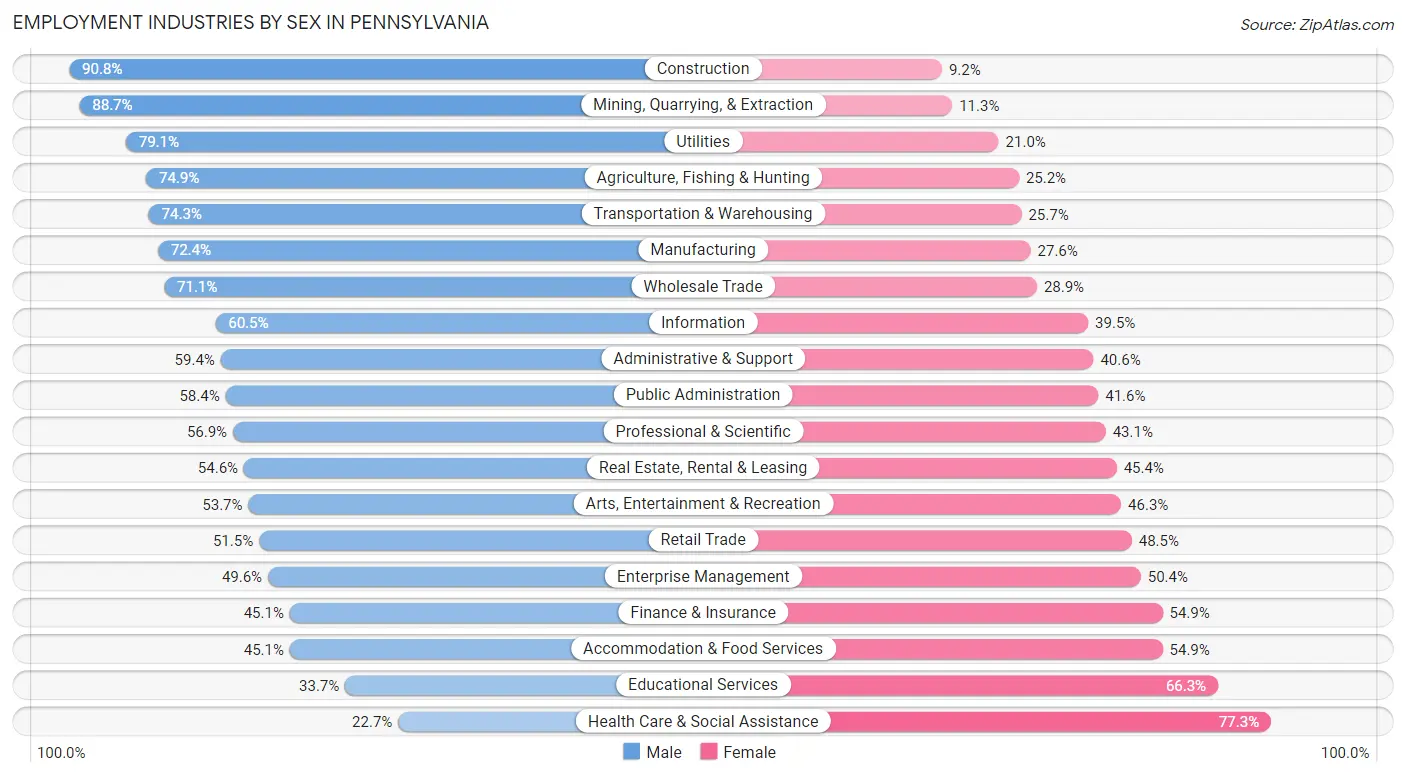
Employment Industries by Sex in Pennsylvania
The Pennsylvania industries that see more men than women are Construction (90.8%), Mining, Quarrying, & Extraction (88.7%), and Utilities (79.0%), whereas the industries that tend to have a higher number of women are Health Care & Social Assistance (77.3%), Educational Services (66.3%), and Accommodation & Food Services (54.9%).
| Industry | Male | Female |
| Agriculture, Fishing & Hunting | 41,031 (74.9%) | 13,784 (25.2%) |
| Mining, Quarrying, & Extraction | 20,056 (88.7%) | 2,566 (11.3%) |
| Construction | 344,336 (90.8%) | 34,977 (9.2%) |
| Manufacturing | 529,345 (72.4%) | 201,479 (27.6%) |
| Wholesale Trade | 112,368 (71.1%) | 45,621 (28.9%) |
| Retail Trade | 359,349 (51.5%) | 338,640 (48.5%) |
| Transportation & Warehousing | 234,517 (74.3%) | 81,033 (25.7%) |
| Utilities | 45,233 (79.0%) | 11,988 (20.9%) |
| Information | 59,214 (60.5%) | 38,624 (39.5%) |
| Finance & Insurance | 146,301 (45.1%) | 177,926 (54.9%) |
| Real Estate, Rental & Leasing | 51,539 (54.6%) | 42,835 (45.4%) |
| Professional & Scientific | 256,502 (56.9%) | 194,445 (43.1%) |
| Enterprise Management | 4,270 (49.6%) | 4,334 (50.4%) |
| Administrative & Support | 134,685 (59.4%) | 91,971 (40.6%) |
| Educational Services | 204,176 (33.7%) | 402,458 (66.3%) |
| Health Care & Social Assistance | 240,561 (22.7%) | 819,981 (77.3%) |
| Arts, Entertainment & Recreation | 61,061 (53.7%) | 52,674 (46.3%) |
| Accommodation & Food Services | 167,953 (45.1%) | 204,369 (54.9%) |
| Public Administration | 148,319 (58.4%) | 105,571 (41.6%) |
| Total | 3,304,082 (52.3%) | 3,017,929 (47.7%) |
Education in Pennsylvania
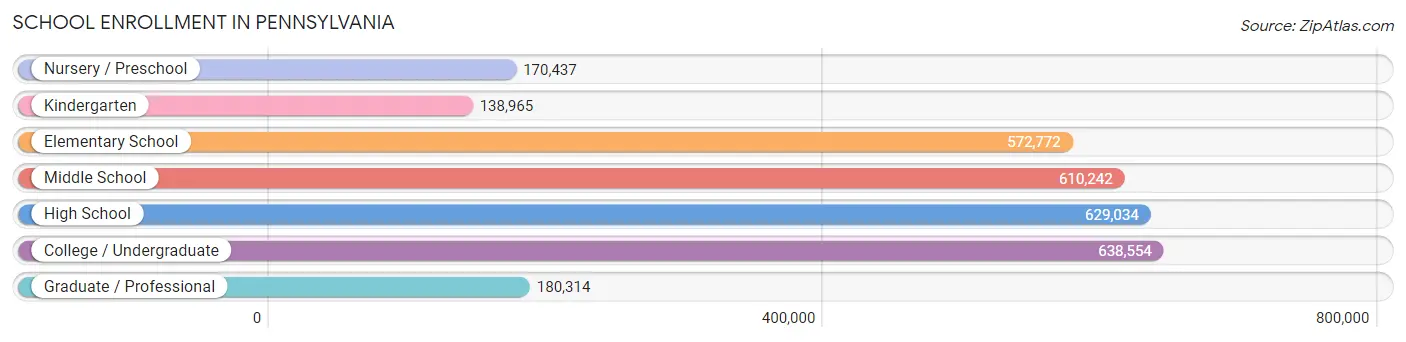
School Enrollment in Pennsylvania
The most common levels of schooling among the 2,940,318 students in Pennsylvania are college / undergraduate (638,554 | 21.7%), high school (629,034 | 21.4%), and middle school (610,242 | 20.7%).
| School Level | # Students | % Students |
| Nursery / Preschool | 170,437 | 5.8% |
| Kindergarten | 138,965 | 4.7% |
| Elementary School | 572,772 | 19.5% |
| Middle School | 610,242 | 20.7% |
| High School | 629,034 | 21.4% |
| College / Undergraduate | 638,554 | 21.7% |
| Graduate / Professional | 180,314 | 6.1% |
| Total | 2,940,318 | 100.0% |
School Enrollment by Age by Funding Source in Pennsylvania
Out of a total of 2,940,318 students who are enrolled in schools in Pennsylvania, 717,438 (24.4%) attend a private institution, while the remaining 2,222,880 (75.6%) are enrolled in public schools. The age group of 3 to 4 year olds has the highest likelihood of being enrolled in private schools, with 63,079 (49.6% in the age bracket) enrolled. Conversely, the age group of 15 to 17 year olds has the lowest likelihood of being enrolled in a private school, with 391,903 (86.5% in the age bracket) attending a public institution.
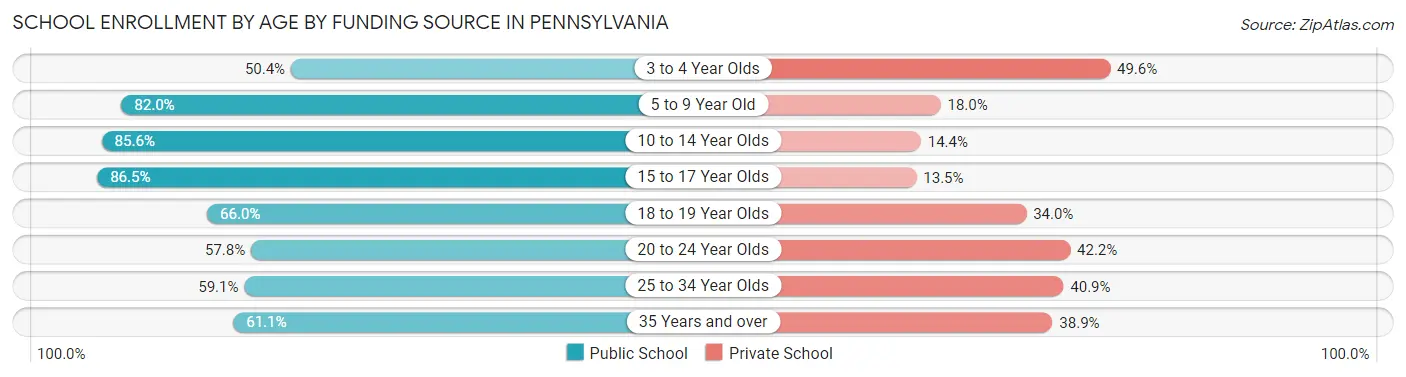
| Age Bracket | Public School | Private School |
| 3 to 4 Year Olds | 64,075 (50.4%) | 63,079 (49.6%) |
| 5 to 9 Year Old | 552,135 (82.0%) | 121,538 (18.0%) |
| 10 to 14 Year Olds | 647,854 (85.6%) | 108,638 (14.4%) |
| 15 to 17 Year Olds | 391,903 (86.5%) | 61,362 (13.5%) |
| 18 to 19 Year Olds | 188,106 (66.0%) | 96,898 (34.0%) |
| 20 to 24 Year Olds | 199,592 (57.8%) | 145,607 (42.2%) |
| 25 to 34 Year Olds | 96,444 (59.1%) | 66,806 (40.9%) |
| 35 Years and over | 83,294 (61.1%) | 52,987 (38.9%) |
| Total | 2,222,880 (75.6%) | 717,438 (24.4%) |
Educational Attainment by Field of Study in Pennsylvania
Business (628,417 | 18.9%), education (436,359 | 13.1%), science & technology (361,520 | 10.9%), social sciences (238,511 | 7.2%), and engineering (224,288 | 6.7%) are the most common fields of study among 3,328,489 individuals in Pennsylvania who have obtained a bachelor's degree or higher.
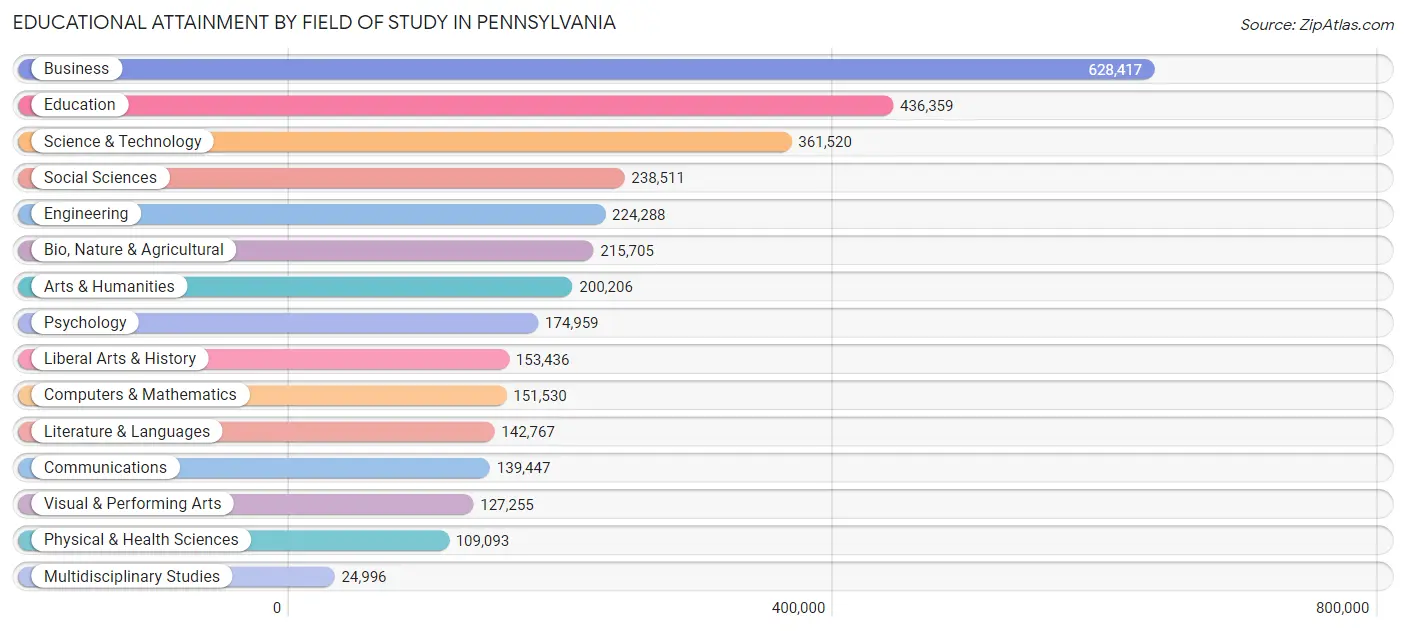
| Field of Study | # Graduates | % Graduates |
| Computers & Mathematics | 151,530 | 4.5% |
| Bio, Nature & Agricultural | 215,705 | 6.5% |
| Physical & Health Sciences | 109,093 | 3.3% |
| Psychology | 174,959 | 5.3% |
| Social Sciences | 238,511 | 7.2% |
| Engineering | 224,288 | 6.7% |
| Multidisciplinary Studies | 24,996 | 0.7% |
| Science & Technology | 361,520 | 10.9% |
| Business | 628,417 | 18.9% |
| Education | 436,359 | 13.1% |
| Literature & Languages | 142,767 | 4.3% |
| Liberal Arts & History | 153,436 | 4.6% |
| Visual & Performing Arts | 127,255 | 3.8% |
| Communications | 139,447 | 4.2% |
| Arts & Humanities | 200,206 | 6.0% |
| Total | 3,328,489 | 100.0% |
Transportation & Commute in Pennsylvania
Vehicle Availability by Sex in Pennsylvania
The most prevalent vehicle ownership categories in Pennsylvania are males with 2 vehicles (1,361,263, accounting for 42.2%) and females with 2 vehicles (1,164,770, making up 46.9%).
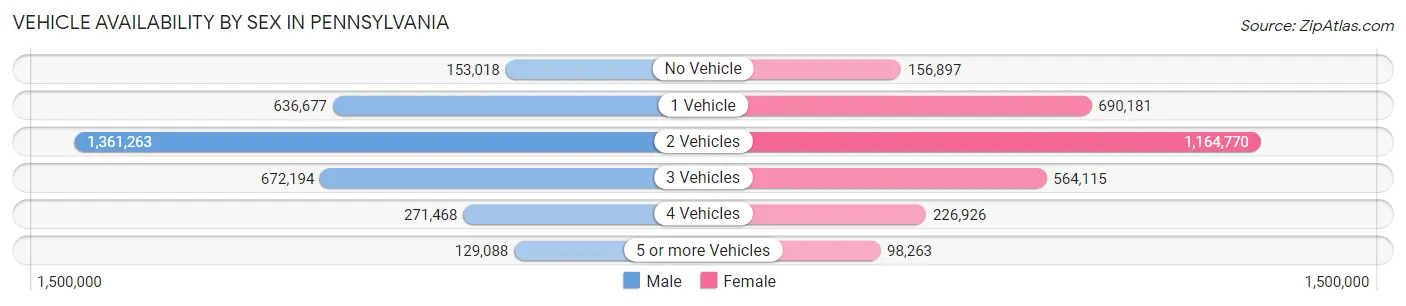
| Vehicles Available | Male | Female |
| No Vehicle | 153,018 (4.8%) | 156,897 (5.4%) |
| 1 Vehicle | 636,677 (19.8%) | 690,181 (23.8%) |
| 2 Vehicles | 1,361,263 (42.2%) | 1,164,770 (40.2%) |
| 3 Vehicles | 672,194 (20.8%) | 564,115 (19.4%) |
| 4 Vehicles | 271,468 (8.4%) | 226,926 (7.8%) |
| 5 or more Vehicles | 129,088 (4.0%) | 98,263 (3.4%) |
| Total | 3,223,708 (100.0%) | 2,901,152 (100.0%) |
Commute Time in Pennsylvania
The most frequently occuring commute durations in Pennsylvania are 15 to 19 minutes (810,990 commuters, 14.8%), 20 to 24 minutes (764,204 commuters, 14.0%), and 10 to 14 minutes (723,238 commuters, 13.2%).
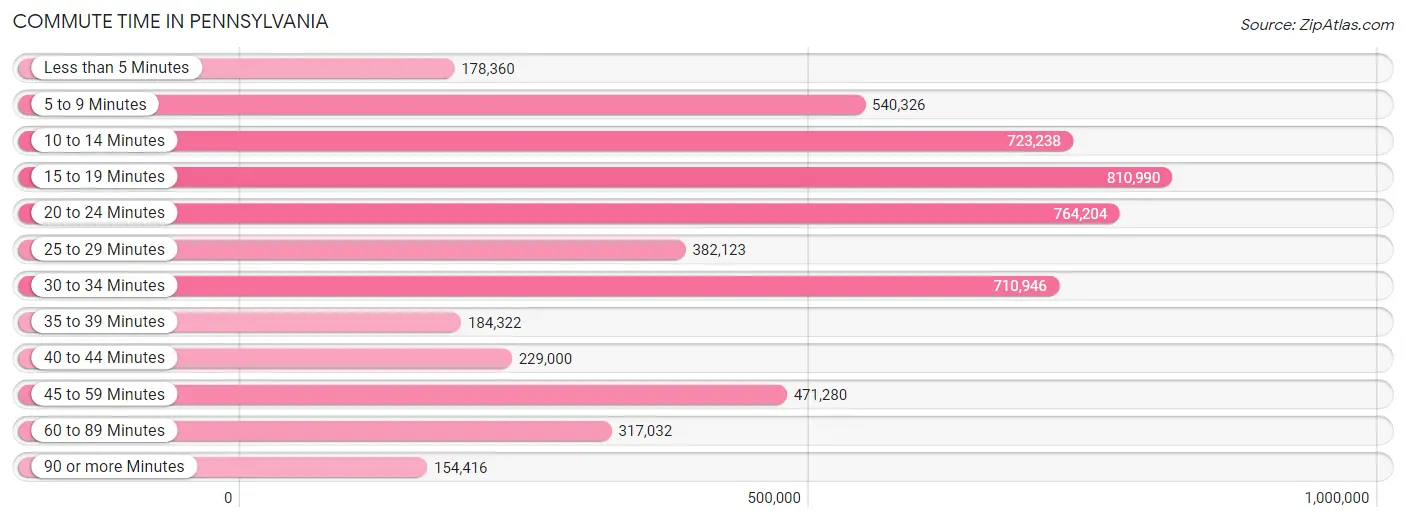
| Commute Time | # Commuters | % Commuters |
| Less than 5 Minutes | 178,360 | 3.3% |
| 5 to 9 Minutes | 540,326 | 9.9% |
| 10 to 14 Minutes | 723,238 | 13.2% |
| 15 to 19 Minutes | 810,990 | 14.8% |
| 20 to 24 Minutes | 764,204 | 14.0% |
| 25 to 29 Minutes | 382,123 | 7.0% |
| 30 to 34 Minutes | 710,946 | 13.0% |
| 35 to 39 Minutes | 184,322 | 3.4% |
| 40 to 44 Minutes | 229,000 | 4.2% |
| 45 to 59 Minutes | 471,280 | 8.6% |
| 60 to 89 Minutes | 317,032 | 5.8% |
| 90 or more Minutes | 154,416 | 2.8% |
Commute Time by Sex in Pennsylvania
The most common commute times in Pennsylvania are 15 to 19 minutes (410,561 commuters, 14.2%) for males and 15 to 19 minutes (400,429 commuters, 15.6%) for females.
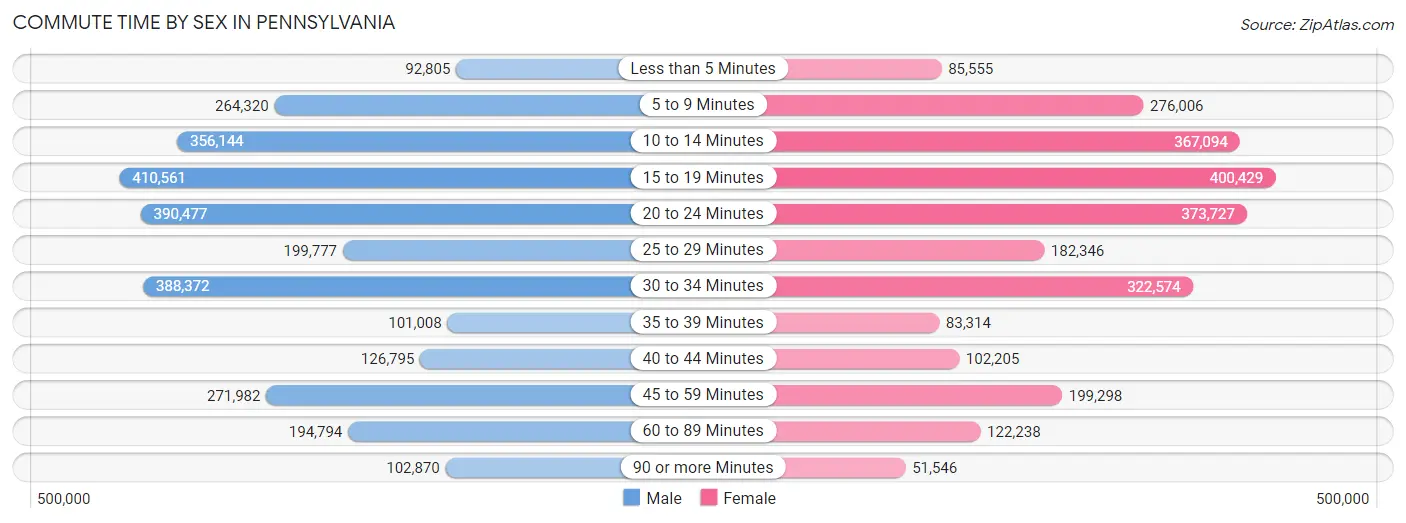
| Commute Time | Male | Female |
| Less than 5 Minutes | 92,805 (3.2%) | 85,555 (3.3%) |
| 5 to 9 Minutes | 264,320 (9.1%) | 276,006 (10.7%) |
| 10 to 14 Minutes | 356,144 (12.3%) | 367,094 (14.3%) |
| 15 to 19 Minutes | 410,561 (14.2%) | 400,429 (15.6%) |
| 20 to 24 Minutes | 390,477 (13.5%) | 373,727 (14.6%) |
| 25 to 29 Minutes | 199,777 (6.9%) | 182,346 (7.1%) |
| 30 to 34 Minutes | 388,372 (13.4%) | 322,574 (12.6%) |
| 35 to 39 Minutes | 101,008 (3.5%) | 83,314 (3.3%) |
| 40 to 44 Minutes | 126,795 (4.4%) | 102,205 (4.0%) |
| 45 to 59 Minutes | 271,982 (9.4%) | 199,298 (7.8%) |
| 60 to 89 Minutes | 194,794 (6.7%) | 122,238 (4.8%) |
| 90 or more Minutes | 102,870 (3.5%) | 51,546 (2.0%) |
Time of Departure to Work by Sex in Pennsylvania
The most frequent times of departure to work in Pennsylvania are 7:00 AM to 7:29 AM (373,821, 12.9%) for males and 7:00 AM to 7:29 AM (383,999, 15.0%) for females.
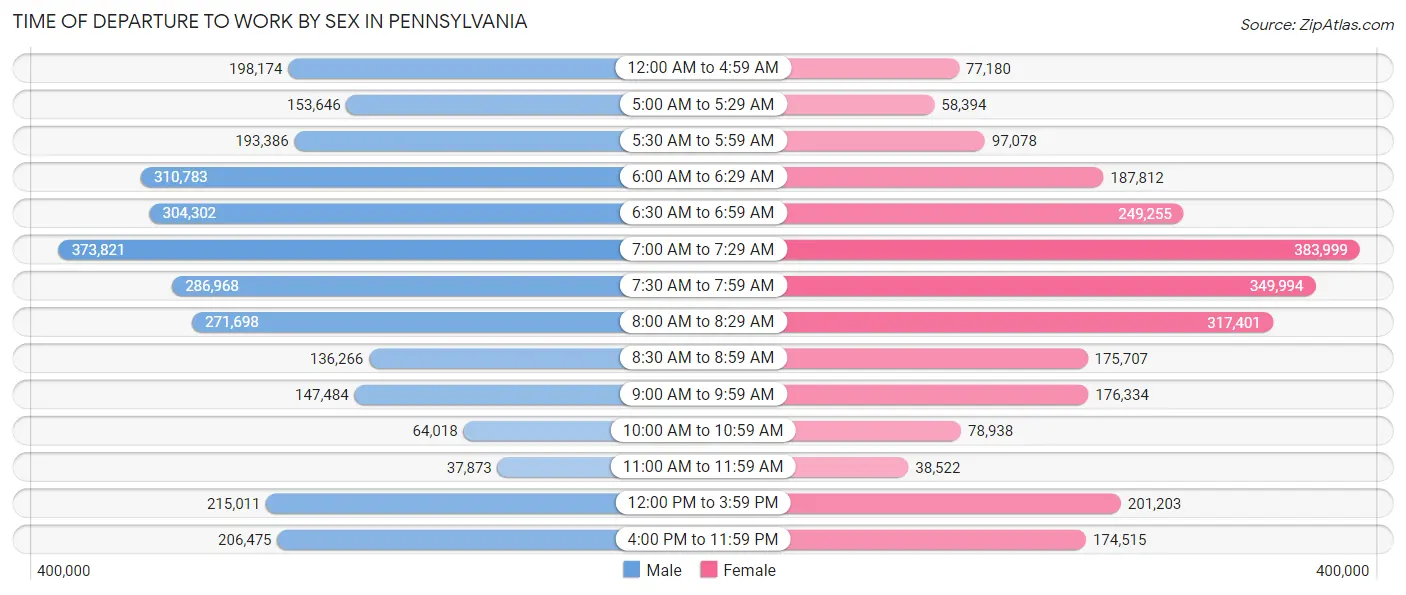
| Time of Departure | Male | Female |
| 12:00 AM to 4:59 AM | 198,174 (6.8%) | 77,180 (3.0%) |
| 5:00 AM to 5:29 AM | 153,646 (5.3%) | 58,394 (2.3%) |
| 5:30 AM to 5:59 AM | 193,386 (6.7%) | 97,078 (3.8%) |
| 6:00 AM to 6:29 AM | 310,783 (10.7%) | 187,812 (7.3%) |
| 6:30 AM to 6:59 AM | 304,302 (10.5%) | 249,255 (9.7%) |
| 7:00 AM to 7:29 AM | 373,821 (12.9%) | 383,999 (15.0%) |
| 7:30 AM to 7:59 AM | 286,968 (9.9%) | 349,994 (13.6%) |
| 8:00 AM to 8:29 AM | 271,698 (9.4%) | 317,401 (12.4%) |
| 8:30 AM to 8:59 AM | 136,266 (4.7%) | 175,707 (6.9%) |
| 9:00 AM to 9:59 AM | 147,484 (5.1%) | 176,334 (6.9%) |
| 10:00 AM to 10:59 AM | 64,018 (2.2%) | 78,938 (3.1%) |
| 11:00 AM to 11:59 AM | 37,873 (1.3%) | 38,522 (1.5%) |
| 12:00 PM to 3:59 PM | 215,011 (7.4%) | 201,203 (7.8%) |
| 4:00 PM to 11:59 PM | 206,475 (7.1%) | 174,515 (6.8%) |
| Total | 2,899,905 (100.0%) | 2,566,332 (100.0%) |
Housing Occupancy in Pennsylvania
Occupancy by Ownership in Pennsylvania
Of the total 5,193,727 dwellings in Pennsylvania, owner-occupied units account for 3,593,490 (69.2%), while renter-occupied units make up 1,600,237 (30.8%).
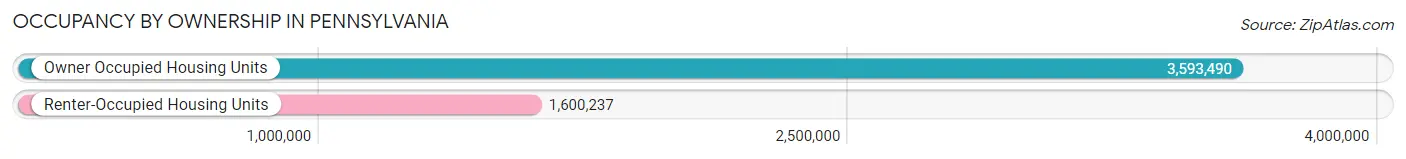
| Occupancy | # Housing Units | % Housing Units |
| Owner Occupied Housing Units | 3,593,490 | 69.2% |
| Renter-Occupied Housing Units | 1,600,237 | 30.8% |
| Total Occupied Housing Units | 5,193,727 | 100.0% |
Occupancy by Household Size in Pennsylvania
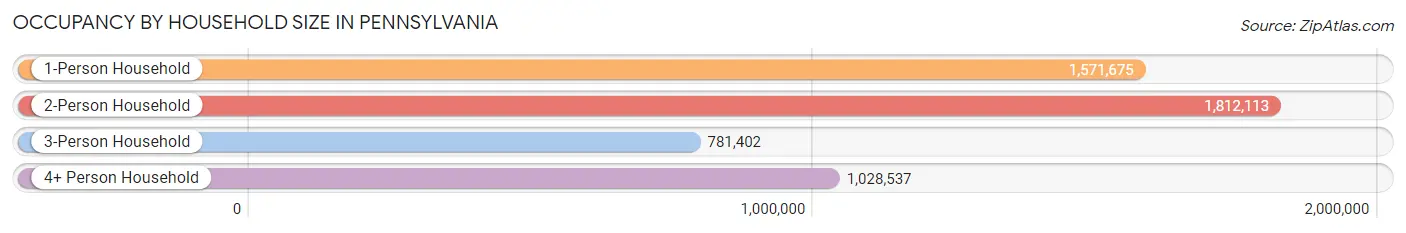
| Household Size | # Housing Units | % Housing Units |
| 1-Person Household | 1,571,675 | 30.3% |
| 2-Person Household | 1,812,113 | 34.9% |
| 3-Person Household | 781,402 | 15.0% |
| 4+ Person Household | 1,028,537 | 19.8% |
| Total Housing Units | 5,193,727 | 100.0% |
Occupancy by Ownership by Household Size in Pennsylvania
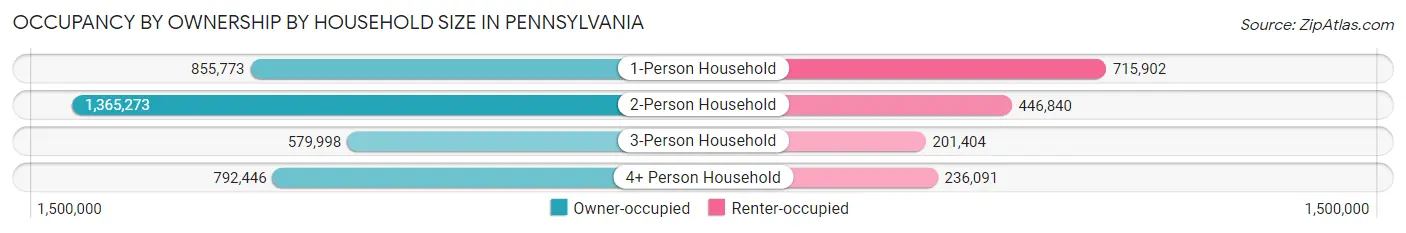
| Household Size | Owner-occupied | Renter-occupied |
| 1-Person Household | 855,773 (54.4%) | 715,902 (45.6%) |
| 2-Person Household | 1,365,273 (75.3%) | 446,840 (24.7%) |
| 3-Person Household | 579,998 (74.2%) | 201,404 (25.8%) |
| 4+ Person Household | 792,446 (77.0%) | 236,091 (23.0%) |
| Total Housing Units | 3,593,490 (69.2%) | 1,600,237 (30.8%) |
Occupancy by Educational Attainment in Pennsylvania
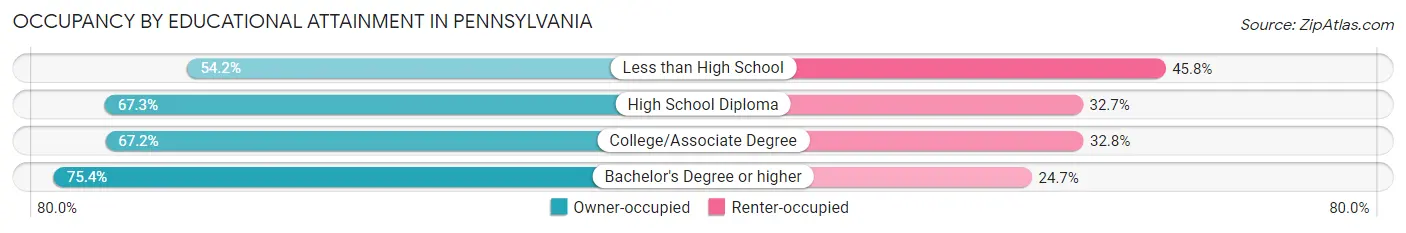
| Household Size | Owner-occupied | Renter-occupied |
| Less than High School | 205,929 (54.2%) | 174,318 (45.8%) |
| High School Diploma | 1,078,932 (67.3%) | 524,930 (32.7%) |
| College/Associate Degree | 903,453 (67.2%) | 441,265 (32.8%) |
| Bachelor's Degree or higher | 1,405,176 (75.3%) | 459,724 (24.6%) |
Occupancy by Age of Householder in Pennsylvania
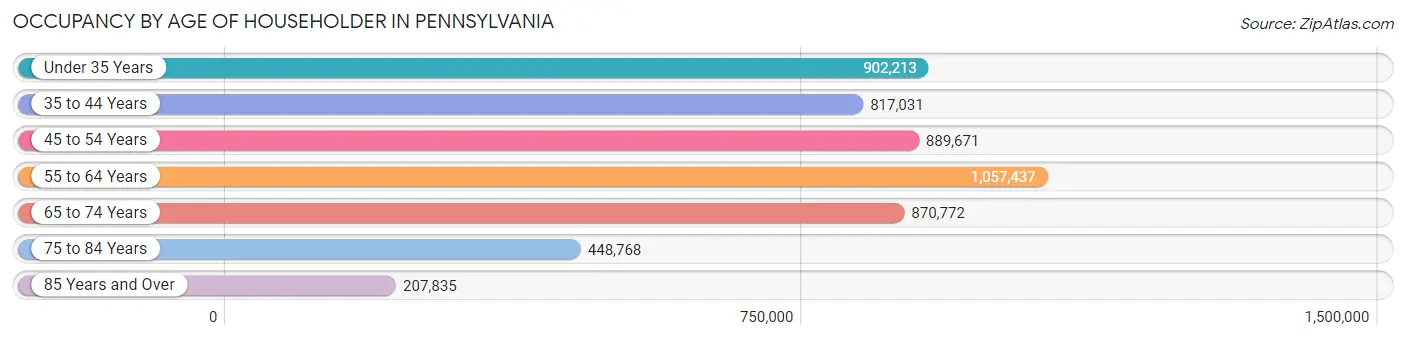
| Age Bracket | # Households | % Households |
| Under 35 Years | 902,213 | 17.4% |
| 35 to 44 Years | 817,031 | 15.7% |
| 45 to 54 Years | 889,671 | 17.1% |
| 55 to 64 Years | 1,057,437 | 20.4% |
| 65 to 74 Years | 870,772 | 16.8% |
| 75 to 84 Years | 448,768 | 8.6% |
| 85 Years and Over | 207,835 | 4.0% |
| Total | 5,193,727 | 100.0% |
Housing Finances in Pennsylvania
Median Income by Occupancy in Pennsylvania
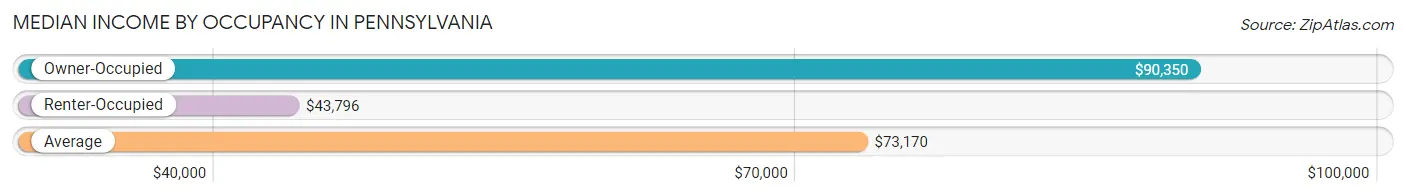
| Occupancy Type | # Households | Median Income |
| Owner-Occupied | 3,593,490 (69.2%) | $90,350 |
| Renter-Occupied | 1,600,237 (30.8%) | $43,796 |
| Average | 5,193,727 (100.0%) | $73,170 |
Occupancy by Householder Income Bracket in Pennsylvania
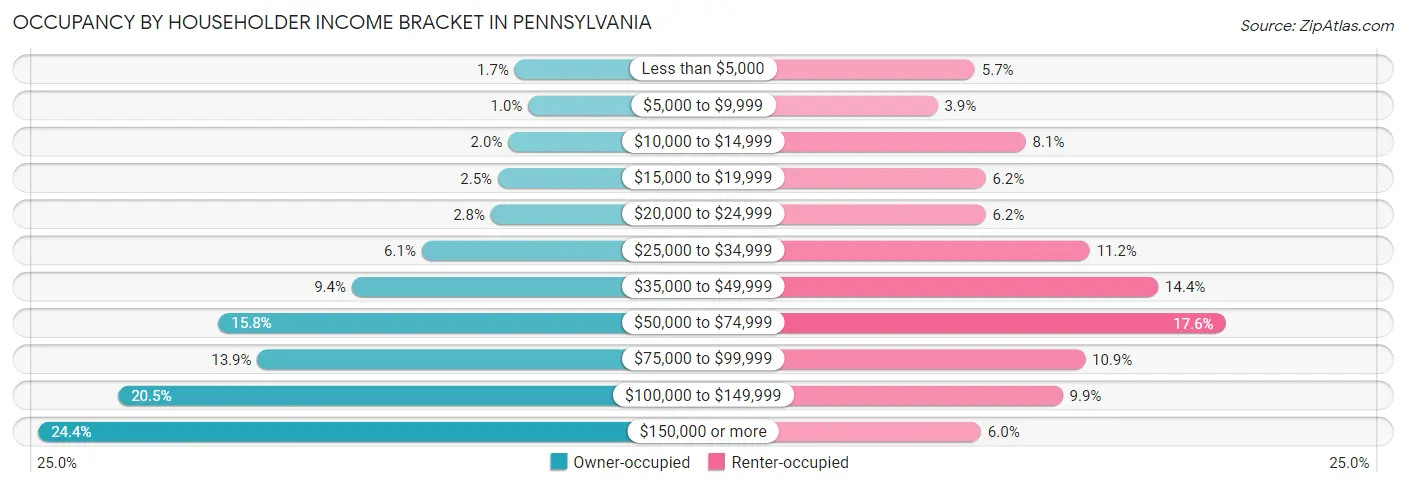
| Income Bracket | Owner-occupied | Renter-occupied |
| Less than $5,000 | 59,676 (1.7%) | 90,870 (5.7%) |
| $5,000 to $9,999 | 36,642 (1.0%) | 62,489 (3.9%) |
| $10,000 to $14,999 | 70,863 (2.0%) | 129,692 (8.1%) |
| $15,000 to $19,999 | 88,295 (2.5%) | 99,000 (6.2%) |
| $20,000 to $24,999 | 100,511 (2.8%) | 99,088 (6.2%) |
| $25,000 to $34,999 | 218,917 (6.1%) | 178,390 (11.2%) |
| $35,000 to $49,999 | 338,454 (9.4%) | 230,596 (14.4%) |
| $50,000 to $74,999 | 566,718 (15.8%) | 281,835 (17.6%) |
| $75,000 to $99,999 | 500,243 (13.9%) | 174,976 (10.9%) |
| $100,000 to $149,999 | 738,173 (20.5%) | 157,736 (9.9%) |
| $150,000 or more | 874,998 (24.3%) | 95,565 (6.0%) |
| Total | 3,593,490 (100.0%) | 1,600,237 (100.0%) |
Monthly Housing Cost Tiers in Pennsylvania
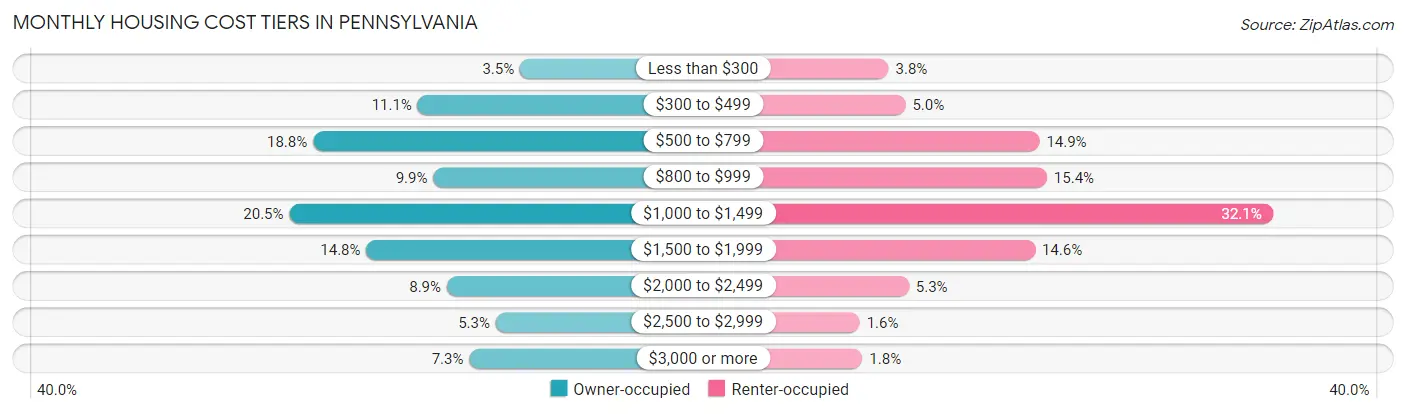
| Monthly Cost | Owner-occupied | Renter-occupied |
| Less than $300 | 126,306 (3.5%) | 60,381 (3.8%) |
| $300 to $499 | 397,003 (11.1%) | 80,108 (5.0%) |
| $500 to $799 | 674,106 (18.8%) | 238,171 (14.9%) |
| $800 to $999 | 355,688 (9.9%) | 246,987 (15.4%) |
| $1,000 to $1,499 | 736,789 (20.5%) | 514,013 (32.1%) |
| $1,500 to $1,999 | 532,860 (14.8%) | 232,798 (14.5%) |
| $2,000 to $2,499 | 319,925 (8.9%) | 84,115 (5.3%) |
| $2,500 to $2,999 | 190,362 (5.3%) | 26,216 (1.6%) |
| $3,000 or more | 260,451 (7.2%) | 29,479 (1.8%) |
| Total | 3,593,490 (100.0%) | 1,600,237 (100.0%) |
Physical Housing Characteristics in Pennsylvania
Housing Structures in Pennsylvania
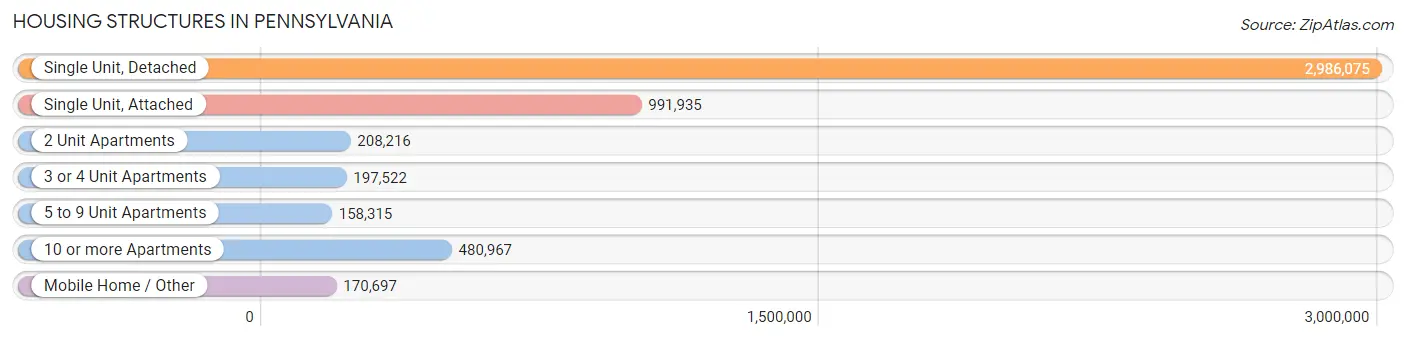
| Structure Type | # Housing Units | % Housing Units |
| Single Unit, Detached | 2,986,075 | 57.5% |
| Single Unit, Attached | 991,935 | 19.1% |
| 2 Unit Apartments | 208,216 | 4.0% |
| 3 or 4 Unit Apartments | 197,522 | 3.8% |
| 5 to 9 Unit Apartments | 158,315 | 3.0% |
| 10 or more Apartments | 480,967 | 9.3% |
| Mobile Home / Other | 170,697 | 3.3% |
| Total | 5,193,727 | 100.0% |
Housing Structures by Occupancy in Pennsylvania
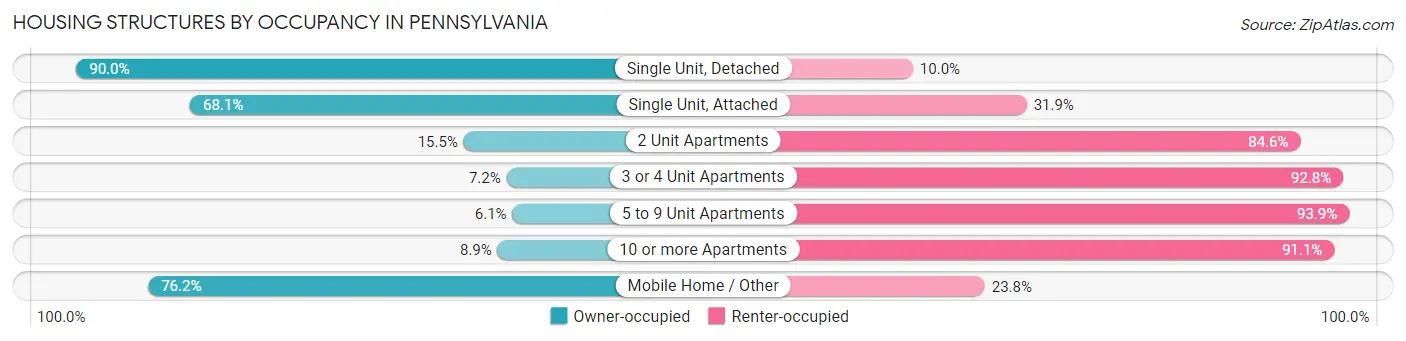
| Structure Type | Owner-occupied | Renter-occupied |
| Single Unit, Detached | 2,688,627 (90.0%) | 297,448 (10.0%) |
| Single Unit, Attached | 675,815 (68.1%) | 316,120 (31.9%) |
| 2 Unit Apartments | 32,171 (15.4%) | 176,045 (84.6%) |
| 3 or 4 Unit Apartments | 14,234 (7.2%) | 183,288 (92.8%) |
| 5 to 9 Unit Apartments | 9,624 (6.1%) | 148,691 (93.9%) |
| 10 or more Apartments | 42,970 (8.9%) | 437,997 (91.1%) |
| Mobile Home / Other | 130,049 (76.2%) | 40,648 (23.8%) |
| Total | 3,593,490 (69.2%) | 1,600,237 (30.8%) |
Housing Structures by Number of Rooms in Pennsylvania
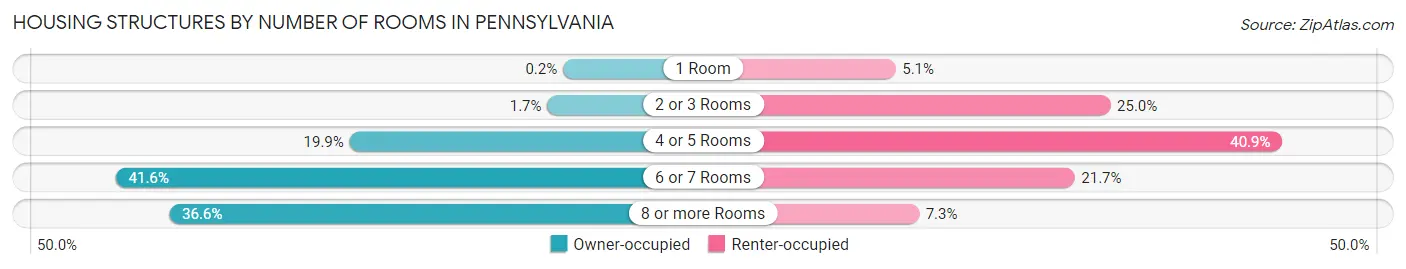
| Number of Rooms | Owner-occupied | Renter-occupied |
| 1 Room | 7,331 (0.2%) | 81,971 (5.1%) |
| 2 or 3 Rooms | 59,318 (1.7%) | 399,946 (25.0%) |
| 4 or 5 Rooms | 716,544 (19.9%) | 654,692 (40.9%) |
| 6 or 7 Rooms | 1,494,068 (41.6%) | 346,940 (21.7%) |
| 8 or more Rooms | 1,316,229 (36.6%) | 116,688 (7.3%) |
| Total | 3,593,490 (100.0%) | 1,600,237 (100.0%) |
Housing Structure by Heating Type in Pennsylvania
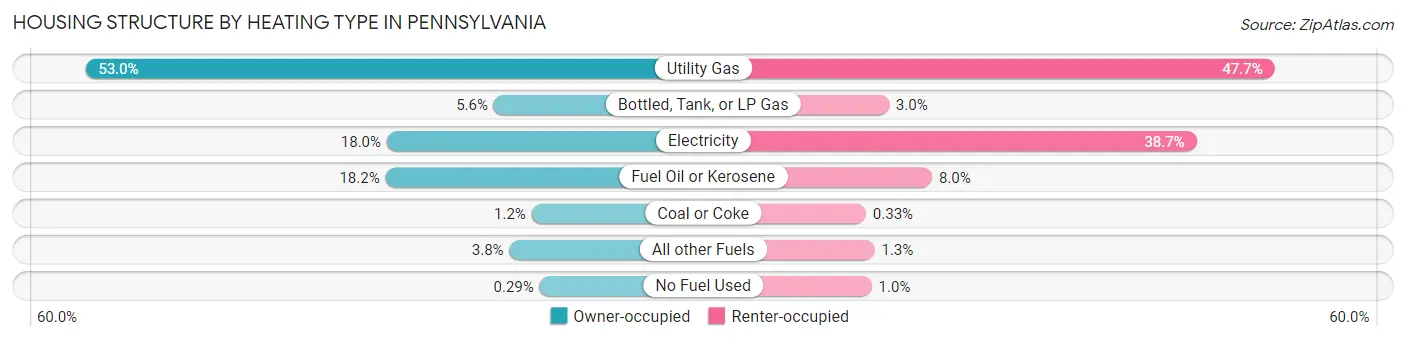
| Heating Type | Owner-occupied | Renter-occupied |
| Utility Gas | 1,902,993 (53.0%) | 763,367 (47.7%) |
| Bottled, Tank, or LP Gas | 201,344 (5.6%) | 47,954 (3.0%) |
| Electricity | 646,720 (18.0%) | 618,451 (38.7%) |
| Fuel Oil or Kerosene | 652,445 (18.2%) | 127,811 (8.0%) |
| Coal or Coke | 43,362 (1.2%) | 5,289 (0.3%) |
| All other Fuels | 136,084 (3.8%) | 21,333 (1.3%) |
| No Fuel Used | 10,542 (0.3%) | 16,032 (1.0%) |
| Total | 3,593,490 (100.0%) | 1,600,237 (100.0%) |
Household Vehicle Usage in Pennsylvania
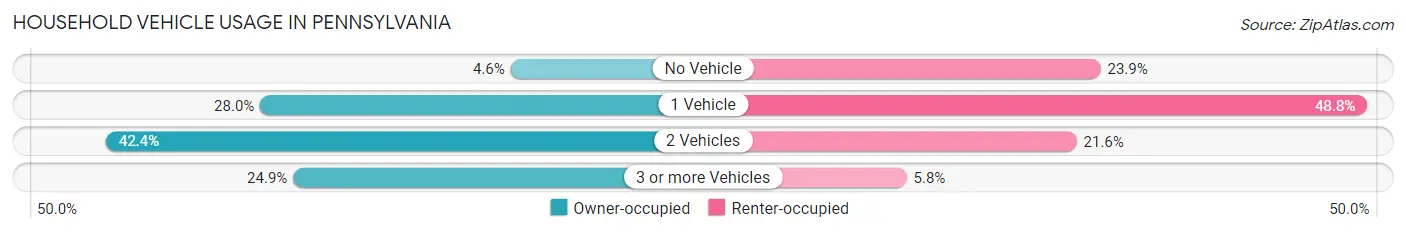
| Vehicles per Household | Owner-occupied | Renter-occupied |
| No Vehicle | 166,636 (4.6%) | 381,883 (23.9%) |
| 1 Vehicle | 1,006,590 (28.0%) | 780,068 (48.7%) |
| 2 Vehicles | 1,524,283 (42.4%) | 346,071 (21.6%) |
| 3 or more Vehicles | 895,981 (24.9%) | 92,215 (5.8%) |
| Total | 3,593,490 (100.0%) | 1,600,237 (100.0%) |
Real Estate & Mortgages in Pennsylvania
Real Estate and Mortgage Overview in Pennsylvania
| Characteristic | Without Mortgage | With Mortgage |
| Housing Units | 1,469,924 | 2,123,566 |
| Median Property Value | $196,700 | $244,800 |
| Median Household Income | $65,217 | $645,149 |
| Monthly Housing Costs | $606 | $253,645 |
| Real Estate Taxes | $2,699 | $30,370 |
Property Value by Mortgage Status in Pennsylvania
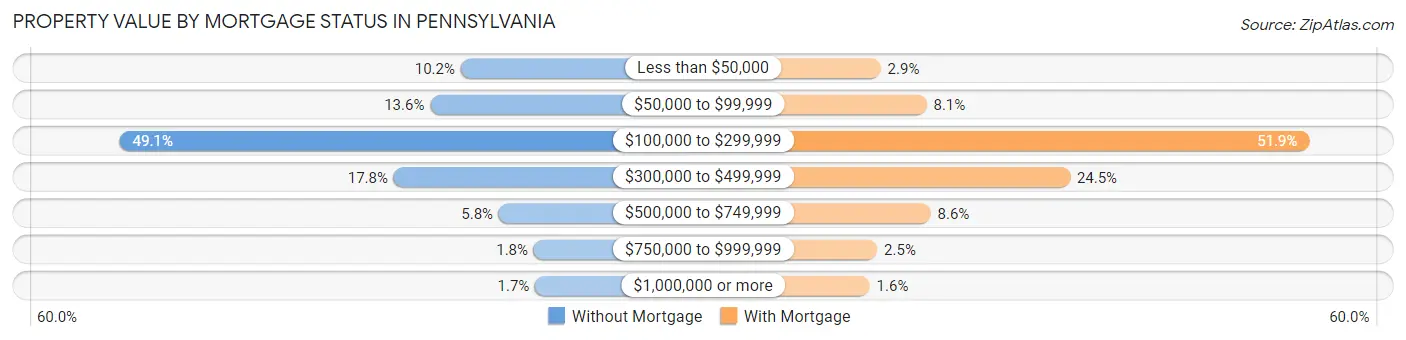
| Property Value | Without Mortgage | With Mortgage |
| Less than $50,000 | 149,264 (10.2%) | 60,899 (2.9%) |
| $50,000 to $99,999 | 200,555 (13.6%) | 172,161 (8.1%) |
| $100,000 to $299,999 | 722,324 (49.1%) | 1,101,360 (51.9%) |
| $300,000 to $499,999 | 261,844 (17.8%) | 520,235 (24.5%) |
| $500,000 to $749,999 | 85,142 (5.8%) | 182,308 (8.6%) |
| $750,000 to $999,999 | 26,480 (1.8%) | 52,358 (2.5%) |
| $1,000,000 or more | 24,315 (1.7%) | 34,245 (1.6%) |
| Total | 1,469,924 (100.0%) | 2,123,566 (100.0%) |
Household Income by Mortgage Status in Pennsylvania
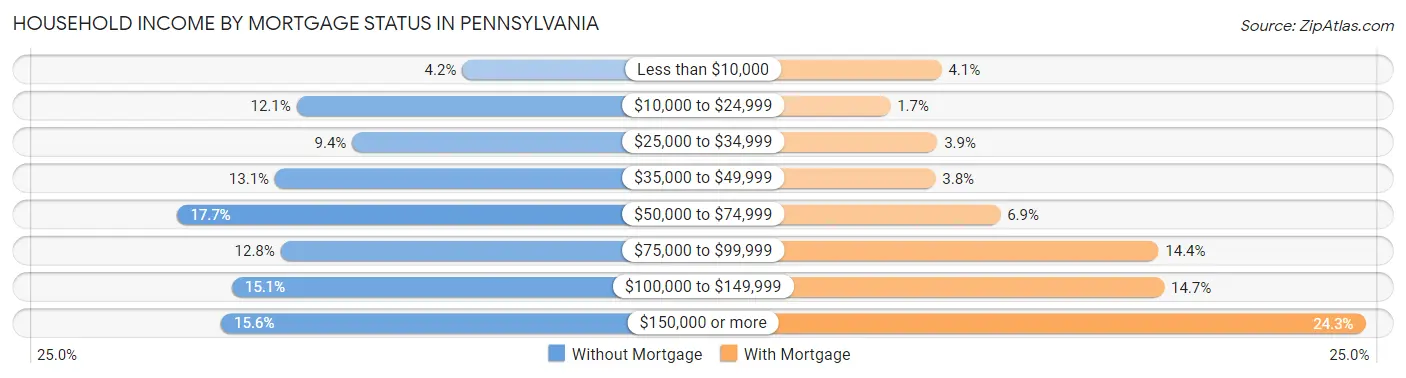
| Household Income | Without Mortgage | With Mortgage |
| Less than $10,000 | 61,204 (4.2%) | 86,772 (4.1%) |
| $10,000 to $24,999 | 177,157 (12.0%) | 35,114 (1.7%) |
| $25,000 to $34,999 | 138,239 (9.4%) | 82,512 (3.9%) |
| $35,000 to $49,999 | 192,225 (13.1%) | 80,678 (3.8%) |
| $50,000 to $74,999 | 260,468 (17.7%) | 146,229 (6.9%) |
| $75,000 to $99,999 | 188,312 (12.8%) | 306,250 (14.4%) |
| $100,000 to $149,999 | 222,470 (15.1%) | 311,931 (14.7%) |
| $150,000 or more | 229,849 (15.6%) | 515,703 (24.3%) |
| Total | 1,469,924 (100.0%) | 2,123,566 (100.0%) |
Property Value to Household Income Ratio in Pennsylvania
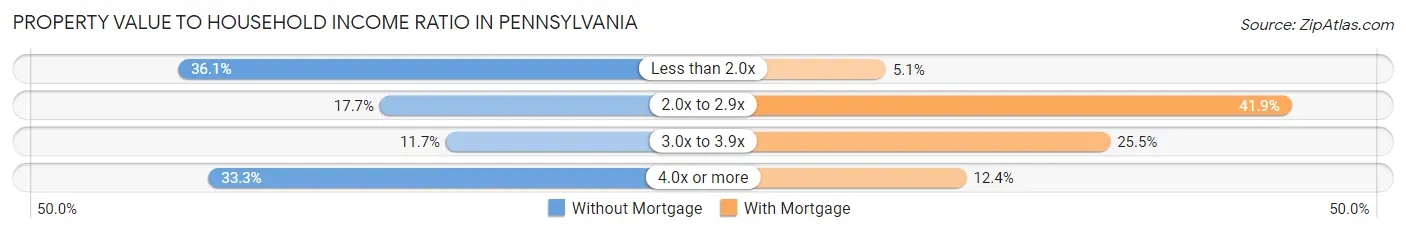
| Value-to-Income Ratio | Without Mortgage | With Mortgage |
| Less than 2.0x | 530,175 (36.1%) | 108,181 (5.1%) |
| 2.0x to 2.9x | 260,837 (17.7%) | 890,182 (41.9%) |
| 3.0x to 3.9x | 172,635 (11.7%) | 540,458 (25.5%) |
| 4.0x or more | 489,641 (33.3%) | 263,318 (12.4%) |
| Total | 1,469,924 (100.0%) | 2,123,566 (100.0%) |
Real Estate Taxes by Mortgage Status in Pennsylvania
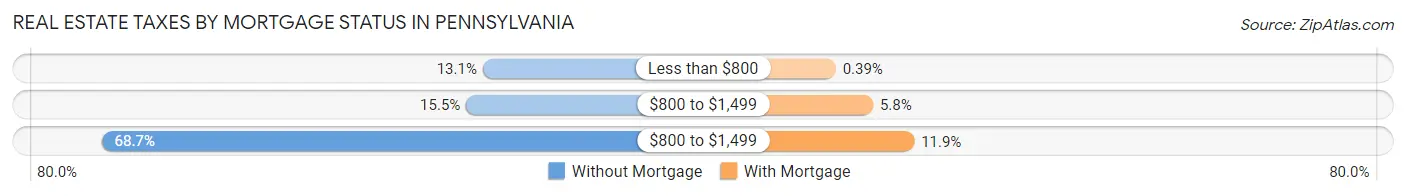
| Property Taxes | Without Mortgage | With Mortgage |
| Less than $800 | 191,902 (13.1%) | 8,342 (0.4%) |
| $800 to $1,499 | 227,612 (15.5%) | 123,869 (5.8%) |
| $800 to $1,499 | 1,010,442 (68.7%) | 251,821 (11.9%) |
| Total | 1,469,924 (100.0%) | 2,123,566 (100.0%) |
Health & Disability in Pennsylvania
Health Insurance Coverage by Age in Pennsylvania
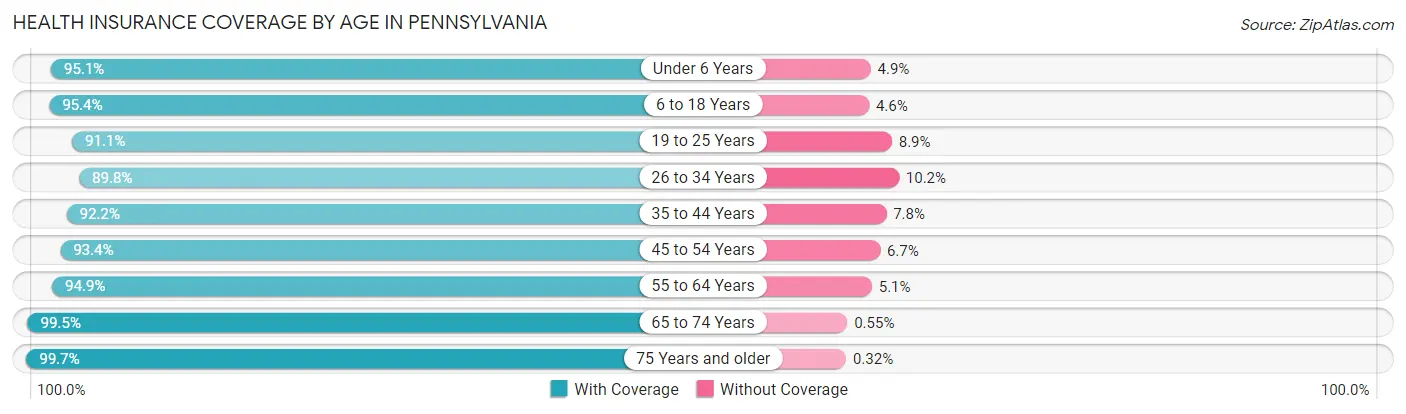
| Age Bracket | With Coverage | Without Coverage |
| Under 6 Years | 787,976 (95.1%) | 40,713 (4.9%) |
| 6 to 18 Years | 1,929,018 (95.4%) | 93,003 (4.6%) |
| 19 to 25 Years | 1,050,591 (91.1%) | 102,146 (8.9%) |
| 26 to 34 Years | 1,357,313 (89.8%) | 153,643 (10.2%) |
| 35 to 44 Years | 1,426,432 (92.2%) | 121,091 (7.8%) |
| 45 to 54 Years | 1,483,106 (93.3%) | 105,684 (6.7%) |
| 55 to 64 Years | 1,705,626 (94.9%) | 92,270 (5.1%) |
| 65 to 74 Years | 1,377,651 (99.5%) | 7,676 (0.5%) |
| 75 Years and older | 964,839 (99.7%) | 3,106 (0.3%) |
| Total | 12,082,552 (94.4%) | 719,332 (5.6%) |
Health Insurance Coverage by Citizenship Status in Pennsylvania
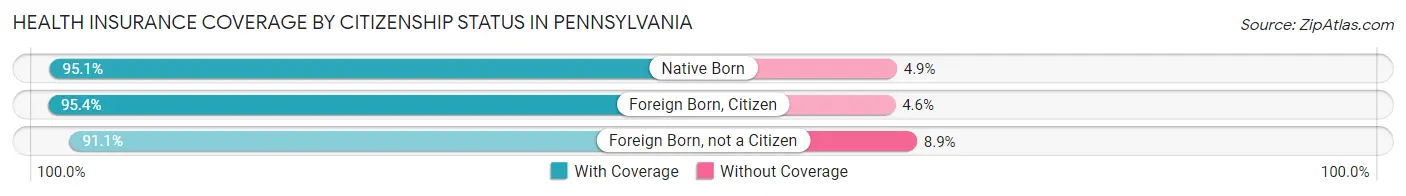
| Citizenship Status | With Coverage | Without Coverage |
| Native Born | 787,976 (95.1%) | 40,713 (4.9%) |
| Foreign Born, Citizen | 1,929,018 (95.4%) | 93,003 (4.6%) |
| Foreign Born, not a Citizen | 1,050,591 (91.1%) | 102,146 (8.9%) |
Health Insurance Coverage by Household Income in Pennsylvania
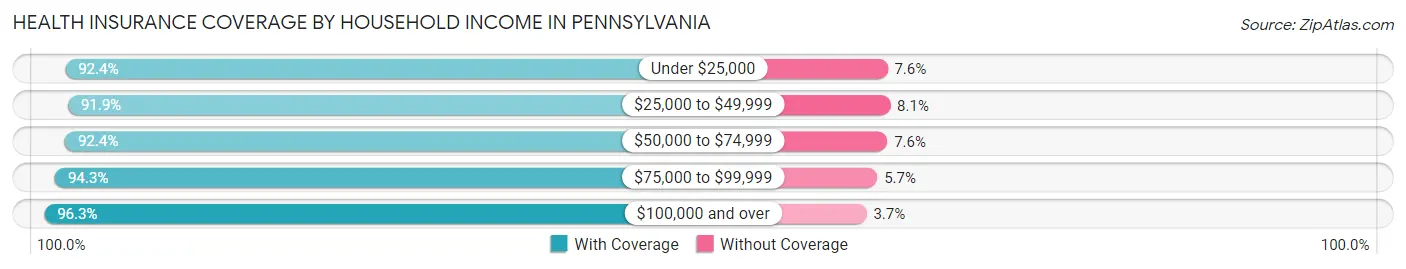
| Household Income | With Coverage | Without Coverage |
| Under $25,000 | 1,280,913 (92.4%) | 105,609 (7.6%) |
| $25,000 to $49,999 | 1,738,787 (91.9%) | 153,610 (8.1%) |
| $50,000 to $74,999 | 1,783,954 (92.4%) | 146,117 (7.6%) |
| $75,000 to $99,999 | 1,621,489 (94.3%) | 97,958 (5.7%) |
| $100,000 and over | 5,427,495 (96.3%) | 207,461 (3.7%) |
Public vs Private Health Insurance Coverage by Age in Pennsylvania
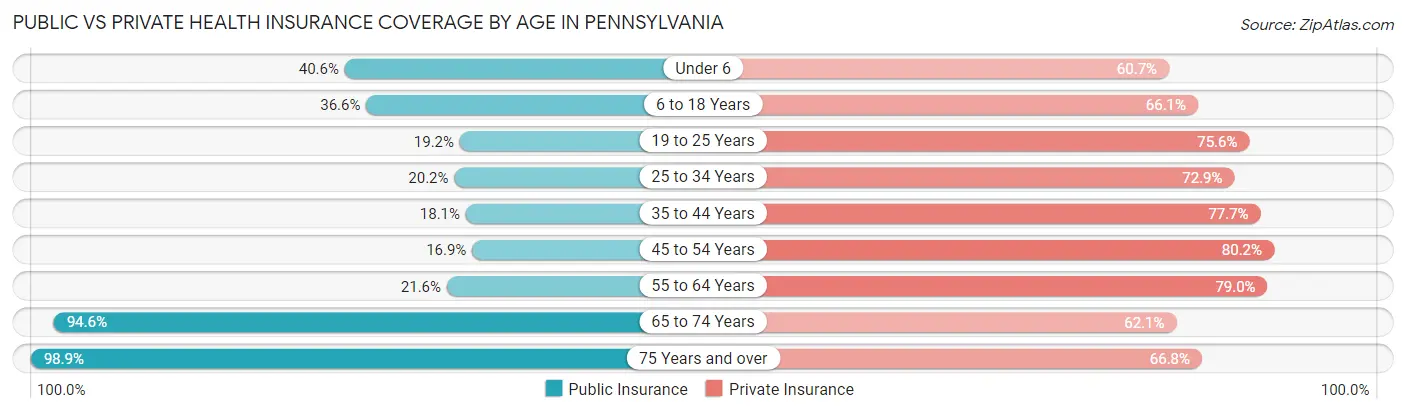
| Age Bracket | Public Insurance | Private Insurance |
| Under 6 | 336,181 (40.6%) | 503,113 (60.7%) |
| 6 to 18 Years | 739,752 (36.6%) | 1,336,084 (66.1%) |
| 19 to 25 Years | 221,408 (19.2%) | 871,789 (75.6%) |
| 25 to 34 Years | 305,732 (20.2%) | 1,100,827 (72.9%) |
| 35 to 44 Years | 280,078 (18.1%) | 1,202,348 (77.7%) |
| 45 to 54 Years | 268,829 (16.9%) | 1,274,008 (80.2%) |
| 55 to 64 Years | 388,739 (21.6%) | 1,420,399 (79.0%) |
| 65 to 74 Years | 1,310,445 (94.6%) | 859,960 (62.1%) |
| 75 Years and over | 956,903 (98.9%) | 646,842 (66.8%) |
| Total | 4,808,067 (37.6%) | 9,215,370 (72.0%) |
Disability Status by Sex by Age in Pennsylvania
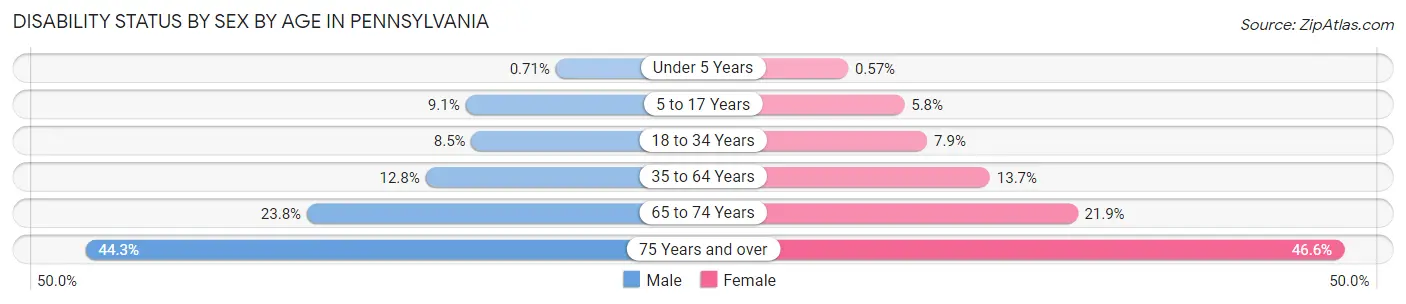
| Age Bracket | Male | Female |
| Under 5 Years | 2,508 (0.7%) | 1,918 (0.6%) |
| 5 to 17 Years | 91,745 (9.1%) | 55,736 (5.8%) |
| 18 to 34 Years | 122,583 (8.5%) | 112,207 (7.9%) |
| 35 to 64 Years | 312,531 (12.8%) | 342,285 (13.7%) |
| 65 to 74 Years | 156,316 (23.8%) | 159,325 (21.9%) |
| 75 Years and over | 173,937 (44.3%) | 268,226 (46.6%) |
Disability Class by Sex by Age in Pennsylvania
Disability Class: Hearing Difficulty
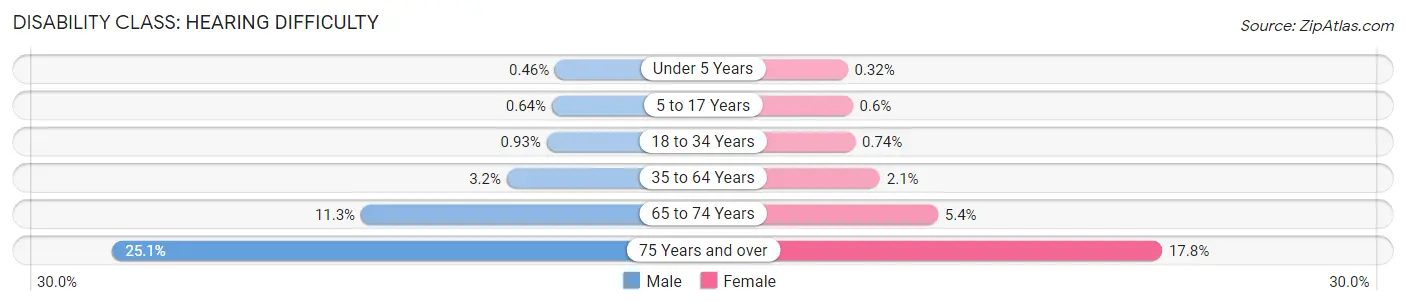
| Age Bracket | Male | Female |
| Under 5 Years | 1,622 (0.5%) | 1,065 (0.3%) |
| 5 to 17 Years | 6,490 (0.6%) | 5,745 (0.6%) |
| 18 to 34 Years | 13,348 (0.9%) | 10,447 (0.7%) |
| 35 to 64 Years | 76,977 (3.2%) | 52,808 (2.1%) |
| 65 to 74 Years | 73,998 (11.3%) | 38,960 (5.3%) |
| 75 Years and over | 98,499 (25.1%) | 102,626 (17.8%) |
Disability Class: Vision Difficulty
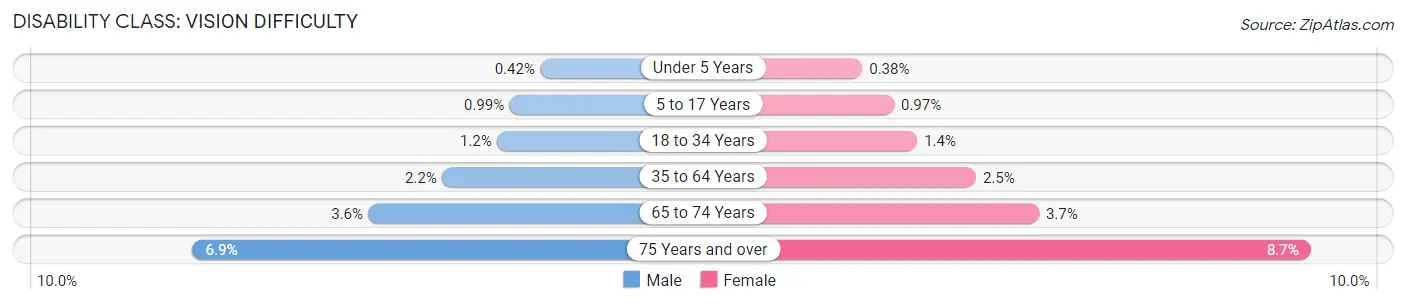
| Age Bracket | Male | Female |
| Under 5 Years | 1,485 (0.4%) | 1,280 (0.4%) |
| 5 to 17 Years | 9,982 (1.0%) | 9,320 (1.0%) |
| 18 to 34 Years | 17,500 (1.2%) | 19,832 (1.4%) |
| 35 to 64 Years | 54,686 (2.2%) | 62,090 (2.5%) |
| 65 to 74 Years | 23,725 (3.6%) | 26,689 (3.7%) |
| 75 Years and over | 27,008 (6.9%) | 50,101 (8.7%) |
Disability Class: Cognitive Difficulty
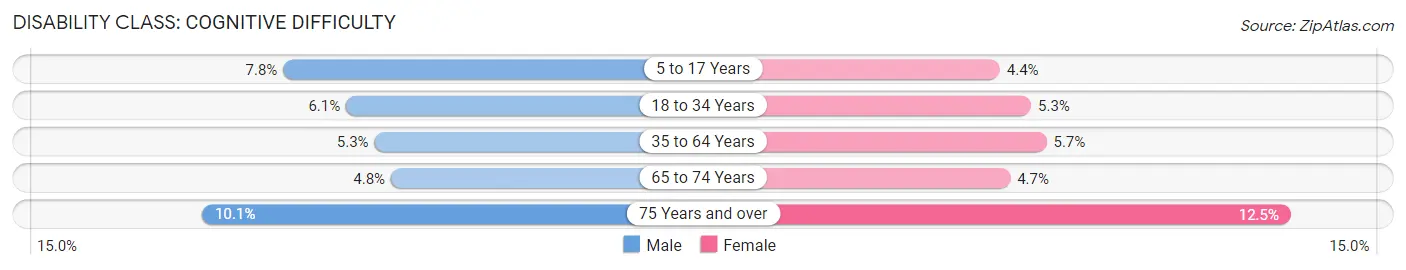
| Age Bracket | Male | Female |
| 5 to 17 Years | 78,766 (7.8%) | 42,332 (4.4%) |
| 18 to 34 Years | 86,856 (6.0%) | 74,666 (5.3%) |
| 35 to 64 Years | 128,623 (5.3%) | 142,083 (5.7%) |
| 65 to 74 Years | 31,500 (4.8%) | 34,196 (4.7%) |
| 75 Years and over | 39,452 (10.1%) | 71,978 (12.5%) |
Disability Class: Ambulatory Difficulty
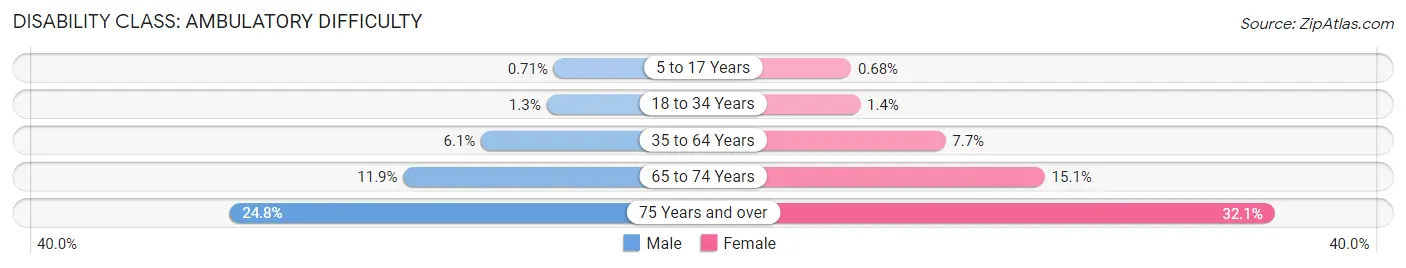
| Age Bracket | Male | Female |
| 5 to 17 Years | 7,213 (0.7%) | 6,559 (0.7%) |
| 18 to 34 Years | 18,011 (1.3%) | 19,241 (1.4%) |
| 35 to 64 Years | 149,004 (6.1%) | 191,418 (7.7%) |
| 65 to 74 Years | 77,997 (11.9%) | 109,739 (15.1%) |
| 75 Years and over | 97,315 (24.8%) | 184,936 (32.1%) |
Disability Class: Self-Care Difficulty
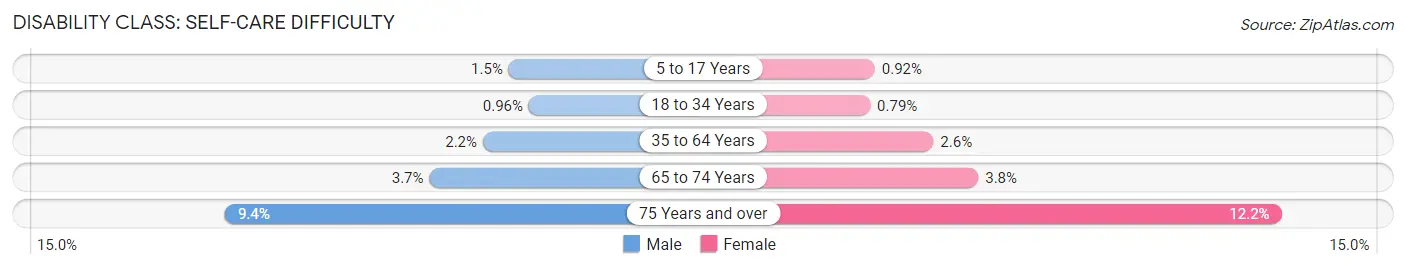
| Age Bracket | Male | Female |
| 5 to 17 Years | 15,345 (1.5%) | 8,831 (0.9%) |
| 18 to 34 Years | 13,804 (1.0%) | 11,146 (0.8%) |
| 35 to 64 Years | 54,856 (2.2%) | 63,448 (2.5%) |
| 65 to 74 Years | 24,522 (3.7%) | 27,698 (3.8%) |
| 75 Years and over | 36,939 (9.4%) | 70,454 (12.2%) |
Technology Access in Pennsylvania
Computing Device Access in Pennsylvania
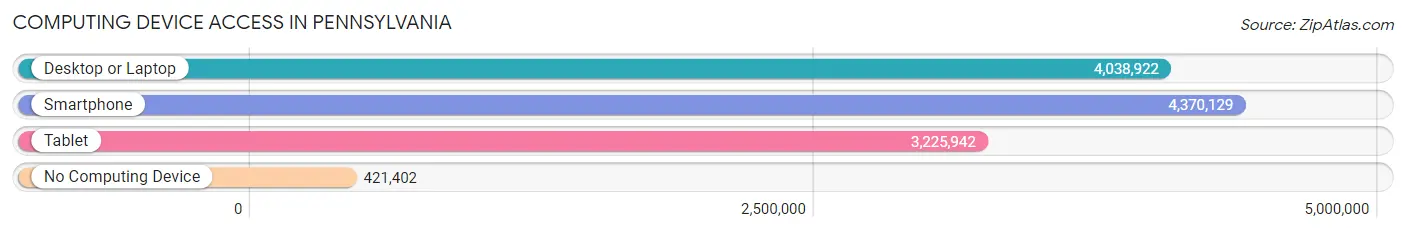
| Device Type | # Households | % Households |
| Desktop or Laptop | 4,038,922 | 77.8% |
| Smartphone | 4,370,129 | 84.1% |
| Tablet | 3,225,942 | 62.1% |
| No Computing Device | 421,402 | 8.1% |
| Total | 5,193,727 | 100.0% |
Internet Access in Pennsylvania
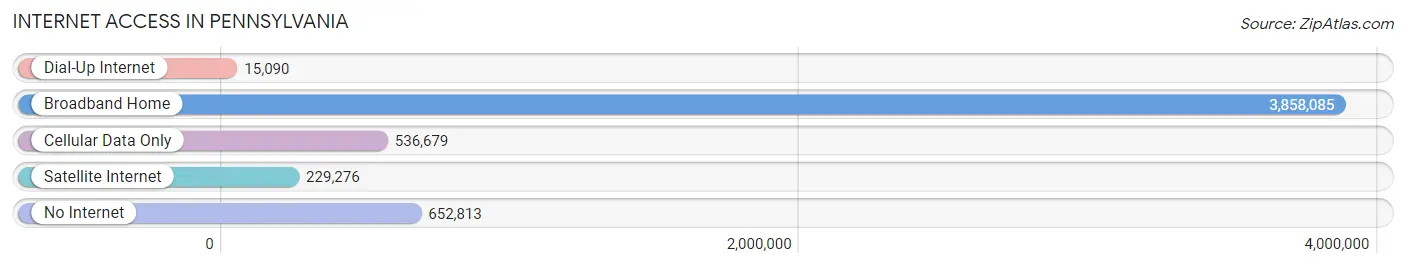
| Internet Type | # Households | % Households |
| Dial-Up Internet | 15,090 | 0.3% |
| Broadband Home | 3,858,085 | 74.3% |
| Cellular Data Only | 536,679 | 10.3% |
| Satellite Internet | 229,276 | 4.4% |
| No Internet | 652,813 | 12.6% |
| Total | 5,193,727 | 100.0% |
Pennsylvania Summary
Pennsylvania is a state located in the Northeastern and Mid-Atlantic regions of the United States. It is the 33rd-largest state by area, and the 6th-most populous state according to the most recent U.S. Census. It is bordered by Delaware to the southeast, Maryland to the south, West Virginia to the southwest, Ohio to the west, Lake Erie and the Canadian province of Ontario to the northwest, New York to the north, and New Jersey to the east.
History
The area that is now Pennsylvania was first inhabited by Native Americans, including the Lenape, Susquehannock, Iroquois, Erie, Shawnee, and other tribes. The first European settlers in the area were the Dutch, who established a trading post in 1609. The area was later claimed by the English in 1664, and was part of the Province of Pennsylvania, one of the original Thirteen Colonies. The state was founded in 1776, and was one of the original thirteen states to ratify the United States Constitution in 1787.
Geography
Pennsylvania is located in the Northeastern and Mid-Atlantic regions of the United States. It is bordered by Delaware to the southeast, Maryland to the south, West Virginia to the southwest, Ohio to the west, Lake Erie and the Canadian province of Ontario to the northwest, New York to the north, and New Jersey to the east. The state has a total area of 46,055 square miles, making it the 33rd-largest state in the country.
The Appalachian Mountains run through the middle of the state, and the Allegheny Plateau covers the western part of the state. The Delaware River forms the eastern border of the state, and the Susquehanna River runs through the center of the state. The state also has numerous lakes, including Lake Erie, Lake Wallenpaupack, and Lake Nockamixon.
Economy
Pennsylvania has a diverse economy, with a mix of industries including manufacturing, agriculture, energy, technology, and services. The state is the second-largest producer of steel in the United States, and is home to several major corporations, including Hershey, PPG Industries, and GlaxoSmithKline.
Agriculture is an important part of the state’s economy, with the top crops being corn, soybeans, hay, and wheat. The state is also a major producer of dairy products, poultry, and eggs.
The energy industry is also a major part of the state’s economy, with the state being the third-largest producer of coal in the United States. The state is also a major producer of natural gas, and is home to several nuclear power plants.
Demographics
As of the 2010 U.S. Census, Pennsylvania had a population of 12,702,379, making it the 6th-most populous state in the country. The state has a population density of 284.3 people per square mile, making it the 19th-most densely populated state in the country.
The racial makeup of the state is 79.3% White, 11.7% Black or African American, 0.3% Native American, 3.2% Asian, 0.1% Pacific Islander, 2.7% from other races, and 3.0% from two or more races. The state has a large Hispanic or Latino population, making up 6.3% of the population.
The largest ancestry groups in the state are German (25.2%), Irish (17.2%), Italian (13.2%), English (10.2%), and Polish (7.2%). The state is also home to a large Amish population, with the largest concentration being in Lancaster County.
The median household income in the state is $54,817, and the median family income is $66,821. The poverty rate in the state is 12.3%, and the unemployment rate is 4.7%.
Common Questions
When was Pennsylvania Incorporated?
Pennsylvania was Incorporated into the Union on Dec 12, 1787.
What is the Total Area of Pennsylvania?
Total Area of Pennsylvania is 46,055 Square Miles.
What is the Total Land Area of Pennsylvania?
Total Land Area of Pennsylvania is 44,739 Square Miles.
What is the Total Water Area of Pennsylvania?
Total Water Area of Pennsylvania is 1,316 Square Miles.
What is the Average Elevation in Pennsylvania?
Average Elevation in Pennsylvania is 1,100 Feet.
What is the Highest Elevation in Pennsylvania?
Highest Elevation in Pennsylvania is 3,213 Feet.
What is the Lowest Elevation in Pennsylvania?
Lowest Elevation in Pennsylvania is 0 Feet.
What is the Population Density in Pennsylvania?
Population Density in Pennsylvania is 290.3 People per Square Mile.
What is Per Capita Income in Pennsylvania?
Per Capita income in Pennsylvania is $41,234.
What is the Median Family Income in Pennsylvania?
Median Family Income in Pennsylvania is $93,685.
What is the Median Household income in Pennsylvania?
Median Household Income in Pennsylvania is $73,170.
What is Income or Wage Gap in Pennsylvania?
Income or Wage Gap in Pennsylvania is 30.8%.
Women in Pennsylvania earn 69.2 cents for every dollar earned by a man.
What is Family Income Deficit in Pennsylvania?
Family Income Deficit in Pennsylvania is $10,914.
Families that are below poverty line in Pennsylvania earn $10,914 less on average than the poverty threshold level.
What is Inequality or Gini Index in Pennsylvania?
Inequality or Gini Index in Pennsylvania is 0.47.
What is the Total Population of Pennsylvania?
Total Population of Pennsylvania is 12,989,208.
What is the Total Male Population of Pennsylvania?
Total Male Population of Pennsylvania is 6,410,766.
What is the Total Female Population of Pennsylvania?
Total Female Population of Pennsylvania is 6,578,442.
What is the Ratio of Males per 100 Females in Pennsylvania?
There are 97.45 Males per 100 Females in Pennsylvania.
What is the Ratio of Females per 100 Males in Pennsylvania?
There are 102.62 Females per 100 Males in Pennsylvania.
What is the Median Population Age in Pennsylvania?
Median Population Age in Pennsylvania is 40.8 Years.
What is the Average Family Size in Pennsylvania
Average Family Size in Pennsylvania is 3.0 People.
What is the Average Household Size in Pennsylvania
Average Household Size in Pennsylvania is 2.4 People.
How Large is the Labor Force in Pennsylvania?
There are 6,691,863 People in the Labor Forcein in Pennsylvania.
What is the Percentage of People in the Labor Force in Pennsylvania?
62.9% of People are in the Labor Force in Pennsylvania.
What is the Unemployment Rate in Pennsylvania?
Unemployment Rate in Pennsylvania is 5.4%.