Clarendon County, SC Map & Demographics
Clarendon County Map
Clarendon County Overview
$26,290
PER CAPITA INCOME
$66,635
AVG FAMILY INCOME
$48,677
AVG HOUSEHOLD INCOME
29.2%
WAGE / INCOME GAP [ % ]
70.8¢/ $1
WAGE / INCOME GAP [ $ ]
$10,477
FAMILY INCOME DEFICIT
0.48
INEQUALITY / GINI INDEX
31,163
TOTAL POPULATION
15,383
MALE POPULATION
15,780
FEMALE POPULATION
97.48
MALES / 100 FEMALES
102.58
FEMALES / 100 MALES
45.5
MEDIAN AGE
3.3
AVG FAMILY SIZE
2.5
AVG HOUSEHOLD SIZE
12,405
LABOR FORCE [ PEOPLE ]
47.6%
PERCENT IN LABOR FORCE
10.1%
UNEMPLOYMENT RATE
Income in Clarendon County
Income Overview in Clarendon County
Per Capita Income in Clarendon County is $26,290, while median incomes of families and households are $66,635 and $48,677 respectively.
| Characteristic | Number | Measure |
| Per Capita Income | 31,163 | $26,290 |
| Median Family Income | 7,503 | $66,635 |
| Mean Family Income | 7,503 | $80,359 |
| Median Household Income | 11,684 | $48,677 |
| Mean Household Income | 11,684 | $65,427 |
| Income Deficit | 7,503 | $10,477 |
| Wage / Income Gap (%) | 31,163 | 29.16% |
| Wage / Income Gap ($) | 31,163 | 70.84¢ per $1 |
| Gini / Inequality Index | 31,163 | 0.48 |
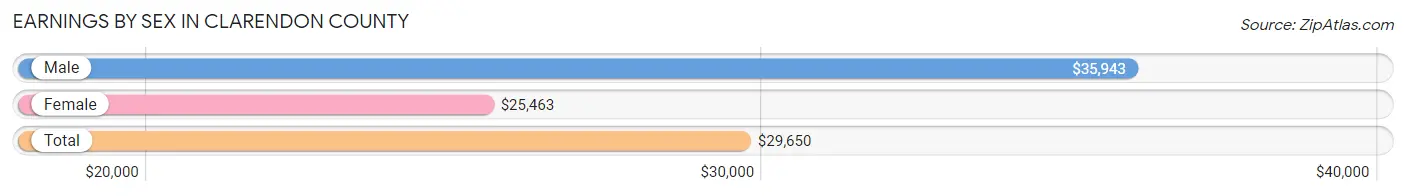
Earnings by Sex in Clarendon County
Average Earnings in Clarendon County are $29,650, $35,943 for men and $25,463 for women, a difference of 29.2%.
| Sex | Number | Average Earnings |
| Male | 6,340 (49.4%) | $35,943 |
| Female | 6,505 (50.6%) | $25,463 |
| Total | 12,845 (100.0%) | $29,650 |
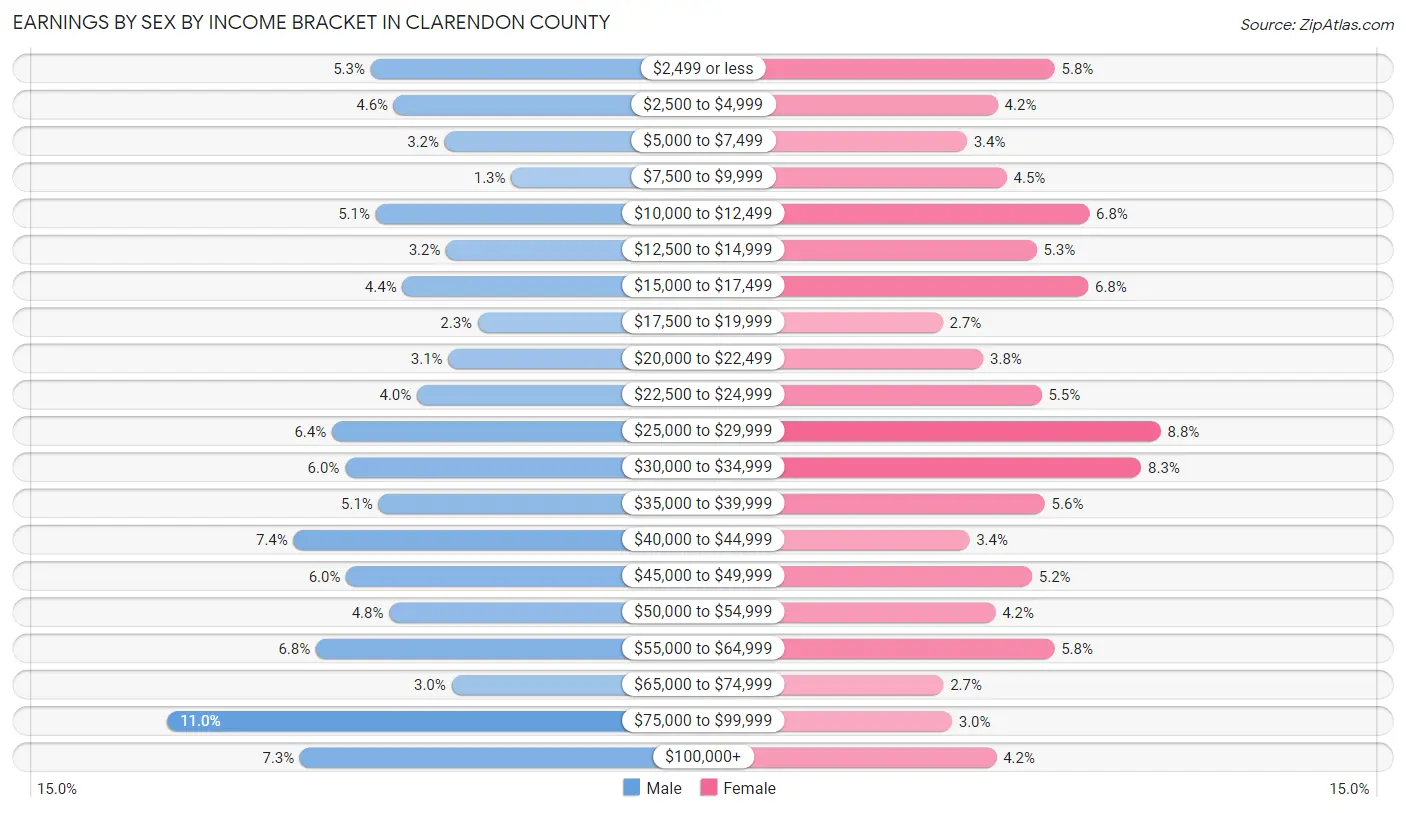
Earnings by Sex by Income Bracket in Clarendon County
The most common earnings brackets in Clarendon County are $75,000 to $99,999 for men (697 | 11.0%) and $25,000 to $29,999 for women (574 | 8.8%).
| Income | Male | Female |
| $2,499 or less | 334 (5.3%) | 380 (5.8%) |
| $2,500 to $4,999 | 293 (4.6%) | 276 (4.2%) |
| $5,000 to $7,499 | 202 (3.2%) | 219 (3.4%) |
| $7,500 to $9,999 | 84 (1.3%) | 292 (4.5%) |
| $10,000 to $12,499 | 325 (5.1%) | 443 (6.8%) |
| $12,500 to $14,999 | 200 (3.2%) | 347 (5.3%) |
| $15,000 to $17,499 | 278 (4.4%) | 441 (6.8%) |
| $17,500 to $19,999 | 143 (2.3%) | 175 (2.7%) |
| $20,000 to $22,499 | 196 (3.1%) | 249 (3.8%) |
| $22,500 to $24,999 | 252 (4.0%) | 356 (5.5%) |
| $25,000 to $29,999 | 403 (6.4%) | 574 (8.8%) |
| $30,000 to $34,999 | 380 (6.0%) | 538 (8.3%) |
| $35,000 to $39,999 | 320 (5.1%) | 362 (5.6%) |
| $40,000 to $44,999 | 472 (7.4%) | 224 (3.4%) |
| $45,000 to $49,999 | 378 (6.0%) | 338 (5.2%) |
| $50,000 to $54,999 | 301 (4.8%) | 271 (4.2%) |
| $55,000 to $64,999 | 432 (6.8%) | 379 (5.8%) |
| $65,000 to $74,999 | 190 (3.0%) | 176 (2.7%) |
| $75,000 to $99,999 | 697 (11.0%) | 192 (2.9%) |
| $100,000+ | 460 (7.3%) | 273 (4.2%) |
| Total | 6,340 (100.0%) | 6,505 (100.0%) |
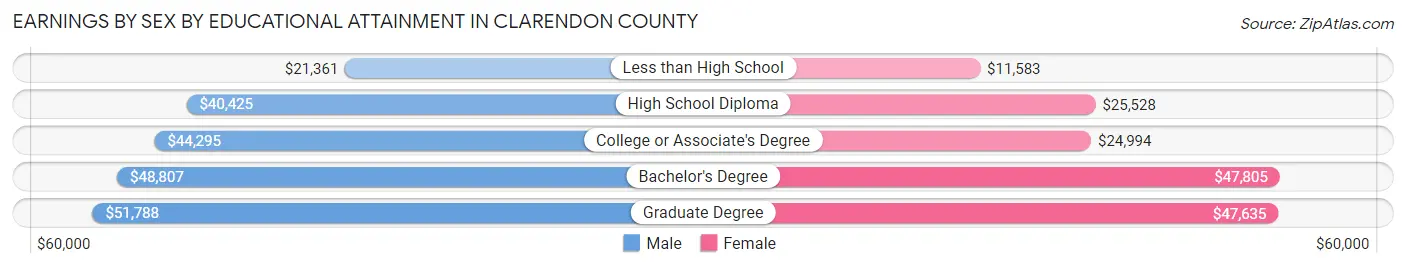
Earnings by Sex by Educational Attainment in Clarendon County
Average earnings in Clarendon County are $40,466 for men and $26,784 for women, a difference of 33.8%. Men with an educational attainment of graduate degree enjoy the highest average annual earnings of $51,788, while those with less than high school education earn the least with $21,361. Women with an educational attainment of bachelor's degree earn the most with the average annual earnings of $47,805, while those with less than high school education have the smallest earnings of $11,583.
| Educational Attainment | Male Income | Female Income |
| Less than High School | $21,361 | $11,583 |
| High School Diploma | $40,425 | $25,528 |
| College or Associate's Degree | $44,295 | $24,994 |
| Bachelor's Degree | $48,807 | $47,805 |
| Graduate Degree | $51,788 | $47,635 |
| Total | $40,466 | $26,784 |
Family Income in Clarendon County
Family Income Brackets in Clarendon County
According to the Clarendon County family income data, there are 1,508 families falling into the $50,000 to $74,999 income range, which is the most common income bracket and makes up 20.1% of all families. Conversely, the $200,000+ income bracket is the least frequent group with only 330 families (4.4%) belonging to this category.
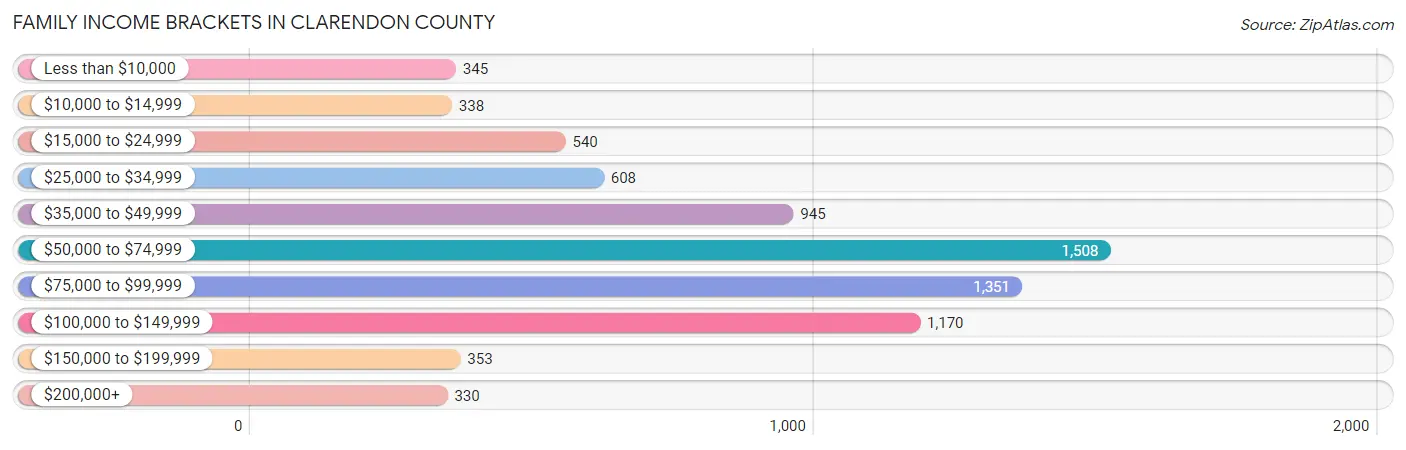
| Income Bracket | # Families | % Families |
| Less than $10,000 | 345 | 4.6% |
| $10,000 to $14,999 | 338 | 4.5% |
| $15,000 to $24,999 | 540 | 7.2% |
| $25,000 to $34,999 | 608 | 8.1% |
| $35,000 to $49,999 | 945 | 12.6% |
| $50,000 to $74,999 | 1,508 | 20.1% |
| $75,000 to $99,999 | 1,351 | 18.0% |
| $100,000 to $149,999 | 1,170 | 15.6% |
| $150,000 to $199,999 | 353 | 4.7% |
| $200,000+ | 330 | 4.4% |
Family Income by Famaliy Size in Clarendon County
4-person families (1,286 | 17.1%) account for the highest median family income in Clarendon County with $86,791 per family, while 2-person families (3,775 | 50.3%) have the highest median income of $28,314 per family member.
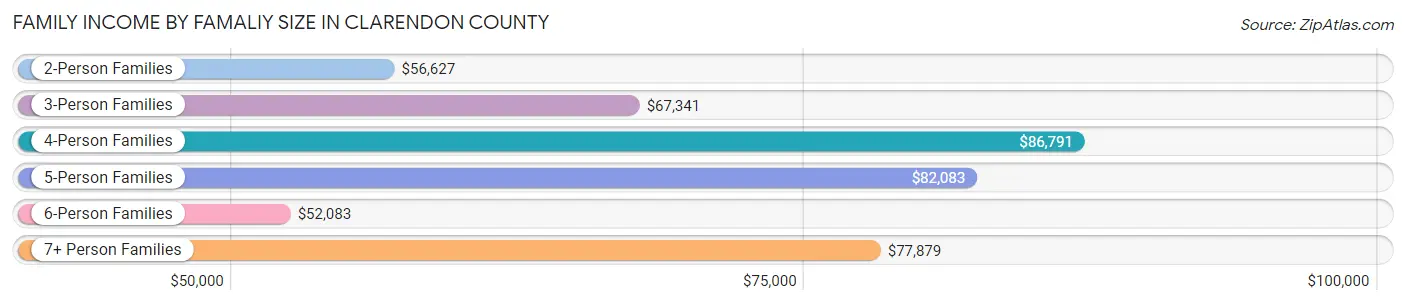
| Income Bracket | # Families | Median Income |
| 2-Person Families | 3,775 (50.3%) | $56,627 |
| 3-Person Families | 1,600 (21.3%) | $67,341 |
| 4-Person Families | 1,286 (17.1%) | $86,791 |
| 5-Person Families | 454 (6.0%) | $82,083 |
| 6-Person Families | 306 (4.1%) | $52,083 |
| 7+ Person Families | 82 (1.1%) | $77,879 |
| Total | 7,503 (100.0%) | $66,635 |
Family Income by Number of Earners in Clarendon County
The median family income in Clarendon County is $66,635, with families comprising 3+ earners (602) having the highest median family income of $100,705, while families with no earners (1,920) have the lowest median family income of $36,201, accounting for 8.0% and 25.6% of families, respectively.
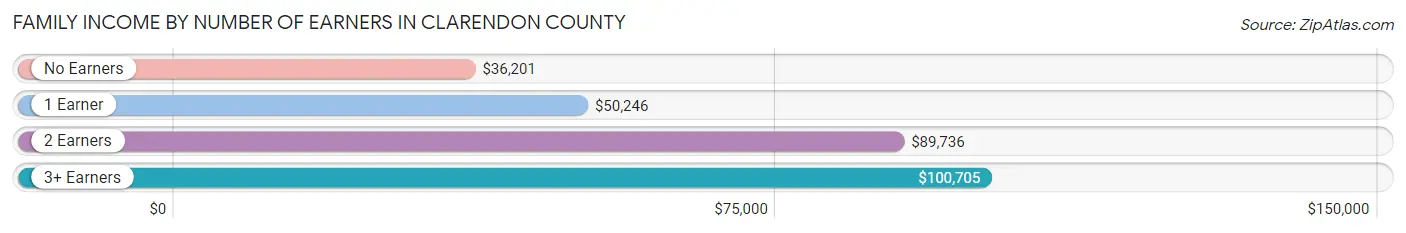
| Number of Earners | # Families | Median Income |
| No Earners | 1,920 (25.6%) | $36,201 |
| 1 Earner | 2,684 (35.8%) | $50,246 |
| 2 Earners | 2,297 (30.6%) | $89,736 |
| 3+ Earners | 602 (8.0%) | $100,705 |
| Total | 7,503 (100.0%) | $66,635 |
Household Income in Clarendon County
Household Income Brackets in Clarendon County
With 2,033 households falling in the category, the $50,000 to $74,999 income range is the most frequent in Clarendon County, accounting for 17.4% of all households. In contrast, only 374 households (3.2%) fall into the $200,000+ income bracket, making it the least populous group.
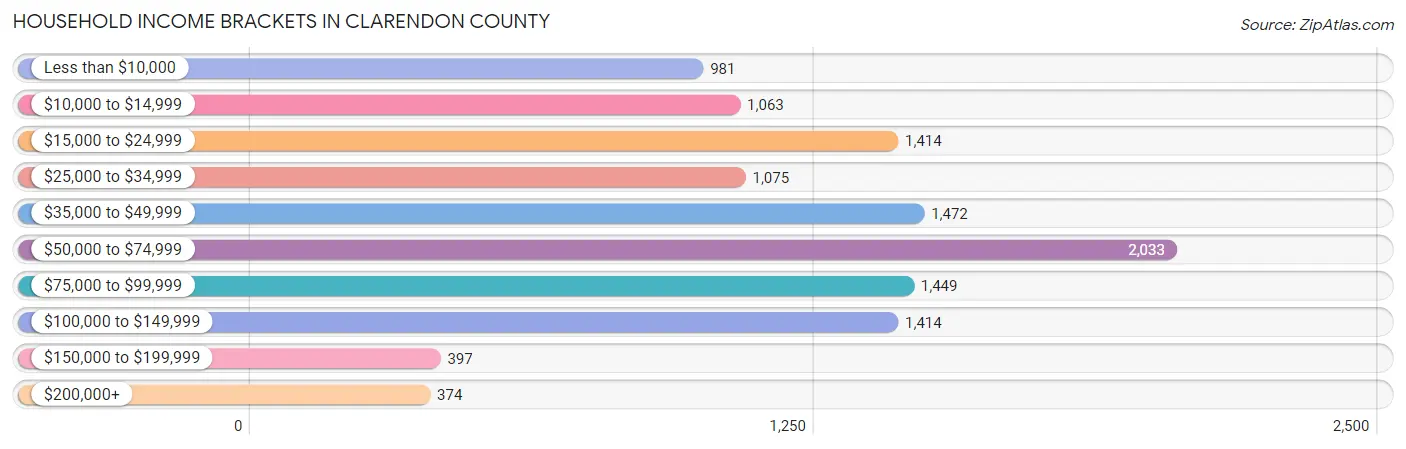
| Income Bracket | # Households | % Households |
| Less than $10,000 | 981 | 8.4% |
| $10,000 to $14,999 | 1,063 | 9.1% |
| $15,000 to $24,999 | 1,414 | 12.1% |
| $25,000 to $34,999 | 1,075 | 9.2% |
| $35,000 to $49,999 | 1,472 | 12.6% |
| $50,000 to $74,999 | 2,033 | 17.4% |
| $75,000 to $99,999 | 1,449 | 12.4% |
| $100,000 to $149,999 | 1,414 | 12.1% |
| $150,000 to $199,999 | 397 | 3.4% |
| $200,000+ | 374 | 3.2% |
Household Income by Householder Age in Clarendon County
The median household income in Clarendon County is $48,677, with the highest median household income of $55,381 found in the 25 to 44 years age bracket for the primary householder. A total of 2,196 households (18.8%) fall into this category. Meanwhile, the 65+ years age bracket for the primary householder has the lowest median household income of $41,656, with 4,968 households (42.5%) in this group.
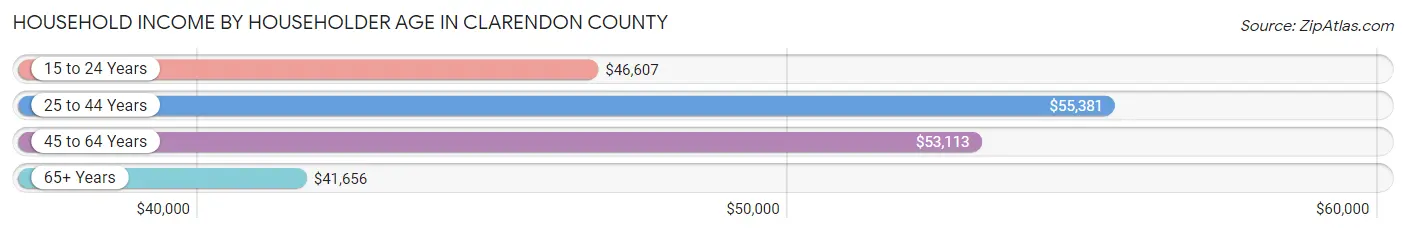
| Income Bracket | # Households | Median Income |
| 15 to 24 Years | 207 (1.8%) | $46,607 |
| 25 to 44 Years | 2,196 (18.8%) | $55,381 |
| 45 to 64 Years | 4,313 (36.9%) | $53,113 |
| 65+ Years | 4,968 (42.5%) | $41,656 |
| Total | 11,684 (100.0%) | $48,677 |
Poverty in Clarendon County
Income Below Poverty by Sex and Age in Clarendon County
With 14.3% poverty level for males and 24.2% for females among the residents of Clarendon County, 5 year old males and under 5 year old females are the most vulnerable to poverty, with 33 males (33.7%) and 266 females (39.9%) in their respective age groups living below the poverty level.
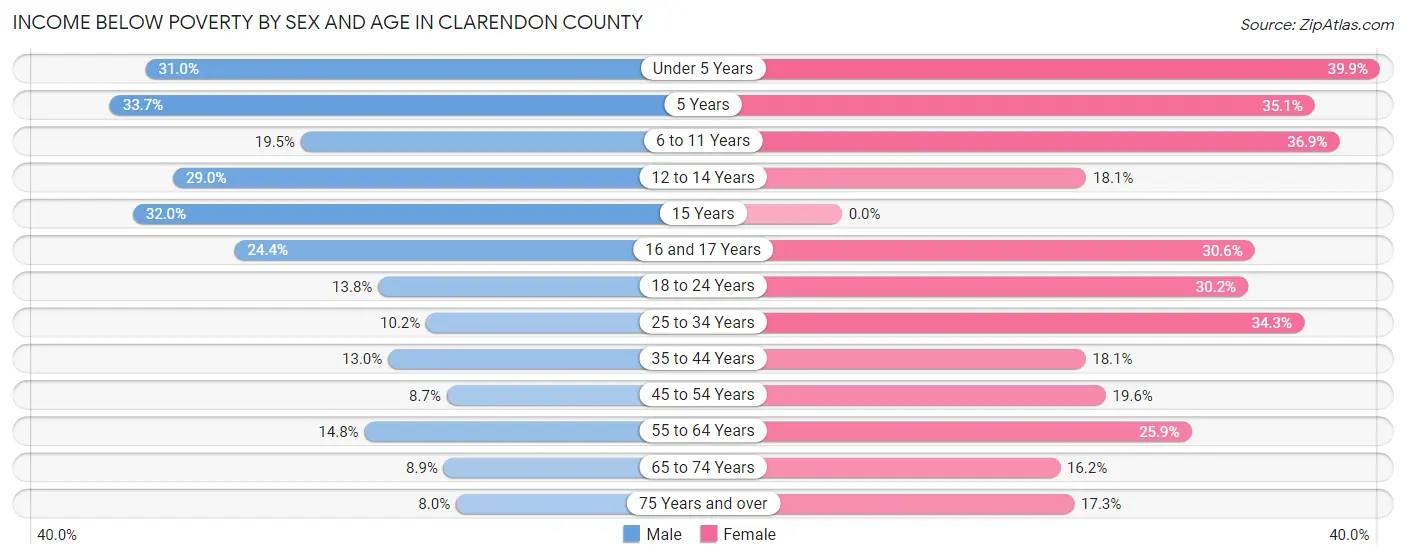
| Age Bracket | Male | Female |
| Under 5 Years | 223 (31.0%) | 266 (39.9%) |
| 5 Years | 33 (33.7%) | 53 (35.1%) |
| 6 to 11 Years | 191 (19.5%) | 379 (36.9%) |
| 12 to 14 Years | 177 (29.0%) | 72 (18.1%) |
| 15 Years | 62 (32.0%) | 0 (0.0%) |
| 16 and 17 Years | 101 (24.4%) | 110 (30.6%) |
| 18 to 24 Years | 182 (13.8%) | 322 (30.1%) |
| 25 to 34 Years | 152 (10.2%) | 615 (34.3%) |
| 35 to 44 Years | 172 (13.0%) | 302 (18.1%) |
| 45 to 54 Years | 138 (8.7%) | 352 (19.6%) |
| 55 to 64 Years | 321 (14.8%) | 643 (25.9%) |
| 65 to 74 Years | 177 (8.9%) | 401 (16.2%) |
| 75 Years and over | 100 (8.0%) | 283 (17.2%) |
| Total | 2,029 (14.3%) | 3,798 (24.2%) |
Income Above Poverty by Sex and Age in Clarendon County
According to the poverty statistics in Clarendon County, males aged 75 years and over and females aged 15 years are the age groups that are most secure financially, with 92.0% of males and 100.0% of females in these age groups living above the poverty line.
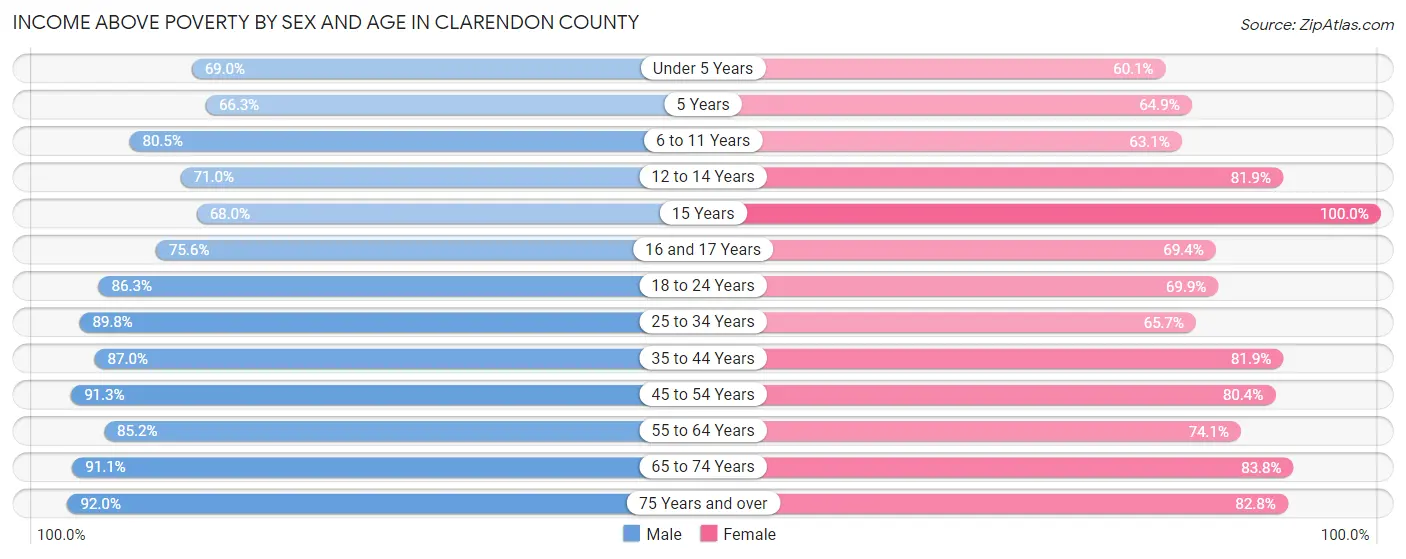
| Age Bracket | Male | Female |
| Under 5 Years | 496 (69.0%) | 400 (60.1%) |
| 5 Years | 65 (66.3%) | 98 (64.9%) |
| 6 to 11 Years | 789 (80.5%) | 647 (63.1%) |
| 12 to 14 Years | 434 (71.0%) | 325 (81.9%) |
| 15 Years | 132 (68.0%) | 157 (100.0%) |
| 16 and 17 Years | 313 (75.6%) | 249 (69.4%) |
| 18 to 24 Years | 1,142 (86.3%) | 746 (69.9%) |
| 25 to 34 Years | 1,340 (89.8%) | 1,178 (65.7%) |
| 35 to 44 Years | 1,150 (87.0%) | 1,368 (81.9%) |
| 45 to 54 Years | 1,456 (91.3%) | 1,445 (80.4%) |
| 55 to 64 Years | 1,852 (85.2%) | 1,836 (74.1%) |
| 65 to 74 Years | 1,816 (91.1%) | 2,074 (83.8%) |
| 75 Years and over | 1,154 (92.0%) | 1,358 (82.8%) |
| Total | 12,139 (85.7%) | 11,881 (75.8%) |
Income Below Poverty Among Married-Couple Families in Clarendon County
The poverty statistics for married-couple families in Clarendon County show that 5.9% or 303 of the total 5,125 families live below the poverty line. Families with 3 or 4 children have the highest poverty rate of 8.6%, comprising of 32 families. On the other hand, families with 5 or more children have the lowest poverty rate of 0.0%, which includes 0 families.
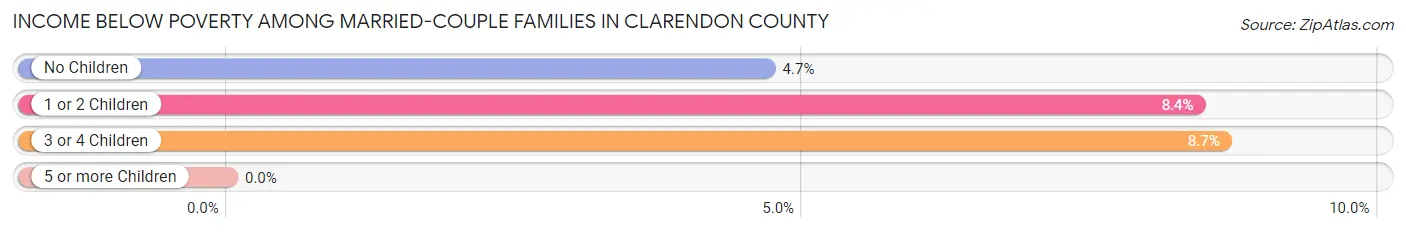
| Children | Above Poverty | Below Poverty |
| No Children | 3,276 (95.3%) | 161 (4.7%) |
| 1 or 2 Children | 1,197 (91.6%) | 110 (8.4%) |
| 3 or 4 Children | 338 (91.3%) | 32 (8.6%) |
| 5 or more Children | 11 (100.0%) | 0 (0.0%) |
| Total | 4,822 (94.1%) | 303 (5.9%) |
Income Below Poverty Among Single-Parent Households in Clarendon County
According to the poverty data in Clarendon County, 17.7% or 79 single-father households and 38.2% or 737 single-mother households are living below the poverty line. Among single-father households, those with 3 or 4 children have the highest poverty rate, with 23 households (69.7%) experiencing poverty. Likewise, among single-mother households, those with 3 or 4 children have the highest poverty rate, with 115 households (75.7%) falling below the poverty line.
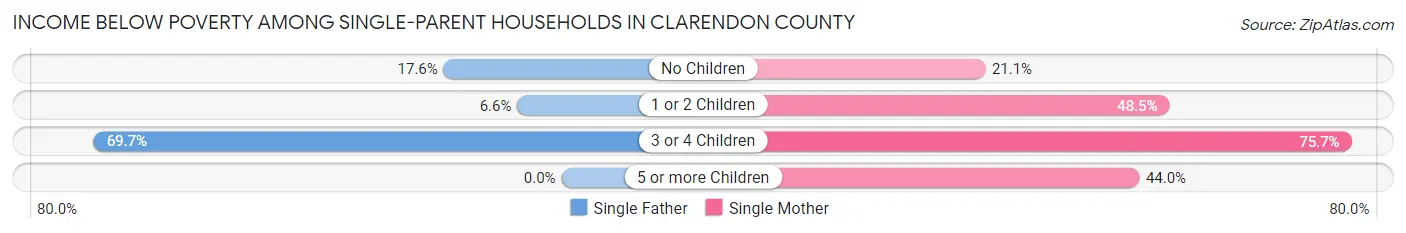
| Children | Single Father | Single Mother |
| No Children | 46 (17.6%) | 184 (21.0%) |
| 1 or 2 Children | 10 (6.6%) | 427 (48.5%) |
| 3 or 4 Children | 23 (69.7%) | 115 (75.7%) |
| 5 or more Children | 0 (0.0%) | 11 (44.0%) |
| Total | 79 (17.7%) | 737 (38.2%) |
Income Below Poverty Among Married-Couple vs Single-Parent Households in Clarendon County
The poverty data for Clarendon County shows that 303 of the married-couple family households (5.9%) and 816 of the single-parent households (34.3%) are living below the poverty level. Within the married-couple family households, those with 3 or 4 children have the highest poverty rate, with 32 households (8.6%) falling below the poverty line. Among the single-parent households, those with 3 or 4 children have the highest poverty rate, with 138 household (74.6%) living below poverty.
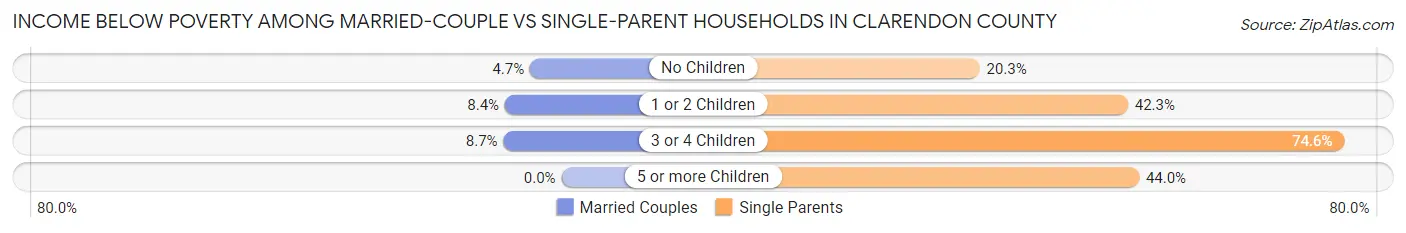
| Children | Married-Couple Families | Single-Parent Households |
| No Children | 161 (4.7%) | 230 (20.3%) |
| 1 or 2 Children | 110 (8.4%) | 437 (42.3%) |
| 3 or 4 Children | 32 (8.6%) | 138 (74.6%) |
| 5 or more Children | 0 (0.0%) | 11 (44.0%) |
| Total | 303 (5.9%) | 816 (34.3%) |
Race in Clarendon County
The most populous races in Clarendon County are White / Caucasian (15,470 | 49.6%), Black / African American (14,202 | 45.6%), and Hispanic or Latino (1,049 | 3.4%).

| Race | # Population | % Population |
| Asian | 242 | 0.8% |
| Black / African American | 14,202 | 45.6% |
| Hawaiian / Pacific | 0 | 0.0% |
| Hispanic or Latino | 1,049 | 3.4% |
| Native / Alaskan | 41 | 0.1% |
| White / Caucasian | 15,470 | 49.6% |
| Two or more Races | 766 | 2.5% |
| Some other Race | 442 | 1.4% |
| Total | 31,163 | 100.0% |
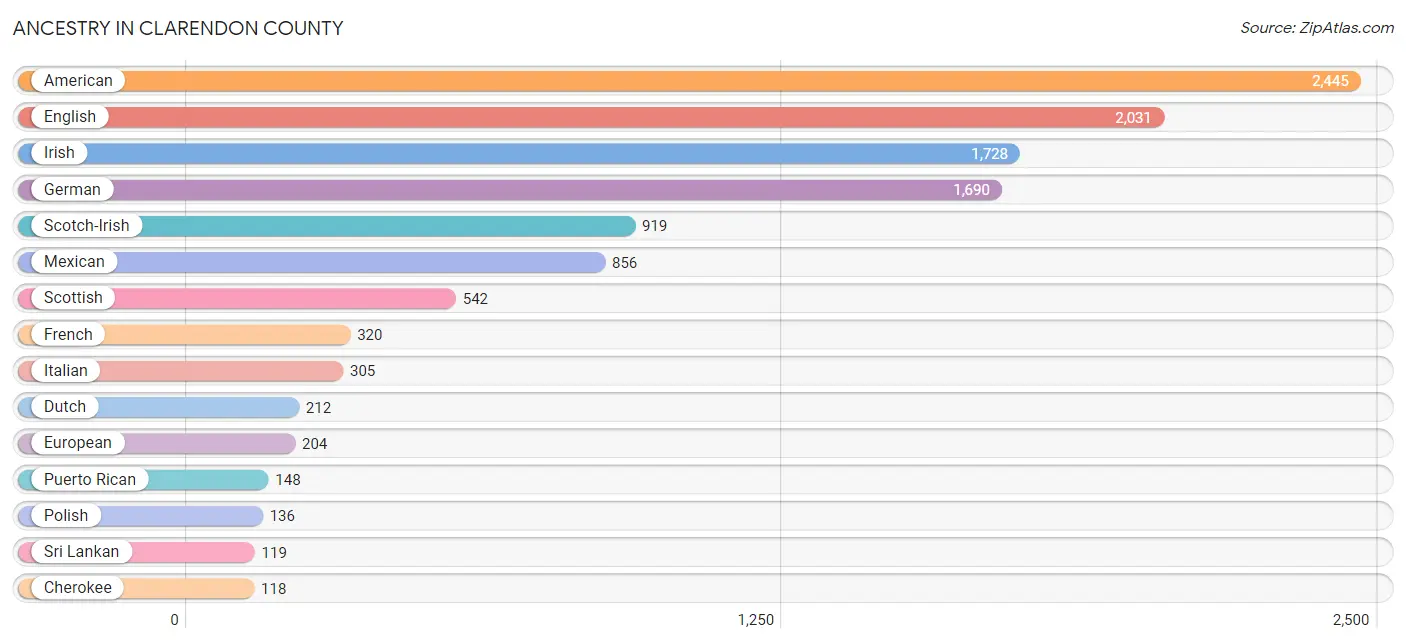
Ancestry in Clarendon County
The most populous ancestries reported in Clarendon County are American (2,445 | 7.9%), English (2,031 | 6.5%), Irish (1,728 | 5.6%), German (1,690 | 5.4%), and Scotch-Irish (919 | 2.9%), together accounting for 28.3% of all Clarendon County residents.
| Ancestry | # Population | % Population |
| African | 96 | 0.3% |
| American | 2,445 | 7.9% |
| Apache | 5 | 0.0% |
| Arab | 37 | 0.1% |
| Argentinean | 4 | 0.0% |
| Australian | 1 | 0.0% |
| Austrian | 22 | 0.1% |
| Bhutanese | 4 | 0.0% |
| Blackfeet | 32 | 0.1% |
| British | 112 | 0.4% |
| Burmese | 43 | 0.1% |
| Canadian | 2 | 0.0% |
| Central American | 5 | 0.0% |
| Central American Indian | 14 | 0.0% |
| Cherokee | 118 | 0.4% |
| Croatian | 4 | 0.0% |
| Cuban | 14 | 0.0% |
| Czech | 69 | 0.2% |
| Danish | 12 | 0.0% |
| Dutch | 212 | 0.7% |
| Dutch West Indian | 5 | 0.0% |
| Eastern European | 5 | 0.0% |
| English | 2,031 | 6.5% |
| European | 204 | 0.6% |
| Finnish | 17 | 0.1% |
| French | 320 | 1.0% |
| French Canadian | 14 | 0.0% |
| German | 1,690 | 5.4% |
| Greek | 7 | 0.0% |
| Guatemalan | 5 | 0.0% |
| Haitian | 3 | 0.0% |
| Hungarian | 79 | 0.3% |
| Indian (Asian) | 50 | 0.2% |
| Irish | 1,728 | 5.6% |
| Italian | 305 | 1.0% |
| Jamaican | 49 | 0.2% |
| Lebanese | 37 | 0.1% |
| Lithuanian | 14 | 0.0% |
| Macedonian | 2 | 0.0% |
| Mexican | 856 | 2.8% |
| Native Hawaiian | 2 | 0.0% |
| Nigerian | 2 | 0.0% |
| Norwegian | 13 | 0.0% |
| Ottawa | 1 | 0.0% |
| Pennsylvania German | 14 | 0.0% |
| Peruvian | 3 | 0.0% |
| Polish | 136 | 0.4% |
| Portuguese | 2 | 0.0% |
| Potawatomi | 13 | 0.0% |
| Puerto Rican | 148 | 0.5% |
| Russian | 46 | 0.2% |
| Scandinavian | 5 | 0.0% |
| Scotch-Irish | 919 | 2.9% |
| Scottish | 542 | 1.7% |
| South American | 7 | 0.0% |
| Spaniard | 3 | 0.0% |
| Spanish | 16 | 0.1% |
| Sri Lankan | 119 | 0.4% |
| Subsaharan African | 96 | 0.3% |
| Swedish | 37 | 0.1% |
| Swiss | 10 | 0.0% |
| Thai | 33 | 0.1% |
| Trinidadian and Tobagonian | 6 | 0.0% |
| Turkish | 5 | 0.0% |
| Ukrainian | 6 | 0.0% |
| Welsh | 44 | 0.1% |
| West Indian | 12 | 0.0% | View All 67 Rows |
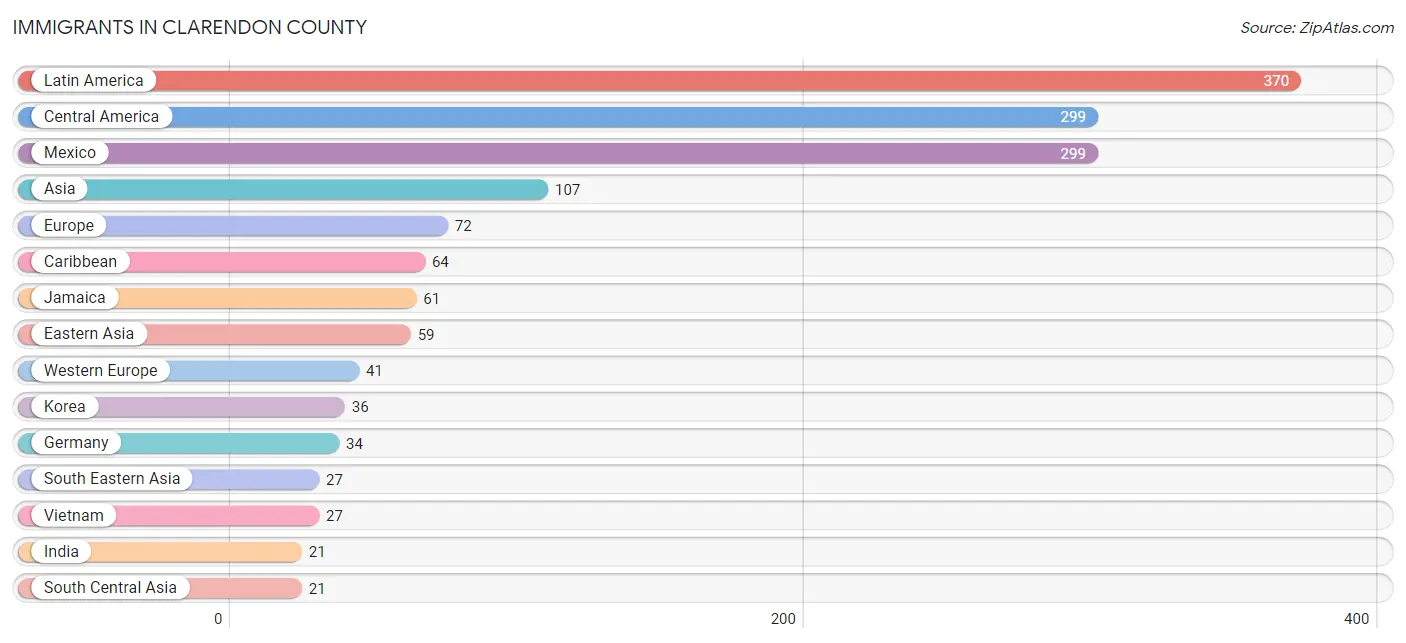
Immigrants in Clarendon County
The most numerous immigrant groups reported in Clarendon County came from Latin America (370 | 1.2%), Central America (299 | 1.0%), Mexico (299 | 1.0%), Asia (107 | 0.3%), and Europe (72 | 0.2%), together accounting for 3.7% of all Clarendon County residents.
| Immigration Origin | # Population | % Population |
| Asia | 107 | 0.3% |
| Bahamas | 3 | 0.0% |
| Canada | 11 | 0.0% |
| Caribbean | 64 | 0.2% |
| Central America | 299 | 1.0% |
| China | 19 | 0.1% |
| Eastern Asia | 59 | 0.2% |
| England | 15 | 0.1% |
| Europe | 72 | 0.2% |
| Germany | 34 | 0.1% |
| India | 21 | 0.1% |
| Jamaica | 61 | 0.2% |
| Japan | 4 | 0.0% |
| Korea | 36 | 0.1% |
| Latin America | 370 | 1.2% |
| Mexico | 299 | 1.0% |
| Northern Europe | 20 | 0.1% |
| Peru | 3 | 0.0% |
| Portugal | 11 | 0.0% |
| South America | 7 | 0.0% |
| South Central Asia | 21 | 0.1% |
| South Eastern Asia | 27 | 0.1% |
| Southern Europe | 11 | 0.0% |
| Switzerland | 7 | 0.0% |
| Taiwan | 2 | 0.0% |
| Venezuela | 4 | 0.0% |
| Vietnam | 27 | 0.1% |
| Western Europe | 41 | 0.1% | View All 28 Rows |
Sex and Age in Clarendon County
Sex and Age in Clarendon County
The most populous age groups in Clarendon County are 60 to 64 Years (1,215 | 7.9%) for men and 60 to 64 Years (1,427 | 9.0%) for women.
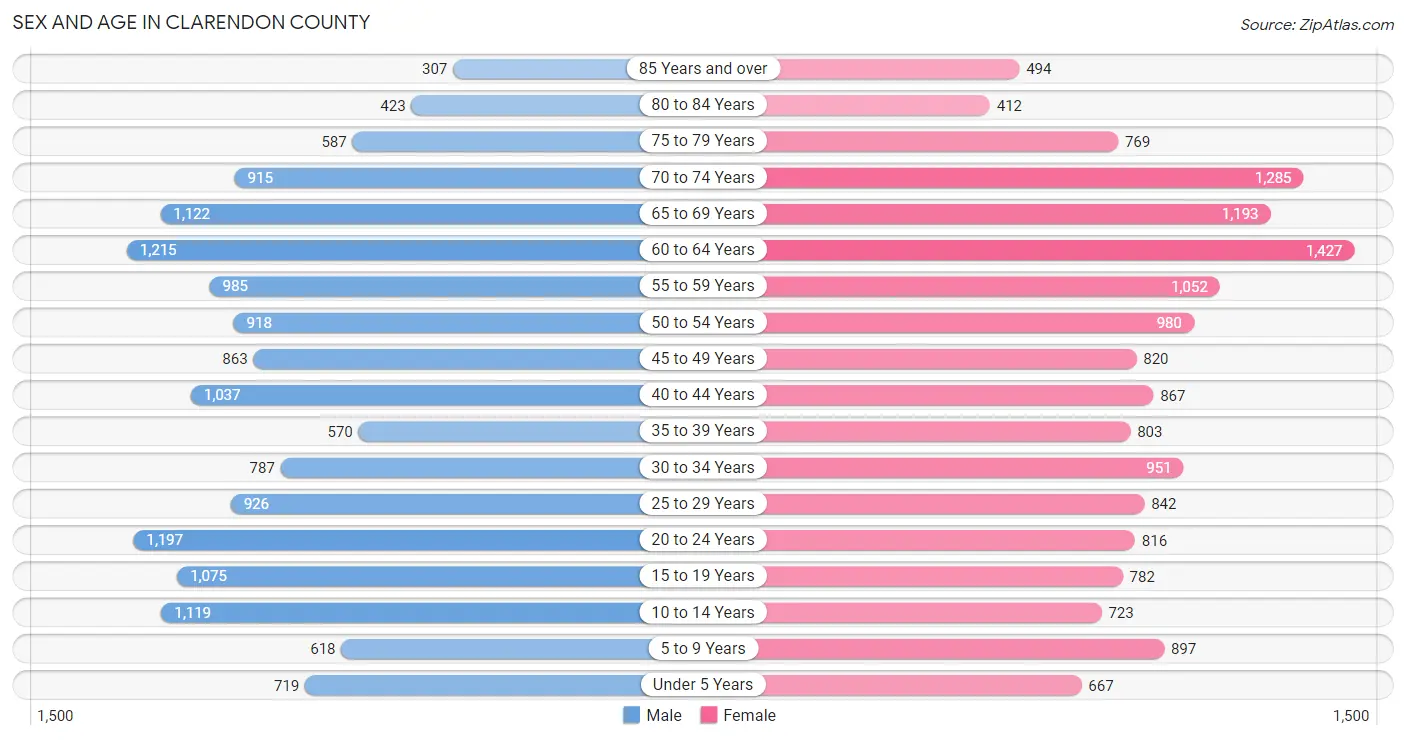
| Age Bracket | Male | Female |
| Under 5 Years | 719 (4.7%) | 667 (4.2%) |
| 5 to 9 Years | 618 (4.0%) | 897 (5.7%) |
| 10 to 14 Years | 1,119 (7.3%) | 723 (4.6%) |
| 15 to 19 Years | 1,075 (7.0%) | 782 (5.0%) |
| 20 to 24 Years | 1,197 (7.8%) | 816 (5.2%) |
| 25 to 29 Years | 926 (6.0%) | 842 (5.3%) |
| 30 to 34 Years | 787 (5.1%) | 951 (6.0%) |
| 35 to 39 Years | 570 (3.7%) | 803 (5.1%) |
| 40 to 44 Years | 1,037 (6.7%) | 867 (5.5%) |
| 45 to 49 Years | 863 (5.6%) | 820 (5.2%) |
| 50 to 54 Years | 918 (6.0%) | 980 (6.2%) |
| 55 to 59 Years | 985 (6.4%) | 1,052 (6.7%) |
| 60 to 64 Years | 1,215 (7.9%) | 1,427 (9.0%) |
| 65 to 69 Years | 1,122 (7.3%) | 1,193 (7.6%) |
| 70 to 74 Years | 915 (5.9%) | 1,285 (8.1%) |
| 75 to 79 Years | 587 (3.8%) | 769 (4.9%) |
| 80 to 84 Years | 423 (2.8%) | 412 (2.6%) |
| 85 Years and over | 307 (2.0%) | 494 (3.1%) |
| Total | 15,383 (100.0%) | 15,780 (100.0%) |
Families and Households in Clarendon County
Median Family Size in Clarendon County
The median family size in Clarendon County is 3.26 persons per family, with single female/mother families (1,931 | 25.7%) accounting for the largest median family size of 3.7 persons per family. On the other hand, married-couple families (5,125 | 68.3%) represent the smallest median family size with 3.07 persons per family.
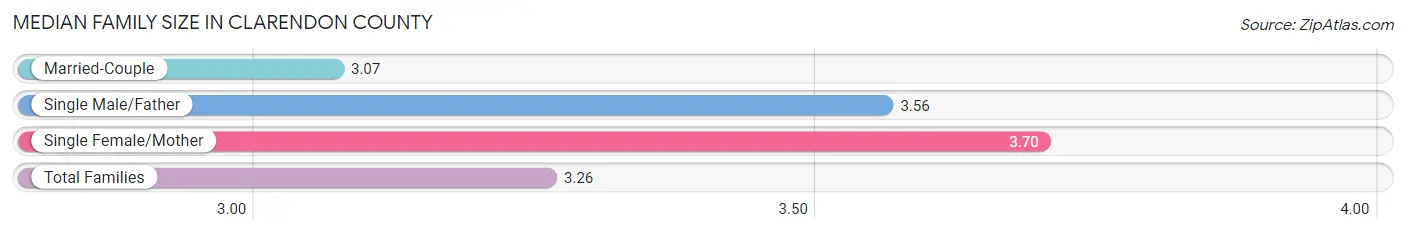
| Family Type | # Families | Family Size |
| Married-Couple | 5,125 (68.3%) | 3.07 |
| Single Male/Father | 447 (6.0%) | 3.56 |
| Single Female/Mother | 1,931 (25.7%) | 3.70 |
| Total Families | 7,503 (100.0%) | 3.26 |
Median Household Size in Clarendon County
The median household size in Clarendon County is 2.55 persons per household, with single female/mother households (1,931 | 16.5%) accounting for the largest median household size of 3.87 persons per household. non-family households (4,181 | 35.8%) represent the smallest median household size with 1.15 persons per household.
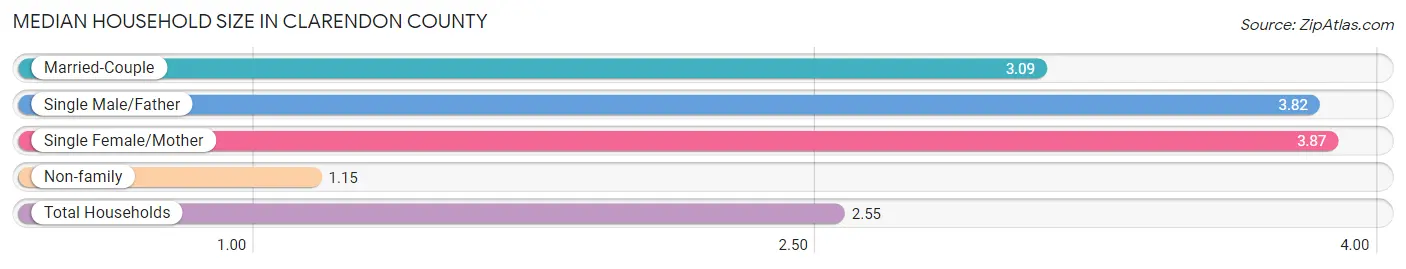
| Household Type | # Households | Household Size |
| Married-Couple | 5,125 (43.9%) | 3.09 |
| Single Male/Father | 447 (3.8%) | 3.82 |
| Single Female/Mother | 1,931 (16.5%) | 3.87 |
| Non-family | 4,181 (35.8%) | 1.15 |
| Total Households | 11,684 (100.0%) | 2.55 |
Household Size by Marriage Status in Clarendon County
Out of a total of 11,684 households in Clarendon County, 7,503 (64.2%) are family households, while 4,181 (35.8%) are nonfamily households. The most numerous type of family households are 2-person households, comprising 3,668, and the most common type of nonfamily households are 1-person households, comprising 3,775.
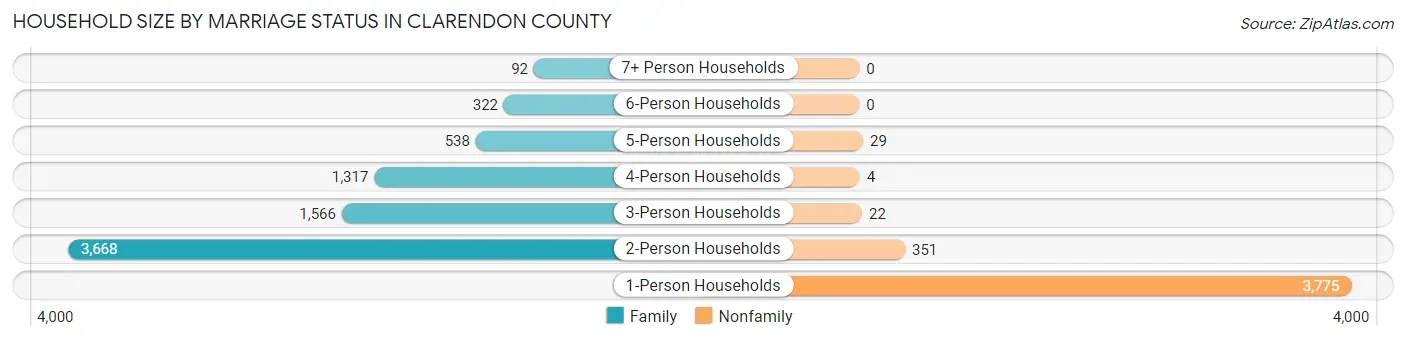
| Household Size | Family Households | Nonfamily Households |
| 1-Person Households | - | 3,775 (32.3%) |
| 2-Person Households | 3,668 (31.4%) | 351 (3.0%) |
| 3-Person Households | 1,566 (13.4%) | 22 (0.2%) |
| 4-Person Households | 1,317 (11.3%) | 4 (0.0%) |
| 5-Person Households | 538 (4.6%) | 29 (0.3%) |
| 6-Person Households | 322 (2.8%) | 0 (0.0%) |
| 7+ Person Households | 92 (0.8%) | 0 (0.0%) |
| Total | 7,503 (64.2%) | 4,181 (35.8%) |
Female Fertility in Clarendon County
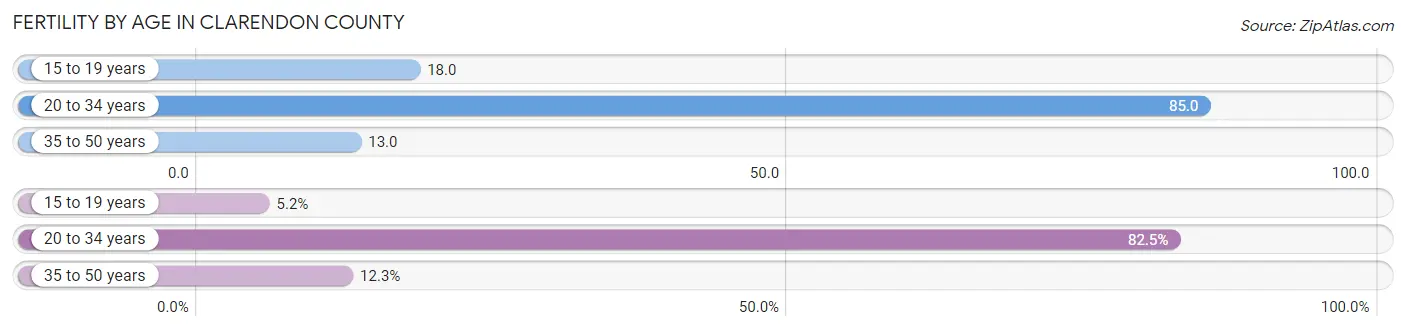
Fertility by Age in Clarendon County
Average fertility rate in Clarendon County is 44.0 births per 1,000 women. Women in the age bracket of 20 to 34 years have the highest fertility rate with 85.0 births per 1,000 women. Women in the age bracket of 20 to 34 years acount for 82.5% of all women with births.
| Age Bracket | Women with Births | Births / 1,000 Women |
| 15 to 19 years | 14 (5.2%) | 18.0 |
| 20 to 34 years | 221 (82.5%) | 85.0 |
| 35 to 50 years | 33 (12.3%) | 13.0 |
| Total | 268 (100.0%) | 44.0 |
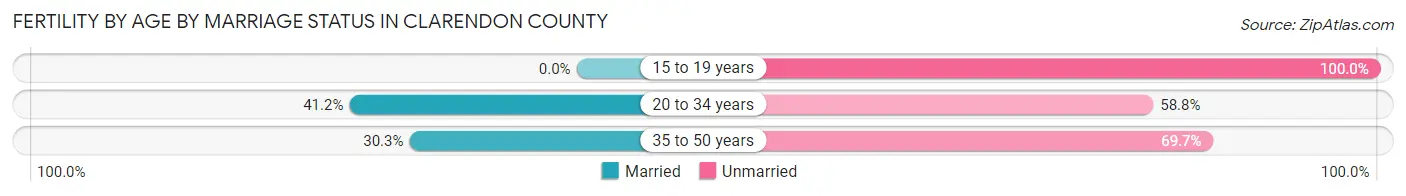
Fertility by Age by Marriage Status in Clarendon County
37.7% of women with births (268) in Clarendon County are married. The highest percentage of unmarried women with births falls into 15 to 19 years age bracket with 100.0% of them unmarried at the time of birth, while the lowest percentage of unmarried women with births belong to 20 to 34 years age bracket with 58.8% of them unmarried.
| Age Bracket | Married | Unmarried |
| 15 to 19 years | 0 (0.0%) | 14 (100.0%) |
| 20 to 34 years | 91 (41.2%) | 130 (58.8%) |
| 35 to 50 years | 10 (30.3%) | 23 (69.7%) |
| Total | 101 (37.7%) | 167 (62.3%) |
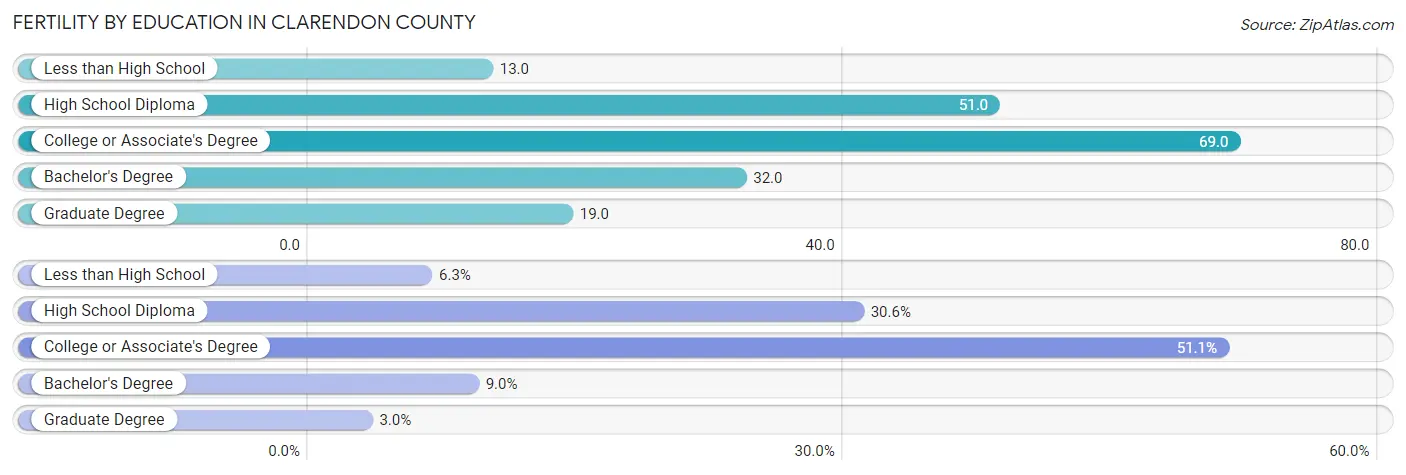
Fertility by Education in Clarendon County
Average fertility rate in Clarendon County is 44.0 births per 1,000 women. Women with the education attainment of college or associate's degree have the highest fertility rate of 69.0 births per 1,000 women, while women with the education attainment of less than high school have the lowest fertility at 13.0 births per 1,000 women. Women with the education attainment of college or associate's degree represent 51.1% of all women with births.
| Educational Attainment | Women with Births | Births / 1,000 Women |
| Less than High School | 17 (6.3%) | 13.0 |
| High School Diploma | 82 (30.6%) | 51.0 |
| College or Associate's Degree | 137 (51.1%) | 69.0 |
| Bachelor's Degree | 24 (9.0%) | 32.0 |
| Graduate Degree | 8 (3.0%) | 19.0 |
| Total | 268 (100.0%) | 44.0 |
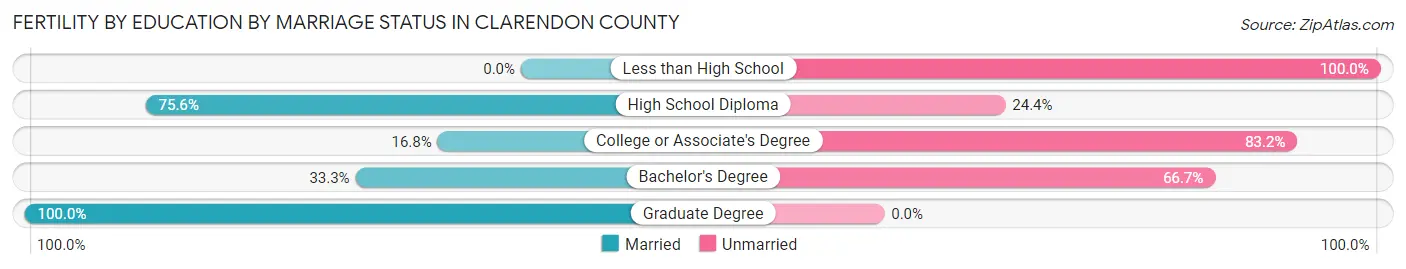
Fertility by Education by Marriage Status in Clarendon County
62.3% of women with births in Clarendon County are unmarried. Women with the educational attainment of graduate degree are most likely to be married with 100.0% of them married at childbirth, while women with the educational attainment of less than high school are least likely to be married with 100.0% of them unmarried at childbirth.
| Educational Attainment | Married | Unmarried |
| Less than High School | 0 (0.0%) | 17 (100.0%) |
| High School Diploma | 62 (75.6%) | 20 (24.4%) |
| College or Associate's Degree | 23 (16.8%) | 114 (83.2%) |
| Bachelor's Degree | 8 (33.3%) | 16 (66.7%) |
| Graduate Degree | 8 (100.0%) | 0 (0.0%) |
| Total | 101 (37.7%) | 167 (62.3%) |
Employment Characteristics in Clarendon County
Employment by Class of Employer in Clarendon County
Among the 10,781 employed individuals in Clarendon County, private company employees (7,267 | 67.4%), state government employees (813 | 7.5%), and local government employees (719 | 6.7%) make up the most common classes of employment.
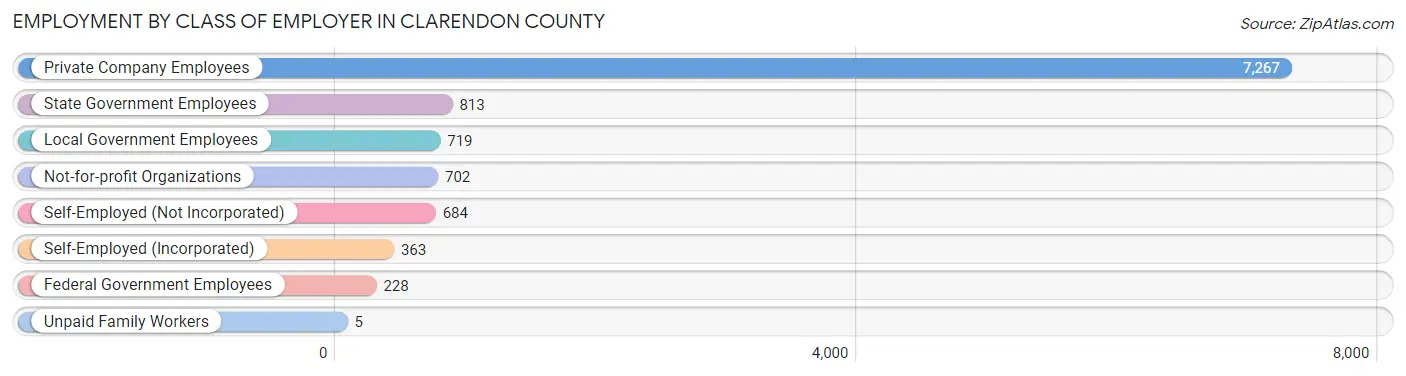
| Employer Class | # Employees | % Employees |
| Private Company Employees | 7,267 | 67.4% |
| Self-Employed (Incorporated) | 363 | 3.4% |
| Self-Employed (Not Incorporated) | 684 | 6.3% |
| Not-for-profit Organizations | 702 | 6.5% |
| Local Government Employees | 719 | 6.7% |
| State Government Employees | 813 | 7.5% |
| Federal Government Employees | 228 | 2.1% |
| Unpaid Family Workers | 5 | 0.1% |
| Total | 10,781 | 100.0% |
Employment Status by Age in Clarendon County
According to the labor force statistics for Clarendon County, out of the total population over 16 years of age (26,061), 47.6% or 12,405 individuals are in the labor force, with 10.1% or 1,253 of them unemployed. The age group with the highest labor force participation rate is 25 to 29 years, with 84.9% or 1,501 individuals in the labor force. Within the labor force, the 25 to 29 years age range has the highest percentage of unemployed individuals, with 36.9% or 554 of them being unemployed.
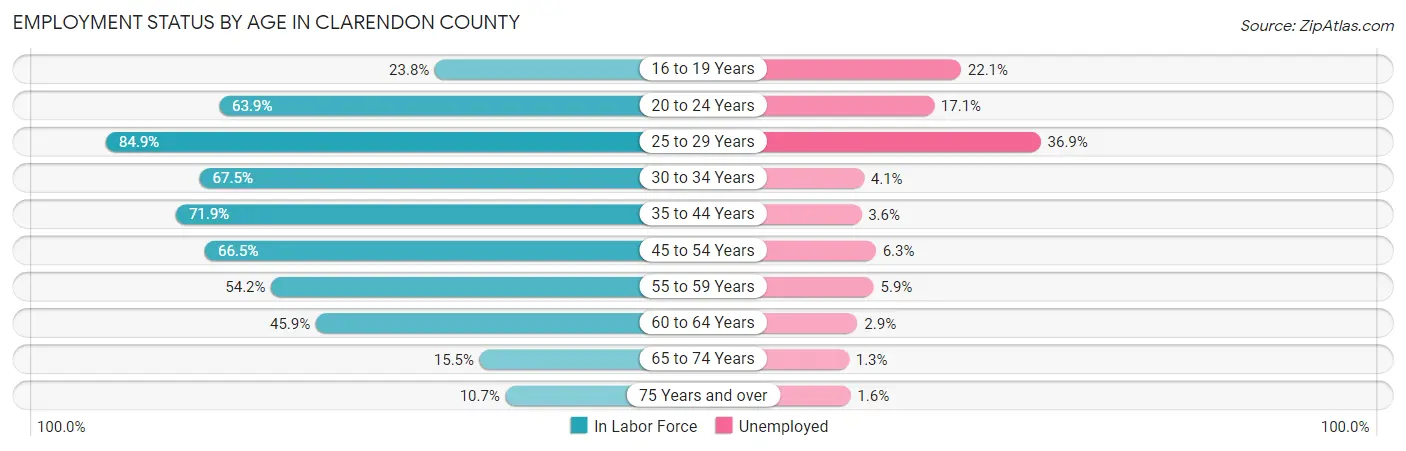
| Age Bracket | In Labor Force | Unemployed |
| 16 to 19 Years | 357 (23.8%) | 79 (22.1%) |
| 20 to 24 Years | 1,286 (63.9%) | 220 (17.1%) |
| 25 to 29 Years | 1,501 (84.9%) | 554 (36.9%) |
| 30 to 34 Years | 1,173 (67.5%) | 48 (4.1%) |
| 35 to 44 Years | 2,356 (71.9%) | 85 (3.6%) |
| 45 to 54 Years | 2,381 (66.5%) | 150 (6.3%) |
| 55 to 59 Years | 1,104 (54.2%) | 65 (5.9%) |
| 60 to 64 Years | 1,213 (45.9%) | 35 (2.9%) |
| 65 to 74 Years | 700 (15.5%) | 9 (1.3%) |
| 75 Years and over | 320 (10.7%) | 5 (1.6%) |
| Total | 12,405 (47.6%) | 1,253 (10.1%) |
Employment Status by Educational Attainment in Clarendon County
According to labor force statistics for Clarendon County, 64.7% of individuals (9,733) out of the total population between 25 and 64 years of age (15,043) are in the labor force, with 9.7% or 944 of them being unemployed. The group with the highest labor force participation rate are those with the educational attainment of bachelor's degree or higher, with 84.6% or 1,997 individuals in the labor force. Within the labor force, individuals with less than high school education have the highest percentage of unemployment, with 17.8% or 207 of them being unemployed.
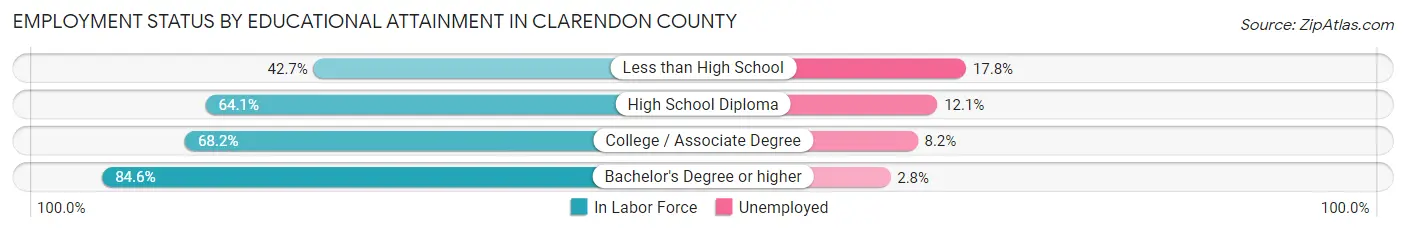
| Educational Attainment | In Labor Force | Unemployed |
| Less than High School | 1,164 (42.7%) | 485 (17.8%) |
| High School Diploma | 3,554 (64.1%) | 671 (12.1%) |
| College / Associate Degree | 3,010 (68.2%) | 362 (8.2%) |
| Bachelor's Degree or higher | 1,997 (84.6%) | 66 (2.8%) |
| Total | 9,733 (64.7%) | 1,459 (9.7%) |
Employment Occupations by Sex in Clarendon County
Management, Business, Science and Arts Occupations
The most common Management, Business, Science and Arts occupations in Clarendon County are Management (1,022 | 9.2%), Community & Social Service (891 | 8.0%), Education Instruction & Library (628 | 5.7%), Health Diagnosing & Treating (553 | 5.0%), and Health Technologists (428 | 3.8%).
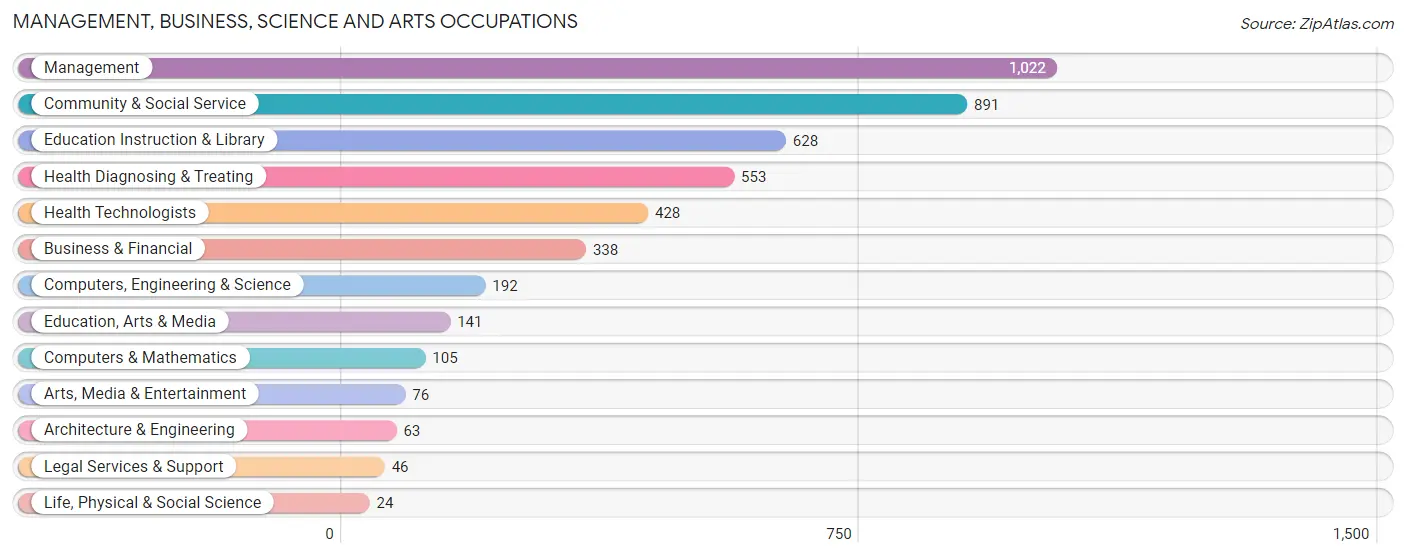
Management, Business, Science and Arts Occupations by Sex
Within the Management, Business, Science and Arts occupations in Clarendon County, the most male-oriented occupations are Life, Physical & Social Science (100.0%), Legal Services & Support (65.2%), and Management (63.6%), while the most female-oriented occupations are Health Technologists (89.2%), Health Diagnosing & Treating (85.0%), and Education Instruction & Library (82.2%).
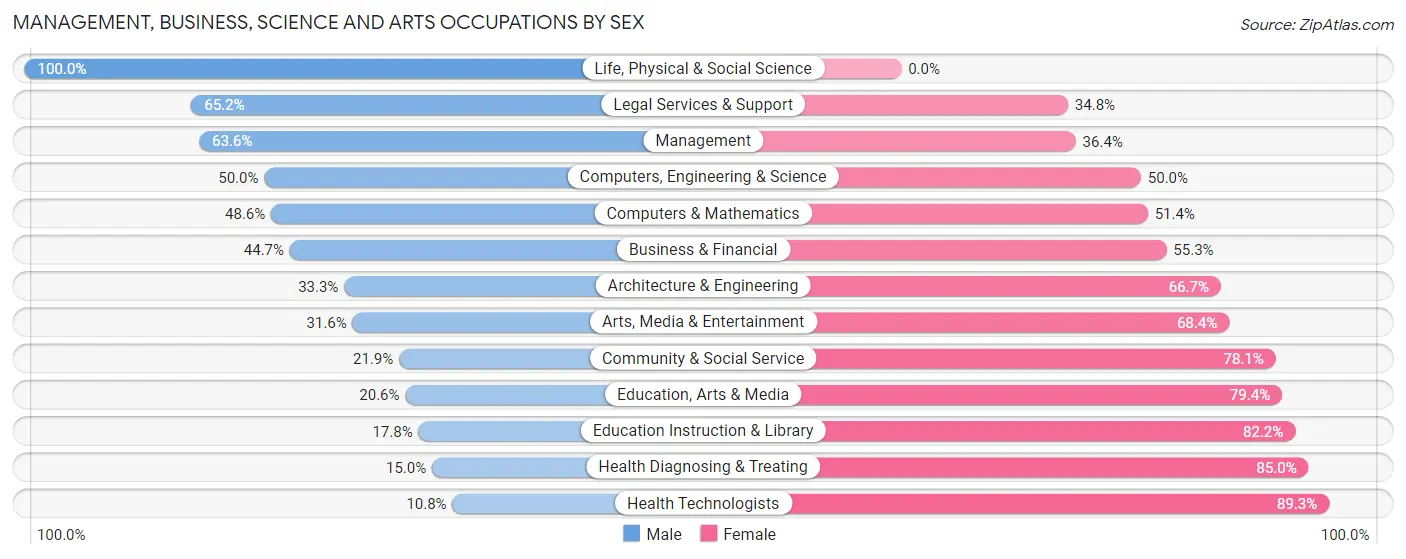
| Occupation | Male | Female |
| Management | 650 (63.6%) | 372 (36.4%) |
| Business & Financial | 151 (44.7%) | 187 (55.3%) |
| Computers, Engineering & Science | 96 (50.0%) | 96 (50.0%) |
| Computers & Mathematics | 51 (48.6%) | 54 (51.4%) |
| Architecture & Engineering | 21 (33.3%) | 42 (66.7%) |
| Life, Physical & Social Science | 24 (100.0%) | 0 (0.0%) |
| Community & Social Service | 195 (21.9%) | 696 (78.1%) |
| Education, Arts & Media | 29 (20.6%) | 112 (79.4%) |
| Legal Services & Support | 30 (65.2%) | 16 (34.8%) |
| Education Instruction & Library | 112 (17.8%) | 516 (82.2%) |
| Arts, Media & Entertainment | 24 (31.6%) | 52 (68.4%) |
| Health Diagnosing & Treating | 83 (15.0%) | 470 (85.0%) |
| Health Technologists | 46 (10.7%) | 382 (89.2%) |
| Total (Category) | 1,175 (39.2%) | 1,821 (60.8%) |
| Total (Overall) | 5,324 (47.9%) | 5,780 (52.0%) |
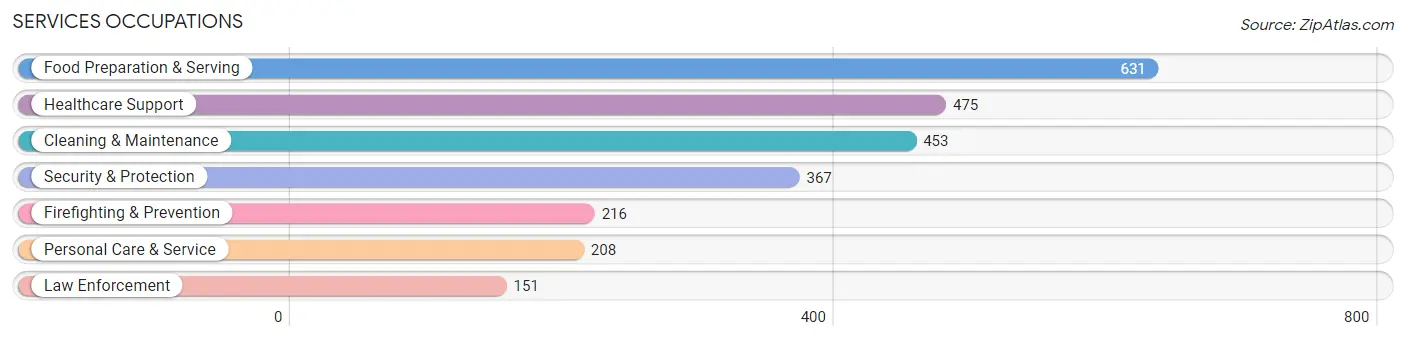
Services Occupations
The most common Services occupations in Clarendon County are Food Preparation & Serving (631 | 5.7%), Healthcare Support (475 | 4.3%), Cleaning & Maintenance (453 | 4.1%), Security & Protection (367 | 3.3%), and Firefighting & Prevention (216 | 1.9%).
Services Occupations by Sex
Within the Services occupations in Clarendon County, the most male-oriented occupations are Law Enforcement (94.7%), Security & Protection (68.4%), and Firefighting & Prevention (50.0%), while the most female-oriented occupations are Healthcare Support (91.6%), Personal Care & Service (85.1%), and Food Preparation & Serving (60.9%).
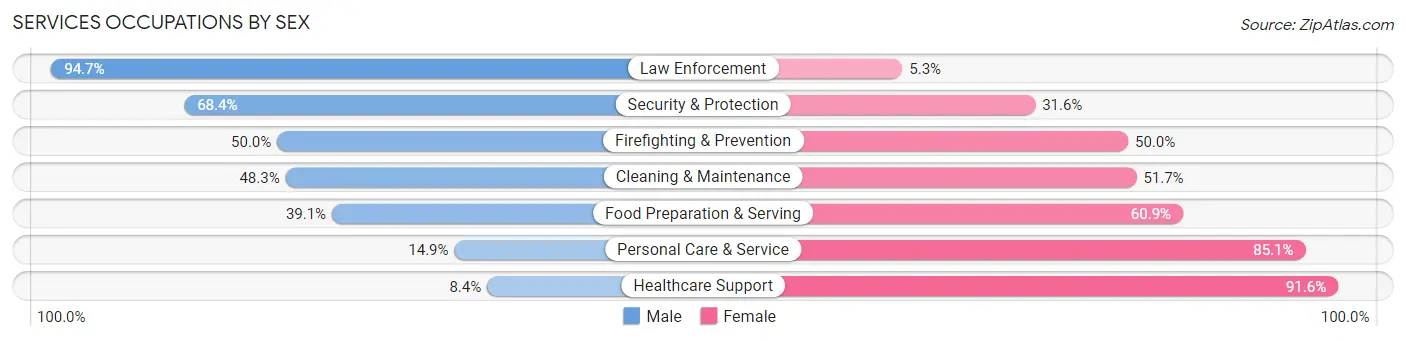
| Occupation | Male | Female |
| Healthcare Support | 40 (8.4%) | 435 (91.6%) |
| Security & Protection | 251 (68.4%) | 116 (31.6%) |
| Firefighting & Prevention | 108 (50.0%) | 108 (50.0%) |
| Law Enforcement | 143 (94.7%) | 8 (5.3%) |
| Food Preparation & Serving | 247 (39.1%) | 384 (60.9%) |
| Cleaning & Maintenance | 219 (48.3%) | 234 (51.7%) |
| Personal Care & Service | 31 (14.9%) | 177 (85.1%) |
| Total (Category) | 788 (36.9%) | 1,346 (63.1%) |
| Total (Overall) | 5,324 (47.9%) | 5,780 (52.0%) |
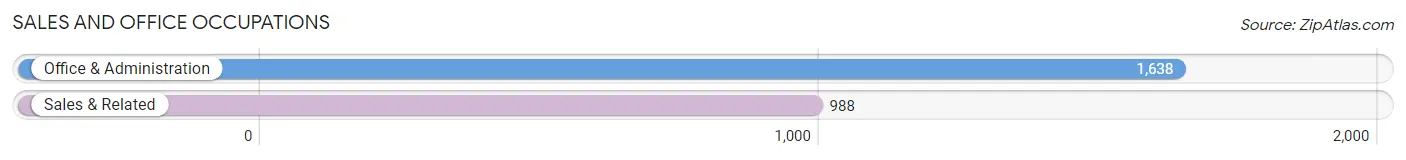
Sales and Office Occupations
The most common Sales and Office occupations in Clarendon County are Office & Administration (1,638 | 14.7%), and Sales & Related (988 | 8.9%).
Sales and Office Occupations by Sex
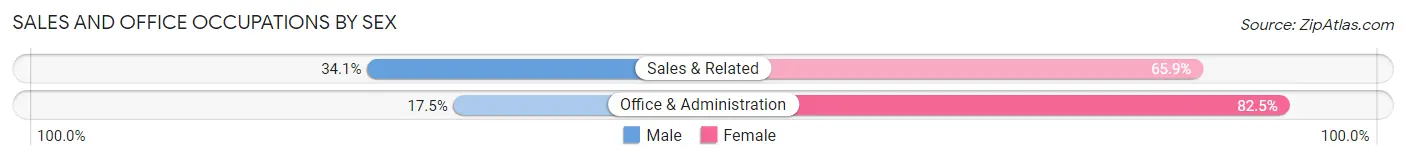
| Occupation | Male | Female |
| Sales & Related | 337 (34.1%) | 651 (65.9%) |
| Office & Administration | 287 (17.5%) | 1,351 (82.5%) |
| Total (Category) | 624 (23.8%) | 2,002 (76.2%) |
| Total (Overall) | 5,324 (47.9%) | 5,780 (52.0%) |
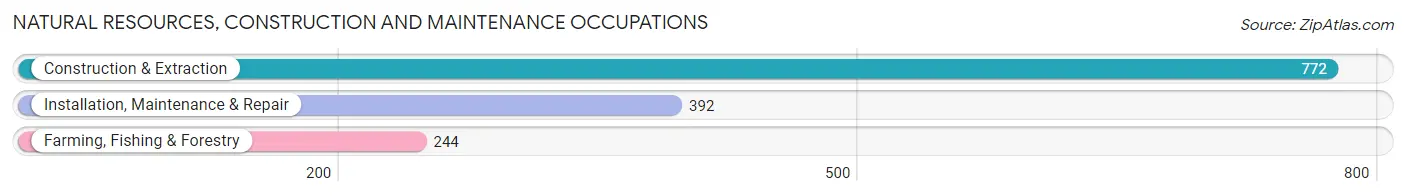
Natural Resources, Construction and Maintenance Occupations
The most common Natural Resources, Construction and Maintenance occupations in Clarendon County are Construction & Extraction (772 | 7.0%), Installation, Maintenance & Repair (392 | 3.5%), and Farming, Fishing & Forestry (244 | 2.2%).
Natural Resources, Construction and Maintenance Occupations by Sex
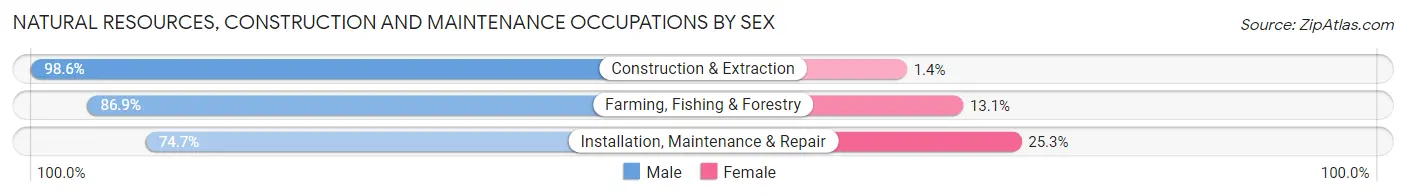
| Occupation | Male | Female |
| Farming, Fishing & Forestry | 212 (86.9%) | 32 (13.1%) |
| Construction & Extraction | 761 (98.6%) | 11 (1.4%) |
| Installation, Maintenance & Repair | 293 (74.7%) | 99 (25.3%) |
| Total (Category) | 1,266 (89.9%) | 142 (10.1%) |
| Total (Overall) | 5,324 (47.9%) | 5,780 (52.0%) |
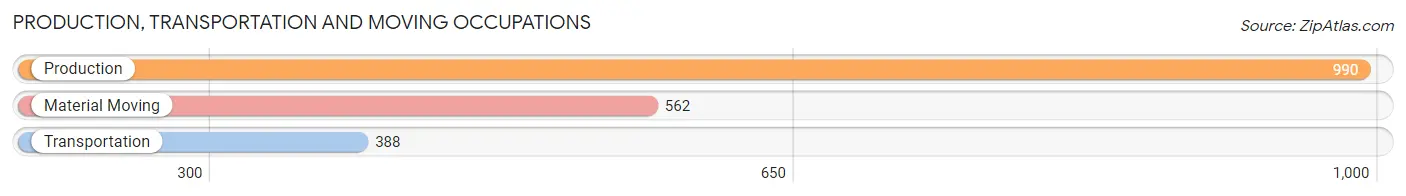
Production, Transportation and Moving Occupations
The most common Production, Transportation and Moving occupations in Clarendon County are Production (990 | 8.9%), Material Moving (562 | 5.1%), and Transportation (388 | 3.5%).
Production, Transportation and Moving Occupations by Sex
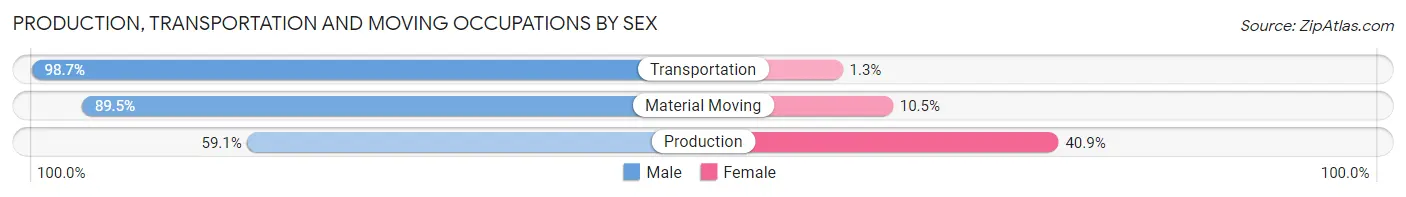
| Occupation | Male | Female |
| Production | 585 (59.1%) | 405 (40.9%) |
| Transportation | 383 (98.7%) | 5 (1.3%) |
| Material Moving | 503 (89.5%) | 59 (10.5%) |
| Total (Category) | 1,471 (75.8%) | 469 (24.2%) |
| Total (Overall) | 5,324 (47.9%) | 5,780 (52.0%) |
Employment Industries by Sex in Clarendon County
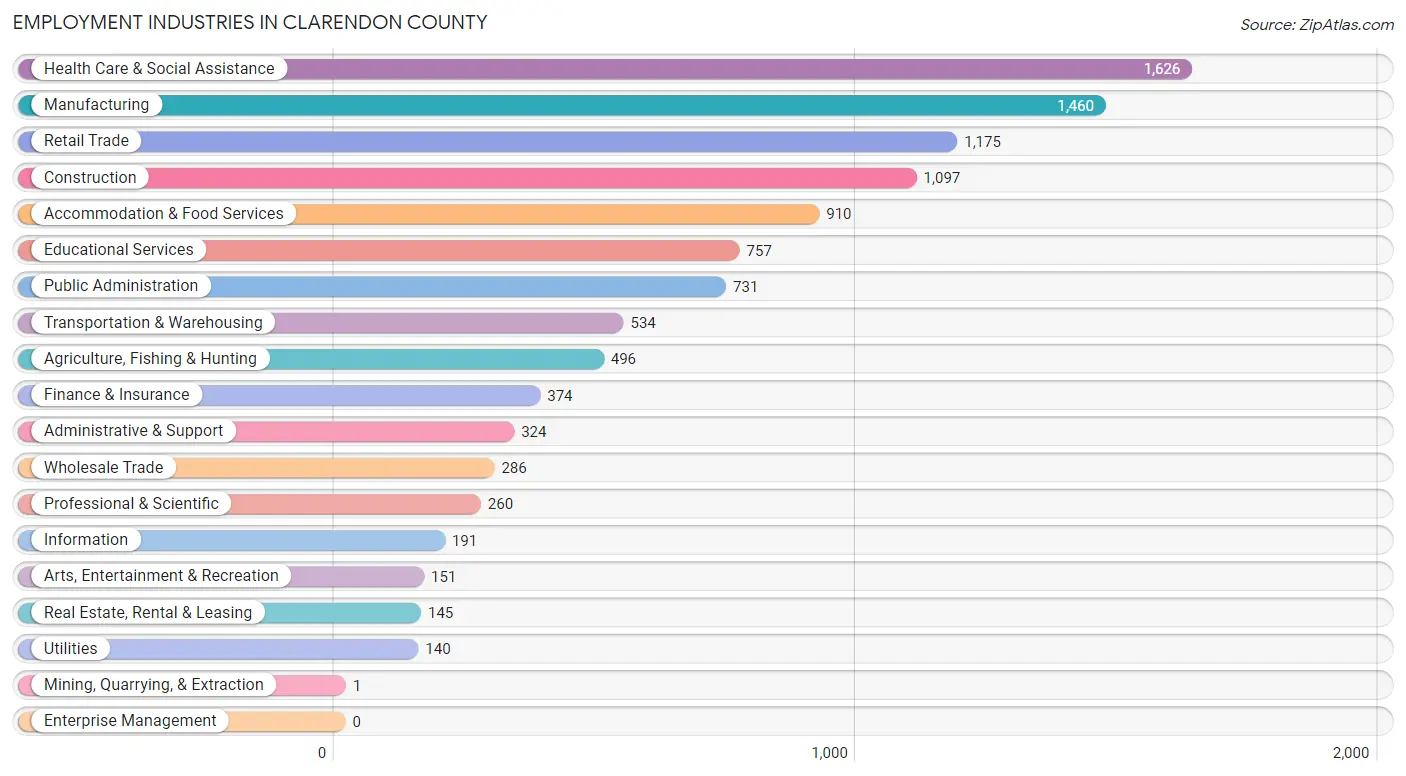
Employment Industries in Clarendon County
The major employment industries in Clarendon County include Health Care & Social Assistance (1,626 | 14.6%), Manufacturing (1,460 | 13.2%), Retail Trade (1,175 | 10.6%), Construction (1,097 | 9.9%), and Accommodation & Food Services (910 | 8.2%).
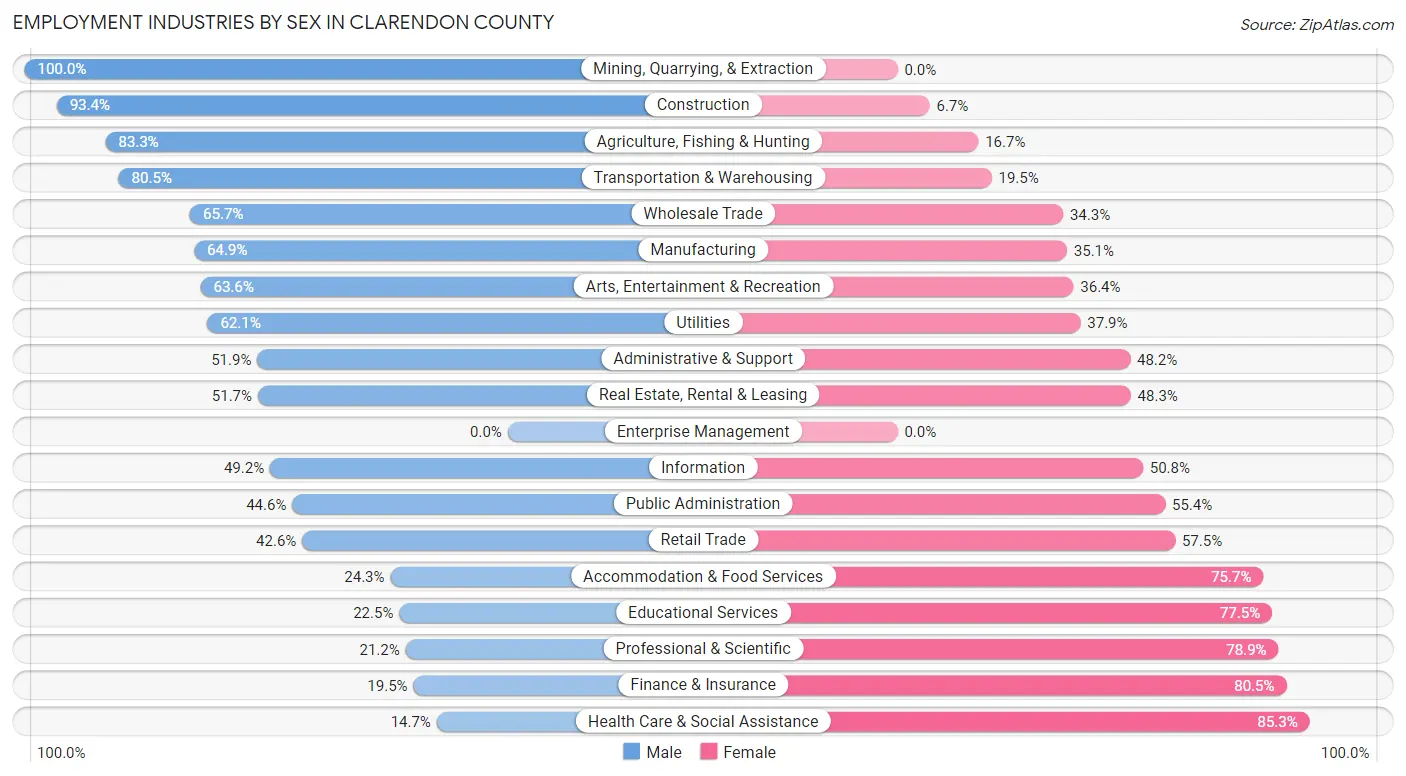
Employment Industries by Sex in Clarendon County
The Clarendon County industries that see more men than women are Mining, Quarrying, & Extraction (100.0%), Construction (93.3%), and Agriculture, Fishing & Hunting (83.3%), whereas the industries that tend to have a higher number of women are Health Care & Social Assistance (85.3%), Finance & Insurance (80.5%), and Professional & Scientific (78.8%).
| Industry | Male | Female |
| Agriculture, Fishing & Hunting | 413 (83.3%) | 83 (16.7%) |
| Mining, Quarrying, & Extraction | 1 (100.0%) | 0 (0.0%) |
| Construction | 1,024 (93.3%) | 73 (6.7%) |
| Manufacturing | 948 (64.9%) | 512 (35.1%) |
| Wholesale Trade | 188 (65.7%) | 98 (34.3%) |
| Retail Trade | 500 (42.5%) | 675 (57.5%) |
| Transportation & Warehousing | 430 (80.5%) | 104 (19.5%) |
| Utilities | 87 (62.1%) | 53 (37.9%) |
| Information | 94 (49.2%) | 97 (50.8%) |
| Finance & Insurance | 73 (19.5%) | 301 (80.5%) |
| Real Estate, Rental & Leasing | 75 (51.7%) | 70 (48.3%) |
| Professional & Scientific | 55 (21.1%) | 205 (78.8%) |
| Enterprise Management | 0 (0.0%) | 0 (0.0%) |
| Administrative & Support | 168 (51.8%) | 156 (48.1%) |
| Educational Services | 170 (22.5%) | 587 (77.5%) |
| Health Care & Social Assistance | 239 (14.7%) | 1,387 (85.3%) |
| Arts, Entertainment & Recreation | 96 (63.6%) | 55 (36.4%) |
| Accommodation & Food Services | 221 (24.3%) | 689 (75.7%) |
| Public Administration | 326 (44.6%) | 405 (55.4%) |
| Total | 5,324 (47.9%) | 5,780 (52.0%) |
Education in Clarendon County
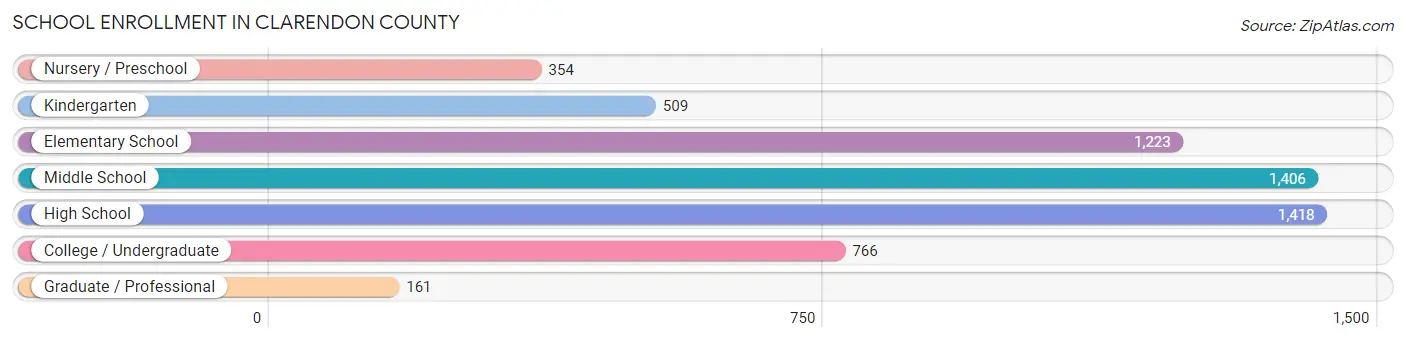
School Enrollment in Clarendon County
The most common levels of schooling among the 5,837 students in Clarendon County are high school (1,418 | 24.3%), middle school (1,406 | 24.1%), and elementary school (1,223 | 20.9%).
| School Level | # Students | % Students |
| Nursery / Preschool | 354 | 6.1% |
| Kindergarten | 509 | 8.7% |
| Elementary School | 1,223 | 20.9% |
| Middle School | 1,406 | 24.1% |
| High School | 1,418 | 24.3% |
| College / Undergraduate | 766 | 13.1% |
| Graduate / Professional | 161 | 2.8% |
| Total | 5,837 | 100.0% |
School Enrollment by Age by Funding Source in Clarendon County
Out of a total of 5,837 students who are enrolled in schools in Clarendon County, 1,051 (18.0%) attend a private institution, while the remaining 4,786 (82.0%) are enrolled in public schools. The age group of 35 years and over has the highest likelihood of being enrolled in private schools, with 63 (39.4% in the age bracket) enrolled. Conversely, the age group of 15 to 17 year olds has the lowest likelihood of being enrolled in a private school, with 969 (89.8% in the age bracket) attending a public institution.
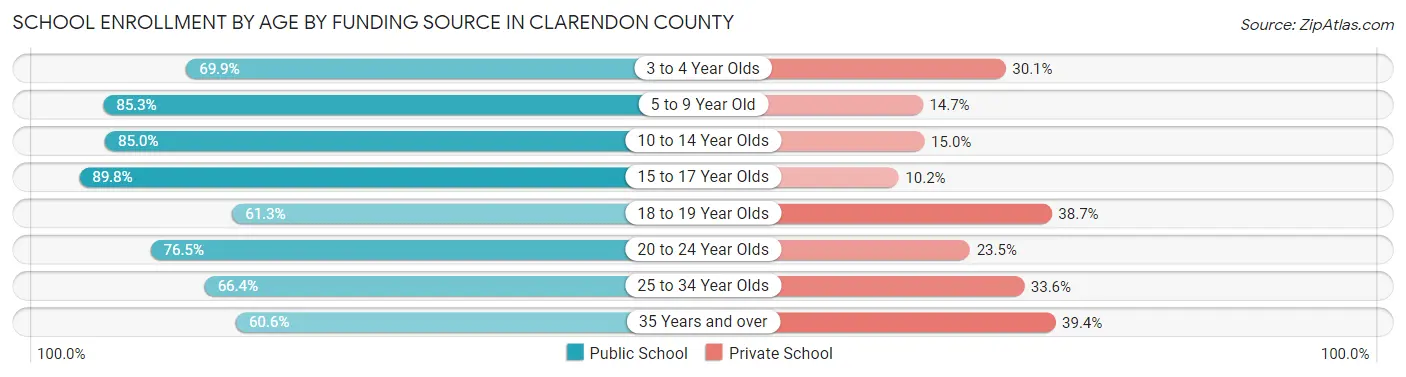
| Age Bracket | Public School | Private School |
| 3 to 4 Year Olds | 225 (69.9%) | 97 (30.1%) |
| 5 to 9 Year Old | 1,285 (85.3%) | 221 (14.7%) |
| 10 to 14 Year Olds | 1,520 (85.0%) | 268 (15.0%) |
| 15 to 17 Year Olds | 969 (89.8%) | 110 (10.2%) |
| 18 to 19 Year Olds | 187 (61.3%) | 118 (38.7%) |
| 20 to 24 Year Olds | 404 (76.5%) | 124 (23.5%) |
| 25 to 34 Year Olds | 99 (66.4%) | 50 (33.6%) |
| 35 Years and over | 97 (60.6%) | 63 (39.4%) |
| Total | 4,786 (82.0%) | 1,051 (18.0%) |
Educational Attainment by Field of Study in Clarendon County
Business (977 | 25.4%), education (771 | 20.0%), science & technology (374 | 9.7%), social sciences (320 | 8.3%), and liberal arts & history (253 | 6.6%) are the most common fields of study among 3,847 individuals in Clarendon County who have obtained a bachelor's degree or higher.
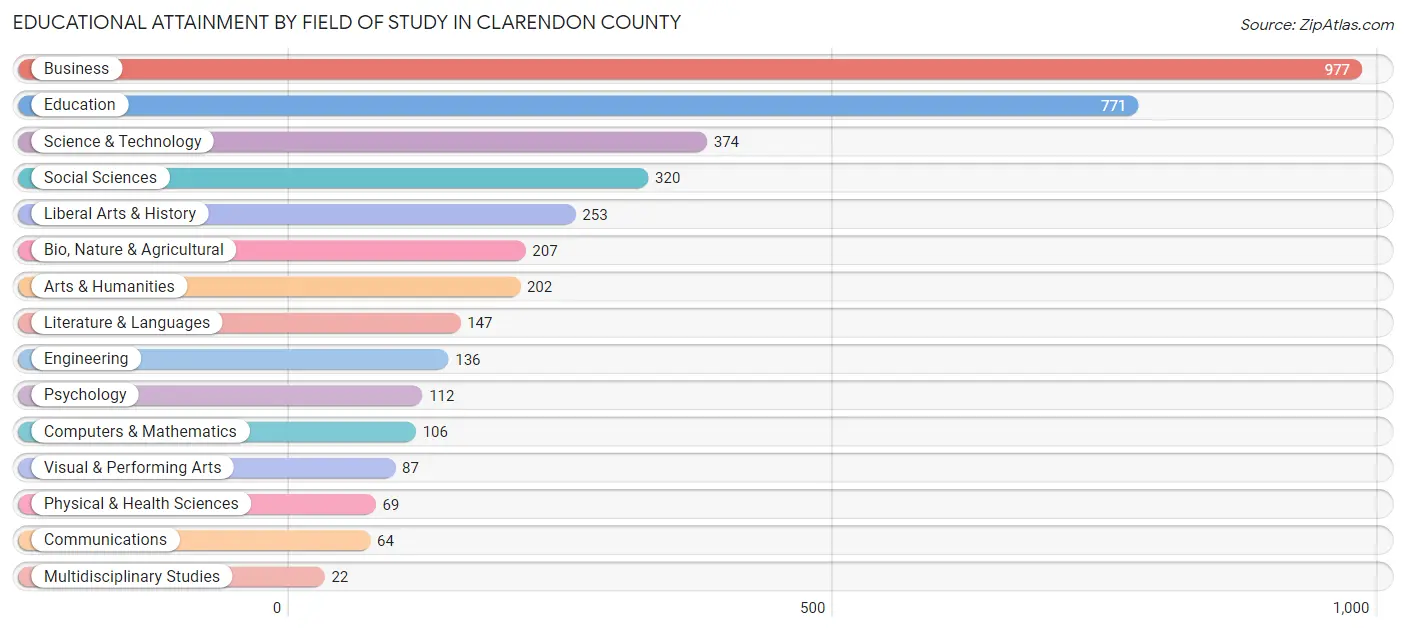
| Field of Study | # Graduates | % Graduates |
| Computers & Mathematics | 106 | 2.8% |
| Bio, Nature & Agricultural | 207 | 5.4% |
| Physical & Health Sciences | 69 | 1.8% |
| Psychology | 112 | 2.9% |
| Social Sciences | 320 | 8.3% |
| Engineering | 136 | 3.5% |
| Multidisciplinary Studies | 22 | 0.6% |
| Science & Technology | 374 | 9.7% |
| Business | 977 | 25.4% |
| Education | 771 | 20.0% |
| Literature & Languages | 147 | 3.8% |
| Liberal Arts & History | 253 | 6.6% |
| Visual & Performing Arts | 87 | 2.3% |
| Communications | 64 | 1.7% |
| Arts & Humanities | 202 | 5.2% |
| Total | 3,847 | 100.0% |
Transportation & Commute in Clarendon County
Vehicle Availability by Sex in Clarendon County
The most prevalent vehicle ownership categories in Clarendon County are males with 2 vehicles (2,122, accounting for 40.2%) and females with 2 vehicles (2,024, making up 38.8%).
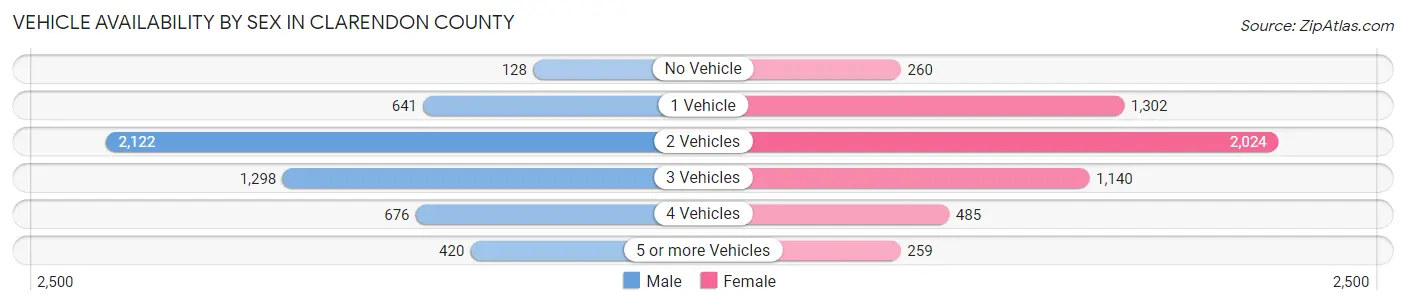
| Vehicles Available | Male | Female |
| No Vehicle | 128 (2.4%) | 260 (4.8%) |
| 1 Vehicle | 641 (12.1%) | 1,302 (23.8%) |
| 2 Vehicles | 2,122 (40.2%) | 2,024 (37.0%) |
| 3 Vehicles | 1,298 (24.6%) | 1,140 (20.8%) |
| 4 Vehicles | 676 (12.8%) | 485 (8.9%) |
| 5 or more Vehicles | 420 (8.0%) | 259 (4.7%) |
| Total | 5,285 (100.0%) | 5,470 (100.0%) |
Commute Time in Clarendon County
The most frequently occuring commute durations in Clarendon County are 30 to 34 minutes (1,646 commuters, 16.2%), 20 to 24 minutes (1,470 commuters, 14.5%), and 15 to 19 minutes (1,342 commuters, 13.2%).
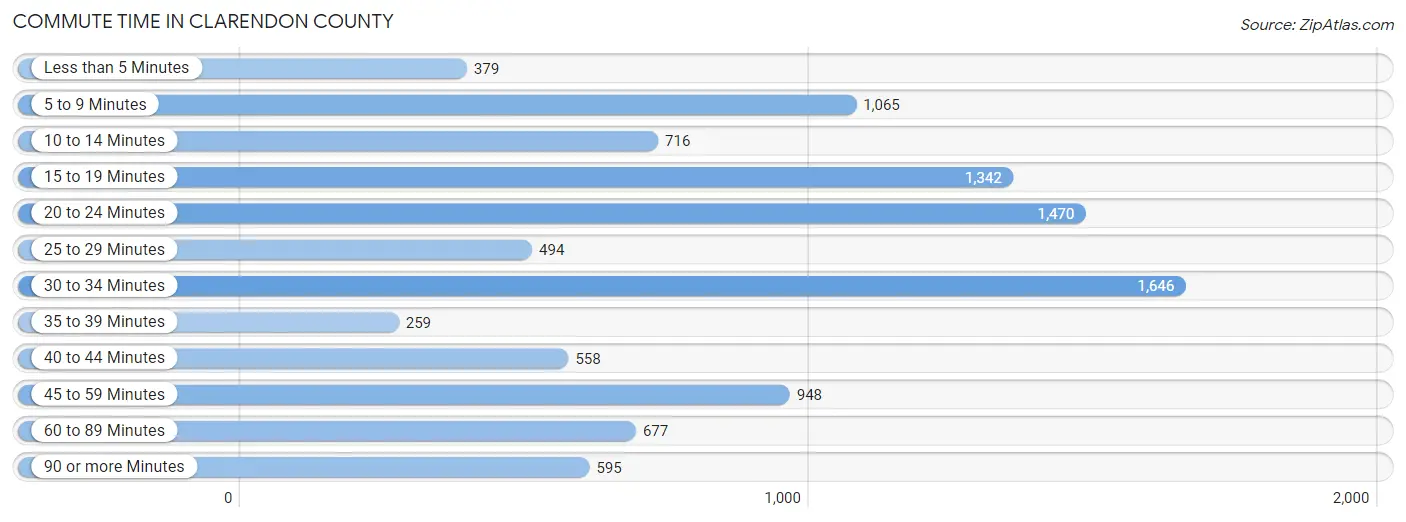
| Commute Time | # Commuters | % Commuters |
| Less than 5 Minutes | 379 | 3.7% |
| 5 to 9 Minutes | 1,065 | 10.5% |
| 10 to 14 Minutes | 716 | 7.0% |
| 15 to 19 Minutes | 1,342 | 13.2% |
| 20 to 24 Minutes | 1,470 | 14.5% |
| 25 to 29 Minutes | 494 | 4.9% |
| 30 to 34 Minutes | 1,646 | 16.2% |
| 35 to 39 Minutes | 259 | 2.5% |
| 40 to 44 Minutes | 558 | 5.5% |
| 45 to 59 Minutes | 948 | 9.3% |
| 60 to 89 Minutes | 677 | 6.7% |
| 90 or more Minutes | 595 | 5.9% |
Commute Time by Sex in Clarendon County
The most common commute times in Clarendon County are 30 to 34 minutes (796 commuters, 15.7%) for males and 20 to 24 minutes (876 commuters, 17.3%) for females.
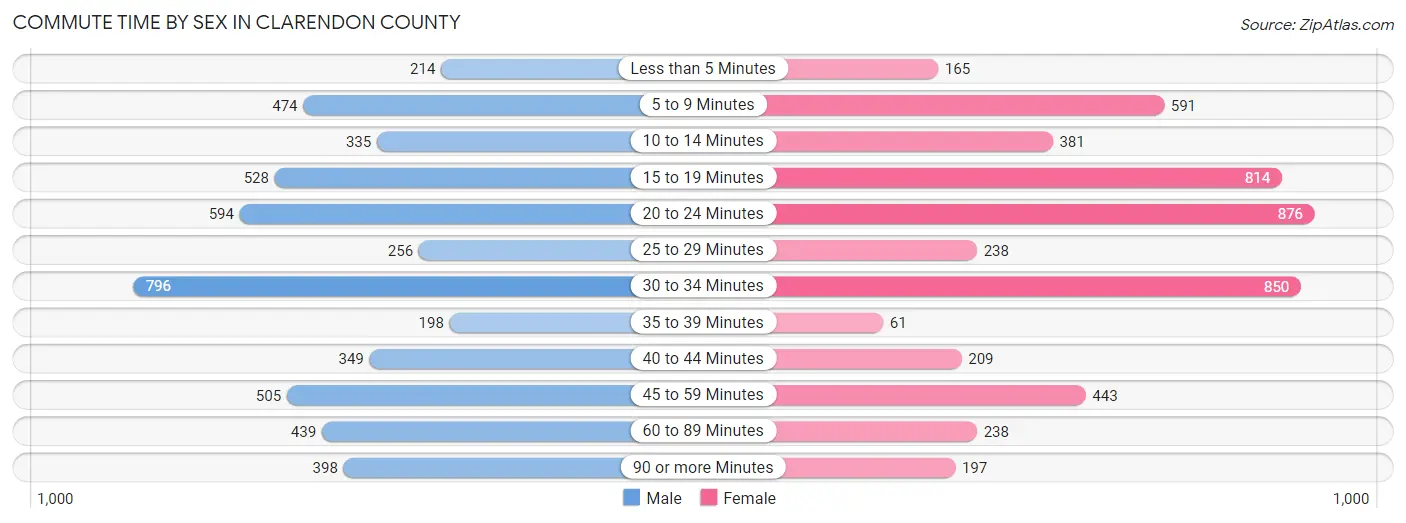
| Commute Time | Male | Female |
| Less than 5 Minutes | 214 (4.2%) | 165 (3.3%) |
| 5 to 9 Minutes | 474 (9.3%) | 591 (11.7%) |
| 10 to 14 Minutes | 335 (6.6%) | 381 (7.5%) |
| 15 to 19 Minutes | 528 (10.4%) | 814 (16.1%) |
| 20 to 24 Minutes | 594 (11.7%) | 876 (17.3%) |
| 25 to 29 Minutes | 256 (5.0%) | 238 (4.7%) |
| 30 to 34 Minutes | 796 (15.7%) | 850 (16.8%) |
| 35 to 39 Minutes | 198 (3.9%) | 61 (1.2%) |
| 40 to 44 Minutes | 349 (6.9%) | 209 (4.1%) |
| 45 to 59 Minutes | 505 (9.9%) | 443 (8.7%) |
| 60 to 89 Minutes | 439 (8.6%) | 238 (4.7%) |
| 90 or more Minutes | 398 (7.8%) | 197 (3.9%) |
Time of Departure to Work by Sex in Clarendon County
The most frequent times of departure to work in Clarendon County are 7:00 AM to 7:29 AM (1,035, 20.3%) for males and 7:00 AM to 7:29 AM (1,110, 21.9%) for females.
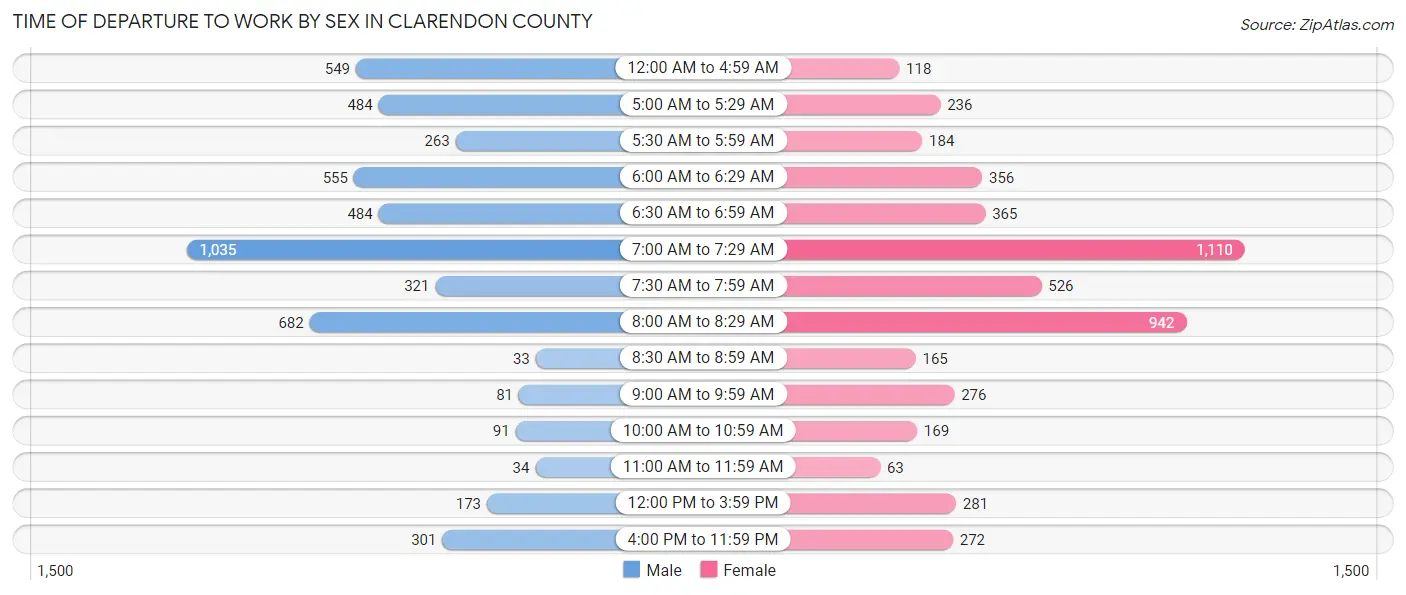
| Time of Departure | Male | Female |
| 12:00 AM to 4:59 AM | 549 (10.8%) | 118 (2.3%) |
| 5:00 AM to 5:29 AM | 484 (9.5%) | 236 (4.7%) |
| 5:30 AM to 5:59 AM | 263 (5.2%) | 184 (3.6%) |
| 6:00 AM to 6:29 AM | 555 (10.9%) | 356 (7.0%) |
| 6:30 AM to 6:59 AM | 484 (9.5%) | 365 (7.2%) |
| 7:00 AM to 7:29 AM | 1,035 (20.3%) | 1,110 (21.9%) |
| 7:30 AM to 7:59 AM | 321 (6.3%) | 526 (10.4%) |
| 8:00 AM to 8:29 AM | 682 (13.4%) | 942 (18.6%) |
| 8:30 AM to 8:59 AM | 33 (0.6%) | 165 (3.3%) |
| 9:00 AM to 9:59 AM | 81 (1.6%) | 276 (5.4%) |
| 10:00 AM to 10:59 AM | 91 (1.8%) | 169 (3.3%) |
| 11:00 AM to 11:59 AM | 34 (0.7%) | 63 (1.2%) |
| 12:00 PM to 3:59 PM | 173 (3.4%) | 281 (5.6%) |
| 4:00 PM to 11:59 PM | 301 (5.9%) | 272 (5.4%) |
| Total | 5,086 (100.0%) | 5,063 (100.0%) |
Housing Occupancy in Clarendon County
Occupancy by Ownership in Clarendon County
Of the total 11,684 dwellings in Clarendon County, owner-occupied units account for 8,687 (74.4%), while renter-occupied units make up 2,997 (25.7%).
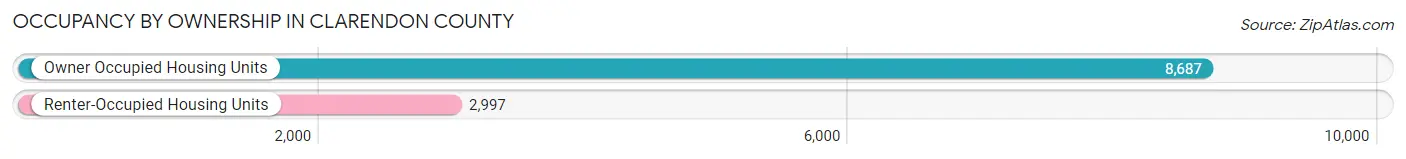
| Occupancy | # Housing Units | % Housing Units |
| Owner Occupied Housing Units | 8,687 | 74.4% |
| Renter-Occupied Housing Units | 2,997 | 25.7% |
| Total Occupied Housing Units | 11,684 | 100.0% |
Occupancy by Household Size in Clarendon County
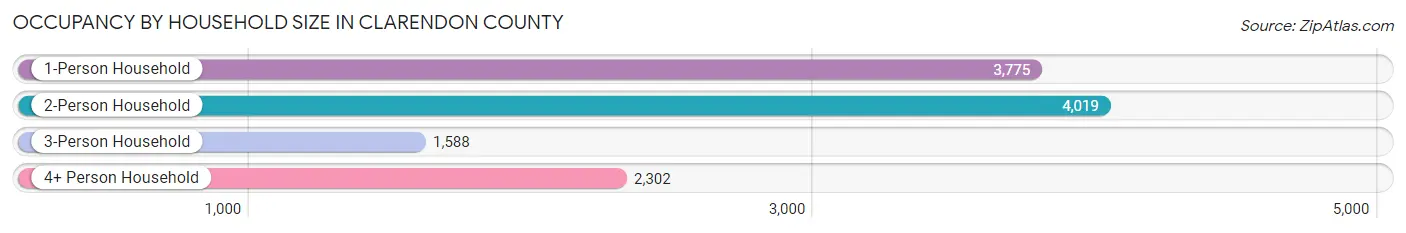
| Household Size | # Housing Units | % Housing Units |
| 1-Person Household | 3,775 | 32.3% |
| 2-Person Household | 4,019 | 34.4% |
| 3-Person Household | 1,588 | 13.6% |
| 4+ Person Household | 2,302 | 19.7% |
| Total Housing Units | 11,684 | 100.0% |
Occupancy by Ownership by Household Size in Clarendon County
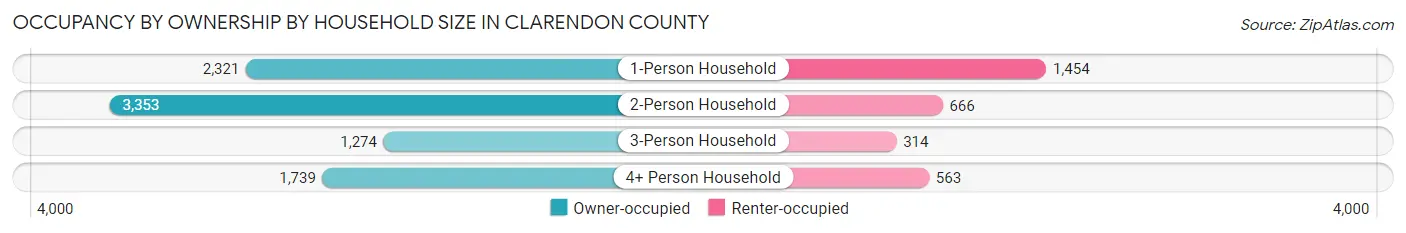
| Household Size | Owner-occupied | Renter-occupied |
| 1-Person Household | 2,321 (61.5%) | 1,454 (38.5%) |
| 2-Person Household | 3,353 (83.4%) | 666 (16.6%) |
| 3-Person Household | 1,274 (80.2%) | 314 (19.8%) |
| 4+ Person Household | 1,739 (75.5%) | 563 (24.5%) |
| Total Housing Units | 8,687 (74.4%) | 2,997 (25.7%) |
Occupancy by Educational Attainment in Clarendon County
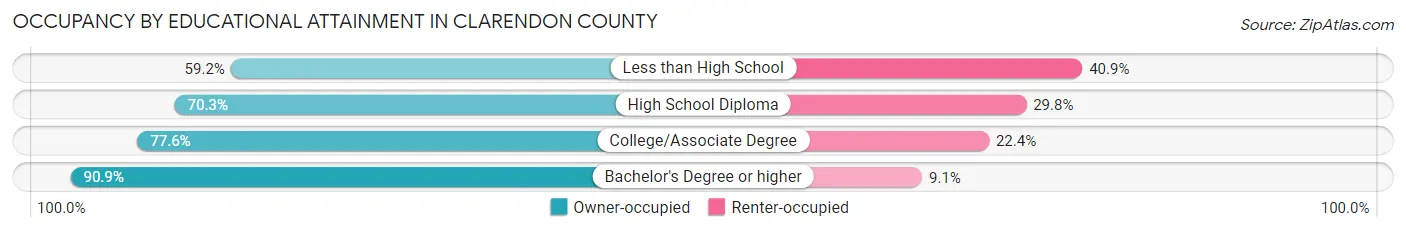
| Household Size | Owner-occupied | Renter-occupied |
| Less than High School | 1,154 (59.2%) | 797 (40.8%) |
| High School Diploma | 2,904 (70.3%) | 1,230 (29.7%) |
| College/Associate Degree | 2,693 (77.6%) | 776 (22.4%) |
| Bachelor's Degree or higher | 1,936 (90.9%) | 194 (9.1%) |
Occupancy by Age of Householder in Clarendon County
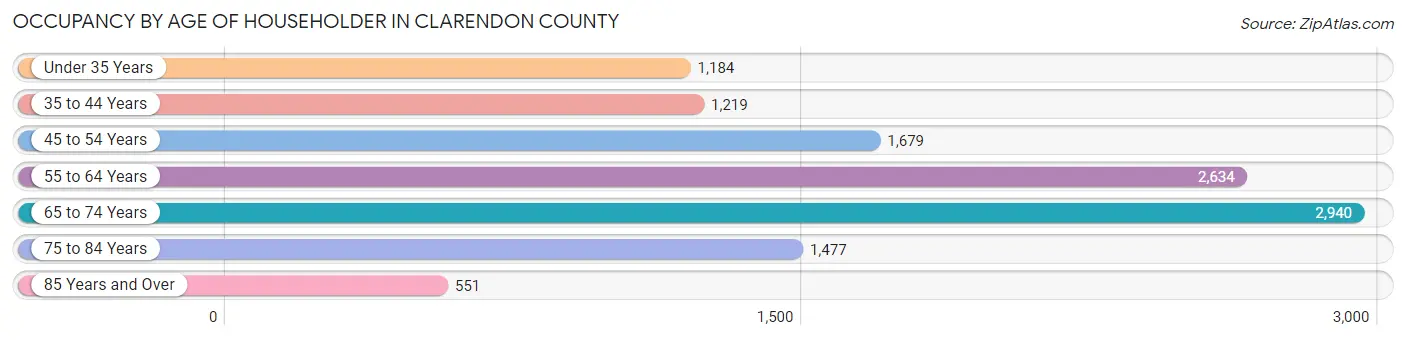
| Age Bracket | # Households | % Households |
| Under 35 Years | 1,184 | 10.1% |
| 35 to 44 Years | 1,219 | 10.4% |
| 45 to 54 Years | 1,679 | 14.4% |
| 55 to 64 Years | 2,634 | 22.5% |
| 65 to 74 Years | 2,940 | 25.2% |
| 75 to 84 Years | 1,477 | 12.6% |
| 85 Years and Over | 551 | 4.7% |
| Total | 11,684 | 100.0% |
Housing Finances in Clarendon County
Median Income by Occupancy in Clarendon County
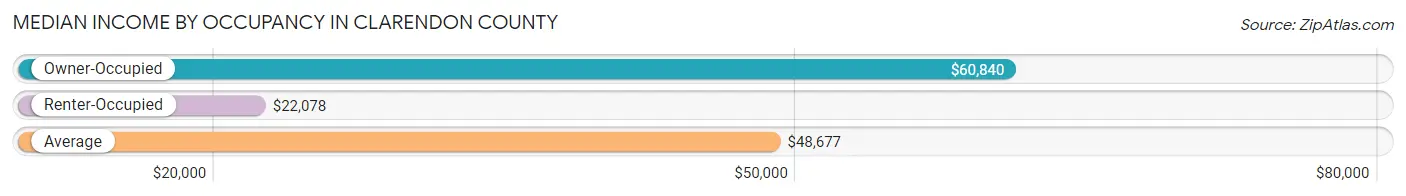
| Occupancy Type | # Households | Median Income |
| Owner-Occupied | 8,687 (74.4%) | $60,840 |
| Renter-Occupied | 2,997 (25.7%) | $22,078 |
| Average | 11,684 (100.0%) | $48,677 |
Occupancy by Householder Income Bracket in Clarendon County
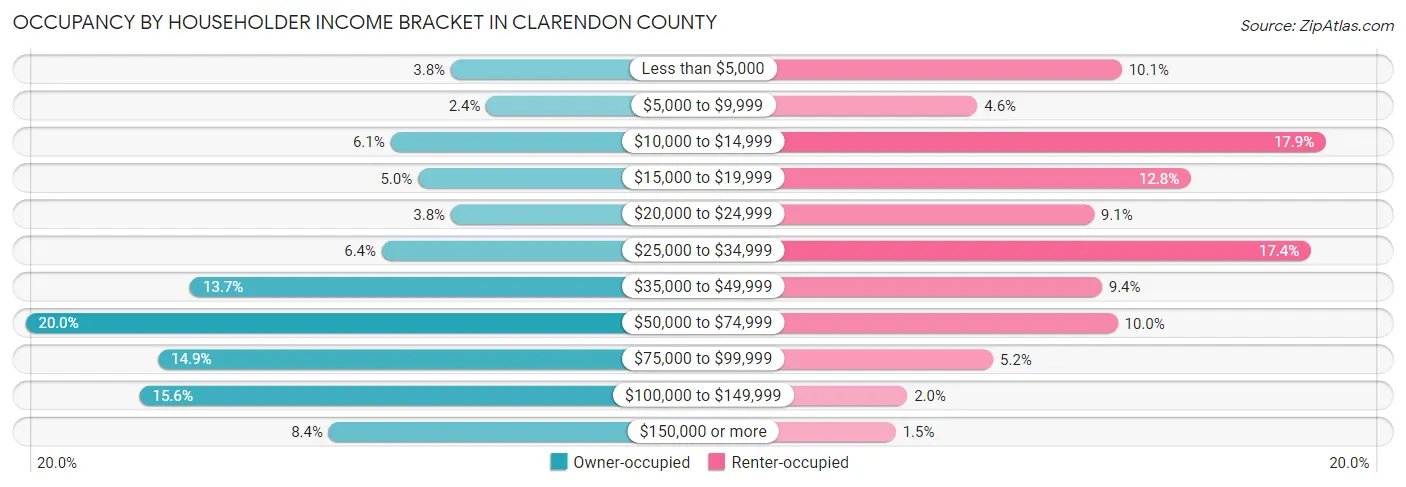
| Income Bracket | Owner-occupied | Renter-occupied |
| Less than $5,000 | 327 (3.8%) | 304 (10.1%) |
| $5,000 to $9,999 | 209 (2.4%) | 139 (4.6%) |
| $10,000 to $14,999 | 526 (6.1%) | 537 (17.9%) |
| $15,000 to $19,999 | 435 (5.0%) | 383 (12.8%) |
| $20,000 to $24,999 | 327 (3.8%) | 272 (9.1%) |
| $25,000 to $34,999 | 555 (6.4%) | 520 (17.3%) |
| $35,000 to $49,999 | 1,190 (13.7%) | 281 (9.4%) |
| $50,000 to $74,999 | 1,735 (20.0%) | 299 (10.0%) |
| $75,000 to $99,999 | 1,295 (14.9%) | 157 (5.2%) |
| $100,000 to $149,999 | 1,357 (15.6%) | 59 (2.0%) |
| $150,000 or more | 731 (8.4%) | 46 (1.5%) |
| Total | 8,687 (100.0%) | 2,997 (100.0%) |
Monthly Housing Cost Tiers in Clarendon County
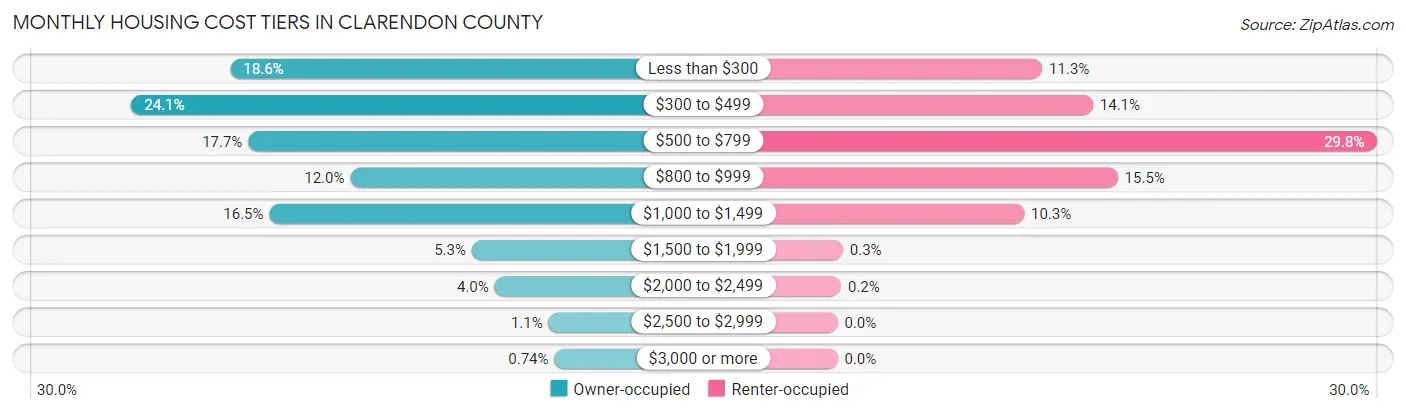
| Monthly Cost | Owner-occupied | Renter-occupied |
| Less than $300 | 1,618 (18.6%) | 339 (11.3%) |
| $300 to $499 | 2,094 (24.1%) | 423 (14.1%) |
| $500 to $799 | 1,533 (17.6%) | 892 (29.8%) |
| $800 to $999 | 1,043 (12.0%) | 464 (15.5%) |
| $1,000 to $1,499 | 1,432 (16.5%) | 309 (10.3%) |
| $1,500 to $1,999 | 460 (5.3%) | 9 (0.3%) |
| $2,000 to $2,499 | 351 (4.0%) | 6 (0.2%) |
| $2,500 to $2,999 | 92 (1.1%) | 0 (0.0%) |
| $3,000 or more | 64 (0.7%) | 0 (0.0%) |
| Total | 8,687 (100.0%) | 2,997 (100.0%) |
Physical Housing Characteristics in Clarendon County
Housing Structures in Clarendon County
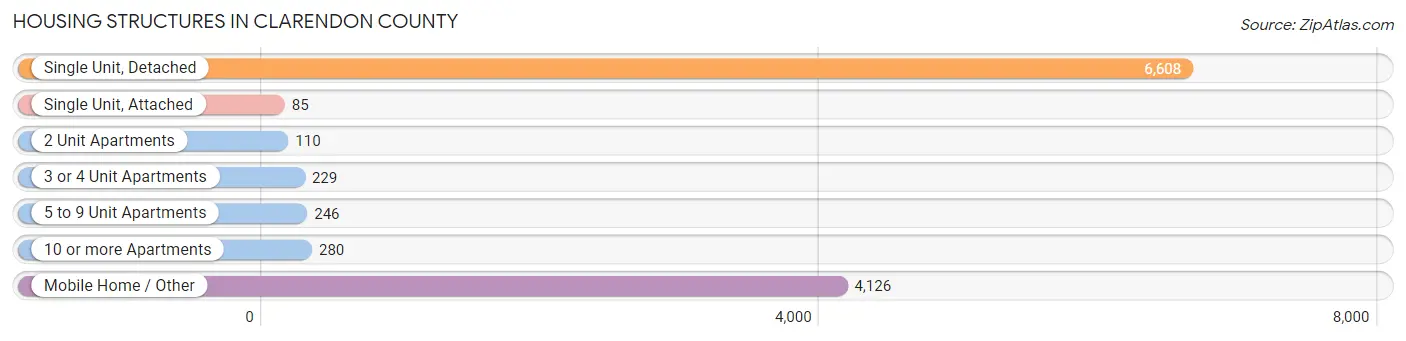
| Structure Type | # Housing Units | % Housing Units |
| Single Unit, Detached | 6,608 | 56.6% |
| Single Unit, Attached | 85 | 0.7% |
| 2 Unit Apartments | 110 | 0.9% |
| 3 or 4 Unit Apartments | 229 | 2.0% |
| 5 to 9 Unit Apartments | 246 | 2.1% |
| 10 or more Apartments | 280 | 2.4% |
| Mobile Home / Other | 4,126 | 35.3% |
| Total | 11,684 | 100.0% |
Housing Structures by Occupancy in Clarendon County
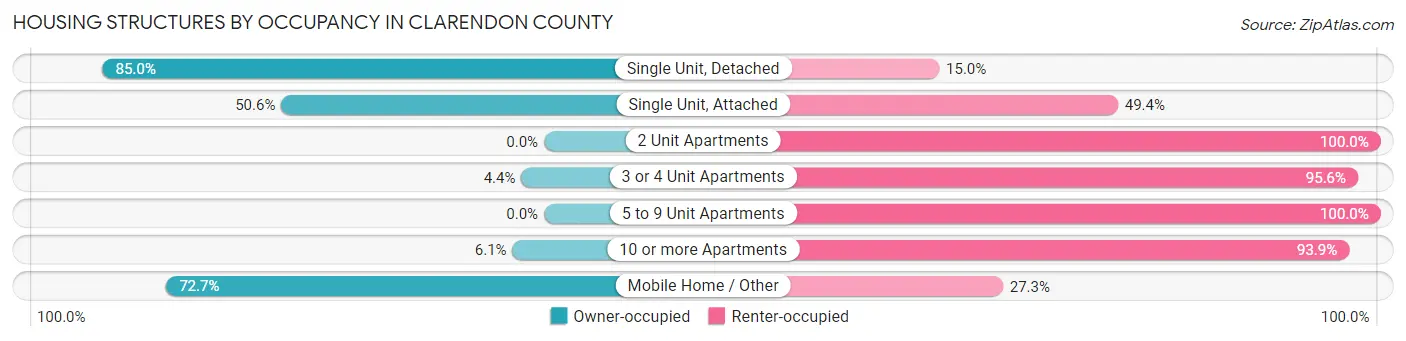
| Structure Type | Owner-occupied | Renter-occupied |
| Single Unit, Detached | 5,616 (85.0%) | 992 (15.0%) |
| Single Unit, Attached | 43 (50.6%) | 42 (49.4%) |
| 2 Unit Apartments | 0 (0.0%) | 110 (100.0%) |
| 3 or 4 Unit Apartments | 10 (4.4%) | 219 (95.6%) |
| 5 to 9 Unit Apartments | 0 (0.0%) | 246 (100.0%) |
| 10 or more Apartments | 17 (6.1%) | 263 (93.9%) |
| Mobile Home / Other | 3,001 (72.7%) | 1,125 (27.3%) |
| Total | 8,687 (74.4%) | 2,997 (25.7%) |
Housing Structures by Number of Rooms in Clarendon County
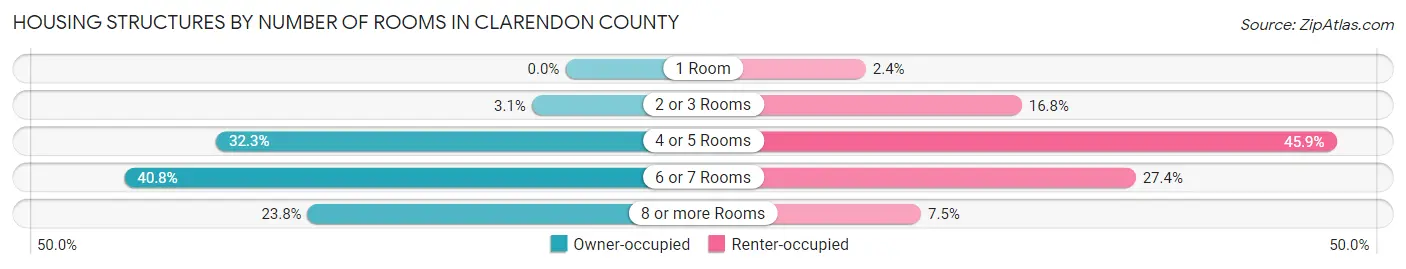
| Number of Rooms | Owner-occupied | Renter-occupied |
| 1 Room | 0 (0.0%) | 72 (2.4%) |
| 2 or 3 Rooms | 269 (3.1%) | 504 (16.8%) |
| 4 or 5 Rooms | 2,805 (32.3%) | 1,376 (45.9%) |
| 6 or 7 Rooms | 3,542 (40.8%) | 820 (27.4%) |
| 8 or more Rooms | 2,071 (23.8%) | 225 (7.5%) |
| Total | 8,687 (100.0%) | 2,997 (100.0%) |
Housing Structure by Heating Type in Clarendon County
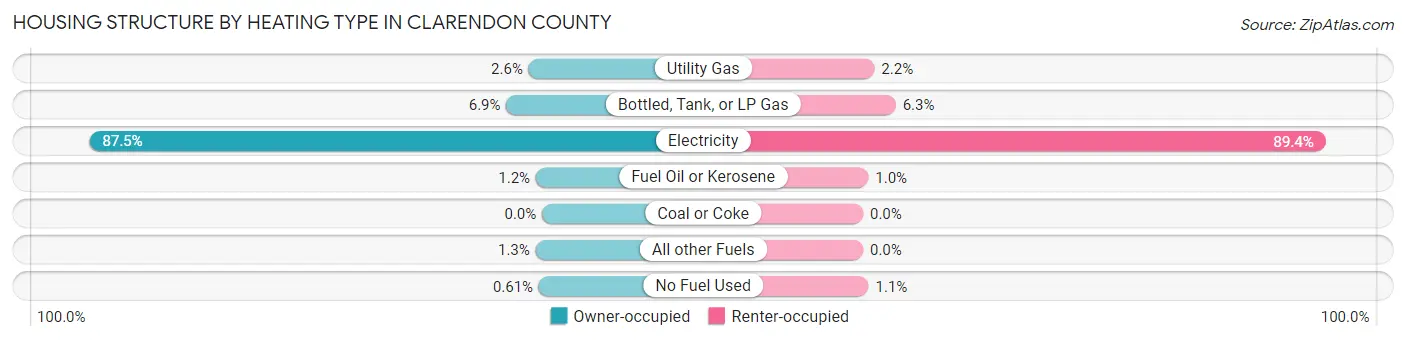
| Heating Type | Owner-occupied | Renter-occupied |
| Utility Gas | 224 (2.6%) | 66 (2.2%) |
| Bottled, Tank, or LP Gas | 599 (6.9%) | 189 (6.3%) |
| Electricity | 7,599 (87.5%) | 2,679 (89.4%) |
| Fuel Oil or Kerosene | 103 (1.2%) | 31 (1.0%) |
| Coal or Coke | 0 (0.0%) | 0 (0.0%) |
| All other Fuels | 109 (1.3%) | 0 (0.0%) |
| No Fuel Used | 53 (0.6%) | 32 (1.1%) |
| Total | 8,687 (100.0%) | 2,997 (100.0%) |
Household Vehicle Usage in Clarendon County
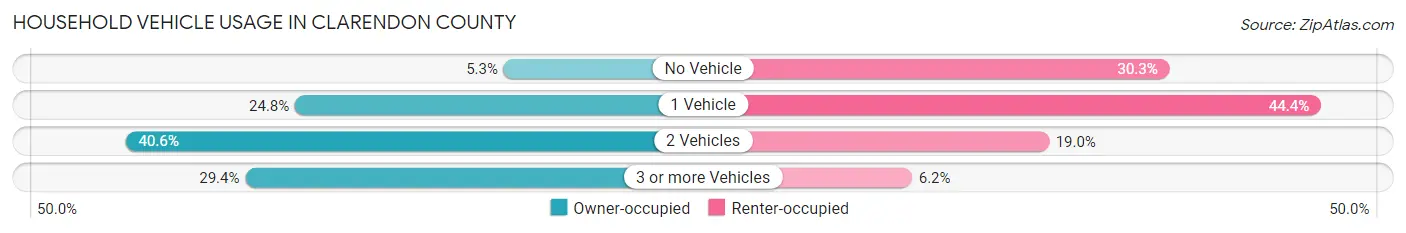
| Vehicles per Household | Owner-occupied | Renter-occupied |
| No Vehicle | 458 (5.3%) | 908 (30.3%) |
| 1 Vehicle | 2,150 (24.7%) | 1,332 (44.4%) |
| 2 Vehicles | 3,525 (40.6%) | 570 (19.0%) |
| 3 or more Vehicles | 2,554 (29.4%) | 187 (6.2%) |
| Total | 8,687 (100.0%) | 2,997 (100.0%) |
Real Estate & Mortgages in Clarendon County
Real Estate and Mortgage Overview in Clarendon County
| Characteristic | Without Mortgage | With Mortgage |
| Housing Units | 4,973 | 3,714 |
| Median Property Value | $106,900 | $169,000 |
| Median Household Income | $51,607 | $496 |
| Monthly Housing Costs | $377 | $64 |
| Real Estate Taxes | $658 | $306 |
Property Value by Mortgage Status in Clarendon County
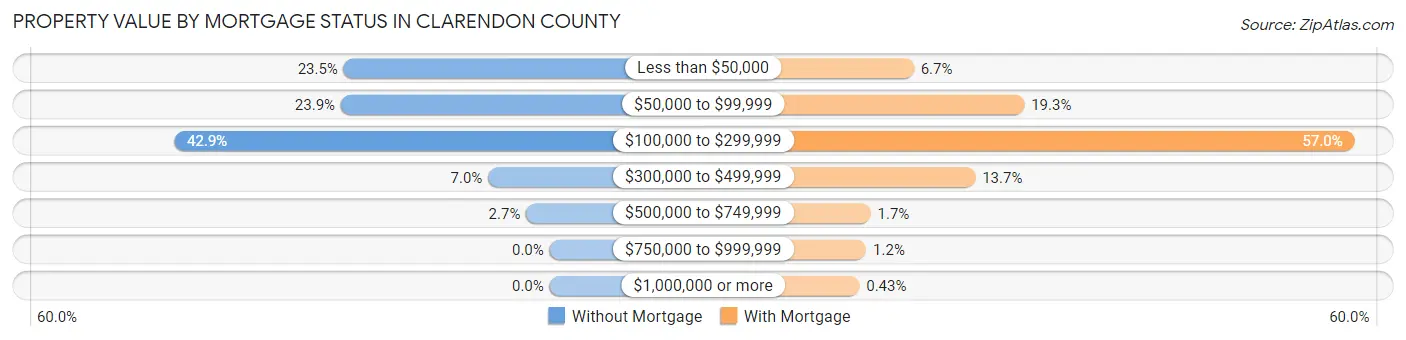
| Property Value | Without Mortgage | With Mortgage |
| Less than $50,000 | 1,170 (23.5%) | 247 (6.7%) |
| $50,000 to $99,999 | 1,186 (23.8%) | 716 (19.3%) |
| $100,000 to $299,999 | 2,135 (42.9%) | 2,118 (57.0%) |
| $300,000 to $499,999 | 349 (7.0%) | 508 (13.7%) |
| $500,000 to $749,999 | 133 (2.7%) | 64 (1.7%) |
| $750,000 to $999,999 | 0 (0.0%) | 45 (1.2%) |
| $1,000,000 or more | 0 (0.0%) | 16 (0.4%) |
| Total | 4,973 (100.0%) | 3,714 (100.0%) |
Household Income by Mortgage Status in Clarendon County
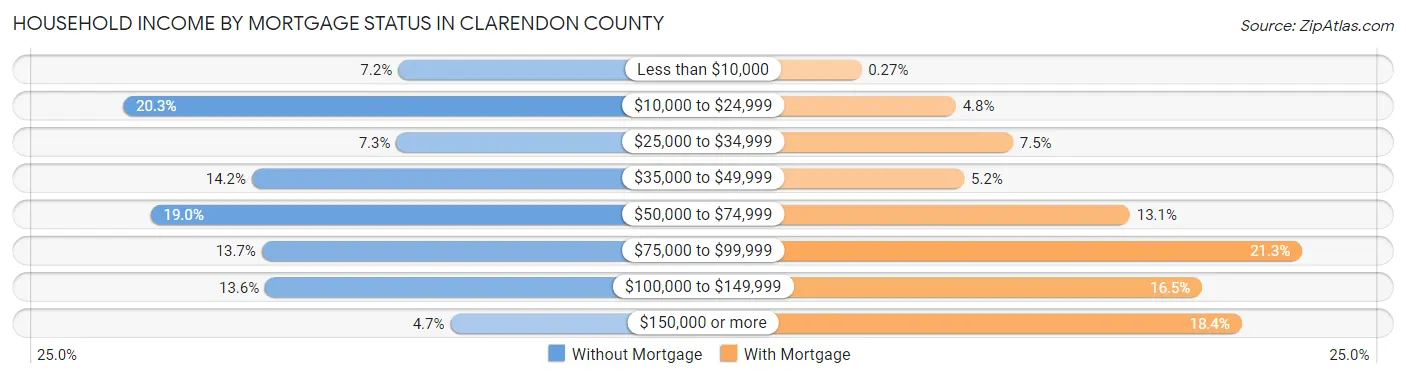
| Household Income | Without Mortgage | With Mortgage |
| Less than $10,000 | 359 (7.2%) | 10 (0.3%) |
| $10,000 to $24,999 | 1,010 (20.3%) | 177 (4.8%) |
| $25,000 to $34,999 | 363 (7.3%) | 278 (7.5%) |
| $35,000 to $49,999 | 705 (14.2%) | 192 (5.2%) |
| $50,000 to $74,999 | 945 (19.0%) | 485 (13.1%) |
| $75,000 to $99,999 | 682 (13.7%) | 790 (21.3%) |
| $100,000 to $149,999 | 674 (13.6%) | 613 (16.5%) |
| $150,000 or more | 235 (4.7%) | 683 (18.4%) |
| Total | 4,973 (100.0%) | 3,714 (100.0%) |
Property Value to Household Income Ratio in Clarendon County
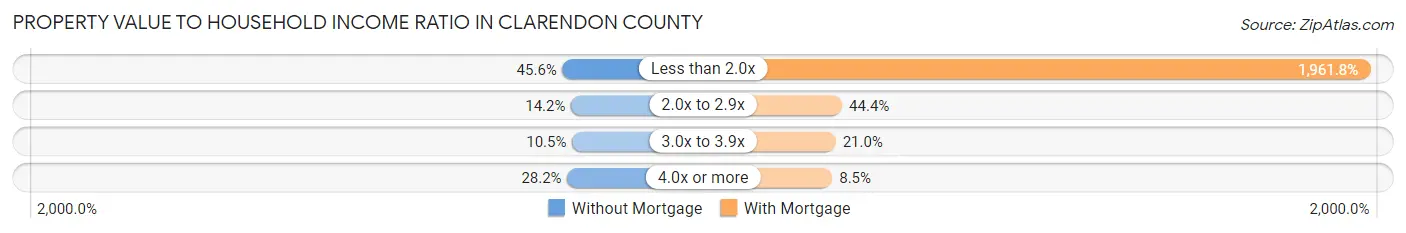
| Value-to-Income Ratio | Without Mortgage | With Mortgage |
| Less than 2.0x | 2,269 (45.6%) | 72,862 (1,961.8%) |
| 2.0x to 2.9x | 708 (14.2%) | 1,648 (44.4%) |
| 3.0x to 3.9x | 523 (10.5%) | 781 (21.0%) |
| 4.0x or more | 1,402 (28.2%) | 317 (8.5%) |
| Total | 4,973 (100.0%) | 3,714 (100.0%) |
Real Estate Taxes by Mortgage Status in Clarendon County
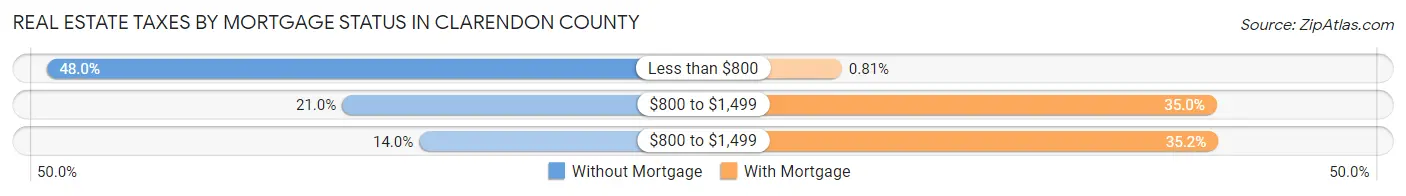
| Property Taxes | Without Mortgage | With Mortgage |
| Less than $800 | 2,387 (48.0%) | 30 (0.8%) |
| $800 to $1,499 | 1,045 (21.0%) | 1,301 (35.0%) |
| $800 to $1,499 | 695 (14.0%) | 1,306 (35.2%) |
| Total | 4,973 (100.0%) | 3,714 (100.0%) |
Health & Disability in Clarendon County
Health Insurance Coverage by Age in Clarendon County
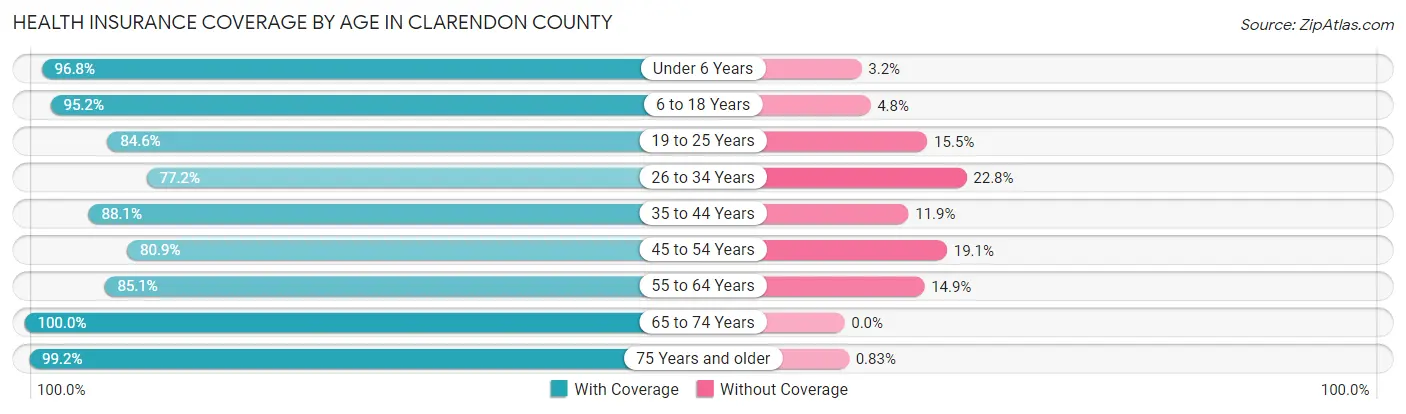
| Age Bracket | With Coverage | Without Coverage |
| Under 6 Years | 1,582 (96.8%) | 52 (3.2%) |
| 6 to 18 Years | 4,287 (95.2%) | 218 (4.8%) |
| 19 to 25 Years | 2,140 (84.6%) | 391 (15.4%) |
| 26 to 34 Years | 2,165 (77.2%) | 638 (22.8%) |
| 35 to 44 Years | 2,635 (88.1%) | 357 (11.9%) |
| 45 to 54 Years | 2,743 (80.9%) | 648 (19.1%) |
| 55 to 64 Years | 3,959 (85.1%) | 693 (14.9%) |
| 65 to 74 Years | 4,468 (100.0%) | 0 (0.0%) |
| 75 Years and older | 2,871 (99.2%) | 24 (0.8%) |
| Total | 26,850 (89.9%) | 3,021 (10.1%) |
Health Insurance Coverage by Citizenship Status in Clarendon County
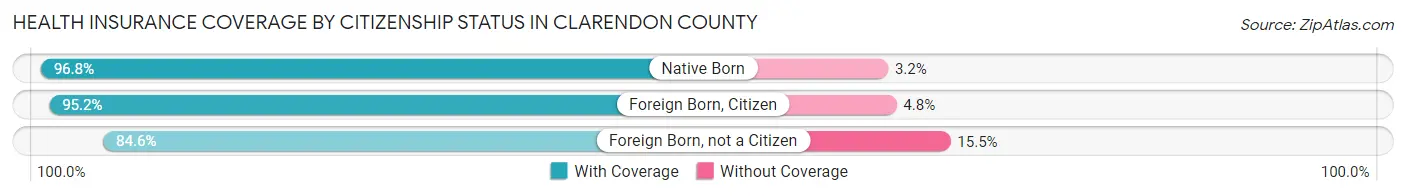
| Citizenship Status | With Coverage | Without Coverage |
| Native Born | 1,582 (96.8%) | 52 (3.2%) |
| Foreign Born, Citizen | 4,287 (95.2%) | 218 (4.8%) |
| Foreign Born, not a Citizen | 2,140 (84.6%) | 391 (15.4%) |
Health Insurance Coverage by Household Income in Clarendon County
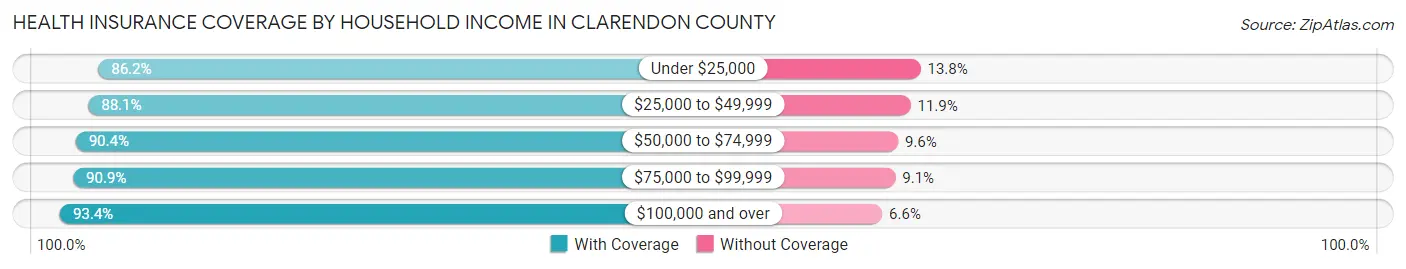
| Household Income | With Coverage | Without Coverage |
| Under $25,000 | 5,308 (86.2%) | 851 (13.8%) |
| $25,000 to $49,999 | 5,267 (88.1%) | 714 (11.9%) |
| $50,000 to $74,999 | 4,675 (90.4%) | 496 (9.6%) |
| $75,000 to $99,999 | 4,793 (90.9%) | 479 (9.1%) |
| $100,000 and over | 6,714 (93.4%) | 477 (6.6%) |
Public vs Private Health Insurance Coverage by Age in Clarendon County
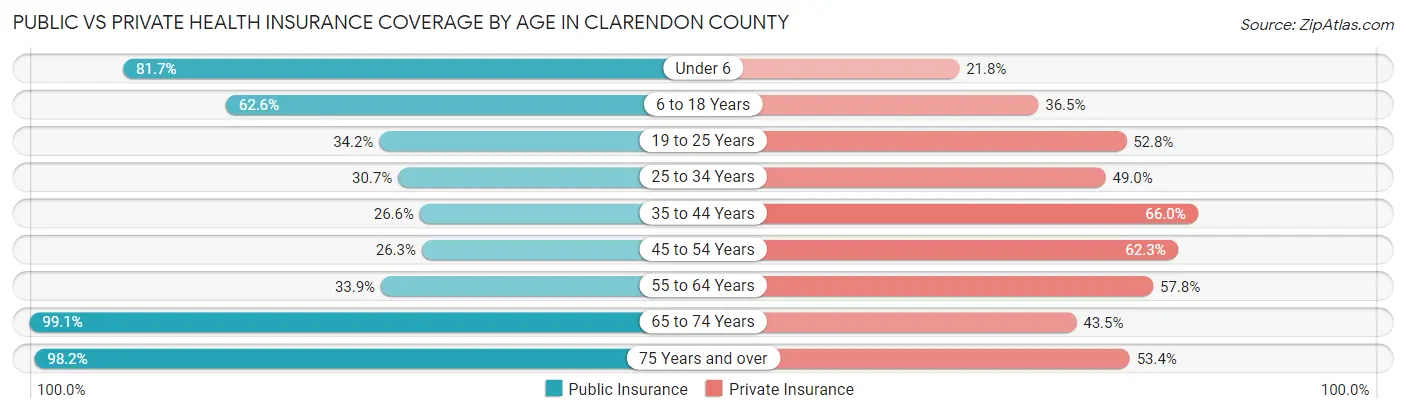
| Age Bracket | Public Insurance | Private Insurance |
| Under 6 | 1,335 (81.7%) | 356 (21.8%) |
| 6 to 18 Years | 2,822 (62.6%) | 1,643 (36.5%) |
| 19 to 25 Years | 865 (34.2%) | 1,336 (52.8%) |
| 25 to 34 Years | 860 (30.7%) | 1,372 (48.9%) |
| 35 to 44 Years | 797 (26.6%) | 1,976 (66.0%) |
| 45 to 54 Years | 891 (26.3%) | 2,113 (62.3%) |
| 55 to 64 Years | 1,575 (33.9%) | 2,688 (57.8%) |
| 65 to 74 Years | 4,428 (99.1%) | 1,945 (43.5%) |
| 75 Years and over | 2,843 (98.2%) | 1,547 (53.4%) |
| Total | 16,416 (55.0%) | 14,976 (50.1%) |
Disability Status by Sex by Age in Clarendon County
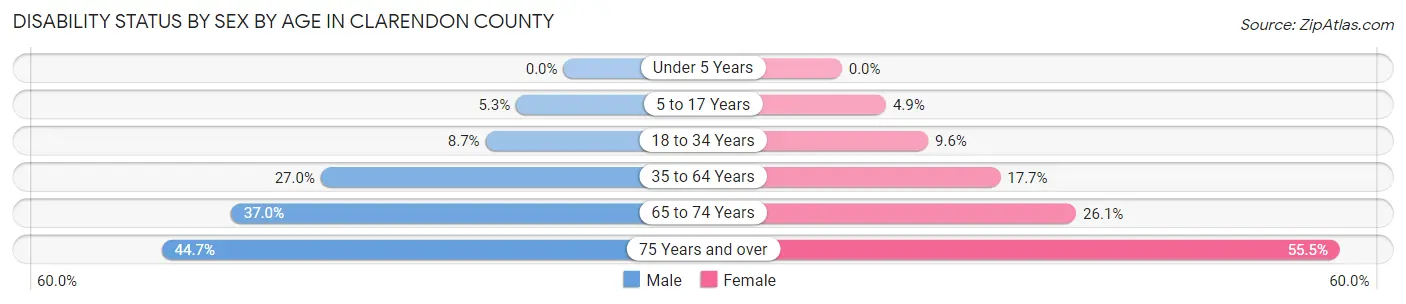
| Age Bracket | Male | Female |
| Under 5 Years | 0 (0.0%) | 0 (0.0%) |
| 5 to 17 Years | 122 (5.3%) | 105 (4.9%) |
| 18 to 34 Years | 241 (8.7%) | 275 (9.6%) |
| 35 to 64 Years | 1,375 (27.0%) | 1,050 (17.7%) |
| 65 to 74 Years | 738 (37.0%) | 646 (26.1%) |
| 75 Years and over | 561 (44.7%) | 910 (55.4%) |
Disability Class by Sex by Age in Clarendon County
Disability Class: Hearing Difficulty
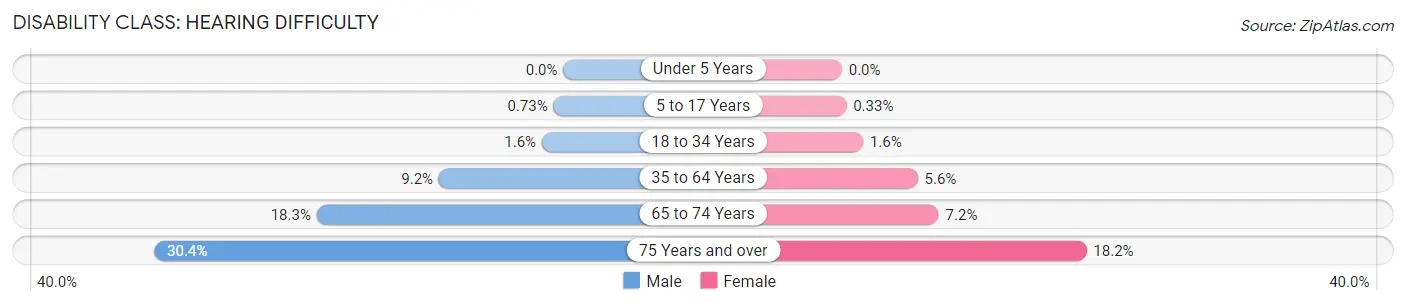
| Age Bracket | Male | Female |
| Under 5 Years | 0 (0.0%) | 0 (0.0%) |
| 5 to 17 Years | 17 (0.7%) | 7 (0.3%) |
| 18 to 34 Years | 44 (1.6%) | 45 (1.6%) |
| 35 to 64 Years | 470 (9.2%) | 335 (5.6%) |
| 65 to 74 Years | 365 (18.3%) | 178 (7.2%) |
| 75 Years and over | 381 (30.4%) | 298 (18.2%) |
Disability Class: Vision Difficulty
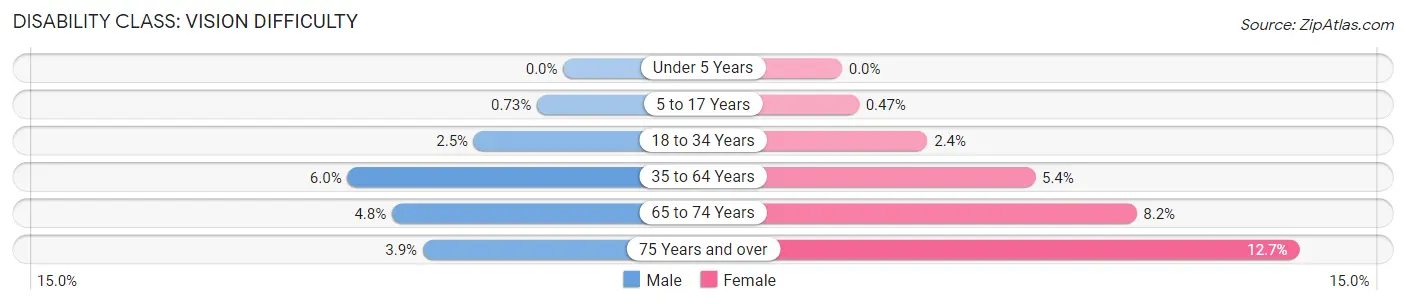
| Age Bracket | Male | Female |
| Under 5 Years | 0 (0.0%) | 0 (0.0%) |
| 5 to 17 Years | 17 (0.7%) | 10 (0.5%) |
| 18 to 34 Years | 69 (2.5%) | 68 (2.4%) |
| 35 to 64 Years | 306 (6.0%) | 320 (5.4%) |
| 65 to 74 Years | 95 (4.8%) | 203 (8.2%) |
| 75 Years and over | 49 (3.9%) | 209 (12.7%) |
Disability Class: Cognitive Difficulty
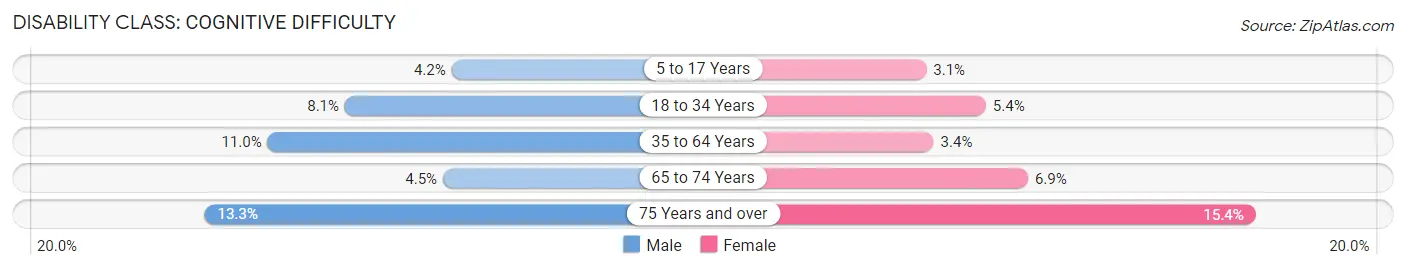
| Age Bracket | Male | Female |
| 5 to 17 Years | 96 (4.2%) | 67 (3.1%) |
| 18 to 34 Years | 225 (8.1%) | 153 (5.3%) |
| 35 to 64 Years | 559 (11.0%) | 203 (3.4%) |
| 65 to 74 Years | 89 (4.5%) | 171 (6.9%) |
| 75 Years and over | 167 (13.3%) | 252 (15.4%) |
Disability Class: Ambulatory Difficulty
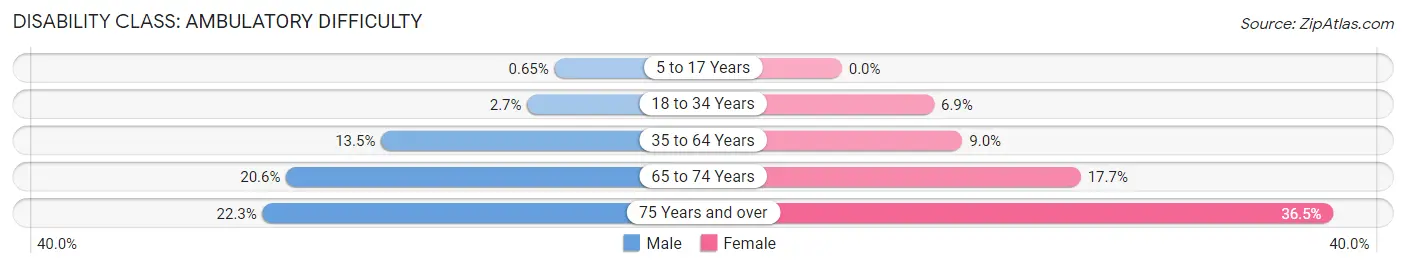
| Age Bracket | Male | Female |
| 5 to 17 Years | 15 (0.6%) | 0 (0.0%) |
| 18 to 34 Years | 74 (2.7%) | 196 (6.9%) |
| 35 to 64 Years | 688 (13.5%) | 532 (8.9%) |
| 65 to 74 Years | 410 (20.6%) | 439 (17.7%) |
| 75 Years and over | 280 (22.3%) | 599 (36.5%) |
Disability Class: Self-Care Difficulty
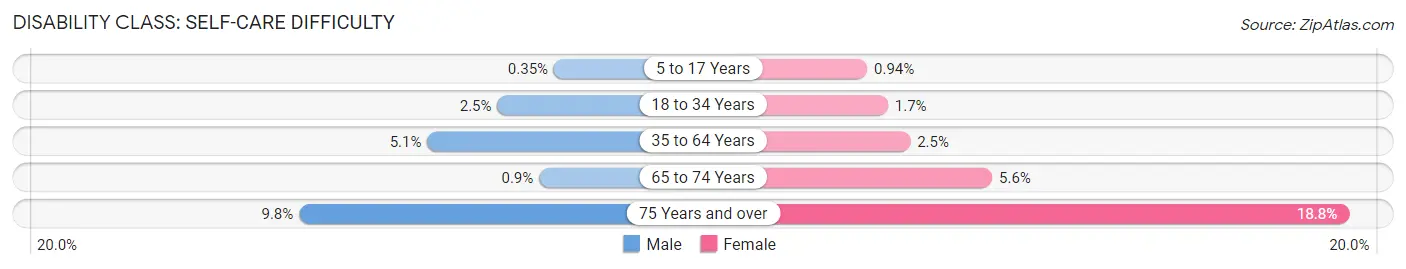
| Age Bracket | Male | Female |
| 5 to 17 Years | 8 (0.4%) | 20 (0.9%) |
| 18 to 34 Years | 68 (2.5%) | 49 (1.7%) |
| 35 to 64 Years | 257 (5.1%) | 151 (2.5%) |
| 65 to 74 Years | 18 (0.9%) | 138 (5.6%) |
| 75 Years and over | 123 (9.8%) | 309 (18.8%) |
Technology Access in Clarendon County
Computing Device Access in Clarendon County
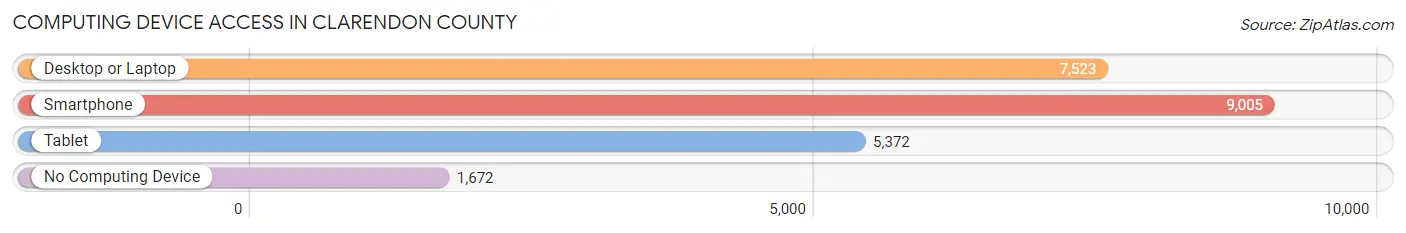
| Device Type | # Households | % Households |
| Desktop or Laptop | 7,523 | 64.4% |
| Smartphone | 9,005 | 77.1% |
| Tablet | 5,372 | 46.0% |
| No Computing Device | 1,672 | 14.3% |
| Total | 11,684 | 100.0% |
Internet Access in Clarendon County
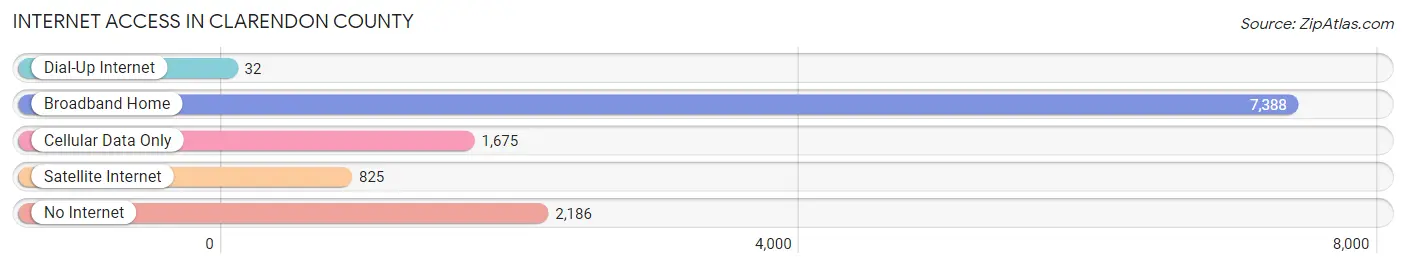
| Internet Type | # Households | % Households |
| Dial-Up Internet | 32 | 0.3% |
| Broadband Home | 7,388 | 63.2% |
| Cellular Data Only | 1,675 | 14.3% |
| Satellite Internet | 825 | 7.1% |
| No Internet | 2,186 | 18.7% |
| Total | 11,684 | 100.0% |
Clarendon County Summary
Clarendon County is located in the northeastern part of South Carolina, and is part of the Pee Dee region. It is bordered by Sumter County to the north, Florence County to the east, Lee County to the south, and Williamsburg County to the west. The county seat is Manning, and the largest city is Summerton. The county was established in 1785 and named for Edward Hyde, Earl of Clarendon.
Geography
Clarendon County covers an area of 837 square miles, of which 835 square miles is land and 2 square miles is water. The county is located in the Coastal Plain region of South Carolina, and is mostly flat with some rolling hills. The Black River runs through the county, and there are several other small streams and creeks. The county is mostly rural, with some small towns and villages scattered throughout.
Demographics
As of the 2010 census, the population of Clarendon County was 34,971, an increase of 8.3% since 2000. The population density was 42 people per square mile. The racial makeup of the county was 57.3% African American, 40.2% White, 0.4% Native American, 0.3% Asian, 0.2% Pacific Islander, 0.7% from other races, and 0.9% from two or more races. Hispanic or Latino of any race were 1.7% of the population.
The median income for a household in the county was $30,945, and the median income for a family was $37,945. The per capita income for the county was $15,945. About 22.3% of the population was below the poverty line.
Economy
The economy of Clarendon County is largely based on agriculture. The county is home to several large farms, and the main crops grown are cotton, soybeans, corn, and peanuts. The county also has a thriving timber industry, and there are several sawmills and wood-processing plants in the area.
In addition to agriculture, Clarendon County is home to several manufacturing plants. The largest employer in the county is the Santee Cooper power plant, which produces electricity for the region. There are also several small businesses in the county, including restaurants, retail stores, and service providers.
Conclusion
Clarendon County is a rural county located in the northeastern part of South Carolina. It is mostly flat with some rolling hills, and is home to several large farms and timber operations. The population of the county is mostly African American, and the median income is lower than the state average. The economy of the county is largely based on agriculture, with some manufacturing and small businesses.
Common Questions
What is Per Capita Income in Clarendon County?
Per Capita income in Clarendon County is $26,290.
What is the Median Family Income in Clarendon County?
Median Family Income in Clarendon County is $66,635.
What is the Median Household income in Clarendon County?
Median Household Income in Clarendon County is $48,677.
What is Income or Wage Gap in Clarendon County?
Income or Wage Gap in Clarendon County is 29.2%.
Women in Clarendon County earn 70.8 cents for every dollar earned by a man.
What is Family Income Deficit in Clarendon County?
Family Income Deficit in Clarendon County is $10,477.
Families that are below poverty line in Clarendon County earn $10,477 less on average than the poverty threshold level.
What is Inequality or Gini Index in Clarendon County?
Inequality or Gini Index in Clarendon County is 0.48.
What is the Total Population of Clarendon County?
Total Population of Clarendon County is 31,163.
What is the Total Male Population of Clarendon County?
Total Male Population of Clarendon County is 15,383.
What is the Total Female Population of Clarendon County?
Total Female Population of Clarendon County is 15,780.
What is the Ratio of Males per 100 Females in Clarendon County?
There are 97.48 Males per 100 Females in Clarendon County.
What is the Ratio of Females per 100 Males in Clarendon County?
There are 102.58 Females per 100 Males in Clarendon County.
What is the Median Population Age in Clarendon County?
Median Population Age in Clarendon County is 45.5 Years.
What is the Average Family Size in Clarendon County
Average Family Size in Clarendon County is 3.3 People.
What is the Average Household Size in Clarendon County
Average Household Size in Clarendon County is 2.5 People.
How Large is the Labor Force in Clarendon County?
There are 12,405 People in the Labor Forcein in Clarendon County.
What is the Percentage of People in the Labor Force in Clarendon County?
47.6% of People are in the Labor Force in Clarendon County.
What is the Unemployment Rate in Clarendon County?
Unemployment Rate in Clarendon County is 10.1%.