Cities with the Highest Percentage of Immigrants from Europe in the United States
RELATED REPORTS & OPTIONS
Europe
United States
Compare Cities
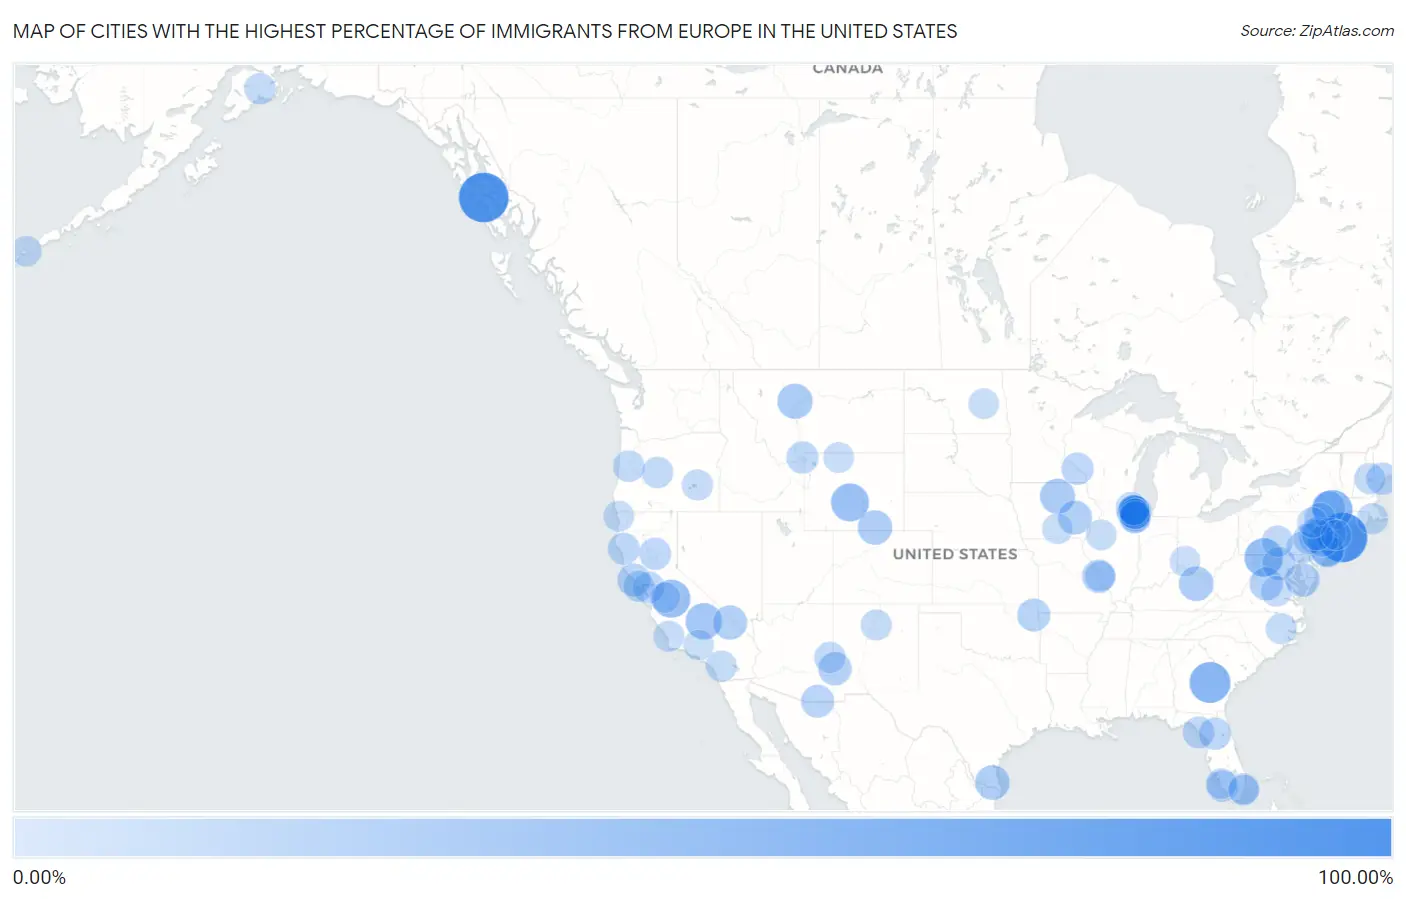
Map of Cities with the Highest Percentage of Immigrants from Europe in the United States
0.00%
100.00%
Cities with the Highest Percentage of Immigrants from Europe in the United States
| City | Europe | vs State | vs National | |
| 1. | Port Protection | 100.00% | 1.03%(+99.0)#1 | 1.46%(+98.5)#1 |
| 2. | Mogollon | 100.00% | 0.69%(+99.3)#1 | 1.46%(+98.5)#2 |
| 3. | Saltaire | 100.00% | 3.48%(+96.5)#1 | 1.46%(+98.5)#3 |
| 4. | Strawberry Cdp Tuolumne County | 71.88% | 1.73%(+70.1)#1 | 1.46%(+70.4)#4 |
| 5. | Norristown | 60.00% | 0.85%(+59.1)#1 | 1.46%(+58.5)#5 |
| 6. | Malden On Hudson | 56.39% | 3.48%(+52.9)#2 | 1.46%(+54.9)#6 |
| 7. | Spring Gap | 50.00% | 1.35%(+48.7)#1 | 1.46%(+48.5)#7 |
| 8. | Tuttle | 47.69% | 1.73%(+46.0)#2 | 1.46%(+46.2)#8 |
| 9. | Jeffrey City | 47.06% | 0.66%(+46.4)#1 | 1.46%(+45.6)#9 |
| 10. | Chimney Hill | 44.74% | 1.26%(+43.5)#1 | 1.46%(+43.3)#10 |
| 11. | Kennedy Meadows | 39.78% | 1.73%(+38.1)#3 | 1.46%(+38.3)#11 |
| 12. | Sun River | 34.48% | 0.70%(+33.8)#1 | 1.46%(+33.0)#12 |
| 13. | Chapin | 34.31% | 0.58%(+33.7)#1 | 1.46%(+32.9)#13 |
| 14. | Wallington Borough | 33.45% | 3.19%(+30.3)#1 | 1.46%(+32.0)#14 |
| 15. | Cedar Glen West | 33.07% | 3.19%(+29.9)#2 | 1.46%(+31.6)#15 |
| 16. | Broadway | 32.43% | 3.19%(+29.2)#3 | 1.46%(+31.0)#16 |
| 17. | Farmers | 32.00% | 0.52%(+31.5)#1 | 1.46%(+30.5)#17 |
| 18. | Yznaga | 31.82% | 0.74%(+31.1)#1 | 1.46%(+30.4)#18 |
| 19. | Albany | 31.25% | 0.66%(+30.6)#2 | 1.46%(+29.8)#19 |
| 20. | Candlewood Isle | 31.05% | 3.31%(+27.7)#1 | 1.46%(+29.6)#20 |
| 21. | Shoshone | 30.43% | 1.73%(+28.7)#4 | 1.46%(+29.0)#21 |
| 22. | Conroy | 29.41% | 0.58%(+28.8)#2 | 1.46%(+28.0)#22 |
| 23. | Harwood Heights | 28.80% | 2.85%(+25.9)#1 | 1.46%(+27.3)#23 |
| 24. | Elliott | 28.57% | 1.35%(+27.2)#2 | 1.46%(+27.1)#24 |
| 25. | Schiller Park | 28.03% | 2.85%(+25.2)#2 | 1.46%(+26.6)#25 |
| 26. | Norridge | 26.66% | 2.85%(+23.8)#3 | 1.46%(+25.2)#26 |
| 27. | St George | 26.61% | 0.74%(+25.9)#1 | 1.46%(+25.2)#27 |
| 28. | Free Union | 25.95% | 1.21%(+24.7)#1 | 1.46%(+24.5)#28 |
| 29. | Glenwood | 25.93% | 0.69%(+25.2)#2 | 1.46%(+24.5)#29 |
| 30. | Hillsboro | 25.66% | 1.21%(+24.4)#2 | 1.46%(+24.2)#30 |
| 31. | Hunter | 25.00% | 3.48%(+21.5)#3 | 1.46%(+23.5)#31 |
| 32. | Carmet | 25.00% | 1.73%(+23.3)#5 | 1.46%(+23.5)#32 |
| 33. | Old Eucha | 25.00% | 0.43%(+24.6)#1 | 1.46%(+23.5)#33 |
| 34. | Palominas | 24.36% | 1.19%(+23.2)#1 | 1.46%(+22.9)#34 |
| 35. | Buttzville | 24.27% | 3.19%(+21.1)#4 | 1.46%(+22.8)#35 |
| 36. | Topstone | 23.03% | 3.31%(+19.7)#2 | 1.46%(+21.6)#36 |
| 37. | Holiday Heights | 22.30% | 3.19%(+19.1)#5 | 1.46%(+20.8)#37 |
| 38. | Lebanon Borough | 21.83% | 3.19%(+18.6)#6 | 1.46%(+20.4)#38 |
| 39. | Minneiska | 21.57% | 0.79%(+20.8)#1 | 1.46%(+20.1)#39 |
| 40. | Reddick | 21.19% | 2.00%(+19.2)#1 | 1.46%(+19.7)#40 |
| 41. | Little Falls | 21.10% | 0.90%(+20.2)#1 | 1.46%(+19.6)#41 |
| 42. | Hebgen Lake Estates | 21.05% | 0.70%(+20.3)#2 | 1.46%(+19.6)#42 |
| 43. | Benbow | 20.92% | 1.73%(+19.2)#6 | 1.46%(+19.5)#43 |
| 44. | Concow | 20.90% | 1.73%(+19.2)#7 | 1.46%(+19.4)#44 |
| 45. | Horseshoe Beach | 20.51% | 2.00%(+18.5)#2 | 1.46%(+19.1)#45 |
| 46. | Hankins | 20.30% | 3.48%(+16.8)#4 | 1.46%(+18.8)#46 |
| 47. | Garfield | 20.18% | 3.19%(+17.0)#7 | 1.46%(+18.7)#47 |
| 48. | Gandys Beach | 20.00% | 3.19%(+16.8)#8 | 1.46%(+18.5)#48 |
| 49. | North Gate | 19.78% | 1.73%(+18.1)#8 | 1.46%(+18.3)#49 |
| 50. | East Earl | 19.58% | 1.29%(+18.3)#1 | 1.46%(+18.1)#50 |
| 51. | Knollcrest | 18.87% | 3.31%(+15.6)#3 | 1.46%(+17.4)#51 |
| 52. | Verona Walk | 18.78% | 2.00%(+16.8)#3 | 1.46%(+17.3)#52 |
| 53. | Bellfountain | 18.60% | 1.47%(+17.1)#1 | 1.46%(+17.1)#53 |
| 54. | Nutrioso | 18.29% | 1.19%(+17.1)#2 | 1.46%(+16.8)#54 |
| 55. | Atkinson Mills | 18.25% | 1.29%(+17.0)#2 | 1.46%(+16.8)#55 |
| 56. | Palos Hills | 18.25% | 2.85%(+15.4)#4 | 1.46%(+16.8)#56 |
| 57. | Seventh Mountain | 18.00% | 1.47%(+16.5)#2 | 1.46%(+16.5)#57 |
| 58. | Smallwood | 17.87% | 3.48%(+14.4)#5 | 1.46%(+16.4)#58 |
| 59. | Primrose | 17.86% | 1.03%(+16.8)#2 | 1.46%(+16.4)#59 |
| 60. | Trexlertown | 17.51% | 1.29%(+16.2)#3 | 1.46%(+16.1)#60 |
| 61. | Griggstown | 17.33% | 3.19%(+14.1)#9 | 1.46%(+15.9)#61 |
| 62. | San Geronimo | 17.33% | 1.73%(+15.6)#9 | 1.46%(+15.9)#62 |
| 63. | Aguanga | 17.08% | 1.73%(+15.4)#10 | 1.46%(+15.6)#63 |
| 64. | Chimney Point | 16.98% | 3.31%(+13.7)#4 | 1.46%(+15.5)#64 |
| 65. | North Westport | 16.95% | 3.30%(+13.7)#1 | 1.46%(+15.5)#65 |
| 66. | Crane | 16.88% | 1.47%(+15.4)#3 | 1.46%(+15.4)#66 |
| 67. | Melvin Village | 16.67% | 1.44%(+15.2)#1 | 1.46%(+15.2)#67 |
| 68. | Sunny Isles Beach | 16.58% | 2.00%(+14.6)#4 | 1.46%(+15.1)#68 |
| 69. | Hickory Hills | 16.51% | 2.85%(+13.7)#5 | 1.46%(+15.1)#69 |
| 70. | Rock Ridge | 16.51% | 3.31%(+13.2)#5 | 1.46%(+15.1)#70 |
| 71. | Bell Arthur | 16.50% | 0.90%(+15.6)#1 | 1.46%(+15.0)#71 |
| 72. | Port Colden | 16.44% | 3.19%(+13.3)#10 | 1.46%(+15.0)#72 |
| 73. | Forest Lake | 16.37% | 2.85%(+13.5)#6 | 1.46%(+14.9)#73 |
| 74. | River Grove | 16.34% | 2.85%(+13.5)#7 | 1.46%(+14.9)#74 |
| 75. | Niles | 16.18% | 2.85%(+13.3)#8 | 1.46%(+14.7)#75 |
| 76. | Cuyamungue Grant | 16.07% | 0.69%(+15.4)#3 | 1.46%(+14.6)#76 |
| 77. | Norris | 15.91% | 0.70%(+15.2)#3 | 1.46%(+14.5)#77 |
| 78. | Edna | 15.77% | 1.73%(+14.0)#11 | 1.46%(+14.3)#78 |
| 79. | Hiouchi | 15.60% | 1.73%(+13.9)#12 | 1.46%(+14.1)#79 |
| 80. | Goochland | 15.53% | 1.21%(+14.3)#3 | 1.46%(+14.1)#80 |
| 81. | Wood Dale | 15.45% | 2.85%(+12.6)#9 | 1.46%(+14.0)#81 |
| 82. | Akutan | 15.37% | 1.03%(+14.3)#3 | 1.46%(+13.9)#82 |
| 83. | Wheeling | 14.82% | 2.85%(+12.0)#10 | 1.46%(+13.4)#83 |
| 84. | Sutton | 14.63% | 0.48%(+14.2)#1 | 1.46%(+13.2)#84 |
| 85. | Bella Villa | 14.53% | 0.74%(+13.8)#2 | 1.46%(+13.1)#85 |
| 86. | The Hideout | 14.50% | 1.29%(+13.2)#4 | 1.46%(+13.0)#86 |
| 87. | Island Walk | 14.45% | 2.00%(+12.4)#5 | 1.46%(+13.0)#87 |
| 88. | Williamson | 14.39% | 0.58%(+13.8)#3 | 1.46%(+12.9)#88 |
| 89. | Garland | 14.36% | 0.66%(+13.7)#3 | 1.46%(+12.9)#89 |
| 90. | Maquon | 14.36% | 2.85%(+11.5)#11 | 1.46%(+12.9)#90 |
| 91. | Greenvale | 14.35% | 3.48%(+10.9)#6 | 1.46%(+12.9)#91 |
| 92. | Bal Harbour | 14.30% | 2.00%(+12.3)#6 | 1.46%(+12.8)#92 |
| 93. | Prospect Heights | 14.27% | 2.85%(+11.4)#12 | 1.46%(+12.8)#93 |
| 94. | Justice | 14.27% | 2.85%(+11.4)#13 | 1.46%(+12.8)#94 |
| 95. | East Vineland | 14.26% | 3.19%(+11.1)#11 | 1.46%(+12.8)#95 |
| 96. | Lake Hughes | 14.19% | 1.73%(+12.5)#13 | 1.46%(+12.7)#96 |
| 97. | Le Raysville Borough | 14.19% | 1.29%(+12.9)#5 | 1.46%(+12.7)#97 |
| 98. | Elmwood Park | 14.16% | 2.85%(+11.3)#14 | 1.46%(+12.7)#98 |
| 99. | Kings Mills | 14.15% | 0.85%(+13.3)#1 | 1.46%(+12.7)#99 |
| 100. | Hilmar Irwin | 14.08% | 1.73%(+12.4)#14 | 1.46%(+12.6)#100 |
Common Questions
What are the Top 10 Cities with the Highest Percentage of Immigrants from Europe in the United States?
Top 10 Cities with the Highest Percentage of Immigrants from Europe in the United States are:
#1
100.00%
#2
100.00%
#3
60.00%
#4
56.39%
#5
50.00%
#6
47.69%
#7
47.06%
#8
39.78%
#9
34.48%
#10
34.31%
What city has the Highest Percentage of Immigrants from Europe in the United States?
Port Protection has the Highest Percentage of Immigrants from Europe in the United States with 100.00%.
What is the Percentage of Immigrants from Europe in the United States?
Percentage of Immigrants from Europe in the United States is 1.46%.