Cities with the Highest Percentage of Population Employed in Cleaning & Maintenance in the United States
RELATED REPORTS & OPTIONS
Cleaning & Maintenance
United States
Compare Cities
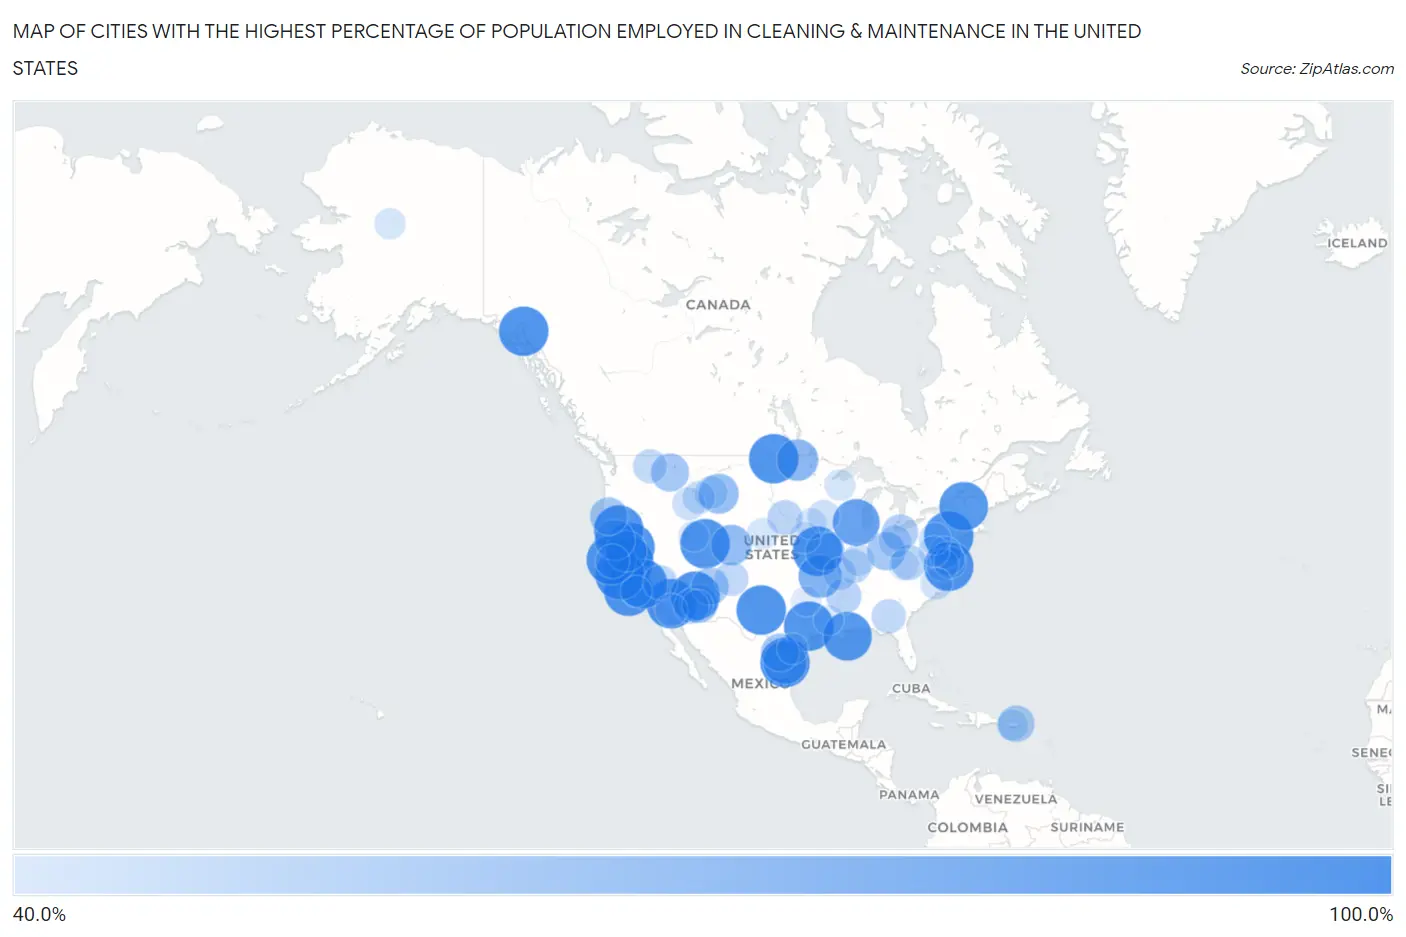
Map of Cities with the Highest Percentage of Population Employed in Cleaning & Maintenance in the United States
0.0%
100.0%
Cities with the Highest Percentage of Population Employed in Cleaning & Maintenance in the United States
| City | % Employed | vs State | vs National | |
| 1. | Iron Horse | 100.0% | 3.7%(+96.3)#1 | 3.5%(+96.5)#1 |
| 2. | Earling | 100.0% | 3.7%(+96.3)#1 | 3.5%(+96.5)#2 |
| 3. | Rayville | 100.0% | 3.2%(+96.8)#1 | 3.5%(+96.5)#3 |
| 4. | Albrightsville | 100.0% | 3.1%(+96.9)#1 | 3.5%(+96.5)#4 |
| 5. | Whiteside | 100.0% | 3.4%(+96.6)#1 | 3.5%(+96.5)#5 |
| 6. | Cibola | 100.0% | 3.9%(+96.1)#1 | 3.5%(+96.5)#6 |
| 7. | Stonega | 100.0% | 3.1%(+96.9)#1 | 3.5%(+96.5)#7 |
| 8. | El Castillo | 100.0% | 3.6%(+96.4)#1 | 3.5%(+96.5)#8 |
| 9. | Mt. Bullion | 100.0% | 3.7%(+96.3)#3 | 3.5%(+96.5)#9 |
| 10. | Tennant | 100.0% | 3.7%(+96.3)#4 | 3.5%(+96.5)#10 |
| 11. | Rail Road Flat | 100.0% | 3.7%(+96.3)#5 | 3.5%(+96.5)#11 |
| 12. | Casmalia | 100.0% | 3.7%(+96.3)#6 | 3.5%(+96.5)#12 |
| 13. | Mud Bay | 100.0% | 3.7%(+96.3)#1 | 3.5%(+96.5)#13 |
| 14. | Randlett | 100.0% | 3.2%(+96.8)#1 | 3.5%(+96.5)#14 |
| 15. | Flowing Springs | 100.0% | 3.9%(+96.1)#2 | 3.5%(+96.5)#15 |
| 16. | Whitesville | 100.0% | 3.1%(+96.9)#2 | 3.5%(+96.5)#16 |
| 17. | Shallow Water | 100.0% | 3.3%(+96.7)#1 | 3.5%(+96.5)#17 |
| 18. | Idlewild | 100.0% | 3.7%(+96.3)#7 | 3.5%(+96.5)#18 |
| 19. | Oakhurst | 100.0% | 3.6%(+96.4)#2 | 3.5%(+96.5)#19 |
| 20. | Overly | 100.0% | 3.6%(+96.4)#1 | 3.5%(+96.5)#20 |
| 21. | Stillwell | 100.0% | 3.2%(+96.8)#1 | 3.5%(+96.5)#21 |
| 22. | Moss Landing | 100.0% | 3.7%(+96.3)#8 | 3.5%(+96.5)#23 |
| 23. | Goodland | 100.0% | 3.0%(+97.0)#1 | 3.5%(+96.5)#24 |
| 24. | Salmon Creek | 100.0% | 3.7%(+96.3)#9 | 3.5%(+96.5)#25 |
| 25. | Los Ybanez | 100.0% | 3.6%(+96.4)#3 | 3.5%(+96.5)#26 |
| 26. | Princeton | 100.0% | 3.7%(+96.3)#1 | 3.5%(+96.5)#27 |
| 27. | Hopeton | 100.0% | 3.6%(+96.4)#1 | 3.5%(+96.5)#28 |
| 28. | Kelly | 100.0% | 3.3%(+96.7)#2 | 3.5%(+96.5)#29 |
| 29. | Pointe A La Hache | 97.8% | 3.7%(+94.1)#1 | 3.5%(+94.4)#30 |
| 30. | Witherbee | 97.4% | 3.6%(+93.8)#1 | 3.5%(+94.0)#31 |
| 31. | Chemung | 92.5% | 3.2%(+89.3)#1 | 3.5%(+89.0)#32 |
| 32. | Villarreal | 83.3% | 3.6%(+79.8)#4 | 3.5%(+79.9)#33 |
| 33. | Driftwood Borough | 83.3% | 3.1%(+80.2)#2 | 3.5%(+79.9)#34 |
| 34. | Chain O Lakes | 82.1% | 3.2%(+79.0)#2 | 3.5%(+78.7)#35 |
| 35. | Donaldson | 77.8% | 3.0%(+74.8)#2 | 3.5%(+74.3)#36 |
| 36. | Farlington | 77.5% | 3.3%(+74.2)#3 | 3.5%(+74.0)#37 |
| 37. | Pike | 76.8% | 3.7%(+73.1)#10 | 3.5%(+73.3)#38 |
| 38. | Parshall | 75.5% | 2.9%(+72.6)#1 | 3.5%(+72.0)#39 |
| 39. | Keswick | 75.0% | 3.7%(+71.3)#11 | 3.5%(+71.5)#40 |
| 40. | Fort Smith | 73.5% | 3.8%(+69.7)#1 | 3.5%(+70.0)#41 |
| 41. | Dalton | 71.4% | 3.2%(+68.3)#3 | 3.5%(+67.9)#42 |
| 42. | Cutter | 69.7% | 3.9%(+65.8)#3 | 3.5%(+66.2)#43 |
| 43. | Gough | 69.2% | 3.4%(+65.9)#1 | 3.5%(+65.7)#44 |
| 44. | Olde West Chester | 68.5% | 3.2%(+65.3)#1 | 3.5%(+65.0)#45 |
| 45. | Paradise | 68.4% | 3.8%(+64.6)#2 | 3.5%(+64.9)#46 |
| 46. | San Carlos I | 68.1% | 3.6%(+64.5)#5 | 3.5%(+64.6)#47 |
| 47. | Dillard | 67.3% | 3.2%(+64.1)#1 | 3.5%(+63.8)#48 |
| 48. | Oak Springs | 66.7% | 3.9%(+62.7)#4 | 3.5%(+63.2)#49 |
| 49. | Bairoa La Veinticinco | 64.6% | 5.4%(+59.2)#1 | 3.5%(+61.1)#50 |
| 50. | Groveland | 64.4% | 3.2%(+61.1)#2 | 3.5%(+60.9)#51 |
| 51. | Beulah Beach | 63.2% | 3.2%(+59.9)#2 | 3.5%(+59.7)#52 |
| 52. | Darling | 60.8% | 3.6%(+57.2)#1 | 3.5%(+57.3)#53 |
| 53. | Mount Carbon | 60.6% | 3.7%(+56.9)#2 | 3.5%(+57.1)#54 |
| 54. | Gross | 60.0% | 3.0%(+57.0)#1 | 3.5%(+56.5)#55 |
| 55. | Lower Santan Village | 59.6% | 3.9%(+55.7)#5 | 3.5%(+56.1)#56 |
| 56. | Tecopa | 59.1% | 3.7%(+55.4)#12 | 3.5%(+55.6)#57 |
| 57. | Ferrer | 58.8% | 5.4%(+53.4)#2 | 3.5%(+55.3)#58 |
| 58. | De Soto | 58.1% | 3.4%(+54.7)#2 | 3.5%(+54.6)#59 |
| 59. | El Rito | 58.0% | 3.9%(+54.2)#1 | 3.5%(+54.5)#60 |
| 60. | Whiteash | 57.4% | 3.2%(+54.2)#2 | 3.5%(+53.9)#61 |
| 61. | Clayton | 57.3% | 3.0%(+54.4)#1 | 3.5%(+53.9)#62 |
| 62. | Tomales | 57.1% | 3.7%(+53.4)#13 | 3.5%(+53.7)#63 |
| 63. | Galestown | 57.1% | 3.2%(+53.9)#1 | 3.5%(+53.7)#64 |
| 64. | Abney Crossroads | 57.1% | 3.9%(+53.3)#1 | 3.5%(+53.7)#65 |
| 65. | White Branch | 55.4% | 3.2%(+52.2)#4 | 3.5%(+51.9)#66 |
| 66. | Hunter | 54.9% | 3.2%(+51.7)#5 | 3.5%(+51.4)#67 |
| 67. | Radnor | 54.7% | 3.2%(+51.5)#3 | 3.5%(+51.2)#68 |
| 68. | Wedron | 54.7% | 3.2%(+51.5)#3 | 3.5%(+51.2)#69 |
| 69. | Boyd | 54.5% | 3.8%(+50.8)#3 | 3.5%(+51.1)#70 |
| 70. | Padre Ranchitos | 53.8% | 3.9%(+49.9)#6 | 3.5%(+50.4)#71 |
| 71. | Spencer | 53.8% | 3.5%(+50.3)#1 | 3.5%(+50.4)#72 |
| 72. | Mammoth | 53.6% | 3.7%(+50.0)#1 | 3.5%(+50.1)#73 |
| 73. | Georgetown | 53.6% | 3.2%(+50.4)#2 | 3.5%(+50.1)#74 |
| 74. | Portland | 53.3% | 3.1%(+50.2)#1 | 3.5%(+49.9)#75 |
| 75. | Heathsville | 52.6% | 3.1%(+49.5)#3 | 3.5%(+49.1)#76 |
| 76. | Golden Gate | 52.6% | 3.2%(+49.4)#4 | 3.5%(+49.1)#77 |
| 77. | Stockton | 52.6% | 3.2%(+49.4)#3 | 3.5%(+49.1)#78 |
| 78. | Bogota | 52.5% | 3.4%(+49.1)#2 | 3.5%(+49.1)#79 |
| 79. | Lumber City | 51.9% | 3.1%(+48.8)#3 | 3.5%(+48.5)#80 |
| 80. | Beaver Dam | 51.9% | 3.2%(+48.6)#3 | 3.5%(+48.4)#81 |
| 81. | Stokes | 51.5% | 3.5%(+48.0)#1 | 3.5%(+48.1)#82 |
| 82. | Anon Raices | 50.9% | 5.4%(+45.5)#3 | 3.5%(+47.4)#83 |
| 83. | Lemoyne | 50.0% | 3.0%(+47.0)#2 | 3.5%(+46.5)#84 |
| 84. | Clam Lake | 50.0% | 3.1%(+46.9)#1 | 3.5%(+46.5)#85 |
| 85. | Sundance | 50.0% | 3.2%(+46.8)#2 | 3.5%(+46.5)#86 |
| 86. | Hughes | 50.0% | 3.7%(+46.3)#2 | 3.5%(+46.5)#87 |
| 87. | Kep'el | 50.0% | 3.7%(+46.3)#14 | 3.5%(+46.5)#88 |
| 88. | Wautec | 50.0% | 3.7%(+46.3)#15 | 3.5%(+46.5)#89 |
| 89. | Yetter | 50.0% | 3.1%(+46.9)#2 | 3.5%(+46.5)#90 |
| 90. | Bartlett | 50.0% | 3.1%(+46.9)#3 | 3.5%(+46.5)#91 |
| 91. | Brownsville | 50.0% | 3.2%(+46.8)#4 | 3.5%(+46.5)#92 |
| 92. | Cuyama | 50.0% | 3.7%(+46.3)#16 | 3.5%(+46.5)#93 |
| 93. | Pauline | 49.6% | 3.9%(+45.7)#2 | 3.5%(+46.1)#94 |
| 94. | Del Sol | 49.6% | 3.6%(+46.0)#6 | 3.5%(+46.1)#95 |
| 95. | Echo | 48.7% | 3.2%(+45.5)#3 | 3.5%(+45.2)#96 |
| 96. | Top Of The World | 48.6% | 3.9%(+44.7)#7 | 3.5%(+45.1)#97 |
| 97. | Rossmore | 48.3% | 3.7%(+44.5)#3 | 3.5%(+44.8)#98 |
| 98. | Prospect | 47.7% | 3.7%(+44.0)#2 | 3.5%(+44.2)#99 |
| 99. | Toco | 47.6% | 3.6%(+44.1)#7 | 3.5%(+44.1)#100 |
| 100. | Oark | 47.4% | 3.7%(+43.7)#2 | 3.5%(+43.9)#101 |
Common Questions
What are the Top 10 Cities with the Highest Percentage of Population Employed in Cleaning & Maintenance in the United States?
Top 10 Cities with the Highest Percentage of Population Employed in Cleaning & Maintenance in the United States are:
#1
100.0%
#2
100.0%
#3
100.0%
#4
100.0%
#5
100.0%
#6
100.0%
#7
100.0%
#8
100.0%
#9
100.0%
#10
100.0%
What city has the Highest Percentage of Population Employed in Cleaning & Maintenance in the United States?
Iron Horse has the Highest Percentage of Population Employed in Cleaning & Maintenance in the United States with 100.0%.
What is the Percentage of Population Employed in Cleaning & Maintenance in the United States?
Percentage of Population Employed in Cleaning & Maintenance in the United States is 3.5%.