Cities with the Highest Percentage of Population Employed in Real Estate, Rental & Leasing in the United States
RELATED REPORTS & OPTIONS
Real Estate, Rental & Leasing
United States
Compare Cities
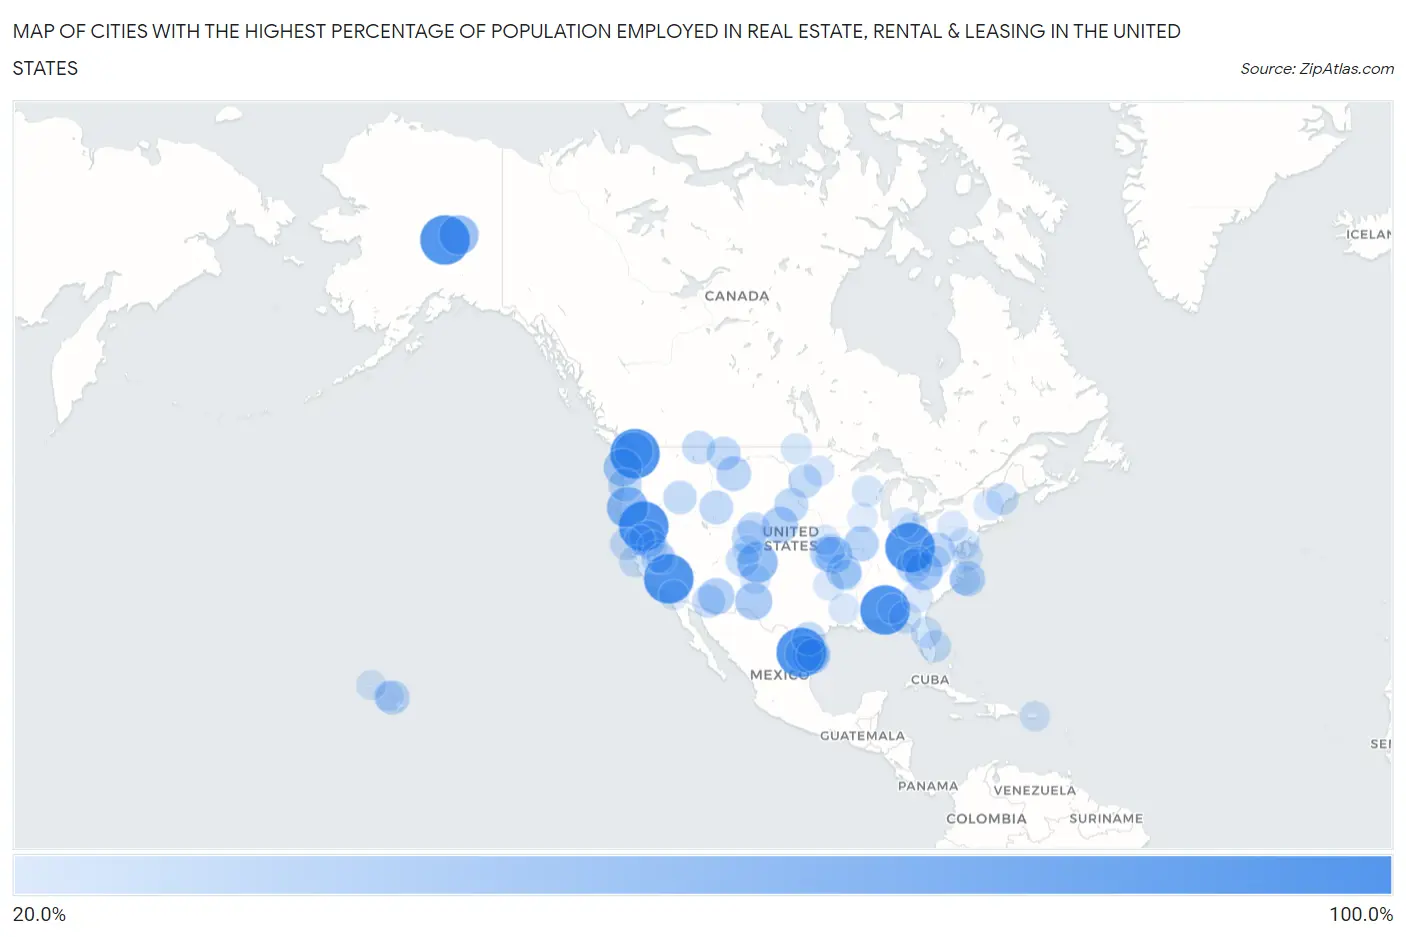
Map of Cities with the Highest Percentage of Population Employed in Real Estate, Rental & Leasing in the United States
0.0%
100.0%
Cities with the Highest Percentage of Population Employed in Real Estate, Rental & Leasing in the United States
| City | % Employed | vs State | vs National | |
| 1. | Los Alvarez | 100.0% | 2.0%(+98.0)#1 | 1.9%(+98.1)#1 |
| 2. | Stonega | 100.0% | 1.9%(+98.1)#1 | 1.9%(+98.1)#2 |
| 3. | Randsburg | 100.0% | 2.1%(+97.9)#1 | 1.9%(+98.1)#3 |
| 4. | Conway | 100.0% | 2.1%(+97.9)#1 | 1.9%(+98.1)#4 |
| 5. | Nubieber | 100.0% | 2.1%(+97.9)#2 | 1.9%(+98.1)#5 |
| 6. | Cherry Fork | 100.0% | 1.5%(+98.5)#1 | 1.9%(+98.1)#6 |
| 7. | Peterman | 100.0% | 1.5%(+98.5)#1 | 1.9%(+98.1)#7 |
| 8. | Stillwell | 100.0% | 1.4%(+98.6)#1 | 1.9%(+98.1)#8 |
| 9. | Sleeping Buffalo | 100.0% | 1.8%(+98.2)#1 | 1.9%(+98.1)#9 |
| 10. | Four Mile Road | 100.0% | 1.7%(+98.3)#1 | 1.9%(+98.1)#10 |
| 11. | Rivergrove | 81.5% | 2.1%(+79.4)#3 | 1.9%(+79.6)#11 |
| 12. | Dillard | 67.3% | 2.0%(+65.4)#1 | 1.9%(+65.4)#12 |
| 13. | Stonewall Gap | 63.6% | 2.4%(+61.2)#1 | 1.9%(+61.7)#13 |
| 14. | Two Rivers | 61.0% | 1.7%(+59.3)#2 | 1.9%(+59.1)#14 |
| 15. | Edison | 56.5% | 2.1%(+54.4)#2 | 1.9%(+54.6)#15 |
| 16. | Waterford | 56.0% | 1.9%(+54.1)#2 | 1.9%(+54.1)#16 |
| 17. | Lozano | 55.5% | 2.0%(+53.5)#2 | 1.9%(+53.6)#17 |
| 18. | Ocean City | 54.3% | 2.1%(+52.3)#3 | 1.9%(+52.5)#18 |
| 19. | Valle Crucis | 53.8% | 1.9%(+52.0)#1 | 1.9%(+52.0)#19 |
| 20. | Riverton | 53.3% | 1.7%(+51.6)#1 | 1.9%(+51.4)#20 |
| 21. | Villarreal | 52.2% | 2.0%(+50.2)#3 | 1.9%(+50.3)#21 |
| 22. | Timberon | 51.9% | 1.6%(+50.3)#1 | 1.9%(+50.0)#22 |
| 23. | Mohawk Vista | 50.0% | 2.1%(+47.9)#4 | 1.9%(+48.1)#23 |
| 24. | Metz | 50.0% | 1.6%(+48.4)#1 | 1.9%(+48.1)#24 |
| 25. | Top Of The World | 48.6% | 2.4%(+46.2)#1 | 1.9%(+46.7)#25 |
| 26. | Belmar | 48.5% | 1.2%(+47.3)#1 | 1.9%(+46.6)#26 |
| 27. | Avon | 44.7% | 1.9%(+42.8)#2 | 1.9%(+42.8)#27 |
| 28. | Welda | 44.4% | 1.4%(+43.1)#1 | 1.9%(+42.6)#28 |
| 29. | Everton | 44.0% | 1.4%(+42.6)#1 | 1.9%(+42.1)#29 |
| 30. | Eldred | 43.8% | 1.7%(+42.0)#1 | 1.9%(+41.9)#30 |
| 31. | Locust Mount | 43.3% | 1.9%(+41.4)#3 | 1.9%(+41.4)#31 |
| 32. | Klein | 42.9% | 1.8%(+41.0)#2 | 1.9%(+41.0)#32 |
| 33. | St Charles | 42.9% | 1.9%(+41.0)#4 | 1.9%(+41.0)#33 |
| 34. | Frank | 42.6% | 1.1%(+41.5)#1 | 1.9%(+40.7)#34 |
| 35. | Saugany Lake | 41.6% | 1.4%(+40.1)#2 | 1.9%(+39.7)#35 |
| 36. | Wells Bridge | 41.5% | 2.2%(+39.3)#1 | 1.9%(+39.6)#36 |
| 37. | Makena | 40.9% | 3.0%(+37.9)#1 | 1.9%(+39.0)#37 |
| 38. | Okreek | 40.0% | 1.2%(+38.8)#1 | 1.9%(+38.1)#38 |
| 39. | Heeney | 40.0% | 2.4%(+37.6)#2 | 1.9%(+38.1)#39 |
| 40. | Nordic | 39.4% | 1.6%(+37.8)#1 | 1.9%(+37.5)#40 |
| 41. | Boneau | 39.2% | 1.8%(+37.4)#3 | 1.9%(+37.3)#41 |
| 42. | El Adobe | 38.5% | 2.1%(+36.3)#5 | 1.9%(+36.6)#42 |
| 43. | Beaver | 38.5% | 2.0%(+36.5)#2 | 1.9%(+36.6)#43 |
| 44. | Westport | 38.2% | 1.2%(+37.0)#2 | 1.9%(+36.3)#44 |
| 45. | Curdsville | 38.1% | 1.4%(+36.7)#1 | 1.9%(+36.2)#45 |
| 46. | Edgewater Estates | 38.1% | 2.0%(+36.1)#4 | 1.9%(+36.2)#46 |
| 47. | Crouch | 37.8% | 2.0%(+35.8)#1 | 1.9%(+35.9)#47 |
| 48. | Piedra | 37.5% | 2.4%(+35.1)#3 | 1.9%(+35.6)#48 |
| 49. | June Lake | 37.2% | 2.1%(+35.1)#6 | 1.9%(+35.3)#49 |
| 50. | Babb | 36.9% | 1.8%(+35.1)#4 | 1.9%(+35.0)#50 |
| 51. | Vaiva Vo | 36.7% | 2.4%(+34.3)#2 | 1.9%(+34.8)#51 |
| 52. | Red Feather Lakes | 36.6% | 2.4%(+34.2)#4 | 1.9%(+34.7)#52 |
| 53. | Comptche | 35.0% | 2.1%(+32.9)#7 | 1.9%(+33.1)#53 |
| 54. | Oak Beach | 34.8% | 2.2%(+32.6)#2 | 1.9%(+32.9)#54 |
| 55. | Orason | 34.0% | 2.0%(+32.0)#5 | 1.9%(+32.1)#55 |
| 56. | Calvary | 33.8% | 2.0%(+31.9)#1 | 1.9%(+31.9)#56 |
| 57. | Naples | 33.4% | 1.4%(+32.0)#1 | 1.9%(+31.6)#57 |
| 58. | Crystal Springs | 33.1% | 1.4%(+31.7)#2 | 1.9%(+31.2)#58 |
| 59. | Ocean Breeze | 33.0% | 2.8%(+30.2)#1 | 1.9%(+31.2)#59 |
| 60. | Baker | 32.8% | 1.6%(+31.2)#1 | 1.9%(+30.9)#60 |
| 61. | Loma Mar | 32.1% | 2.1%(+29.9)#8 | 1.9%(+30.2)#61 |
| 62. | Bear Valley Cdp Mariposa County | 31.1% | 2.1%(+29.0)#9 | 1.9%(+29.3)#62 |
| 63. | Longview | 31.1% | 1.3%(+29.9)#1 | 1.9%(+29.2)#63 |
| 64. | Othello | 31.1% | 1.9%(+29.2)#1 | 1.9%(+29.2)#64 |
| 65. | Pine Lakes | 30.8% | 2.8%(+28.0)#2 | 1.9%(+28.9)#65 |
| 66. | Knowlton | 30.0% | 1.2%(+28.8)#1 | 1.9%(+28.1)#66 |
| 67. | Worton | 29.9% | 2.1%(+27.8)#1 | 1.9%(+28.0)#67 |
| 68. | Dennard | 29.4% | 1.4%(+28.0)#3 | 1.9%(+27.5)#68 |
| 69. | Fox | 29.2% | 1.8%(+27.3)#5 | 1.9%(+27.3)#69 |
| 70. | Green Acres | 29.1% | 1.1%(+28.1)#1 | 1.9%(+27.2)#70 |
| 71. | Pimlico | 29.0% | 2.0%(+27.0)#1 | 1.9%(+27.1)#71 |
| 72. | Lafayette | 28.9% | 1.9%(+27.1)#5 | 1.9%(+27.1)#72 |
| 73. | Eldred | 28.7% | 2.2%(+26.5)#3 | 1.9%(+26.8)#73 |
| 74. | Albion | 28.6% | 1.6%(+27.0)#2 | 1.9%(+26.7)#74 |
| 75. | Baker | 28.6% | 1.4%(+27.2)#1 | 1.9%(+26.7)#75 |
| 76. | Edge Hill | 28.6% | 2.0%(+26.6)#2 | 1.9%(+26.7)#76 |
| 77. | Zephyr Cove | 28.0% | 2.5%(+25.6)#1 | 1.9%(+26.2)#77 |
| 78. | Temperanceville | 28.0% | 1.9%(+26.1)#6 | 1.9%(+26.1)#78 |
| 79. | Pulaski | 27.9% | 1.5%(+26.5)#2 | 1.9%(+26.0)#79 |
| 80. | St Maurice | 27.8% | 1.6%(+26.2)#1 | 1.9%(+25.9)#81 |
| 81. | Ribera | 27.8% | 1.6%(+26.2)#2 | 1.9%(+25.9)#82 |
| 82. | Los Panes | 27.5% | 1.3%(+26.2)#1 | 1.9%(+25.6)#83 |
| 83. | Cavendish | 27.3% | 1.6%(+25.7)#1 | 1.9%(+25.4)#84 |
| 84. | Bucyrus | 27.3% | 1.4%(+25.9)#2 | 1.9%(+25.4)#85 |
| 85. | Monument | 27.3% | 1.5%(+25.8)#1 | 1.9%(+25.4)#86 |
| 86. | Manele | 27.3% | 3.0%(+24.2)#2 | 1.9%(+25.4)#87 |
| 87. | Butte Valley | 27.0% | 2.1%(+24.9)#10 | 1.9%(+25.1)#88 |
| 88. | Kickapoo Site 5 | 26.7% | 1.4%(+25.3)#3 | 1.9%(+24.8)#89 |
| 89. | Sunny Slopes | 26.7% | 2.1%(+24.5)#11 | 1.9%(+24.8)#90 |
| 90. | Virgie | 26.6% | 1.4%(+25.2)#2 | 1.9%(+24.7)#91 |
| 91. | Hanalei | 26.5% | 3.0%(+23.5)#3 | 1.9%(+24.6)#92 |
| 92. | La Tierra | 26.5% | 1.6%(+24.9)#3 | 1.9%(+24.6)#93 |
| 93. | Pitkin | 26.4% | 2.4%(+24.0)#5 | 1.9%(+24.5)#94 |
| 94. | Ocracoke | 26.4% | 1.9%(+24.6)#3 | 1.9%(+24.5)#95 |
| 95. | Candlewood Knolls | 26.4% | 1.7%(+24.7)#2 | 1.9%(+24.5)#96 |
| 96. | Mccutchenville | 25.9% | 1.5%(+24.4)#3 | 1.9%(+24.0)#97 |
| 97. | Aguanga | 25.8% | 2.1%(+23.7)#12 | 1.9%(+24.0)#98 |
| 98. | Goose Lake | 25.8% | 1.1%(+24.7)#1 | 1.9%(+23.9)#99 |
| 99. | Kenel | 25.8% | 1.2%(+24.6)#3 | 1.9%(+23.9)#100 |
| 100. | Petrey | 25.8% | 1.5%(+24.3)#2 | 1.9%(+23.9)#101 |
Common Questions
What are the Top 10 Cities with the Highest Percentage of Population Employed in Real Estate, Rental & Leasing in the United States?
Top 10 Cities with the Highest Percentage of Population Employed in Real Estate, Rental & Leasing in the United States are:
#1
100.0%
#2
100.0%
#3
100.0%
#4
100.0%
#5
100.0%
#6
100.0%
#7
100.0%
#8
67.3%
#9
63.6%
#10
61.0%
What city has the Highest Percentage of Population Employed in Real Estate, Rental & Leasing in the United States?
Los Alvarez has the Highest Percentage of Population Employed in Real Estate, Rental & Leasing in the United States with 100.0%.
What is the Percentage of Population Employed in Real Estate, Rental & Leasing in the United States?
Percentage of Population Employed in Real Estate, Rental & Leasing in the United States is 1.9%.