Cities with the Highest Percentage of Immigrants from Egypt in the United States
RELATED REPORTS & OPTIONS
Egypt
United States
Compare Cities
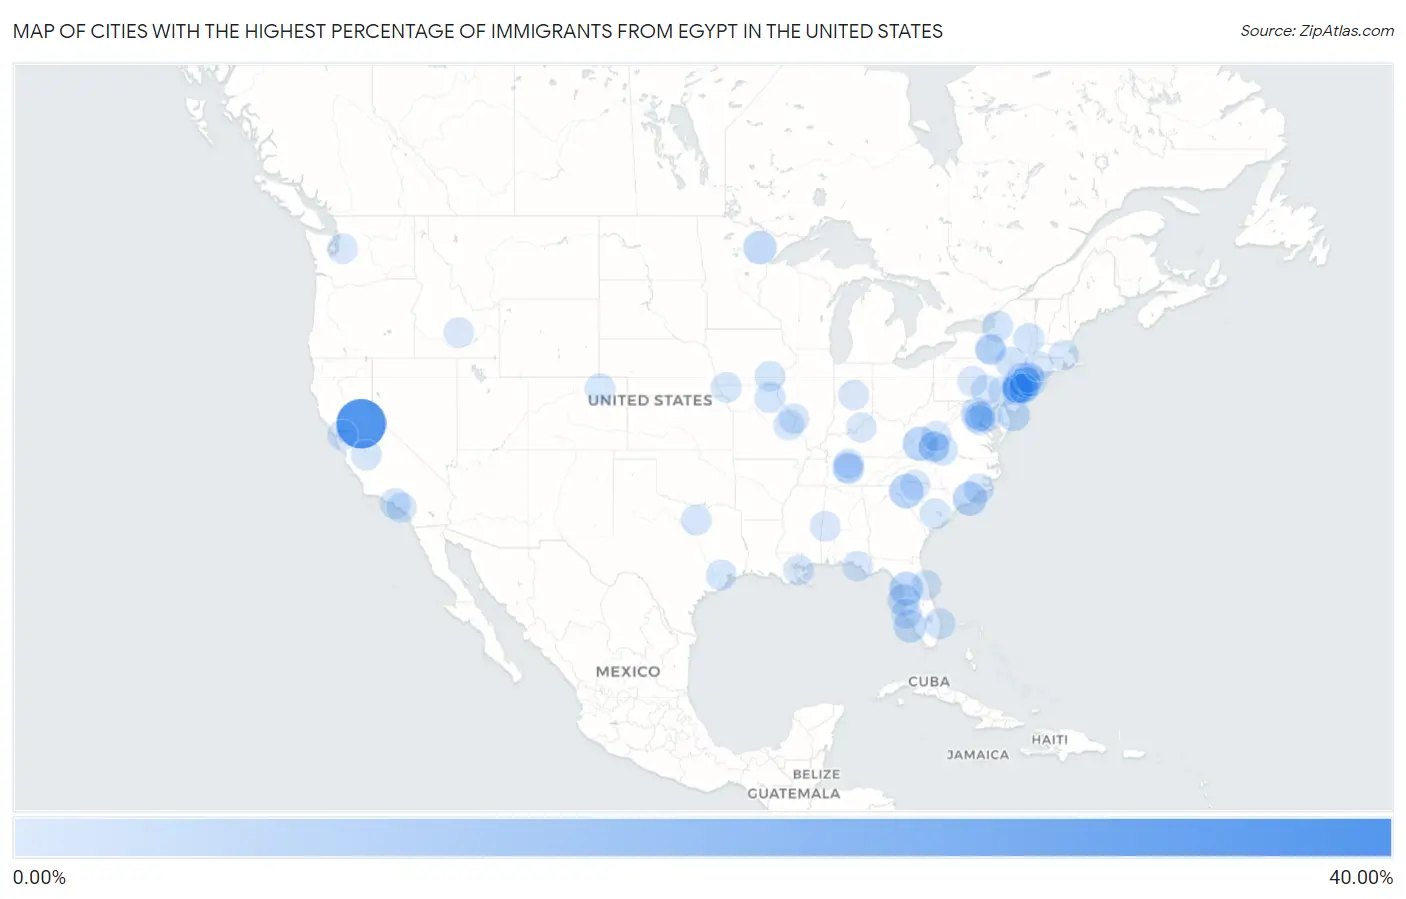
Map of Cities with the Highest Percentage of Immigrants from Egypt in the United States
0.00%
40.00%
Cities with the Highest Percentage of Immigrants from Egypt in the United States
| City | Egypt | vs State | vs National | |
| 1. | Fiddletown | 39.29% | 0.11%(+39.2)#-1 | 0.067%(+39.2)#0 |
| 2. | Yermo | 19.16% | 0.11%(+19.1)#0 | 0.067%(+19.1)#1 |
| 3. | Union Beach Borough | 10.02% | 0.36%(+9.65)#-1 | 0.067%(+9.95)#2 |
| 4. | West Pelzer | 8.83% | 0.023%(+8.81)#-1 | 0.067%(+8.76)#3 |
| 5. | Anawalt | 8.70% | 0.028%(+8.67)#-1 | 0.067%(+8.63)#4 |
| 6. | Hightsville | 8.40% | 0.046%(+8.35)#-1 | 0.067%(+8.33)#5 |
| 7. | Lecanto | 7.90% | 0.065%(+7.83)#-1 | 0.067%(+7.83)#6 |
| 8. | Kinney | 6.99% | 0.051%(+6.94)#-1 | 0.067%(+6.93)#7 |
| 9. | Bridgeport Borough | 6.58% | 0.056%(+6.52)#-1 | 0.067%(+6.51)#8 |
| 10. | Milltown Borough | 6.24% | 0.36%(+5.88)#0 | 0.067%(+6.18)#9 |
| 11. | Voorhees | 6.12% | 0.36%(+5.75)#1 | 0.067%(+6.05)#10 |
| 12. | Bayonne | 5.97% | 0.36%(+5.61)#12 | 0.067%(+5.91)#348 |
| 13. | Captiva | 5.96% | 0.065%(+5.90)#0 | 0.067%(+5.89)#349 |
| 14. | Andover Borough | 5.76% | 0.36%(+5.39)#13 | 0.067%(+5.69)#350 |
| 15. | Cape May | 5.40% | 0.36%(+5.04)#14 | 0.067%(+5.33)#351 |
| 16. | Trinity | 5.07% | 0.065%(+5.00)#1 | 0.067%(+5.00)#352 |
| 17. | Singac | 4.91% | 0.36%(+4.55)#15 | 0.067%(+4.85)#353 |
| 18. | Chain-O-Lakes | 3.93% | 0.034%(+3.89)#-1 | 0.067%(+3.86)#354 |
| 19. | El Sobrante Cdp Riverside County | 3.35% | 0.11%(+3.24)#1 | 0.067%(+3.28)#355 |
| 20. | Old Hill | 3.26% | 0.047%(+3.21)#-1 | 0.067%(+3.19)#356 |
| 21. | Callicoon | 3.11% | 0.14%(+2.97)#-1 | 0.067%(+3.04)#357 |
| 22. | Six Mile Run | 2.94% | 0.36%(+2.58)#16 | 0.067%(+2.88)#358 |
| 23. | Encore At Monroe | 2.91% | 0.36%(+2.54)#17 | 0.067%(+2.84)#359 |
| 24. | Rock Ridge | 2.87% | 0.047%(+2.82)#0 | 0.067%(+2.80)#360 |
| 25. | Dayton | 2.73% | 0.36%(+2.36)#18 | 0.067%(+2.66)#361 |
| 26. | Belview | 2.67% | 0.11%(+2.56)#-1 | 0.067%(+2.61)#362 |
| 27. | Princeton Junction | 2.67% | 0.36%(+2.31)#19 | 0.067%(+2.60)#363 |
| 28. | Madison Park | 2.54% | 0.36%(+2.18)#20 | 0.067%(+2.48)#364 |
| 29. | Helmetta Borough | 2.52% | 0.36%(+2.16)#21 | 0.067%(+2.45)#365 |
| 30. | North Ballston Spa | 2.49% | 0.14%(+2.36)#0 | 0.067%(+2.43)#366 |
| 31. | Lake Clarke Shores | 2.48% | 0.065%(+2.41)#2 | 0.067%(+2.41)#367 |
| 32. | Ten Mile Run | 2.45% | 0.36%(+2.09)#22 | 0.067%(+2.39)#368 |
| 33. | Schuyler Lake | 2.44% | 0.14%(+2.30)#1 | 0.067%(+2.37)#369 |
| 34. | Tinton Falls Borough | 2.43% | 0.36%(+2.07)#23 | 0.067%(+2.36)#370 |
| 35. | Bethel | 2.36% | 0.019%(+2.34)#-1 | 0.067%(+2.30)#371 |
| 36. | Mount Arlington Borough | 2.32% | 0.36%(+1.96)#24 | 0.067%(+2.25)#372 |
| 37. | North Caldwell Borough | 2.31% | 0.36%(+1.95)#25 | 0.067%(+2.24)#373 |
| 38. | Lacona | 2.30% | 0.14%(+2.16)#2 | 0.067%(+2.23)#374 |
| 39. | Monroe Manor | 2.28% | 0.36%(+1.91)#26 | 0.067%(+2.21)#375 |
| 40. | Kettering | 2.24% | 0.072%(+2.17)#34 | 0.067%(+2.17)#376 |
| 41. | Del Aire | 2.22% | 0.11%(+2.11)#2 | 0.067%(+2.16)#377 |
| 42. | Moonachie Borough | 2.20% | 0.36%(+1.83)#27 | 0.067%(+2.13)#378 |
| 43. | Sanatoga | 2.14% | 0.056%(+2.08)#0 | 0.067%(+2.07)#379 |
| 44. | Bellaire | 2.09% | 0.050%(+2.04)#-1 | 0.067%(+2.02)#380 |
| 45. | Wormleysburg Borough | 2.06% | 0.056%(+2.00)#1 | 0.067%(+1.99)#381 |
| 46. | Rocky Mount | 2.01% | 0.11%(+1.90)#0 | 0.067%(+1.95)#382 |
| 47. | Middlesex Borough | 1.99% | 0.36%(+1.63)#28 | 0.067%(+1.92)#383 |
| 48. | Jersey City | 1.95% | 0.36%(+1.58)#29 | 0.067%(+1.88)#448 |
| 49. | Holly Hill | 1.88% | 0.023%(+1.86)#0 | 0.067%(+1.81)#449 |
| 50. | Lansdowne | 1.88% | 0.11%(+1.76)#1 | 0.067%(+1.81)#450 |
| 51. | East Ithaca | 1.87% | 0.14%(+1.74)#3 | 0.067%(+1.81)#451 |
| 52. | Searingtown | 1.87% | 0.14%(+1.74)#4 | 0.067%(+1.81)#452 |
| 53. | La Vergne | 1.86% | 0.17%(+1.69)#-1 | 0.067%(+1.79)#453 |
| 54. | Tuckahoe | 1.86% | 0.14%(+1.72)#5 | 0.067%(+1.79)#454 |
| 55. | Labarque Creek | 1.83% | 0.019%(+1.81)#0 | 0.067%(+1.76)#455 |
| 56. | Maharishi Vedic City | 1.82% | 0.031%(+1.79)#-1 | 0.067%(+1.75)#456 |
| 57. | Burlington Junction | 1.77% | 0.019%(+1.75)#1 | 0.067%(+1.70)#457 |
| 58. | Smyrna | 1.75% | 0.17%(+1.58)#0 | 0.067%(+1.69)#458 |
| 59. | Edmundson | 1.72% | 0.019%(+1.70)#2 | 0.067%(+1.65)#459 |
| 60. | Mendota | 1.69% | 0.11%(+1.58)#3 | 0.067%(+1.62)#460 |
| 61. | Castle Hill | 1.68% | 0.11%(+1.57)#4 | 0.067%(+1.62)#461 |
| 62. | Roanoke | 1.67% | 0.050%(+1.62)#0 | 0.067%(+1.61)#462 |
| 63. | Lake Sarasota | 1.65% | 0.065%(+1.58)#3 | 0.067%(+1.58)#463 |
| 64. | Weldona | 1.64% | 0.019%(+1.62)#-1 | 0.067%(+1.57)#464 |
| 65. | Navy | 1.62% | 0.11%(+1.51)#2 | 0.067%(+1.55)#465 |
| 66. | Livingston | 1.61% | 0.011%(+1.60)#-1 | 0.067%(+1.54)#466 |
| 67. | Fountain Valley | 1.60% | 0.11%(+1.49)#5 | 0.067%(+1.53)#467 |
| 68. | Sayreville Borough | 1.59% | 0.36%(+1.22)#30 | 0.067%(+1.52)#468 |
| 69. | Prices Fork | 1.58% | 0.11%(+1.47)#3 | 0.067%(+1.51)#469 |
| 70. | Little Ferry Borough | 1.51% | 0.36%(+1.14)#31 | 0.067%(+1.44)#470 |
| 71. | Cowpens | 1.50% | 0.023%(+1.48)#1 | 0.067%(+1.44)#471 |
| 72. | Arabi | 1.49% | 0.035%(+1.45)#-1 | 0.067%(+1.42)#472 |
| 73. | Colonial Park | 1.48% | 0.056%(+1.42)#16 | 0.067%(+1.41)#473 |
| 74. | Panama City Beach | 1.46% | 0.065%(+1.40)#4 | 0.067%(+1.39)#474 |
| 75. | Englishtown Borough | 1.46% | 0.36%(+1.09)#32 | 0.067%(+1.39)#475 |
| 76. | Westfield | 1.45% | 0.034%(+1.41)#0 | 0.067%(+1.38)#476 |
| 77. | Centreville | 1.42% | 0.11%(+1.31)#34 | 0.067%(+1.36)#640 |
| 78. | Preakness | 1.41% | 0.36%(+1.05)#33 | 0.067%(+1.35)#641 |
| 79. | Strathmore | 1.39% | 0.36%(+1.03)#34 | 0.067%(+1.32)#642 |
| 80. | South River Borough | 1.39% | 0.36%(+1.02)#35 | 0.067%(+1.32)#643 |
| 81. | Oakville | 1.38% | 0.047%(+1.34)#1 | 0.067%(+1.32)#644 |
| 82. | Menlo Park Terrace | 1.38% | 0.36%(+1.02)#36 | 0.067%(+1.31)#645 |
| 83. | White Sulphur Springs | 1.37% | 0.028%(+1.34)#0 | 0.067%(+1.30)#646 |
| 84. | Jamesburg Borough | 1.37% | 0.36%(+1.00)#37 | 0.067%(+1.30)#647 |
| 85. | Pumpkin Center | 1.35% | 0.046%(+1.30)#0 | 0.067%(+1.28)#648 |
| 86. | Lemont | 1.34% | 0.056%(+1.29)#17 | 0.067%(+1.28)#649 |
| 87. | Millis Clicquot | 1.34% | 0.087%(+1.25)#-1 | 0.067%(+1.27)#650 |
| 88. | Fairview Borough | 1.31% | 0.36%(+0.948)#38 | 0.067%(+1.25)#651 |
| 89. | Mount Juliet | 1.30% | 0.17%(+1.13)#1 | 0.067%(+1.23)#652 |
| 90. | Carlstadt Borough | 1.29% | 0.36%(+0.929)#39 | 0.067%(+1.23)#653 |
| 91. | Carey | 1.29% | 0.013%(+1.27)#-1 | 0.067%(+1.22)#654 |
| 92. | Laurel Hill | 1.28% | 0.11%(+1.17)#35 | 0.067%(+1.21)#655 |
| 93. | Allendale Borough | 1.28% | 0.36%(+0.912)#40 | 0.067%(+1.21)#656 |
| 94. | Oakton | 1.26% | 0.11%(+1.15)#36 | 0.067%(+1.20)#657 |
| 95. | Mckee | 1.24% | 0.36%(+0.880)#41 | 0.067%(+1.18)#658 |
| 96. | Blawnox Borough | 1.24% | 0.056%(+1.18)#18 | 0.067%(+1.17)#659 |
| 97. | Northwest Ithaca | 1.22% | 0.14%(+1.09)#6 | 0.067%(+1.16)#660 |
| 98. | Maple Heights Lake Desire | 1.22% | 0.040%(+1.18)#-1 | 0.067%(+1.16)#661 |
| 99. | Westwood | 1.21% | 0.011%(+1.20)#-1 | 0.067%(+1.14)#662 |
| 100. | Port Orange | 1.21% | 0.065%(+1.14)#14 | 0.067%(+1.14)#663 |
Common Questions
What are the Top 10 Cities with the Highest Percentage of Immigrants from Egypt in the United States?
Top 10 Cities with the Highest Percentage of Immigrants from Egypt in the United States are:
What city has the Highest Percentage of Immigrants from Egypt in the United States?
Fiddletown has the Highest Percentage of Immigrants from Egypt in the United States with 39.29%.
What is the Percentage of Immigrants from Egypt in the United States?
Percentage of Immigrants from Egypt in the United States is 0.067%.