Cities with the Most Immigrants from Northern Europe in the United States
RELATED REPORTS & OPTIONS
Northern Europe
United States
Compare Cities
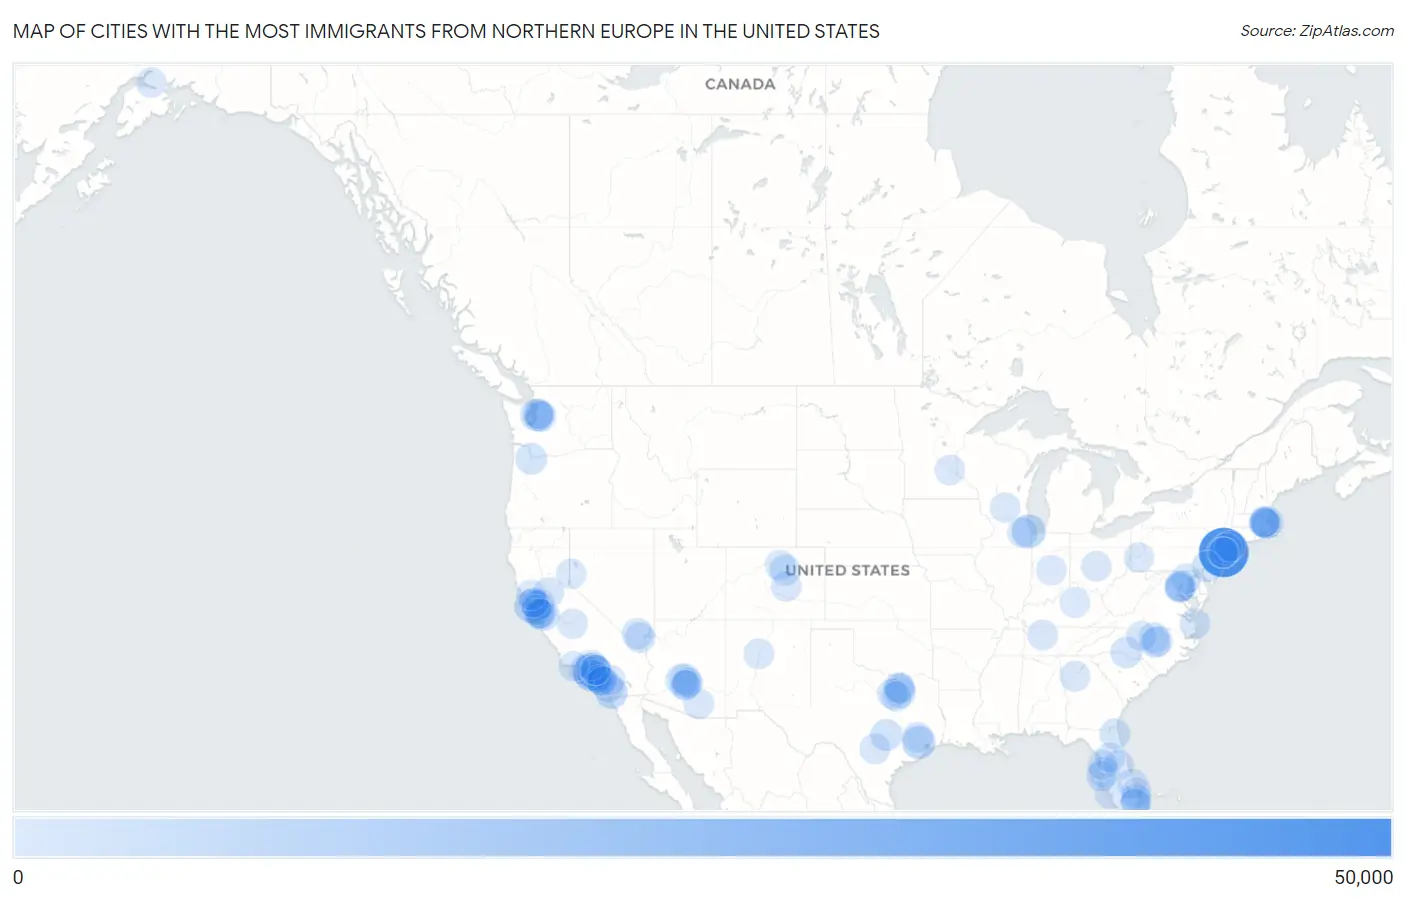
Map of Cities with the Most Immigrants from Northern Europe in the United States
0
50,000
Cities with the Most Immigrants from Northern Europe in the United States
| City | Northern Europe | vs State | vs National | |
| 1. | New York | 49,604 | 98,958(50.13%)#1 | 944,917(5.25%)#1 |
| 2. | Los Angeles | 20,594 | 169,816(12.13%)#1 | 944,917(2.18%)#2 |
| 3. | San Francisco | 9,467 | 169,816(5.57%)#2 | 944,917(1.00%)#3 |
| 4. | Chicago | 9,058 | 29,158(31.07%)#1 | 944,917(0.96%)#4 |
| 5. | Houston | 8,059 | 66,462(12.13%)#1 | 944,917(0.85%)#5 |
| 6. | San Diego | 6,654 | 169,816(3.92%)#3 | 944,917(0.70%)#6 |
| 7. | Seattle | 5,376 | 31,955(16.82%)#1 | 944,917(0.57%)#7 |
| 8. | Boston | 5,047 | 42,980(11.74%)#1 | 944,917(0.53%)#8 |
| 9. | San Jose | 4,482 | 169,816(2.64%)#4 | 944,917(0.47%)#9 |
| 10. | Austin | 4,308 | 66,462(6.48%)#2 | 944,917(0.46%)#10 |
| 11. | Phoenix | 3,716 | 21,234(17.50%)#1 | 944,917(0.39%)#11 |
| 12. | Portland | 3,684 | 16,161(22.80%)#1 | 944,917(0.39%)#12 |
| 13. | Washington | 3,527 | 3,527(100.00%)#1 | 944,917(0.37%)#13 |
| 14. | Charlotte | 3,495 | 26,679(13.10%)#1 | 944,917(0.37%)#14 |
| 15. | Yonkers | 3,394 | 98,958(3.43%)#2 | 944,917(0.36%)#15 |
| 16. | Philadelphia | 3,134 | 28,221(11.11%)#1 | 944,917(0.33%)#16 |
| 17. | Las Vegas | 2,769 | 10,241(27.04%)#1 | 944,917(0.29%)#17 |
| 18. | Dallas | 2,470 | 66,462(3.72%)#3 | 944,917(0.26%)#18 |
| 19. | Irvine | 2,364 | 169,816(1.39%)#5 | 944,917(0.25%)#19 |
| 20. | Denver | 2,248 | 17,868(12.58%)#1 | 944,917(0.24%)#20 |
| 21. | Jacksonville | 2,201 | 99,023(2.22%)#1 | 944,917(0.23%)#21 |
| 22. | Oakland | 2,175 | 169,816(1.28%)#6 | 944,917(0.23%)#22 |
| 23. | Fort Lauderdale | 2,157 | 99,023(2.18%)#2 | 944,917(0.23%)#23 |
| 24. | The Woodlands | 2,039 | 66,462(3.07%)#4 | 944,917(0.22%)#24 |
| 25. | Long Beach | 1,971 | 169,816(1.16%)#7 | 944,917(0.21%)#25 |
| 26. | San Antonio | 1,872 | 66,462(2.82%)#5 | 944,917(0.20%)#26 |
| 27. | Santa Monica | 1,827 | 169,816(1.08%)#8 | 944,917(0.19%)#27 |
| 28. | Scottsdale | 1,826 | 21,234(8.60%)#2 | 944,917(0.19%)#28 |
| 29. | Cambridge | 1,824 | 42,980(4.24%)#2 | 944,917(0.19%)#29 |
| 30. | Virginia Beach | 1,798 | 25,764(6.98%)#1 | 944,917(0.19%)#30 |
| 31. | Nashville | 1,790 | 10,473(17.09%)#1 | 944,917(0.19%)#31 |
| 32. | Jersey City | 1,724 | 37,784(4.56%)#1 | 944,917(0.18%)#32 |
| 33. | Tampa | 1,691 | 99,023(1.71%)#3 | 944,917(0.18%)#33 |
| 34. | Durham | 1,656 | 26,679(6.21%)#2 | 944,917(0.18%)#34 |
| 35. | Henderson | 1,654 | 10,241(16.15%)#2 | 944,917(0.18%)#35 |
| 36. | Atlanta | 1,587 | 23,028(6.89%)#1 | 944,917(0.17%)#36 |
| 37. | Arlington | 1,520 | 25,764(5.90%)#2 | 944,917(0.16%)#37 |
| 38. | Sacramento | 1,508 | 169,816(0.89%)#9 | 944,917(0.16%)#38 |
| 39. | Bellevue | 1,433 | 31,955(4.48%)#2 | 944,917(0.15%)#39 |
| 40. | Quincy | 1,425 | 42,980(3.32%)#3 | 944,917(0.15%)#40 |
| 41. | Thousand Oaks | 1,406 | 169,816(0.83%)#10 | 944,917(0.15%)#41 |
| 42. | Carlsbad | 1,404 | 169,816(0.83%)#11 | 944,917(0.15%)#42 |
| 43. | Colorado Springs | 1,390 | 17,868(7.78%)#2 | 944,917(0.15%)#43 |
| 44. | Tucson | 1,379 | 21,234(6.49%)#3 | 944,917(0.15%)#44 |
| 45. | Cary | 1,339 | 26,679(5.02%)#3 | 944,917(0.14%)#45 |
| 46. | Columbus | 1,329 | 15,830(8.40%)#1 | 944,917(0.14%)#46 |
| 47. | Frisco | 1,325 | 66,462(1.99%)#6 | 944,917(0.14%)#47 |
| 48. | Fort Worth | 1,319 | 66,462(1.98%)#7 | 944,917(0.14%)#48 |
| 49. | Raleigh | 1,272 | 26,679(4.77%)#4 | 944,917(0.13%)#49 |
| 50. | Orlando | 1,271 | 99,023(1.28%)#4 | 944,917(0.13%)#50 |
| 51. | Naperville | 1,271 | 29,158(4.36%)#2 | 944,917(0.13%)#51 |
| 52. | Plano | 1,255 | 66,462(1.89%)#8 | 944,917(0.13%)#52 |
| 53. | Newton | 1,239 | 42,980(2.88%)#4 | 944,917(0.13%)#53 |
| 54. | Chandler | 1,237 | 21,234(5.83%)#4 | 944,917(0.13%)#54 |
| 55. | Sammamish | 1,230 | 31,955(3.85%)#3 | 944,917(0.13%)#55 |
| 56. | Berkeley | 1,226 | 169,816(0.72%)#12 | 944,917(0.13%)#56 |
| 57. | Huntington Beach | 1,223 | 169,816(0.72%)#13 | 944,917(0.13%)#57 |
| 58. | Stamford | 1,212 | 20,043(6.05%)#1 | 944,917(0.13%)#58 |
| 59. | Port St Lucie | 1,205 | 99,023(1.22%)#5 | 944,917(0.13%)#59 |
| 60. | Albuquerque | 1,198 | 4,032(29.71%)#1 | 944,917(0.13%)#60 |
| 61. | Cape Coral | 1,185 | 99,023(1.20%)#6 | 944,917(0.13%)#61 |
| 62. | Madison | 1,151 | 7,670(15.01%)#1 | 944,917(0.12%)#62 |
| 63. | Mountain View | 1,146 | 169,816(0.67%)#14 | 944,917(0.12%)#63 |
| 64. | Baltimore | 1,145 | 17,549(6.52%)#1 | 944,917(0.12%)#64 |
| 65. | Lexington | 1,144 | 4,945(23.13%)#1 | 944,917(0.12%)#65 |
| 66. | Boulder | 1,143 | 17,868(6.40%)#3 | 944,917(0.12%)#66 |
| 67. | Kirkland | 1,141 | 31,955(3.57%)#4 | 944,917(0.12%)#67 |
| 68. | Gilbert | 1,138 | 21,234(5.36%)#5 | 944,917(0.12%)#68 |
| 69. | Redondo Beach | 1,130 | 169,816(0.67%)#15 | 944,917(0.12%)#69 |
| 70. | West Palm Beach | 1,124 | 99,023(1.14%)#7 | 944,917(0.12%)#70 |
| 71. | Murrieta | 1,123 | 169,816(0.66%)#16 | 944,917(0.12%)#71 |
| 72. | Pasadena | 1,113 | 169,816(0.66%)#17 | 944,917(0.12%)#72 |
| 73. | Grand Prairie | 1,111 | 66,462(1.67%)#9 | 944,917(0.12%)#73 |
| 74. | Minneapolis | 1,100 | 8,158(13.48%)#1 | 944,917(0.12%)#74 |
| 75. | St Petersburg | 1,099 | 99,023(1.11%)#8 | 944,917(0.12%)#75 |
| 76. | Mesa | 1,094 | 21,234(5.15%)#6 | 944,917(0.12%)#76 |
| 77. | Santa Clarita | 1,090 | 169,816(0.64%)#18 | 944,917(0.12%)#77 |
| 78. | Santa Barbara | 1,053 | 169,816(0.62%)#19 | 944,917(0.11%)#78 |
| 79. | Newport Beach | 1,052 | 169,816(0.62%)#20 | 944,917(0.11%)#79 |
| 80. | Boca Raton | 1,050 | 99,023(1.06%)#9 | 944,917(0.11%)#80 |
| 81. | Walnut Creek | 1,042 | 169,816(0.61%)#21 | 944,917(0.11%)#81 |
| 82. | Brookline | 1,025 | 42,980(2.38%)#5 | 944,917(0.11%)#82 |
| 83. | Indianapolis | 1,006 | 7,431(13.54%)#1 | 944,917(0.11%)#83 |
| 84. | Spring Hill | 997 | 99,023(1.01%)#10 | 944,917(0.11%)#84 |
| 85. | Glendale | 991 | 169,816(0.58%)#22 | 944,917(0.10%)#85 |
| 86. | Fresno | 981 | 169,816(0.58%)#23 | 944,917(0.10%)#86 |
| 87. | Sunnyvale | 967 | 169,816(0.57%)#24 | 944,917(0.10%)#87 |
| 88. | San Mateo | 957 | 169,816(0.56%)#25 | 944,917(0.10%)#88 |
| 89. | Reno | 946 | 10,241(9.24%)#3 | 944,917(0.10%)#89 |
| 90. | Anchorage | 945 | 1,564(60.42%)#1 | 944,917(0.10%)#90 |
| 91. | Greensboro | 941 | 26,679(3.53%)#5 | 944,917(0.10%)#91 |
| 92. | The Villages | 934 | 99,023(0.94%)#11 | 944,917(0.10%)#92 |
| 93. | Palo Alto | 923 | 169,816(0.54%)#26 | 944,917(0.10%)#93 |
| 94. | Laguna Niguel | 904 | 169,816(0.53%)#27 | 944,917(0.10%)#94 |
| 95. | Alexandria | 903 | 25,764(3.50%)#3 | 944,917(0.10%)#95 |
| 96. | Hoboken | 901 | 37,784(2.38%)#2 | 944,917(0.10%)#96 |
| 97. | Pittsburgh | 900 | 28,221(3.19%)#2 | 944,917(0.10%)#97 |
| 98. | Santa Rosa | 896 | 169,816(0.53%)#28 | 944,917(0.09%)#98 |
| 99. | San Rafael | 873 | 169,816(0.51%)#29 | 944,917(0.09%)#99 |
| 100. | Davie | 871 | 99,023(0.88%)#12 | 944,917(0.09%)#100 |
Common Questions
What are the Top 10 Cities with the Most Immigrants from Northern Europe in the United States?
Top 10 Cities with the Most Immigrants from Northern Europe in the United States are:
What city has the Most Immigrants from Northern Europe in the United States?
New York has the Most Immigrants from Northern Europe in the United States with 49,604.
What is the Total Immigrants from Northern Europe in the United States?
Total Immigrants from Northern Europe in the United States is 944,917.