Cities with the Lowest Child Poverty Level Among Boys Under the Age of 16 in the United States
RELATED REPORTS & OPTIONS
Lowest Poverty | Boys 0-16
United States
Compare Cities
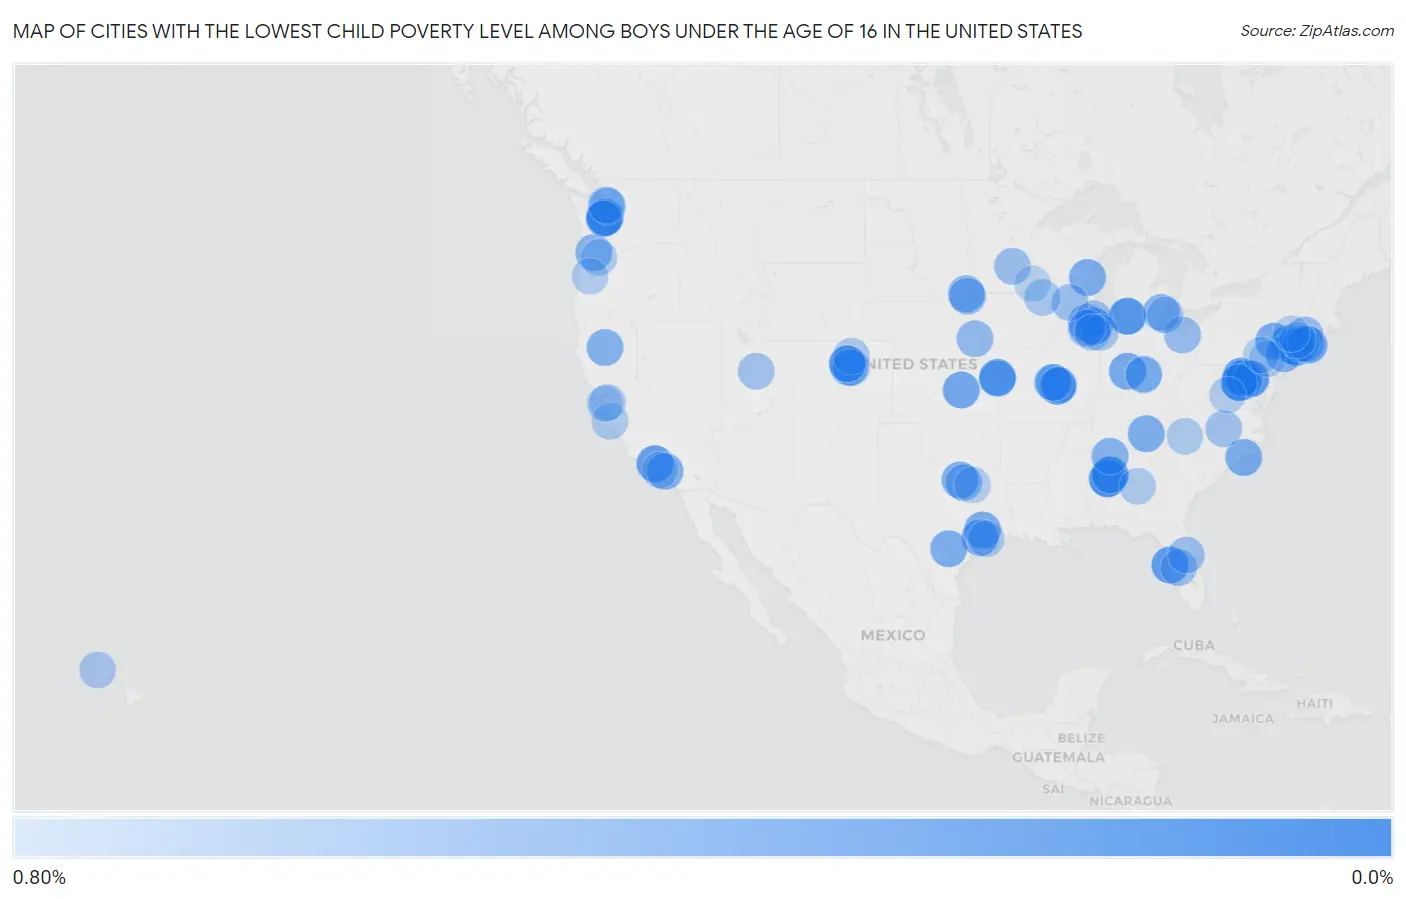
Map of Cities with the Lowest Child Poverty Level Among Boys Under the Age of 16 in the United States
0.80%
0.0%
Cities with the Lowest Child Poverty Level Among Boys Under the Age of 16 in the United States
| City | Child Poverty (Boys) | vs State | vs National | |
| 1. | Belmont | 0.078% | 12.8%(-12.7)#1 | 16.9%(-16.8)#1 |
| 2. | Edgewood | 0.090% | 12.2%(-12.1)#1 | 16.9%(-16.8)#2 |
| 3. | Berlin Borough | 0.16% | 13.4%(-13.3)#1 | 16.9%(-16.7)#3 |
| 4. | Helena | 0.18% | 22.4%(-22.2)#1 | 16.9%(-16.7)#4 |
| 5. | Hinsdale | 0.22% | 15.8%(-15.6)#1 | 16.9%(-16.7)#5 |
| 6. | Linton Hall | 0.22% | 12.8%(-12.6)#2 | 16.9%(-16.7)#6 |
| 7. | Mountain Brook | 0.24% | 22.4%(-22.1)#2 | 16.9%(-16.7)#7 |
| 8. | Eastwood | 0.24% | 18.2%(-17.9)#1 | 16.9%(-16.7)#8 |
| 9. | Sunset Hills | 0.24% | 16.7%(-16.5)#1 | 16.9%(-16.7)#9 |
| 10. | Mission Hills | 0.26% | 13.6%(-13.3)#1 | 16.9%(-16.6)#10 |
| 11. | Rockville Centre | 0.29% | 18.5%(-18.2)#1 | 16.9%(-16.6)#11 |
| 12. | Northdale | 0.32% | 18.0%(-17.7)#1 | 16.9%(-16.6)#12 |
| 13. | Oak Park | 0.33% | 15.5%(-15.2)#1 | 16.9%(-16.6)#13 |
| 14. | Golden | 0.34% | 11.5%(-11.1)#1 | 16.9%(-16.6)#14 |
| 15. | East Moriches | 0.34% | 18.5%(-18.1)#2 | 16.9%(-16.6)#15 |
| 16. | Woodlawn Cdp Prince George S County | 0.35% | 11.8%(-11.4)#1 | 16.9%(-16.6)#16 |
| 17. | Gibbsboro Borough | 0.39% | 13.4%(-13.0)#2 | 16.9%(-16.5)#17 |
| 18. | Upper Montclair | 0.40% | 13.4%(-13.0)#3 | 16.9%(-16.5)#18 |
| 19. | North Valley Stream | 0.40% | 18.5%(-18.1)#3 | 16.9%(-16.5)#19 |
| 20. | Hillsboro | 0.40% | 13.6%(-13.2)#2 | 16.9%(-16.5)#20 |
| 21. | Greensburg | 0.41% | 16.3%(-15.9)#1 | 16.9%(-16.5)#21 |
| 22. | Berwyn Heights | 0.42% | 11.8%(-11.3)#2 | 16.9%(-16.5)#22 |
| 23. | Broadlands | 0.42% | 12.8%(-12.4)#3 | 16.9%(-16.5)#23 |
| 24. | Magnolia | 0.42% | 19.7%(-19.3)#1 | 16.9%(-16.5)#24 |
| 25. | Arlington Heights | 0.43% | 16.5%(-16.0)#1 | 16.9%(-16.5)#25 |
| 26. | Katy | 0.43% | 19.7%(-19.2)#2 | 16.9%(-16.5)#26 |
| 27. | Ponder | 0.44% | 19.7%(-19.2)#3 | 16.9%(-16.5)#27 |
| 28. | Sneads Ferry | 0.44% | 18.7%(-18.3)#1 | 16.9%(-16.5)#28 |
| 29. | Poth | 0.45% | 19.7%(-19.2)#4 | 16.9%(-16.5)#29 |
| 30. | Seal Beach | 0.45% | 15.5%(-15.1)#2 | 16.9%(-16.5)#30 |
| 31. | Farragut | 0.46% | 19.7%(-19.3)#1 | 16.9%(-16.4)#31 |
| 32. | Little Chute | 0.46% | 13.6%(-13.2)#1 | 16.9%(-16.4)#32 |
| 33. | Wolf Trap | 0.47% | 12.8%(-12.3)#4 | 16.9%(-16.4)#33 |
| 34. | Plum Borough | 0.48% | 16.5%(-16.0)#2 | 16.9%(-16.4)#34 |
| 35. | Bella Vista | 0.48% | 15.5%(-15.1)#3 | 16.9%(-16.4)#35 |
| 36. | Princeton Meadows | 0.49% | 13.4%(-12.9)#4 | 16.9%(-16.4)#36 |
| 37. | Tea | 0.50% | 15.6%(-15.1)#1 | 16.9%(-16.4)#37 |
| 38. | Ken Caryl | 0.50% | 11.5%(-11.0)#2 | 16.9%(-16.4)#38 |
| 39. | Triana | 0.50% | 22.4%(-21.9)#3 | 16.9%(-16.4)#39 |
| 40. | Fairfax Station | 0.50% | 12.8%(-12.3)#5 | 16.9%(-16.4)#40 |
| 41. | Huntington Woods | 0.51% | 18.2%(-17.7)#2 | 16.9%(-16.4)#41 |
| 42. | Cornelius | 0.52% | 14.0%(-13.5)#1 | 16.9%(-16.4)#42 |
| 43. | La Canada Flintridge | 0.53% | 15.5%(-15.0)#4 | 16.9%(-16.4)#43 |
| 44. | Lake St Louis | 0.53% | 16.7%(-16.2)#2 | 16.9%(-16.4)#44 |
| 45. | Gretna | 0.55% | 12.2%(-11.7)#1 | 16.9%(-16.4)#45 |
| 46. | Highland Village | 0.56% | 19.7%(-19.1)#5 | 16.9%(-16.3)#46 |
| 47. | Orange | 0.57% | 13.8%(-13.2)#1 | 16.9%(-16.3)#47 |
| 48. | Campton Hills | 0.58% | 15.8%(-15.2)#2 | 16.9%(-16.3)#48 |
| 49. | Worthing | 0.58% | 15.6%(-15.0)#2 | 16.9%(-16.3)#49 |
| 50. | Highlands Ranch | 0.58% | 11.5%(-10.9)#3 | 16.9%(-16.3)#50 |
| 51. | Commack | 0.59% | 18.5%(-17.9)#4 | 16.9%(-16.3)#51 |
| 52. | Brecksville | 0.59% | 18.8%(-18.2)#1 | 16.9%(-16.3)#52 |
| 53. | Dardenne Prairie | 0.59% | 16.7%(-16.2)#3 | 16.9%(-16.3)#53 |
| 54. | Lakeland Highlands | 0.59% | 18.0%(-17.4)#2 | 16.9%(-16.3)#54 |
| 55. | Yorkville | 0.60% | 15.8%(-15.2)#3 | 16.9%(-16.3)#55 |
| 56. | Chanhassen | 0.60% | 10.9%(-10.3)#1 | 16.9%(-16.3)#56 |
| 57. | Cottage Lake | 0.61% | 12.2%(-11.6)#2 | 16.9%(-16.3)#57 |
| 58. | Medford | 0.61% | 18.5%(-17.9)#5 | 16.9%(-16.3)#58 |
| 59. | Doylestown Borough | 0.61% | 16.5%(-15.9)#3 | 16.9%(-16.3)#59 |
| 60. | Verona | 0.61% | 13.6%(-13.0)#2 | 16.9%(-16.3)#60 |
| 61. | Wekiwa Springs | 0.62% | 18.0%(-17.4)#3 | 16.9%(-16.3)#61 |
| 62. | Stem | 0.62% | 18.7%(-18.1)#2 | 16.9%(-16.3)#62 |
| 63. | Montgomery | 0.63% | 18.8%(-18.2)#2 | 16.9%(-16.3)#63 |
| 64. | Deerfield | 0.63% | 15.8%(-15.2)#4 | 16.9%(-16.3)#64 |
| 65. | Ephraim | 0.63% | 9.1%(-8.46)#1 | 16.9%(-16.3)#65 |
| 66. | Brambleton | 0.64% | 12.8%(-12.2)#6 | 16.9%(-16.3)#66 |
| 67. | Grosse Pointe | 0.64% | 18.2%(-17.5)#3 | 16.9%(-16.3)#67 |
| 68. | Dranesville | 0.66% | 12.8%(-12.1)#7 | 16.9%(-16.2)#68 |
| 69. | St John | 0.66% | 16.3%(-15.7)#2 | 16.9%(-16.2)#69 |
| 70. | Bothell East | 0.66% | 12.2%(-11.5)#3 | 16.9%(-16.2)#70 |
| 71. | Fairview | 0.67% | 15.5%(-14.9)#5 | 16.9%(-16.2)#71 |
| 72. | Waukon | 0.67% | 13.4%(-12.7)#1 | 16.9%(-16.2)#72 |
| 73. | Glenn Dale | 0.67% | 11.8%(-11.1)#3 | 16.9%(-16.2)#73 |
| 74. | Firestone | 0.68% | 11.5%(-10.8)#4 | 16.9%(-16.2)#74 |
| 75. | West University Place | 0.69% | 19.7%(-19.0)#6 | 16.9%(-16.2)#75 |
| 76. | Oswego | 0.69% | 15.8%(-15.1)#5 | 16.9%(-16.2)#76 |
| 77. | Aiea | 0.70% | 12.5%(-11.8)#1 | 16.9%(-16.2)#77 |
| 78. | Pacific Grove | 0.70% | 15.5%(-14.8)#6 | 16.9%(-16.2)#78 |
| 79. | Pine Mountain | 0.70% | 19.4%(-18.7)#1 | 16.9%(-16.2)#79 |
| 80. | New Baltimore | 0.70% | 12.8%(-12.1)#8 | 16.9%(-16.2)#80 |
| 81. | Madeira | 0.70% | 18.8%(-18.1)#3 | 16.9%(-16.2)#81 |
| 82. | Rhodhiss | 0.70% | 18.7%(-18.0)#3 | 16.9%(-16.2)#82 |
| 83. | Clayton | 0.70% | 16.7%(-16.0)#4 | 16.9%(-16.2)#83 |
| 84. | Canby | 0.71% | 14.0%(-13.3)#2 | 16.9%(-16.2)#84 |
| 85. | Manhattan | 0.71% | 15.8%(-15.1)#6 | 16.9%(-16.2)#85 |
| 86. | Monroe | 0.72% | 14.0%(-13.3)#3 | 16.9%(-16.2)#86 |
| 87. | Old Greenwich | 0.72% | 13.8%(-13.1)#2 | 16.9%(-16.2)#87 |
| 88. | Lionville | 0.72% | 16.5%(-15.7)#4 | 16.9%(-16.2)#88 |
| 89. | Pantops | 0.73% | 12.8%(-12.1)#9 | 16.9%(-16.2)#89 |
| 90. | Summit | 0.73% | 12.2%(-11.5)#4 | 16.9%(-16.2)#90 |
| 91. | Rolling Hills Estates | 0.73% | 15.5%(-14.8)#7 | 16.9%(-16.2)#91 |
| 92. | Fate | 0.73% | 19.7%(-18.9)#7 | 16.9%(-16.2)#92 |
| 93. | Fairmount | 0.74% | 11.5%(-10.7)#5 | 16.9%(-16.2)#93 |
| 94. | Prairie Village | 0.75% | 13.6%(-12.8)#3 | 16.9%(-16.2)#94 |
| 95. | Reinholds | 0.75% | 16.5%(-15.7)#5 | 16.9%(-16.2)#95 |
| 96. | Madison Borough | 0.75% | 13.4%(-12.7)#5 | 16.9%(-16.2)#96 |
| 97. | West Point | 0.75% | 18.5%(-17.7)#6 | 16.9%(-16.2)#97 |
| 98. | Eyota | 0.75% | 10.9%(-10.1)#2 | 16.9%(-16.1)#98 |
| 99. | Foster City | 0.76% | 15.5%(-14.8)#8 | 16.9%(-16.1)#99 |
| 100. | Topton Borough | 0.76% | 16.5%(-15.7)#6 | 16.9%(-16.1)#100 |
Common Questions
What are the Top 10 Cities with the Lowest Child Poverty Level Among Boys Under the Age of 16 in the United States?
Top 10 Cities with the Lowest Child Poverty Level Among Boys Under the Age of 16 in the United States are:
#1
0.078%
#2
0.090%
#3
0.18%
#4
0.22%
#5
0.22%
#6
0.24%
#7
0.24%
#8
0.24%
#9
0.26%
#10
0.29%
What city has the Lowest Child Poverty Level Among Boys Under the Age of 16 in the United States?
Belmont has the Lowest Child Poverty Level Among Boys Under the Age of 16 in the United States with 0.078%.
What is the Poverty Level Among Boys Under the Age of 16 in the United States?
Poverty Level Among Boys Under the Age of 16 in the United States is 16.9%.