Maine Map & Demographics
Maine Map
Maine Overview
Mar 15, 1820
INCORPORATED
35,384
TOTAL AREA [ SQ MI ]
30,841
LAND AREA [ SQ MI ]
4,543
WATER AREA [ SQ MI ]
600
ELEVATION AVG [ FT ]
5,276
ELEVATION HIGH [ FT ]
Sea Level
ELEVATION LOW [ FT ]
44.3
POP DENSITY [ PPL / SQ MI ]
$39,718
PER CAPITA INCOME
$89,012
AVG FAMILY INCOME
$68,251
AVG HOUSEHOLD INCOME
25.0%
WAGE / INCOME GAP [ % ]
75.0¢/ $1
WAGE / INCOME GAP [ $ ]
$9,582
FAMILY INCOME DEFICIT
0.46
INEQUALITY / GINI INDEX
04401
LARGEST ZIP CODE
Portland
LARGEST CITY
Cumberland County
LARGEST COUNTY
1,366,949
TOTAL POPULATION
674,230
MALE POPULATION
692,719
FEMALE POPULATION
97.33
MALES / 100 FEMALES
102.74
FEMALES / 100 MALES
44.8
MEDIAN AGE
2.9
AVG FAMILY SIZE
2.3
AVG HOUSEHOLD SIZE
714,007
LABOR FORCE [ PEOPLE ]
62.2%
PERCENT IN LABOR FORCE
4.0%
UNEMPLOYMENT RATE
Maine Area Codes
Income in Maine
Income Overview in Maine
Per Capita Income in Maine is $39,718, while median incomes of families and households are $89,012 and $68,251 respectively.
| Characteristic | Number | Measure |
| Per Capita Income | 1,366,949 | $39,718 |
| Median Family Income | 351,677 | $89,012 |
| Mean Family Income | 351,677 | $112,151 |
| Median Household Income | 580,172 | $68,251 |
| Mean Household Income | 580,172 | $91,599 |
| Income Deficit | 351,677 | $9,582 |
| Wage / Income Gap (%) | 1,366,949 | 25.05% |
| Wage / Income Gap ($) | 1,366,949 | 74.95¢ per $1 |
| Gini / Inequality Index | 1,366,949 | 0.46 |
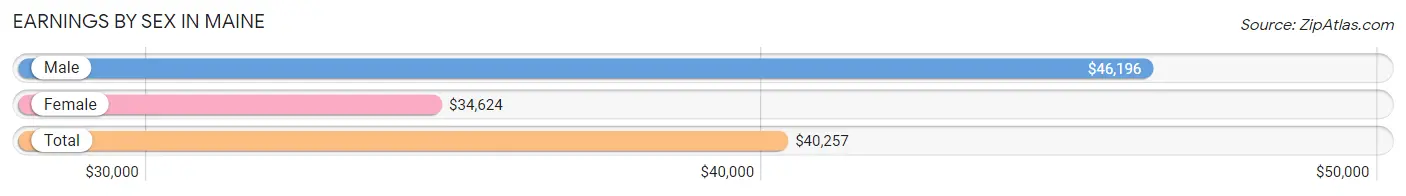
Earnings by Sex in Maine
Average Earnings in Maine are $40,257, $46,196 for men and $34,624 for women, a difference of 25.1%.
| Sex | Number | Average Earnings |
| Male | 392,046 (51.4%) | $46,196 |
| Female | 370,156 (48.6%) | $34,624 |
| Total | 762,202 (100.0%) | $40,257 |
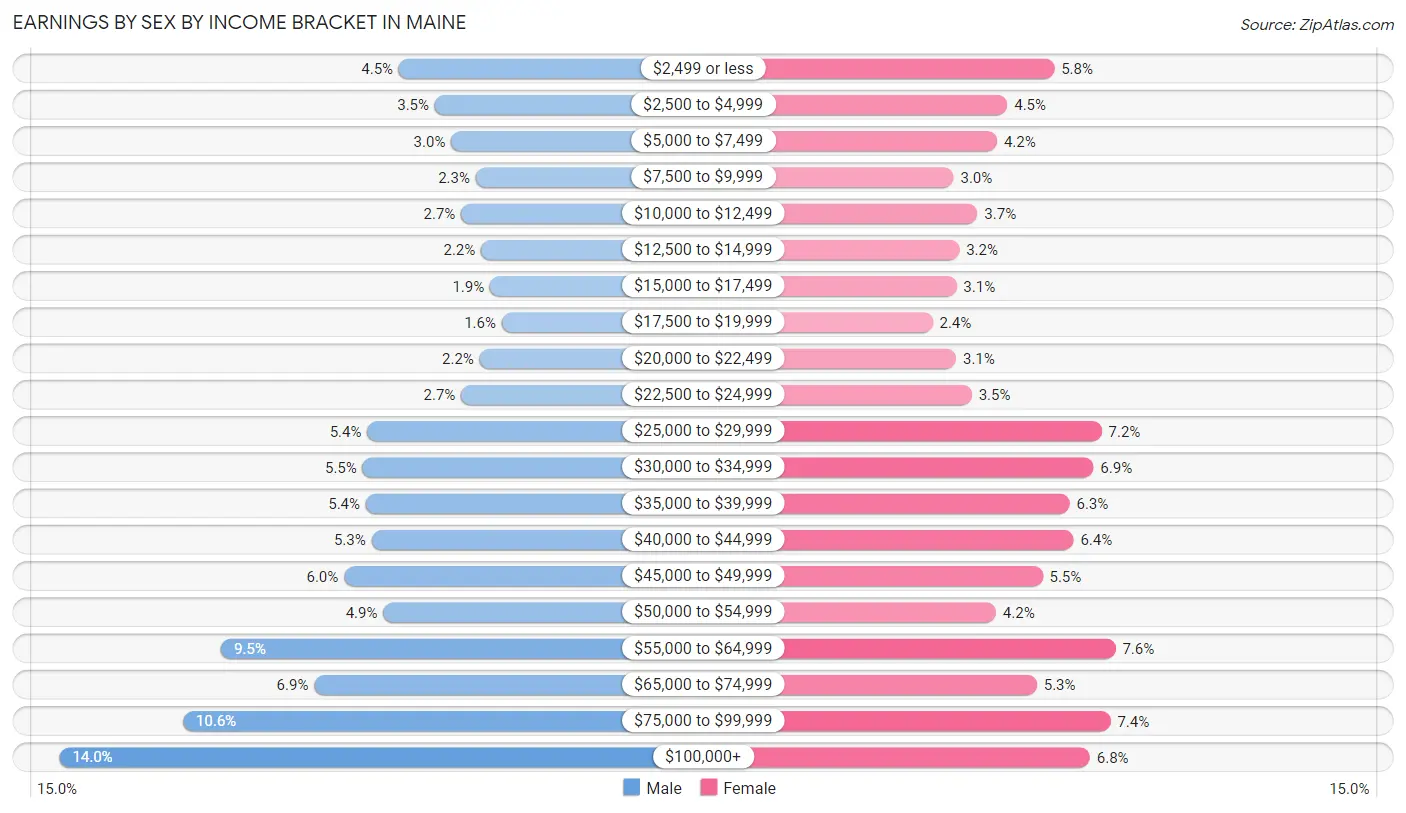
Earnings by Sex by Income Bracket in Maine
The most common earnings brackets in Maine are $100,000+ for men (54,963 | 14.0%) and $55,000 to $64,999 for women (27,929 | 7.5%).
| Income | Male | Female |
| $2,499 or less | 17,562 (4.5%) | 21,588 (5.8%) |
| $2,500 to $4,999 | 13,610 (3.5%) | 16,699 (4.5%) |
| $5,000 to $7,499 | 11,806 (3.0%) | 15,614 (4.2%) |
| $7,500 to $9,999 | 9,088 (2.3%) | 11,093 (3.0%) |
| $10,000 to $12,499 | 10,709 (2.7%) | 13,577 (3.7%) |
| $12,500 to $14,999 | 8,517 (2.2%) | 11,682 (3.2%) |
| $15,000 to $17,499 | 7,511 (1.9%) | 11,398 (3.1%) |
| $17,500 to $19,999 | 6,214 (1.6%) | 8,935 (2.4%) |
| $20,000 to $22,499 | 8,662 (2.2%) | 11,376 (3.1%) |
| $22,500 to $24,999 | 10,718 (2.7%) | 13,000 (3.5%) |
| $25,000 to $29,999 | 21,038 (5.4%) | 26,492 (7.2%) |
| $30,000 to $34,999 | 21,546 (5.5%) | 25,665 (6.9%) |
| $35,000 to $39,999 | 21,227 (5.4%) | 23,157 (6.3%) |
| $40,000 to $44,999 | 20,582 (5.2%) | 23,594 (6.4%) |
| $45,000 to $49,999 | 23,612 (6.0%) | 20,375 (5.5%) |
| $50,000 to $54,999 | 19,297 (4.9%) | 15,504 (4.2%) |
| $55,000 to $64,999 | 37,151 (9.5%) | 27,929 (7.5%) |
| $65,000 to $74,999 | 26,877 (6.9%) | 19,758 (5.3%) |
| $75,000 to $99,999 | 41,356 (10.5%) | 27,438 (7.4%) |
| $100,000+ | 54,963 (14.0%) | 25,282 (6.8%) |
| Total | 392,046 (100.0%) | 370,156 (100.0%) |
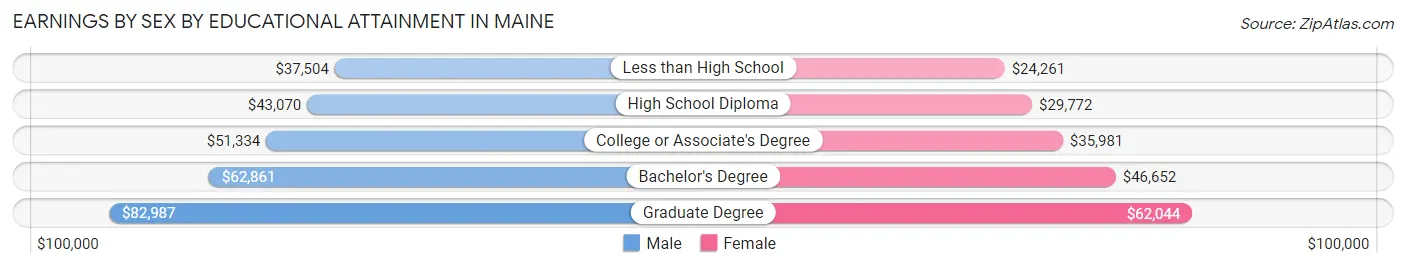
Earnings by Sex by Educational Attainment in Maine
Average earnings in Maine are $51,727 for men and $39,621 for women, a difference of 23.4%. Men with an educational attainment of graduate degree enjoy the highest average annual earnings of $82,987, while those with less than high school education earn the least with $37,504. Women with an educational attainment of graduate degree earn the most with the average annual earnings of $62,044, while those with less than high school education have the smallest earnings of $24,261.
| Educational Attainment | Male Income | Female Income |
| Less than High School | $37,504 | $24,261 |
| High School Diploma | $43,070 | $29,772 |
| College or Associate's Degree | $51,334 | $35,981 |
| Bachelor's Degree | $62,861 | $46,652 |
| Graduate Degree | $82,987 | $62,044 |
| Total | $51,727 | $39,621 |
Family Income in Maine
Family Income Brackets in Maine
According to the Maine family income data, there are 76,666 families falling into the $100,000 to $149,999 income range, which is the most common income bracket and makes up 21.8% of all families. Conversely, the $10,000 to $14,999 income bracket is the least frequent group with only 5,275 families (1.5%) belonging to this category.
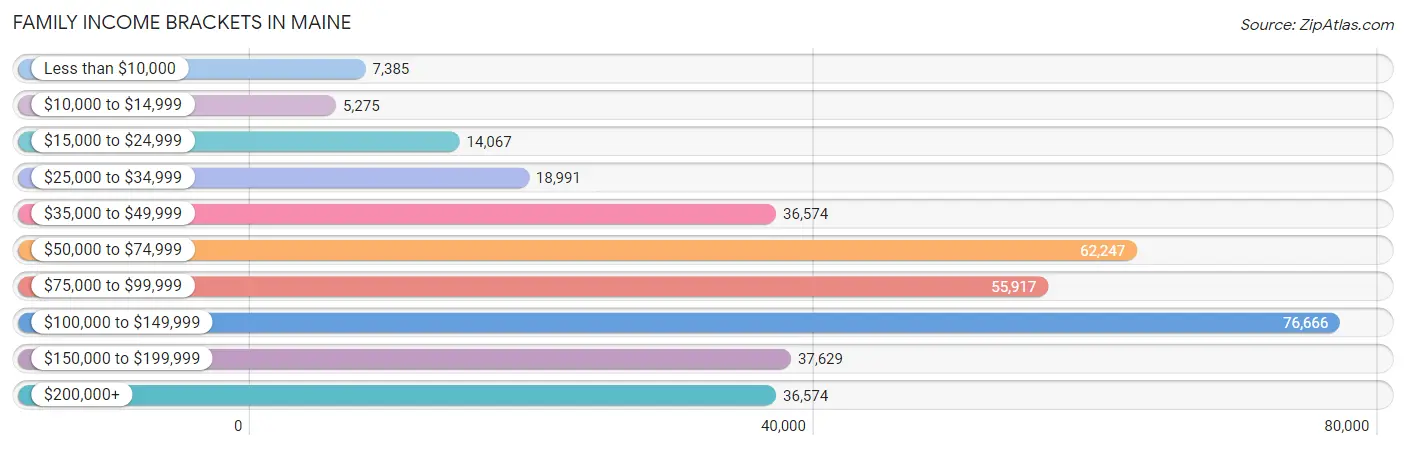
| Income Bracket | # Families | % Families |
| Less than $10,000 | 7,385 | 2.1% |
| $10,000 to $14,999 | 5,275 | 1.5% |
| $15,000 to $24,999 | 14,067 | 4.0% |
| $25,000 to $34,999 | 18,991 | 5.4% |
| $35,000 to $49,999 | 36,574 | 10.4% |
| $50,000 to $74,999 | 62,247 | 17.7% |
| $75,000 to $99,999 | 55,917 | 15.9% |
| $100,000 to $149,999 | 76,666 | 21.8% |
| $150,000 to $199,999 | 37,629 | 10.7% |
| $200,000+ | 36,574 | 10.4% |
Family Income by Famaliy Size in Maine
4-person families (55,234 | 15.7%) account for the highest median family income in Maine with $113,259 per family, while 2-person families (195,556 | 55.6%) have the highest median income of $38,600 per family member.
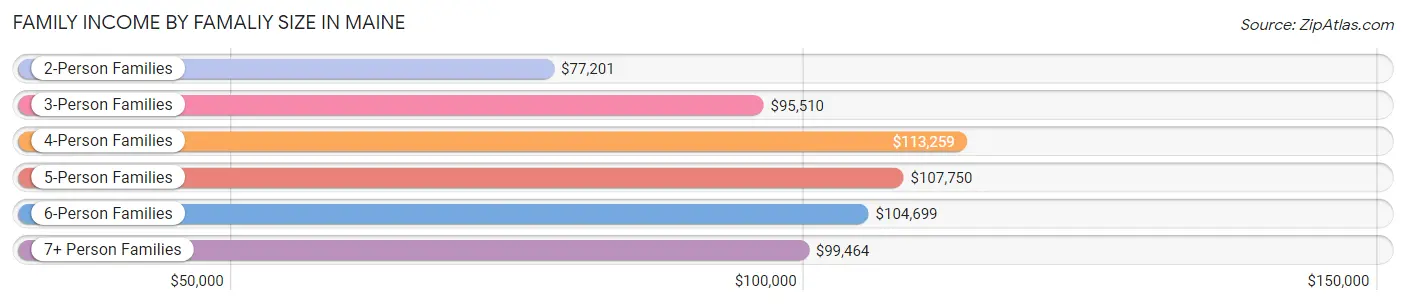
| Income Bracket | # Families | Median Income |
| 2-Person Families | 195,556 (55.6%) | $77,201 |
| 3-Person Families | 73,364 (20.9%) | $95,510 |
| 4-Person Families | 55,234 (15.7%) | $113,259 |
| 5-Person Families | 18,489 (5.3%) | $107,750 |
| 6-Person Families | 6,113 (1.7%) | $104,699 |
| 7+ Person Families | 2,921 (0.8%) | $99,464 |
| Total | 351,677 (100.0%) | $89,012 |
Family Income by Number of Earners in Maine
The median family income in Maine is $89,012, with families comprising 3+ earners (37,612) having the highest median family income of $143,987, while families with no earners (61,678) have the lowest median family income of $51,328, accounting for 10.7% and 17.5% of families, respectively.
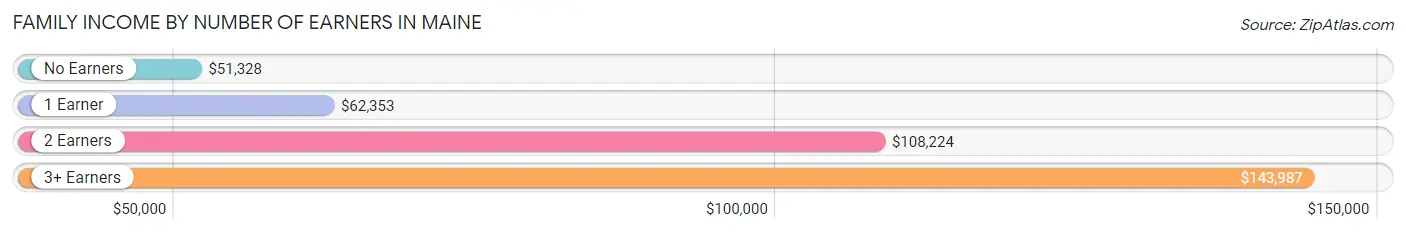
| Number of Earners | # Families | Median Income |
| No Earners | 61,678 (17.5%) | $51,328 |
| 1 Earner | 99,833 (28.4%) | $62,353 |
| 2 Earners | 152,554 (43.4%) | $108,224 |
| 3+ Earners | 37,612 (10.7%) | $143,987 |
| Total | 351,677 (100.0%) | $89,012 |
Household Income in Maine
Household Income Brackets in Maine
With 100,370 households falling in the category, the $50,000 to $74,999 income range is the most frequent in Maine, accounting for 17.3% of all households. In contrast, only 24,367 households (4.2%) fall into the less than $10,000 income bracket, making it the least populous group.
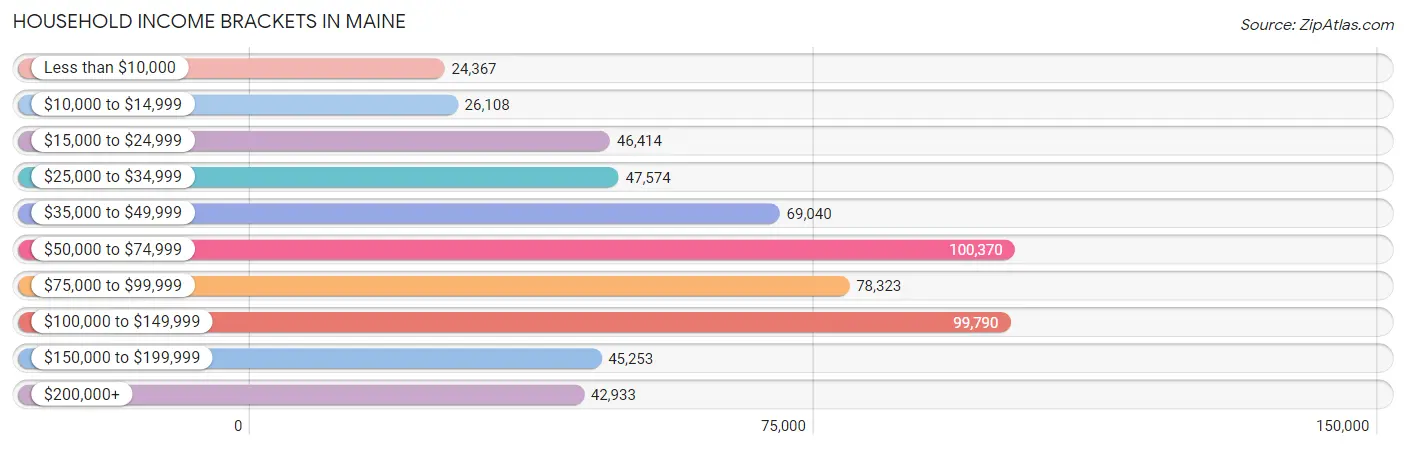
| Income Bracket | # Households | % Households |
| Less than $10,000 | 24,367 | 4.2% |
| $10,000 to $14,999 | 26,108 | 4.5% |
| $15,000 to $24,999 | 46,414 | 8.0% |
| $25,000 to $34,999 | 47,574 | 8.2% |
| $35,000 to $49,999 | 69,040 | 11.9% |
| $50,000 to $74,999 | 100,370 | 17.3% |
| $75,000 to $99,999 | 78,323 | 13.5% |
| $100,000 to $149,999 | 99,790 | 17.2% |
| $150,000 to $199,999 | 45,253 | 7.8% |
| $200,000+ | 42,933 | 7.4% |
Household Income by Householder Age in Maine
The median household income in Maine is $68,251, with the highest median household income of $81,383 found in the 25 to 44 years age bracket for the primary householder. A total of 157,654 households (27.2%) fall into this category. Meanwhile, the 15 to 24 years age bracket for the primary householder has the lowest median household income of $47,367, with 15,756 households (2.7%) in this group.
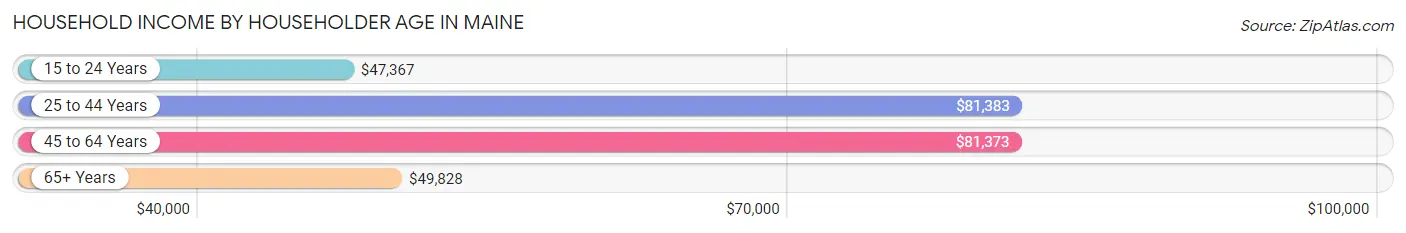
| Income Bracket | # Households | Median Income |
| 15 to 24 Years | 15,756 (2.7%) | $47,367 |
| 25 to 44 Years | 157,654 (27.2%) | $81,383 |
| 45 to 64 Years | 222,037 (38.3%) | $81,373 |
| 65+ Years | 184,725 (31.8%) | $49,828 |
| Total | 580,172 (100.0%) | $68,251 |
Poverty in Maine
Income Below Poverty by Sex and Age in Maine
With 9.9% poverty level for males and 11.9% for females among the residents of Maine, 15 year old males and 18 to 24 year old females are the most vulnerable to poverty, with 1,087 males (14.5%) and 8,549 females (18.8%) in their respective age groups living below the poverty level.
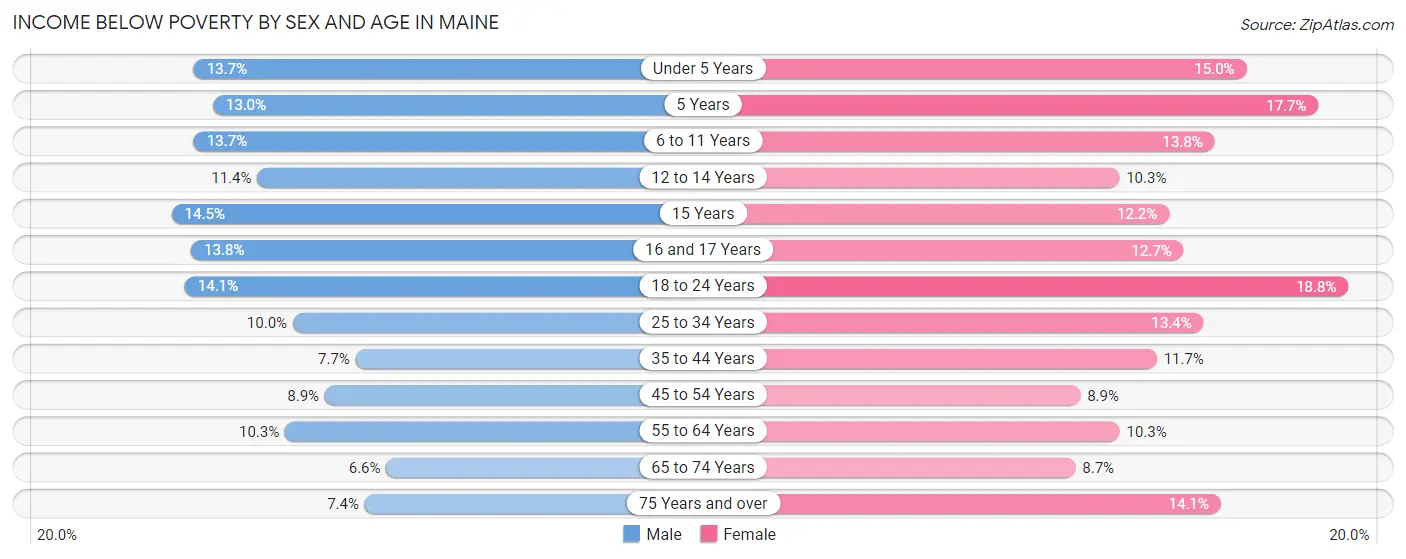
| Age Bracket | Male | Female |
| Under 5 Years | 4,345 (13.7%) | 4,505 (15.0%) |
| 5 Years | 858 (13.0%) | 1,184 (17.7%) |
| 6 to 11 Years | 5,532 (13.7%) | 5,455 (13.8%) |
| 12 to 14 Years | 2,676 (11.4%) | 2,085 (10.3%) |
| 15 Years | 1,087 (14.5%) | 841 (12.1%) |
| 16 and 17 Years | 2,201 (13.8%) | 1,962 (12.7%) |
| 18 to 24 Years | 6,780 (14.1%) | 8,549 (18.8%) |
| 25 to 34 Years | 8,209 (10.0%) | 10,873 (13.4%) |
| 35 to 44 Years | 6,099 (7.7%) | 9,414 (11.7%) |
| 45 to 54 Years | 7,679 (8.8%) | 7,725 (8.8%) |
| 55 to 64 Years | 10,665 (10.3%) | 11,163 (10.3%) |
| 65 to 74 Years | 5,491 (6.6%) | 7,838 (8.7%) |
| 75 Years and over | 3,459 (7.4%) | 8,816 (14.1%) |
| Total | 65,081 (9.9%) | 80,410 (11.9%) |
Income Above Poverty by Sex and Age in Maine
According to the poverty statistics in Maine, males aged 65 to 74 years and females aged 65 to 74 years are the age groups that are most secure financially, with 93.4% of males and 91.3% of females in these age groups living above the poverty line.
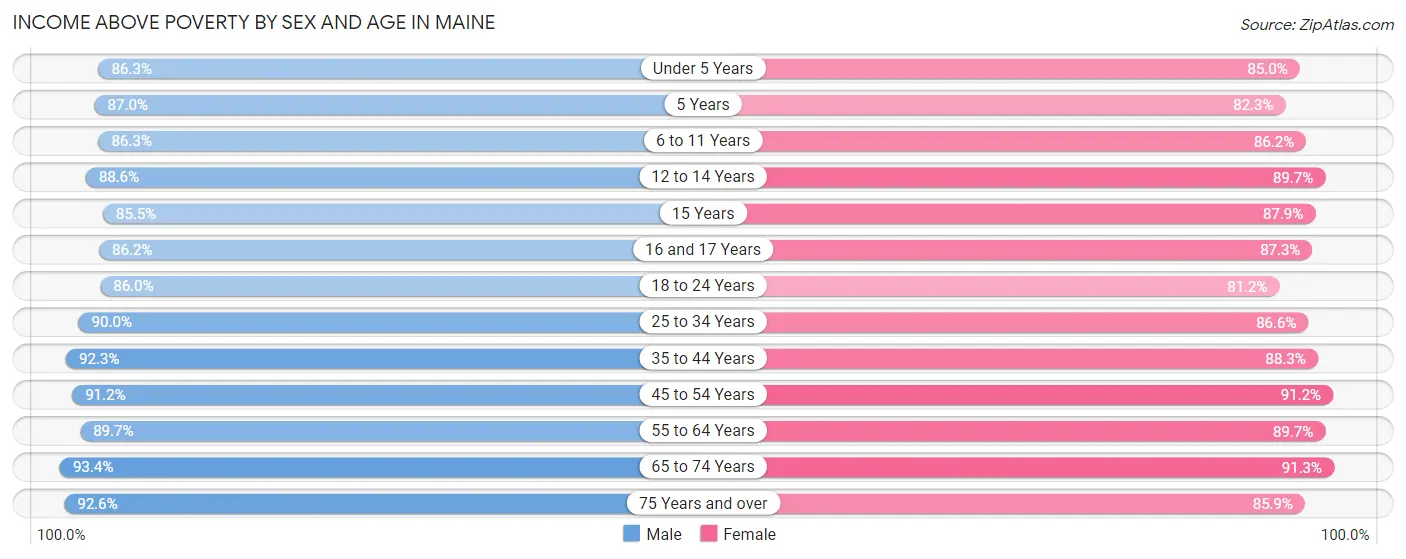
| Age Bracket | Male | Female |
| Under 5 Years | 27,315 (86.3%) | 25,493 (85.0%) |
| 5 Years | 5,739 (87.0%) | 5,508 (82.3%) |
| 6 to 11 Years | 34,779 (86.3%) | 33,954 (86.2%) |
| 12 to 14 Years | 20,890 (88.6%) | 18,162 (89.7%) |
| 15 Years | 6,390 (85.5%) | 6,078 (87.8%) |
| 16 and 17 Years | 13,725 (86.2%) | 13,494 (87.3%) |
| 18 to 24 Years | 41,463 (86.0%) | 36,918 (81.2%) |
| 25 to 34 Years | 73,527 (90.0%) | 70,088 (86.6%) |
| 35 to 44 Years | 72,987 (92.3%) | 71,098 (88.3%) |
| 45 to 54 Years | 79,049 (91.1%) | 79,606 (91.1%) |
| 55 to 64 Years | 92,538 (89.7%) | 97,122 (89.7%) |
| 65 to 74 Years | 78,131 (93.4%) | 82,562 (91.3%) |
| 75 Years and over | 43,506 (92.6%) | 53,841 (85.9%) |
| Total | 590,039 (90.1%) | 593,924 (88.1%) |
Income Below Poverty Among Married-Couple Families in Maine
The poverty statistics for married-couple families in Maine show that 3.2% or 8,818 of the total 277,978 families live below the poverty line. Families with 5 or more children have the highest poverty rate of 24.9%, comprising of 393 families. On the other hand, families with 1 or 2 children have the lowest poverty rate of 2.8%, which includes 2,106 families.
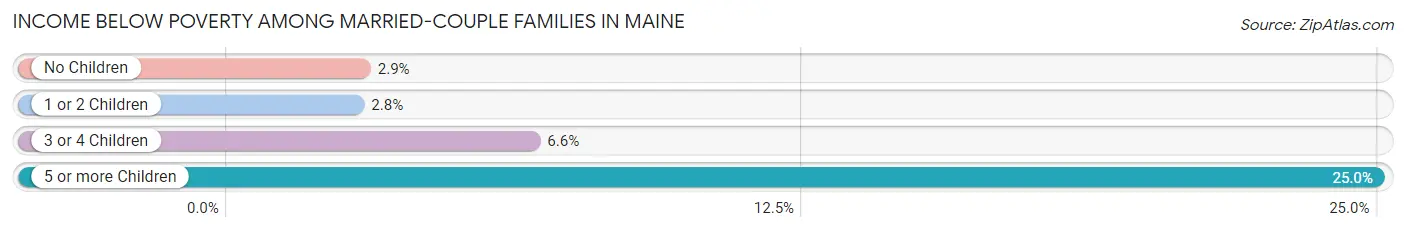
| Children | Above Poverty | Below Poverty |
| No Children | 179,889 (97.1%) | 5,358 (2.9%) |
| 1 or 2 Children | 74,443 (97.3%) | 2,106 (2.8%) |
| 3 or 4 Children | 13,646 (93.4%) | 961 (6.6%) |
| 5 or more Children | 1,182 (75.0%) | 393 (24.9%) |
| Total | 269,160 (96.8%) | 8,818 (3.2%) |
Income Below Poverty Among Single-Parent Households in Maine
According to the poverty data in Maine, 11.5% or 2,644 single-father households and 22.1% or 11,204 single-mother households are living below the poverty line. Among single-father households, those with 5 or more children have the highest poverty rate, with 33 households (45.2%) experiencing poverty. Likewise, among single-mother households, those with 5 or more children have the highest poverty rate, with 258 households (81.1%) falling below the poverty line.
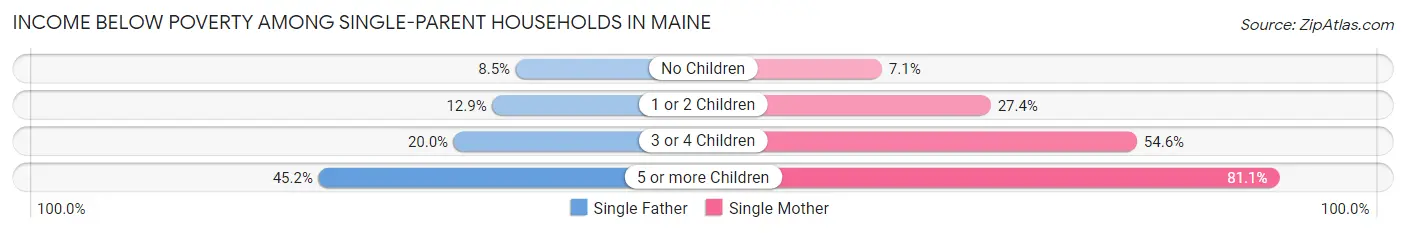
| Children | Single Father | Single Mother |
| No Children | 815 (8.5%) | 1,371 (7.1%) |
| 1 or 2 Children | 1,533 (12.9%) | 7,506 (27.4%) |
| 3 or 4 Children | 263 (20.0%) | 2,069 (54.6%) |
| 5 or more Children | 33 (45.2%) | 258 (81.1%) |
| Total | 2,644 (11.5%) | 11,204 (22.1%) |
Income Below Poverty Among Married-Couple vs Single-Parent Households in Maine
The poverty data for Maine shows that 8,818 of the married-couple family households (3.2%) and 13,848 of the single-parent households (18.8%) are living below the poverty level. Within the married-couple family households, those with 5 or more children have the highest poverty rate, with 393 households (24.9%) falling below the poverty line. Among the single-parent households, those with 5 or more children have the highest poverty rate, with 291 household (74.4%) living below poverty.
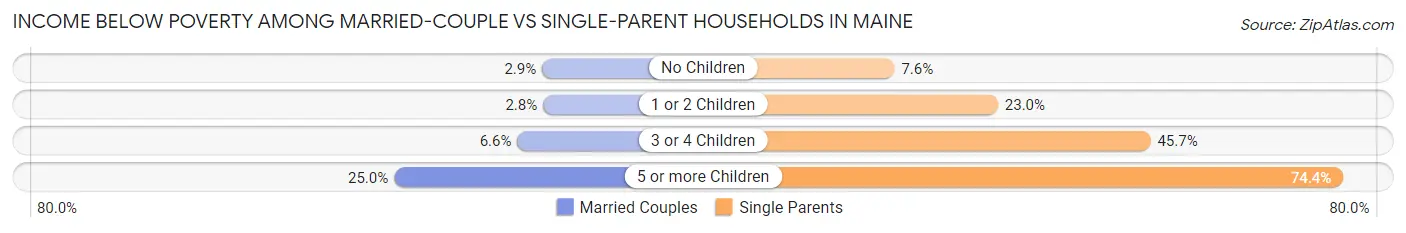
| Children | Married-Couple Families | Single-Parent Households |
| No Children | 5,358 (2.9%) | 2,186 (7.6%) |
| 1 or 2 Children | 2,106 (2.8%) | 9,039 (23.0%) |
| 3 or 4 Children | 961 (6.6%) | 2,332 (45.7%) |
| 5 or more Children | 393 (24.9%) | 291 (74.4%) |
| Total | 8,818 (3.2%) | 13,848 (18.8%) |
Largest Zip Codes by Population in Maine
The largest zip codes in Maine by population are 04401 (44,285), 04240 (37,577), 04103 (31,892), 04106 (26,873), and 04901 (26,463).
1.04401
44,285 (3.24%)
2.04240
37,577 (2.75%)
3.04103
31,892 (2.33%)
4.04106
26,873 (1.97%)
5.04901
26,463 (1.94%)
6.04330
26,394 (1.93%)
7.04005
24,590 (1.80%)
8.04210
24,038 (1.76%)
9.04074
22,098 (1.62%)
10.04011
21,691 (1.59%)
11.04072
20,446 (1.50%)
12.04092
20,339 (1.49%)
13.04062
18,648 (1.36%)
14.04038
17,999 (1.32%)
15.04101
17,832 (1.30%)
16.04102
17,501 (1.28%)
17.04073
17,389 (1.27%)
18.04605
14,686 (1.07%)
19.04105
12,436 (0.91%)
20.04345
12,282 (0.90%)
21.04530
11,584 (0.85%)
22.04043
11,566 (0.85%)
23.04090
11,365 (0.83%)
24.03909
10,811 (0.79%)
25.04938
10,261 (0.75%)
26.04730
10,092 (0.74%)
27.04976
10,036 (0.73%)
28.04412
9,633 (0.70%)
29.04086
9,566 (0.70%)
30.04107
9,519 (0.70%)
Largest Cities by Population in Maine
The largest cities in Maine by population are Portland (68,280), Lewiston (37,577), Bangor (31,705), South Portland (26,656), and Auburn (24,038).
1.Portland
68,280 (5.00%)
2.Lewiston
37,577 (2.75%)
3.Bangor
31,705 (2.32%)
26,656 (1.95%)
5.Auburn
24,038 (1.76%)
22,438 (1.64%)
7.Sanford
21,986 (1.61%)
8.Saco
20,446 (1.50%)
20,339 (1.49%)
10.Augusta
18,938 (1.39%)
11.Brunswick
16,725 (1.22%)
12.Waterville
15,785 (1.15%)
13.Orono
10,116 (0.74%)
14.Brewer
9,633 (0.70%)
9,040 (0.66%)
16.Bath
8,775 (0.64%)
17.Presque Isle
8,772 (0.64%)
18.Ellsworth
8,478 (0.62%)
19.Old Town
7,458 (0.55%)
20.Caribou
7,454 (0.55%)
21.Gorham
7,050 (0.52%)
22.Rockland
6,986 (0.51%)
23.Belfast
6,953 (0.51%)
24.Topsham
6,813 (0.50%)
25.Skowhegan
6,270 (0.46%)
26.Kennebunk
6,000 (0.44%)
27.Gardiner
5,994 (0.44%)
28.Yarmouth
5,937 (0.43%)
29.Winslow
5,597 (0.41%)
5,525 (0.40%)
Largest Counties by Population in Maine
The largest counties in Maine by population are Cumberland County (303,357), York County (212,691), Penobscot County (152,640), Kennebec County (124,003), and Androscoggin County (111,532).
303,357 (22.19%)
212,691 (15.56%)
152,640 (11.17%)
124,003 (9.07%)
111,532 (8.16%)
67,237 (4.92%)
58,276 (4.26%)
55,851 (4.09%)
50,656 (3.71%)
10.Knox County
40,729 (2.98%)
11.Waldo County
39,772 (2.91%)
36,868 (2.70%)
35,466 (2.59%)
31,096 (2.27%)
29,839 (2.18%)
16,936 (1.24%)
Race in Maine
The most populous races in Maine are White / Caucasian (1,261,284 | 92.3%), Two or more Races (53,704 | 3.9%), and Hispanic or Latino (25,898 | 1.9%).
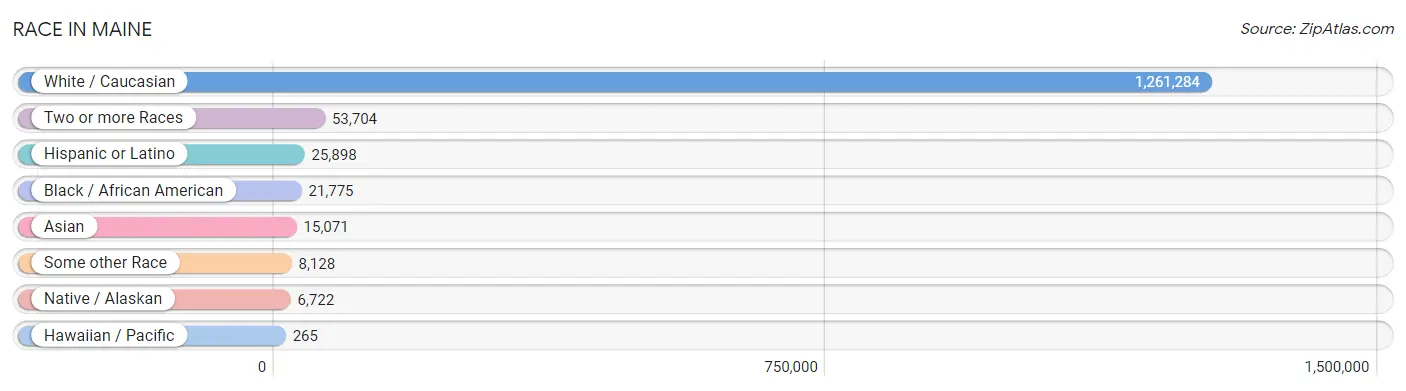
| Race | # Population | % Population |
| Asian | 15,071 | 1.1% |
| Black / African American | 21,775 | 1.6% |
| Hawaiian / Pacific | 265 | 0.0% |
| Hispanic or Latino | 25,898 | 1.9% |
| Native / Alaskan | 6,722 | 0.5% |
| White / Caucasian | 1,261,284 | 92.3% |
| Two or more Races | 53,704 | 3.9% |
| Some other Race | 8,128 | 0.6% |
| Total | 1,366,949 | 100.0% |
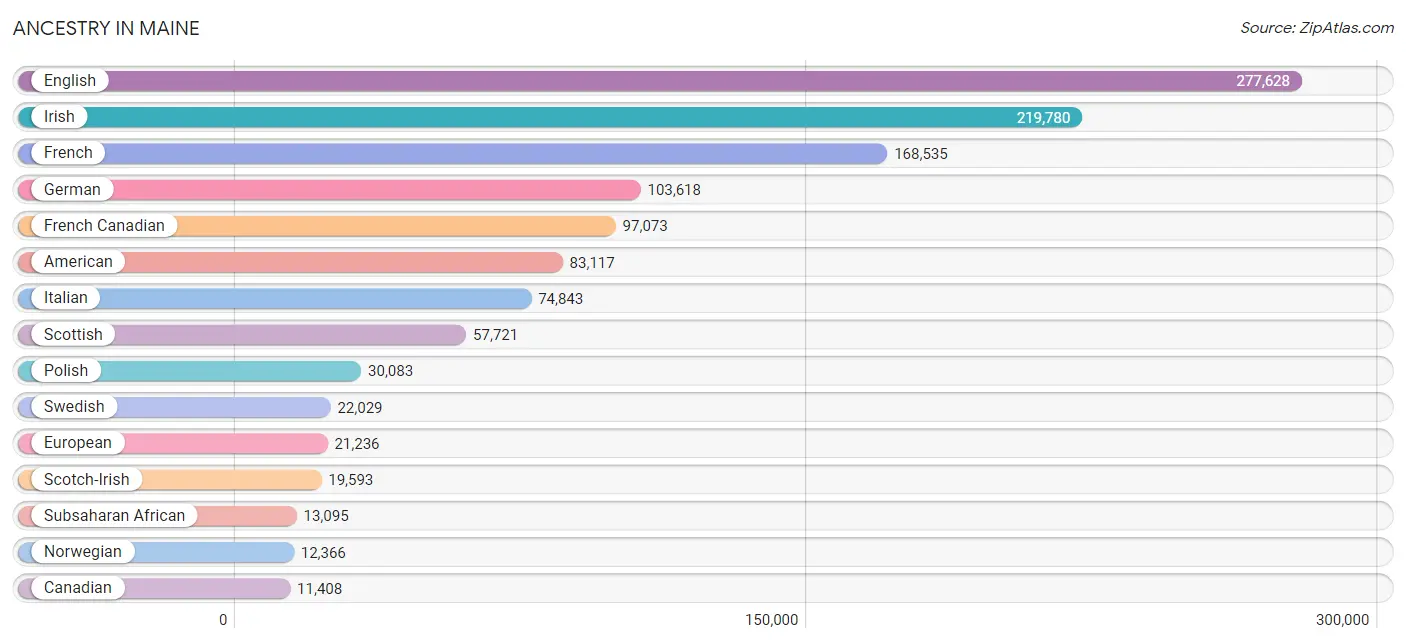
Ancestry in Maine
The most populous ancestries reported in Maine are English (277,628 | 20.3%), Irish (219,780 | 16.1%), French (168,535 | 12.3%), German (103,618 | 7.6%), and French Canadian (97,073 | 7.1%), together accounting for 63.4% of all Maine residents.
| Ancestry | # Population | % Population |
| Afghan | 617 | 0.1% |
| African | 2,288 | 0.2% |
| Alaska Native | 15 | 0.0% |
| Alaskan Athabascan | 12 | 0.0% |
| Albanian | 447 | 0.0% |
| Aleut | 17 | 0.0% |
| Alsatian | 87 | 0.0% |
| American | 83,117 | 6.1% |
| Apache | 61 | 0.0% |
| Arab | 5,019 | 0.4% |
| Argentinean | 316 | 0.0% |
| Armenian | 1,455 | 0.1% |
| Assyrian / Chaldean / Syriac | 49 | 0.0% |
| Australian | 724 | 0.1% |
| Austrian | 2,193 | 0.2% |
| Barbadian | 84 | 0.0% |
| Basque | 76 | 0.0% |
| Belgian | 704 | 0.1% |
| Belizean | 22 | 0.0% |
| Bermudan | 35 | 0.0% |
| Bhutanese | 2,165 | 0.2% |
| Blackfeet | 738 | 0.1% |
| Bolivian | 85 | 0.0% |
| Brazilian | 799 | 0.1% |
| British | 10,840 | 0.8% |
| British West Indian | 11 | 0.0% |
| Bulgarian | 426 | 0.0% |
| Burmese | 2,791 | 0.2% |
| Cajun | 1,120 | 0.1% |
| Cambodian | 20 | 0.0% |
| Canadian | 11,408 | 0.8% |
| Cape Verdean | 292 | 0.0% |
| Carpatho Rusyn | 24 | 0.0% |
| Celtic | 363 | 0.0% |
| Central American | 2,142 | 0.2% |
| Central American Indian | 191 | 0.0% |
| Cherokee | 1,219 | 0.1% |
| Cheyenne | 86 | 0.0% |
| Chickasaw | 211 | 0.0% |
| Chilean | 112 | 0.0% |
| Chinese | 10 | 0.0% |
| Chippewa | 252 | 0.0% |
| Choctaw | 109 | 0.0% |
| Colombian | 790 | 0.1% |
| Comanche | 22 | 0.0% |
| Costa Rican | 197 | 0.0% |
| Cree | 55 | 0.0% |
| Creek | 17 | 0.0% |
| Croatian | 415 | 0.0% |
| Crow | 10 | 0.0% |
| Cuban | 1,286 | 0.1% |
| Cypriot | 63 | 0.0% |
| Czech | 3,414 | 0.3% |
| Czechoslovakian | 1,188 | 0.1% |
| Danish | 5,059 | 0.4% |
| Delaware | 17 | 0.0% |
| Dominican | 719 | 0.1% |
| Dutch | 11,171 | 0.8% |
| Eastern European | 4,231 | 0.3% |
| Ecuadorian | 556 | 0.0% |
| Egyptian | 155 | 0.0% |
| English | 277,628 | 20.3% |
| Estonian | 116 | 0.0% |
| Ethiopian | 229 | 0.0% |
| European | 21,236 | 1.5% |
| Fijian | 1 | 0.0% |
| Filipino | 440 | 0.0% |
| Finnish | 6,254 | 0.5% |
| French | 168,535 | 12.3% |
| French American Indian | 505 | 0.0% |
| French Canadian | 97,073 | 7.1% |
| German | 103,618 | 7.6% |
| Greek | 6,309 | 0.5% |
| Guamanian / Chamorro | 326 | 0.0% |
| Guatemalan | 689 | 0.1% |
| Guyanese | 139 | 0.0% |
| Haitian | 343 | 0.0% |
| Honduran | 198 | 0.0% |
| Hungarian | 3,912 | 0.3% |
| Icelander | 193 | 0.0% |
| Indian (Asian) | 5,594 | 0.4% |
| Indonesian | 48 | 0.0% |
| Inupiat | 78 | 0.0% |
| Iranian | 414 | 0.0% |
| Iraqi | 624 | 0.1% |
| Irish | 219,780 | 16.1% |
| Iroquois | 486 | 0.0% |
| Israeli | 159 | 0.0% |
| Italian | 74,843 | 5.5% |
| Jamaican | 1,578 | 0.1% |
| Japanese | 1,334 | 0.1% |
| Jordanian | 22 | 0.0% |
| Kenyan | 212 | 0.0% |
| Kiowa | 2 | 0.0% |
| Korean | 4,710 | 0.3% |
| Laotian | 301 | 0.0% |
| Latvian | 415 | 0.0% |
| Lebanese | 2,623 | 0.2% |
| Liberian | 7 | 0.0% |
| Lithuanian | 4,582 | 0.3% |
| Lumbee | 10 | 0.0% |
| Luxembourger | 7 | 0.0% |
| Macedonian | 75 | 0.0% |
| Malaysian | 127 | 0.0% |
| Maltese | 8 | 0.0% |
| Mexican | 7,909 | 0.6% |
| Mexican American Indian | 137 | 0.0% |
| Mongolian | 65 | 0.0% |
| Moroccan | 215 | 0.0% |
| Native Hawaiian | 545 | 0.0% |
| Navajo | 177 | 0.0% |
| New Zealander | 168 | 0.0% |
| Nicaraguan | 135 | 0.0% |
| Nigerian | 737 | 0.1% |
| Northern European | 2,516 | 0.2% |
| Norwegian | 12,366 | 0.9% |
| Osage | 12 | 0.0% |
| Pakistani | 1,178 | 0.1% |
| Palestinian | 41 | 0.0% |
| Panamanian | 298 | 0.0% |
| Paraguayan | 4 | 0.0% |
| Pennsylvania German | 718 | 0.1% |
| Peruvian | 835 | 0.1% |
| Polish | 30,083 | 2.2% |
| Portuguese | 7,473 | 0.5% |
| Potawatomi | 12 | 0.0% |
| Puerto Rican | 6,301 | 0.5% |
| Romanian | 769 | 0.1% |
| Russian | 8,024 | 0.6% |
| Salvadoran | 595 | 0.0% |
| Samoan | 163 | 0.0% |
| Scandinavian | 5,336 | 0.4% |
| Scotch-Irish | 19,593 | 1.4% |
| Scottish | 57,721 | 4.2% |
| Seminole | 10 | 0.0% |
| Senegalese | 4 | 0.0% |
| Serbian | 363 | 0.0% |
| Shoshone | 3 | 0.0% |
| Sioux | 434 | 0.0% |
| Slavic | 274 | 0.0% |
| Slovak | 1,912 | 0.1% |
| Slovene | 277 | 0.0% |
| Somali | 3,851 | 0.3% |
| South African | 157 | 0.0% |
| South American | 3,073 | 0.2% |
| South American Indian | 105 | 0.0% |
| Soviet Union | 4 | 0.0% |
| Spaniard | 1,407 | 0.1% |
| Spanish | 761 | 0.1% |
| Spanish American | 33 | 0.0% |
| Spanish American Indian | 12 | 0.0% |
| Sri Lankan | 2,500 | 0.2% |
| Subsaharan African | 13,095 | 1.0% |
| Sudanese | 336 | 0.0% |
| Swedish | 22,029 | 1.6% |
| Swiss | 2,235 | 0.2% |
| Syrian | 545 | 0.0% |
| Thai | 2,297 | 0.2% |
| Tlingit-Haida | 7 | 0.0% |
| Trinidadian and Tobagonian | 201 | 0.0% |
| Turkish | 570 | 0.0% |
| U.S. Virgin Islander | 19 | 0.0% |
| Ugandan | 35 | 0.0% |
| Ukrainian | 2,855 | 0.2% |
| Uruguayan | 47 | 0.0% |
| Venezuelan | 277 | 0.0% |
| Welsh | 10,884 | 0.8% |
| West Indian | 190 | 0.0% |
| Yaqui | 16 | 0.0% |
| Yugoslavian | 349 | 0.0% |
| Yup'ik | 173 | 0.0% |
| Zimbabwean | 40 | 0.0% | View All 172 Rows |
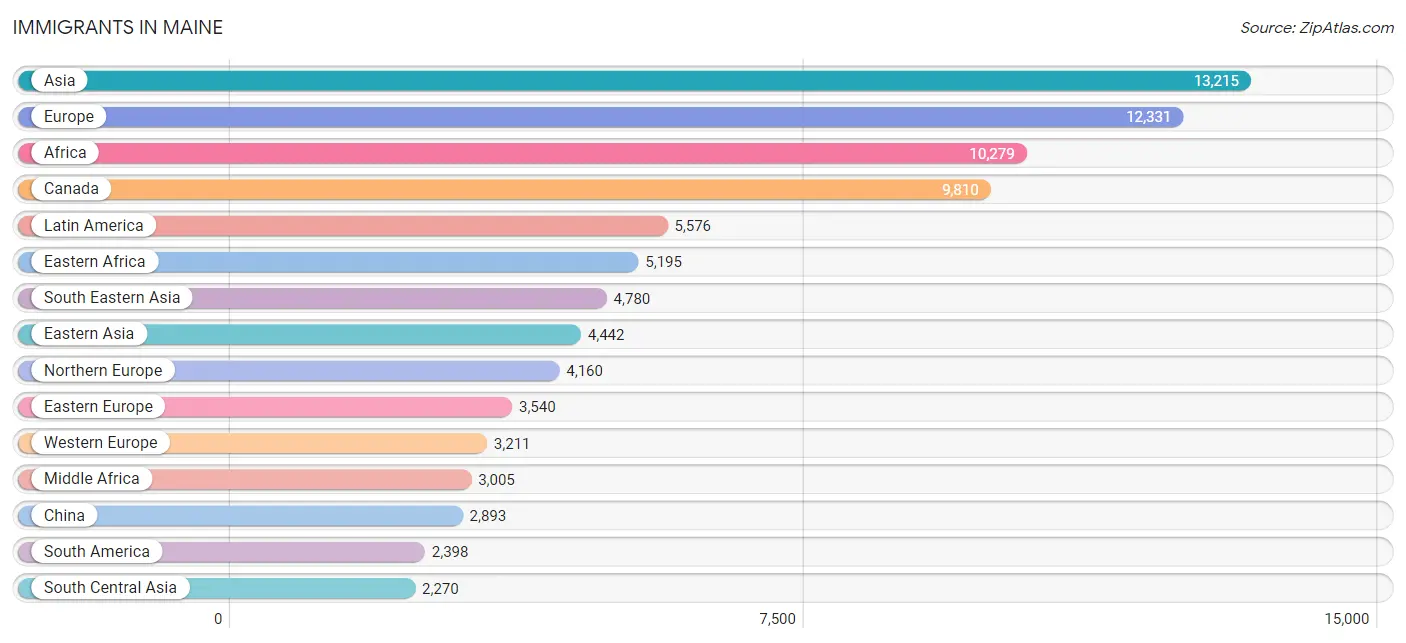
Immigrants in Maine
The most numerous immigrant groups reported in Maine came from Asia (13,215 | 1.0%), Europe (12,331 | 0.9%), Africa (10,279 | 0.7%), Canada (9,810 | 0.7%), and Latin America (5,576 | 0.4%), together accounting for 3.7% of all Maine residents.
| Immigration Origin | # Population | % Population |
| Afghanistan | 572 | 0.0% |
| Africa | 10,279 | 0.7% |
| Albania | 111 | 0.0% |
| Argentina | 364 | 0.0% |
| Armenia | 71 | 0.0% |
| Asia | 13,215 | 1.0% |
| Australia | 521 | 0.0% |
| Austria | 201 | 0.0% |
| Azores | 51 | 0.0% |
| Bangladesh | 153 | 0.0% |
| Barbados | 27 | 0.0% |
| Belarus | 88 | 0.0% |
| Belgium | 104 | 0.0% |
| Bolivia | 39 | 0.0% |
| Bosnia and Herzegovina | 111 | 0.0% |
| Brazil | 549 | 0.0% |
| Bulgaria | 338 | 0.0% |
| Cabo Verde | 82 | 0.0% |
| Cambodia | 603 | 0.0% |
| Cameroon | 43 | 0.0% |
| Canada | 9,810 | 0.7% |
| Caribbean | 1,491 | 0.1% |
| Central America | 1,687 | 0.1% |
| Chile | 172 | 0.0% |
| China | 2,893 | 0.2% |
| Colombia | 205 | 0.0% |
| Congo | 421 | 0.0% |
| Costa Rica | 81 | 0.0% |
| Croatia | 25 | 0.0% |
| Cuba | 84 | 0.0% |
| Czechoslovakia | 400 | 0.0% |
| Denmark | 138 | 0.0% |
| Dominican Republic | 231 | 0.0% |
| Eastern Africa | 5,195 | 0.4% |
| Eastern Asia | 4,442 | 0.3% |
| Eastern Europe | 3,540 | 0.3% |
| Ecuador | 227 | 0.0% |
| Egypt | 44 | 0.0% |
| El Salvador | 215 | 0.0% |
| England | 1,593 | 0.1% |
| Eritrea | 8 | 0.0% |
| Ethiopia | 286 | 0.0% |
| Europe | 12,331 | 0.9% |
| France | 421 | 0.0% |
| Germany | 2,005 | 0.2% |
| Ghana | 47 | 0.0% |
| Greece | 306 | 0.0% |
| Guatemala | 291 | 0.0% |
| Guyana | 62 | 0.0% |
| Haiti | 160 | 0.0% |
| Honduras | 115 | 0.0% |
| Hong Kong | 67 | 0.0% |
| Hungary | 71 | 0.0% |
| India | 1,031 | 0.1% |
| Indonesia | 181 | 0.0% |
| Iran | 274 | 0.0% |
| Iraq | 865 | 0.1% |
| Ireland | 391 | 0.0% |
| Israel | 93 | 0.0% |
| Italy | 349 | 0.0% |
| Jamaica | 912 | 0.1% |
| Japan | 385 | 0.0% |
| Jordan | 35 | 0.0% |
| Kazakhstan | 29 | 0.0% |
| Kenya | 590 | 0.0% |
| Korea | 1,146 | 0.1% |
| Kuwait | 28 | 0.0% |
| Laos | 68 | 0.0% |
| Latin America | 5,576 | 0.4% |
| Latvia | 12 | 0.0% |
| Lebanon | 7 | 0.0% |
| Lithuania | 47 | 0.0% |
| Malaysia | 78 | 0.0% |
| Mexico | 841 | 0.1% |
| Middle Africa | 3,005 | 0.2% |
| Moldova | 35 | 0.0% |
| Morocco | 155 | 0.0% |
| Nepal | 77 | 0.0% |
| Netherlands | 371 | 0.0% |
| Nicaragua | 84 | 0.0% |
| Nigeria | 446 | 0.0% |
| North Macedonia | 20 | 0.0% |
| Northern Africa | 486 | 0.0% |
| Northern Europe | 4,160 | 0.3% |
| Norway | 102 | 0.0% |
| Oceania | 658 | 0.1% |
| Pakistan | 101 | 0.0% |
| Panama | 60 | 0.0% |
| Peru | 646 | 0.1% |
| Philippines | 2,054 | 0.2% |
| Poland | 582 | 0.0% |
| Portugal | 336 | 0.0% |
| Romania | 343 | 0.0% |
| Russia | 847 | 0.1% |
| Saudi Arabia | 143 | 0.0% |
| Scotland | 321 | 0.0% |
| Serbia | 25 | 0.0% |
| Singapore | 25 | 0.0% |
| Somalia | 1,472 | 0.1% |
| South Africa | 612 | 0.0% |
| South America | 2,398 | 0.2% |
| South Central Asia | 2,270 | 0.2% |
| South Eastern Asia | 4,780 | 0.4% |
| Southern Europe | 1,418 | 0.1% |
| Spain | 406 | 0.0% |
| Sri Lanka | 3 | 0.0% |
| St. Vincent and the Grenadines | 24 | 0.0% |
| Sudan | 198 | 0.0% |
| Sweden | 102 | 0.0% |
| Switzerland | 109 | 0.0% |
| Syria | 170 | 0.0% |
| Taiwan | 434 | 0.0% |
| Thailand | 707 | 0.1% |
| Trinidad and Tobago | 28 | 0.0% |
| Turkey | 189 | 0.0% |
| Uganda | 46 | 0.0% |
| Ukraine | 327 | 0.0% |
| Uzbekistan | 3 | 0.0% |
| Venezuela | 116 | 0.0% |
| Vietnam | 1,031 | 0.1% |
| Western Africa | 852 | 0.1% |
| Western Asia | 1,709 | 0.1% |
| Western Europe | 3,211 | 0.2% |
| Zaire | 1,020 | 0.1% |
| Zimbabwe | 68 | 0.0% | View All 125 Rows |
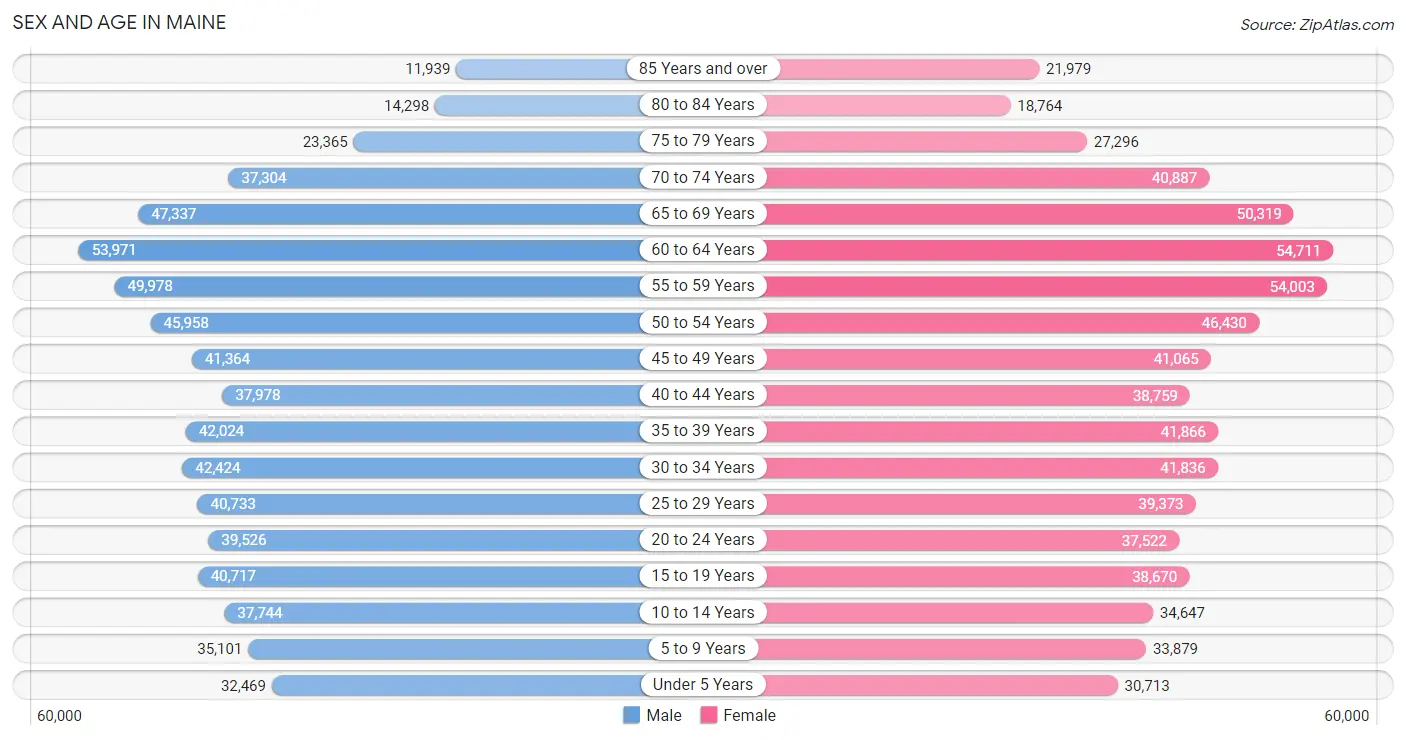
Sex and Age in Maine
Sex and Age in Maine
The most populous age groups in Maine are 60 to 64 Years (53,971 | 8.0%) for men and 60 to 64 Years (54,711 | 7.9%) for women.
| Age Bracket | Male | Female |
| Under 5 Years | 32,469 (4.8%) | 30,713 (4.4%) |
| 5 to 9 Years | 35,101 (5.2%) | 33,879 (4.9%) |
| 10 to 14 Years | 37,744 (5.6%) | 34,647 (5.0%) |
| 15 to 19 Years | 40,717 (6.0%) | 38,670 (5.6%) |
| 20 to 24 Years | 39,526 (5.9%) | 37,522 (5.4%) |
| 25 to 29 Years | 40,733 (6.0%) | 39,373 (5.7%) |
| 30 to 34 Years | 42,424 (6.3%) | 41,836 (6.0%) |
| 35 to 39 Years | 42,024 (6.2%) | 41,866 (6.0%) |
| 40 to 44 Years | 37,978 (5.6%) | 38,759 (5.6%) |
| 45 to 49 Years | 41,364 (6.1%) | 41,065 (5.9%) |
| 50 to 54 Years | 45,958 (6.8%) | 46,430 (6.7%) |
| 55 to 59 Years | 49,978 (7.4%) | 54,003 (7.8%) |
| 60 to 64 Years | 53,971 (8.0%) | 54,711 (7.9%) |
| 65 to 69 Years | 47,337 (7.0%) | 50,319 (7.3%) |
| 70 to 74 Years | 37,304 (5.5%) | 40,887 (5.9%) |
| 75 to 79 Years | 23,365 (3.5%) | 27,296 (3.9%) |
| 80 to 84 Years | 14,298 (2.1%) | 18,764 (2.7%) |
| 85 Years and over | 11,939 (1.8%) | 21,979 (3.2%) |
| Total | 674,230 (100.0%) | 692,719 (100.0%) |
Families and Households in Maine
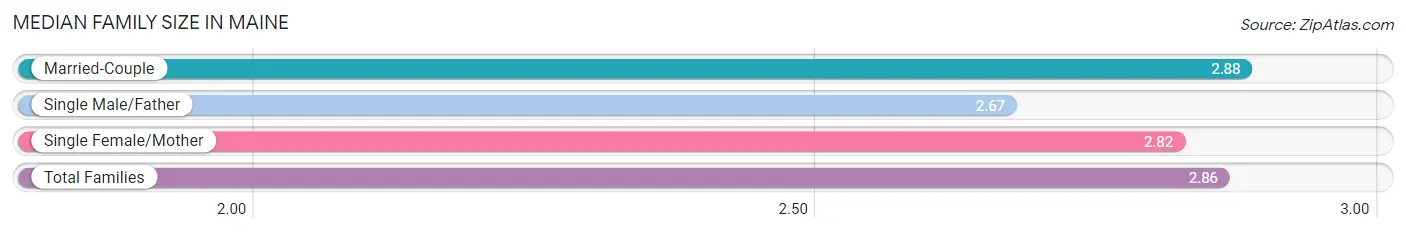
Median Family Size in Maine
The median family size in Maine is 2.86 persons per family, with married-couple families (277,978 | 79.0%) accounting for the largest median family size of 2.88 persons per family. On the other hand, single male/father families (22,930 | 6.5%) represent the smallest median family size with 2.67 persons per family.
| Family Type | # Families | Family Size |
| Married-Couple | 277,978 (79.0%) | 2.88 |
| Single Male/Father | 22,930 (6.5%) | 2.67 |
| Single Female/Mother | 50,769 (14.4%) | 2.82 |
| Total Families | 351,677 (100.0%) | 2.86 |
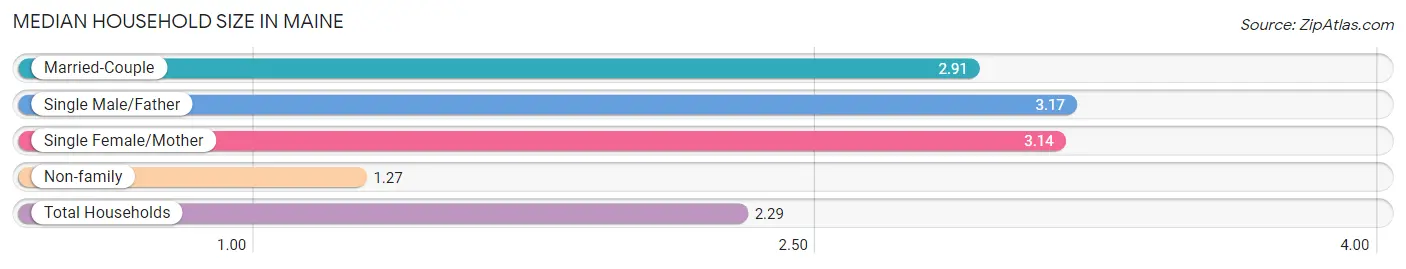
Median Household Size in Maine
The median household size in Maine is 2.29 persons per household, with single male/father households (22,930 | 4.0%) accounting for the largest median household size of 3.17 persons per household. non-family households (228,495 | 39.4%) represent the smallest median household size with 1.27 persons per household.
| Household Type | # Households | Household Size |
| Married-Couple | 277,978 (47.9%) | 2.91 |
| Single Male/Father | 22,930 (4.0%) | 3.17 |
| Single Female/Mother | 50,769 (8.7%) | 3.14 |
| Non-family | 228,495 (39.4%) | 1.27 |
| Total Households | 580,172 (100.0%) | 2.29 |
Household Size by Marriage Status in Maine
Out of a total of 580,172 households in Maine, 351,677 (60.6%) are family households, while 228,495 (39.4%) are nonfamily households. The most numerous type of family households are 2-person households, comprising 182,067, and the most common type of nonfamily households are 1-person households, comprising 178,884.
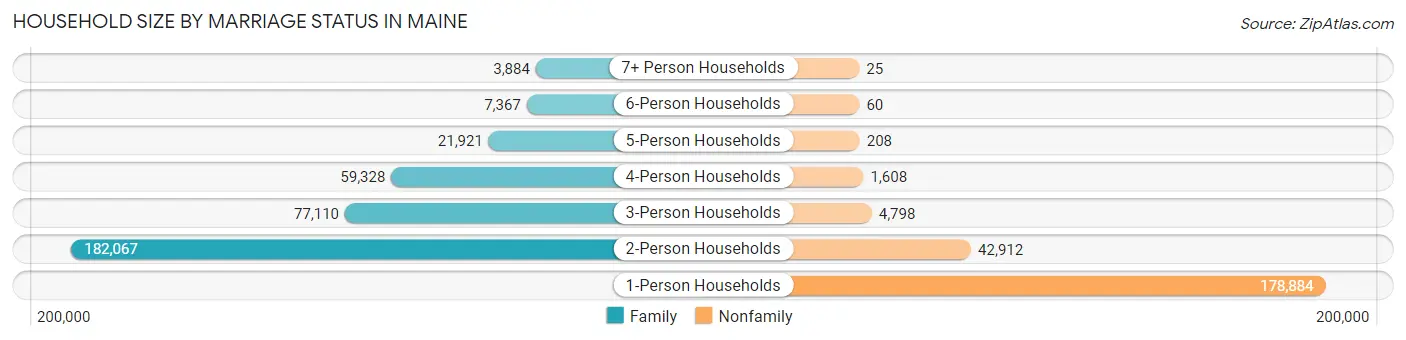
| Household Size | Family Households | Nonfamily Households |
| 1-Person Households | - | 178,884 (30.8%) |
| 2-Person Households | 182,067 (31.4%) | 42,912 (7.4%) |
| 3-Person Households | 77,110 (13.3%) | 4,798 (0.8%) |
| 4-Person Households | 59,328 (10.2%) | 1,608 (0.3%) |
| 5-Person Households | 21,921 (3.8%) | 208 (0.0%) |
| 6-Person Households | 7,367 (1.3%) | 60 (0.0%) |
| 7+ Person Households | 3,884 (0.7%) | 25 (0.0%) |
| Total | 351,677 (60.6%) | 228,495 (39.4%) |
Female Fertility in Maine
Fertility by Age in Maine
Average fertility rate in Maine is 50.0 births per 1,000 women. Women in the age bracket of 20 to 34 years have the highest fertility rate with 87.0 births per 1,000 women. Women in the age bracket of 20 to 34 years acount for 71.2% of all women with births.
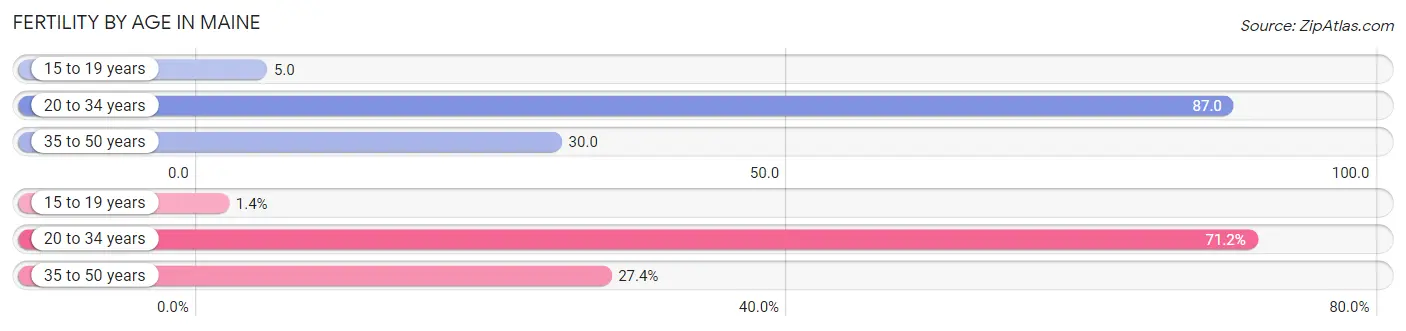
| Age Bracket | Women with Births | Births / 1,000 Women |
| 15 to 19 years | 205 (1.4%) | 5.0 |
| 20 to 34 years | 10,350 (71.2%) | 87.0 |
| 35 to 50 years | 3,976 (27.4%) | 30.0 |
| Total | 14,531 (100.0%) | 50.0 |
Fertility by Age by Marriage Status in Maine
70.0% of women with births (14,531) in Maine are married. The highest percentage of unmarried women with births falls into 15 to 19 years age bracket with 98.1% of them unmarried at the time of birth, while the lowest percentage of unmarried women with births belong to 35 to 50 years age bracket with 27.1% of them unmarried.
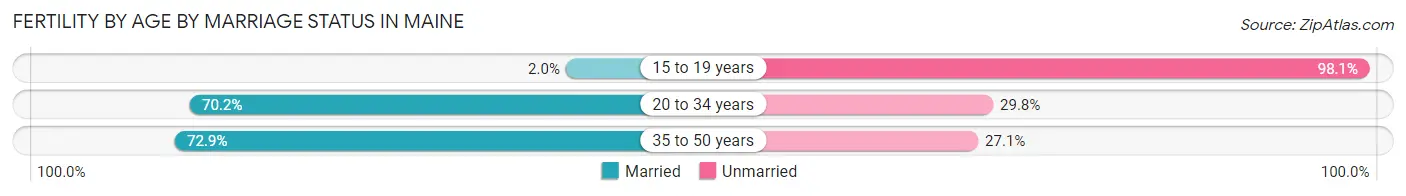
| Age Bracket | Married | Unmarried |
| 15 to 19 years | 4 (1.9%) | 201 (98.1%) |
| 20 to 34 years | 7,266 (70.2%) | 3,084 (29.8%) |
| 35 to 50 years | 2,899 (72.9%) | 1,077 (27.1%) |
| Total | 10,172 (70.0%) | 4,359 (30.0%) |
Fertility by Education in Maine
Average fertility rate in Maine is 50.0 births per 1,000 women. Women with the education attainment of graduate degree have the highest fertility rate of 74.0 births per 1,000 women, while women with the education attainment of less than high school have the lowest fertility at 28.0 births per 1,000 women. Women with the education attainment of college or associate's degree represent 32.0% of all women with births.
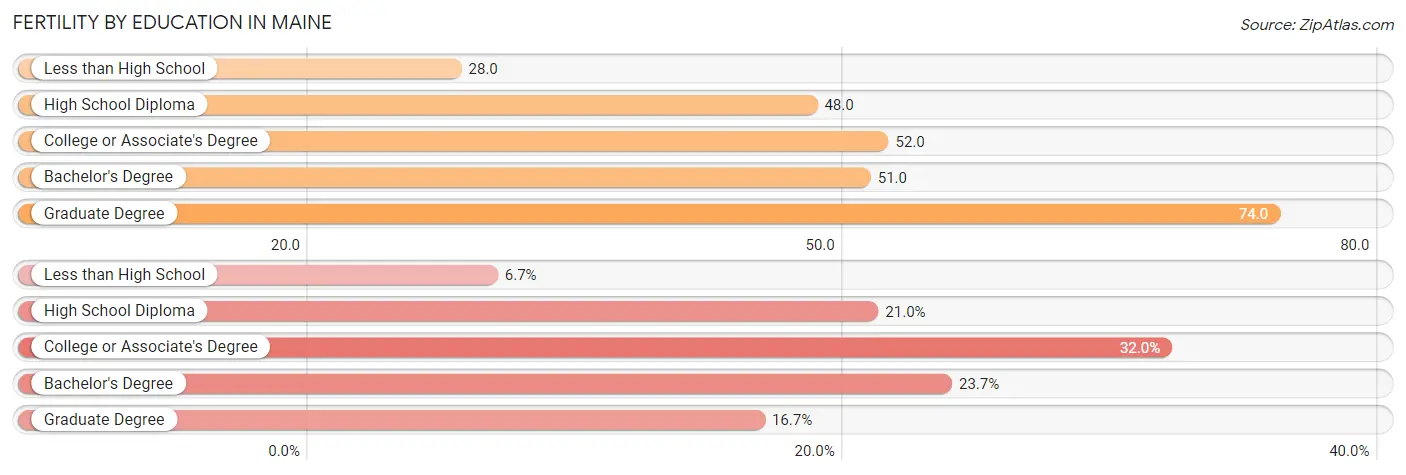
| Educational Attainment | Women with Births | Births / 1,000 Women |
| Less than High School | 972 (6.7%) | 28.0 |
| High School Diploma | 3,044 (20.9%) | 48.0 |
| College or Associate's Degree | 4,643 (32.0%) | 52.0 |
| Bachelor's Degree | 3,446 (23.7%) | 51.0 |
| Graduate Degree | 2,426 (16.7%) | 74.0 |
| Total | 14,531 (100.0%) | 50.0 |
Fertility by Education by Marriage Status in Maine
30.0% of women with births in Maine are unmarried. Women with the educational attainment of graduate degree are most likely to be married with 91.9% of them married at childbirth, while women with the educational attainment of less than high school are least likely to be married with 61.5% of them unmarried at childbirth.
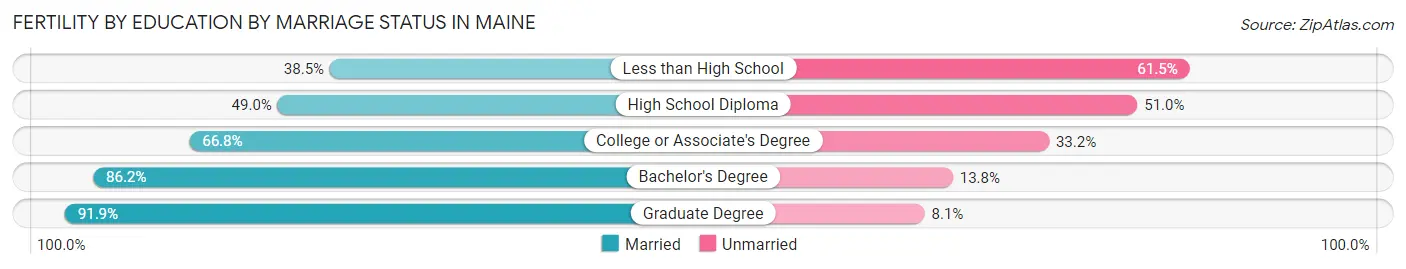
| Educational Attainment | Married | Unmarried |
| Less than High School | 374 (38.5%) | 598 (61.5%) |
| High School Diploma | 1,492 (49.0%) | 1,552 (51.0%) |
| College or Associate's Degree | 3,102 (66.8%) | 1,541 (33.2%) |
| Bachelor's Degree | 2,970 (86.2%) | 476 (13.8%) |
| Graduate Degree | 2,229 (91.9%) | 197 (8.1%) |
| Total | 10,172 (70.0%) | 4,359 (30.0%) |
Employment Characteristics in Maine
Employment by Class of Employer in Maine
Among the 670,170 employed individuals in Maine, private company employees (397,220 | 59.3%), not-for-profit organizations (92,963 | 13.9%), and self-employed (not incorporated) (54,069 | 8.1%) make up the most common classes of employment.
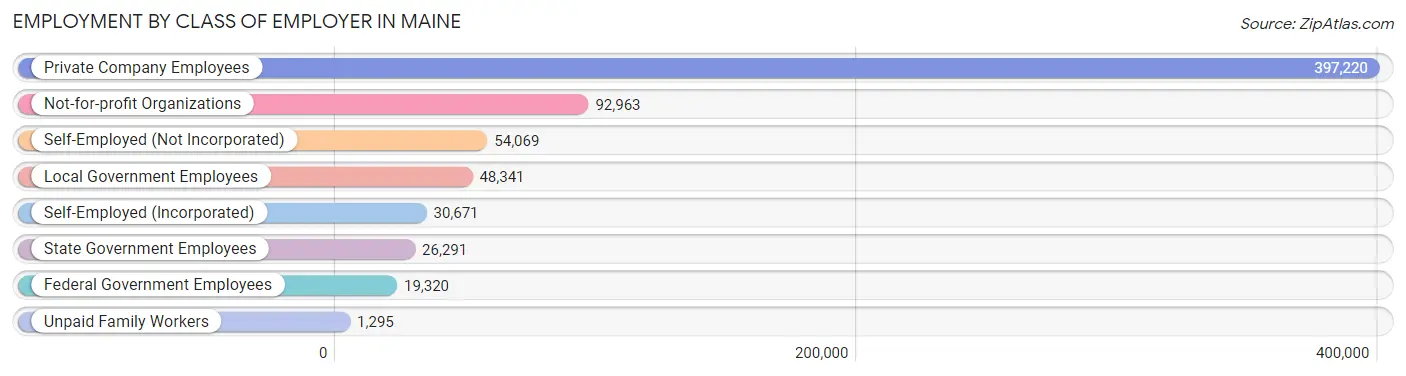
| Employer Class | # Employees | % Employees |
| Private Company Employees | 397,220 | 59.3% |
| Self-Employed (Incorporated) | 30,671 | 4.6% |
| Self-Employed (Not Incorporated) | 54,069 | 8.1% |
| Not-for-profit Organizations | 92,963 | 13.9% |
| Local Government Employees | 48,341 | 7.2% |
| State Government Employees | 26,291 | 3.9% |
| Federal Government Employees | 19,320 | 2.9% |
| Unpaid Family Workers | 1,295 | 0.2% |
| Total | 670,170 | 100.0% |
Employment Status by Age in Maine
According to the labor force statistics for Maine, out of the total population over 16 years of age (1,147,922), 62.2% or 714,007 individuals are in the labor force, with 4.0% or 28,560 of them unemployed. The age group with the highest labor force participation rate is 30 to 34 years, with 85.9% or 72,379 individuals in the labor force. Within the labor force, the 16 to 19 years age range has the highest percentage of unemployed individuals, with 12.4% or 4,129 of them being unemployed.
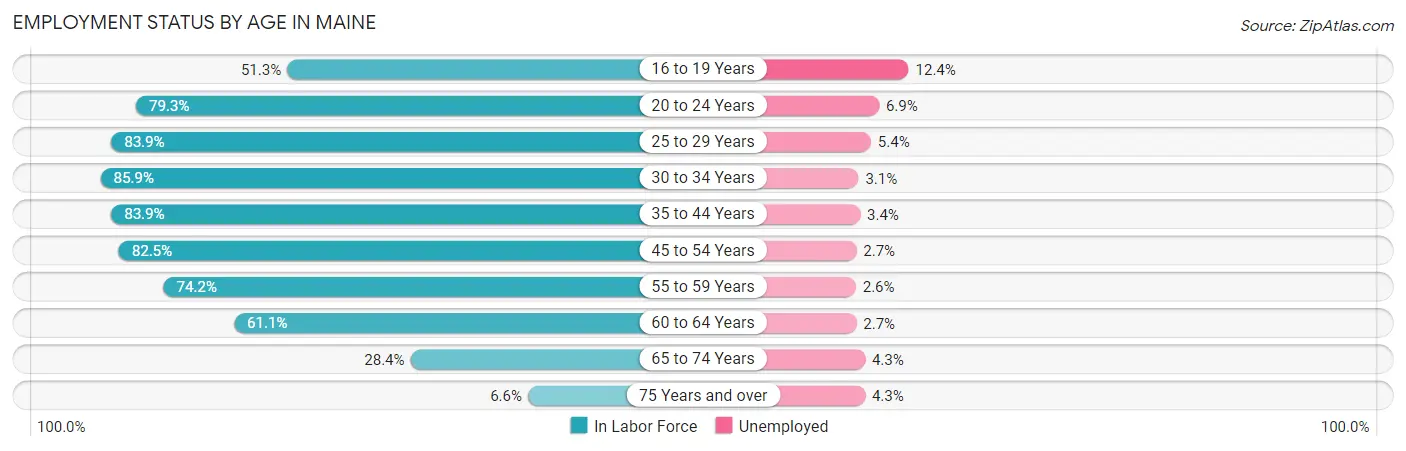
| Age Bracket | In Labor Force | Unemployed |
| 16 to 19 Years | 33,300 (51.3%) | 4,129 (12.4%) |
| 20 to 24 Years | 61,099 (79.3%) | 4,216 (6.9%) |
| 25 to 29 Years | 67,209 (83.9%) | 3,629 (5.4%) |
| 30 to 34 Years | 72,379 (85.9%) | 2,244 (3.1%) |
| 35 to 44 Years | 134,766 (83.9%) | 4,582 (3.4%) |
| 45 to 54 Years | 144,224 (82.5%) | 3,894 (2.7%) |
| 55 to 59 Years | 77,154 (74.2%) | 2,006 (2.6%) |
| 60 to 64 Years | 66,405 (61.1%) | 1,793 (2.7%) |
| 65 to 74 Years | 49,941 (28.4%) | 2,147 (4.3%) |
| 75 Years and over | 7,764 (6.6%) | 334 (4.3%) |
| Total | 714,007 (62.2%) | 28,560 (4.0%) |
Employment Status by Educational Attainment in Maine
According to labor force statistics for Maine, 78.9% of individuals (562,141) out of the total population between 25 and 64 years of age (712,473) are in the labor force, with 3.2% or 17,989 of them being unemployed. The group with the highest labor force participation rate are those with the educational attainment of bachelor's degree or higher, with 87.8% or 215,452 individuals in the labor force. Within the labor force, individuals with less than high school education have the highest percentage of unemployment, with 8.5% or 1,697 of them being unemployed.
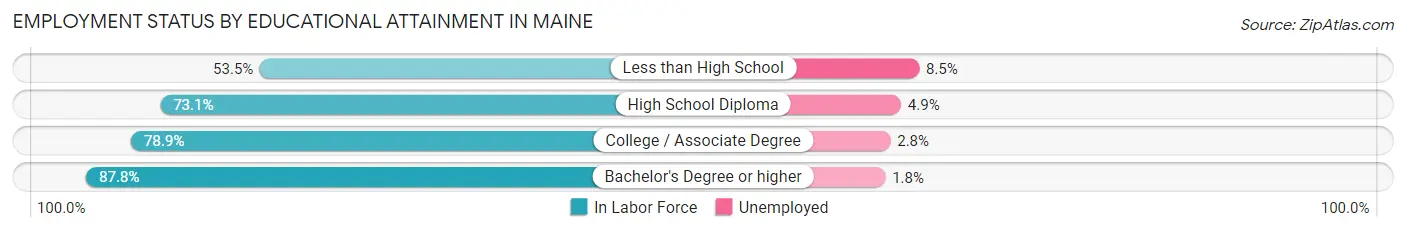
| Educational Attainment | In Labor Force | Unemployed |
| Less than High School | 19,966 (53.5%) | 3,172 (8.5%) |
| High School Diploma | 156,259 (73.1%) | 10,474 (4.9%) |
| College / Associate Degree | 170,426 (78.9%) | 6,048 (2.8%) |
| Bachelor's Degree or higher | 215,452 (87.8%) | 4,417 (1.8%) |
| Total | 562,141 (78.9%) | 22,799 (3.2%) |
Employment Occupations by Sex in Maine
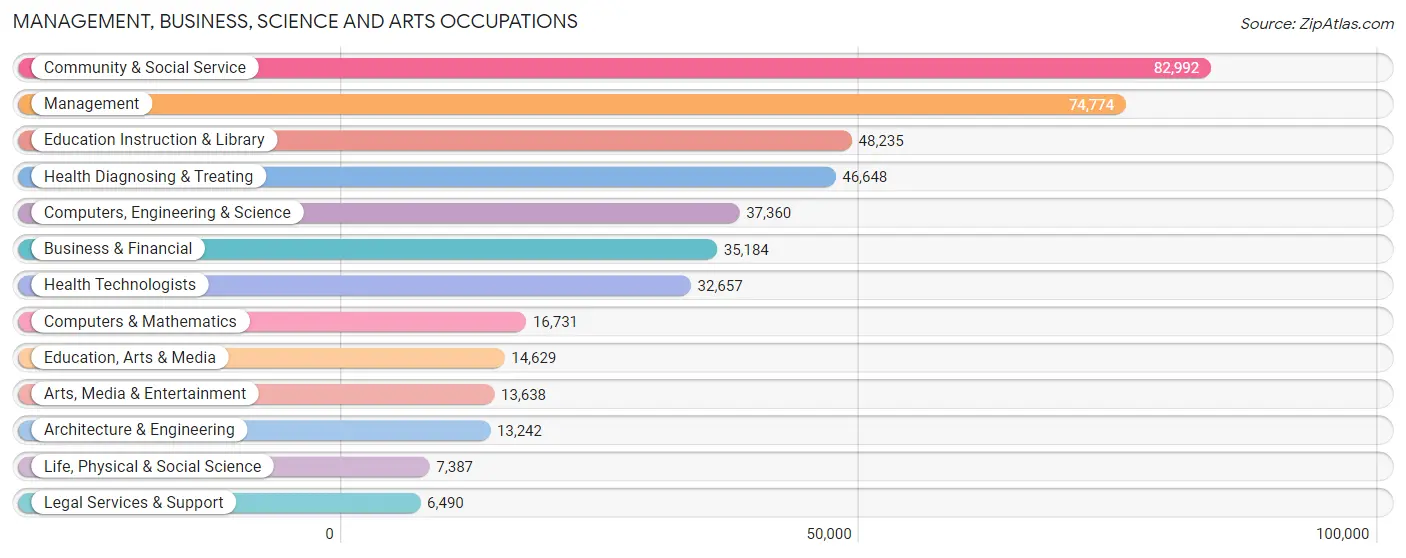
Management, Business, Science and Arts Occupations
The most common Management, Business, Science and Arts occupations in Maine are Community & Social Service (82,992 | 12.1%), Management (74,774 | 10.9%), Education Instruction & Library (48,235 | 7.1%), Health Diagnosing & Treating (46,648 | 6.8%), and Computers, Engineering & Science (37,360 | 5.5%).
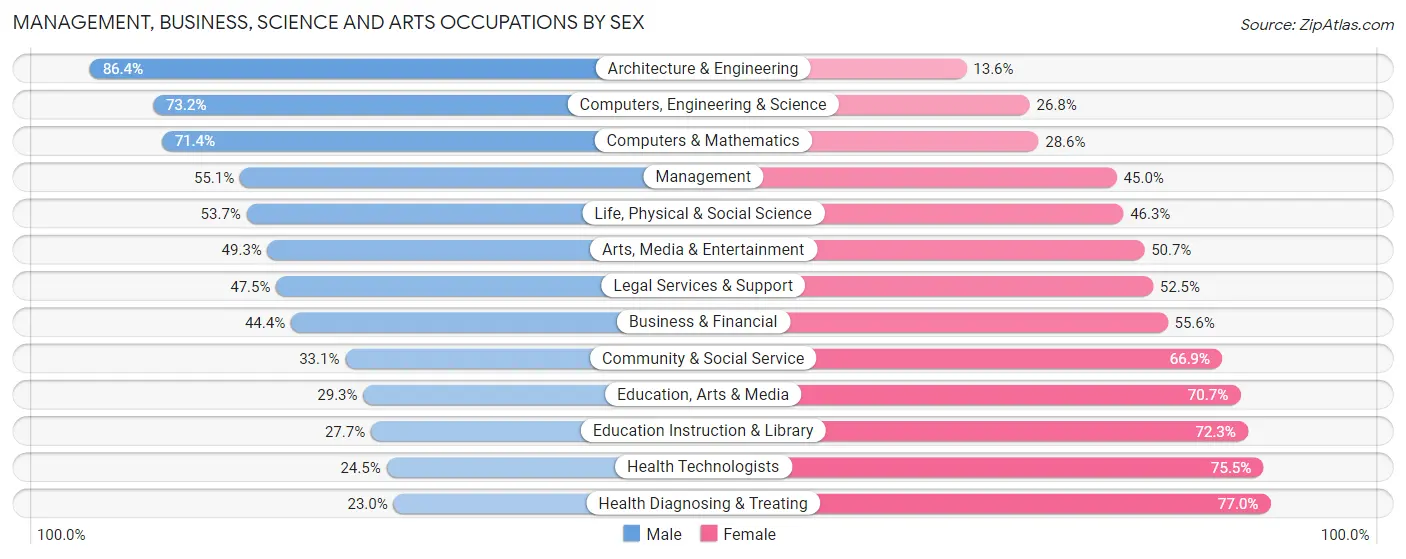
Management, Business, Science and Arts Occupations by Sex
Within the Management, Business, Science and Arts occupations in Maine, the most male-oriented occupations are Architecture & Engineering (86.4%), Computers, Engineering & Science (73.2%), and Computers & Mathematics (71.4%), while the most female-oriented occupations are Health Diagnosing & Treating (77.0%), Health Technologists (75.5%), and Education Instruction & Library (72.3%).
| Occupation | Male | Female |
| Management | 41,160 (55.0%) | 33,614 (45.0%) |
| Business & Financial | 15,632 (44.4%) | 19,552 (55.6%) |
| Computers, Engineering & Science | 27,351 (73.2%) | 10,009 (26.8%) |
| Computers & Mathematics | 11,945 (71.4%) | 4,786 (28.6%) |
| Architecture & Engineering | 11,441 (86.4%) | 1,801 (13.6%) |
| Life, Physical & Social Science | 3,965 (53.7%) | 3,422 (46.3%) |
| Community & Social Service | 27,475 (33.1%) | 55,517 (66.9%) |
| Education, Arts & Media | 4,291 (29.3%) | 10,338 (70.7%) |
| Legal Services & Support | 3,083 (47.5%) | 3,407 (52.5%) |
| Education Instruction & Library | 13,378 (27.7%) | 34,857 (72.3%) |
| Arts, Media & Entertainment | 6,723 (49.3%) | 6,915 (50.7%) |
| Health Diagnosing & Treating | 10,746 (23.0%) | 35,902 (77.0%) |
| Health Technologists | 8,003 (24.5%) | 24,654 (75.5%) |
| Total (Category) | 122,364 (44.2%) | 154,594 (55.8%) |
| Total (Overall) | 351,116 (51.4%) | 332,254 (48.6%) |
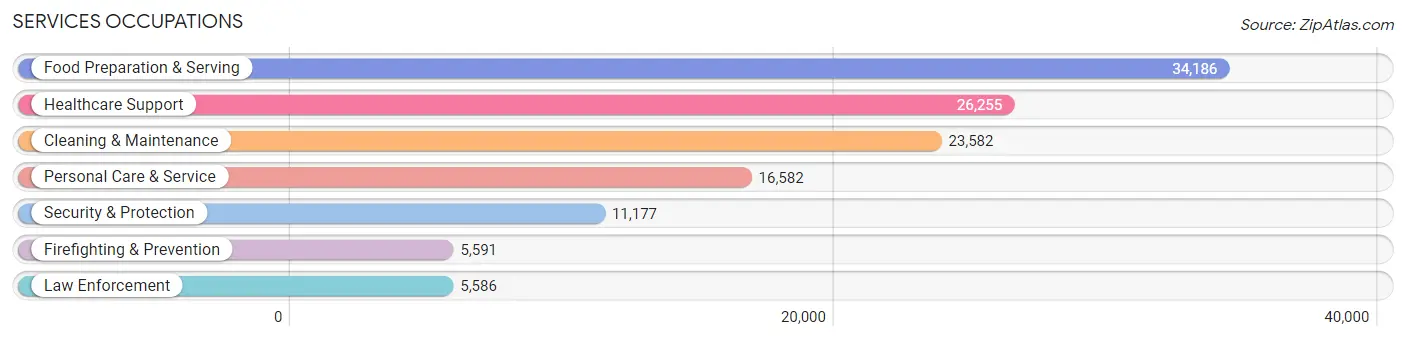
Services Occupations
The most common Services occupations in Maine are Food Preparation & Serving (34,186 | 5.0%), Healthcare Support (26,255 | 3.8%), Cleaning & Maintenance (23,582 | 3.5%), Personal Care & Service (16,582 | 2.4%), and Security & Protection (11,177 | 1.6%).
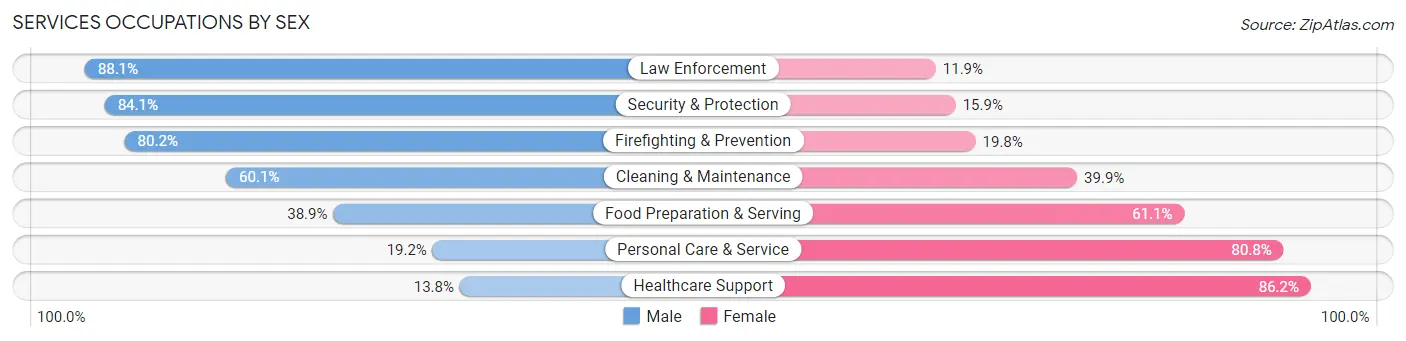
Services Occupations by Sex
Within the Services occupations in Maine, the most male-oriented occupations are Law Enforcement (88.1%), Security & Protection (84.1%), and Firefighting & Prevention (80.2%), while the most female-oriented occupations are Healthcare Support (86.2%), Personal Care & Service (80.8%), and Food Preparation & Serving (61.1%).
| Occupation | Male | Female |
| Healthcare Support | 3,628 (13.8%) | 22,627 (86.2%) |
| Security & Protection | 9,402 (84.1%) | 1,775 (15.9%) |
| Firefighting & Prevention | 4,483 (80.2%) | 1,108 (19.8%) |
| Law Enforcement | 4,919 (88.1%) | 667 (11.9%) |
| Food Preparation & Serving | 13,289 (38.9%) | 20,897 (61.1%) |
| Cleaning & Maintenance | 14,167 (60.1%) | 9,415 (39.9%) |
| Personal Care & Service | 3,182 (19.2%) | 13,400 (80.8%) |
| Total (Category) | 43,668 (39.1%) | 68,114 (60.9%) |
| Total (Overall) | 351,116 (51.4%) | 332,254 (48.6%) |
Sales and Office Occupations
The most common Sales and Office occupations in Maine are Office & Administration (74,683 | 10.9%), and Sales & Related (64,753 | 9.5%).

Sales and Office Occupations by Sex
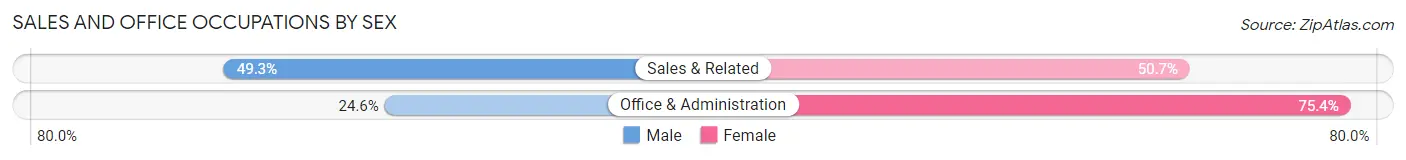
| Occupation | Male | Female |
| Sales & Related | 31,946 (49.3%) | 32,807 (50.7%) |
| Office & Administration | 18,376 (24.6%) | 56,307 (75.4%) |
| Total (Category) | 50,322 (36.1%) | 89,114 (63.9%) |
| Total (Overall) | 351,116 (51.4%) | 332,254 (48.6%) |
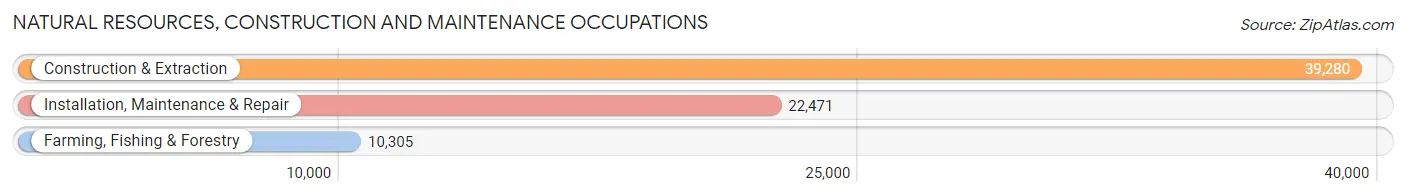
Natural Resources, Construction and Maintenance Occupations
The most common Natural Resources, Construction and Maintenance occupations in Maine are Construction & Extraction (39,280 | 5.8%), Installation, Maintenance & Repair (22,471 | 3.3%), and Farming, Fishing & Forestry (10,305 | 1.5%).
Natural Resources, Construction and Maintenance Occupations by Sex
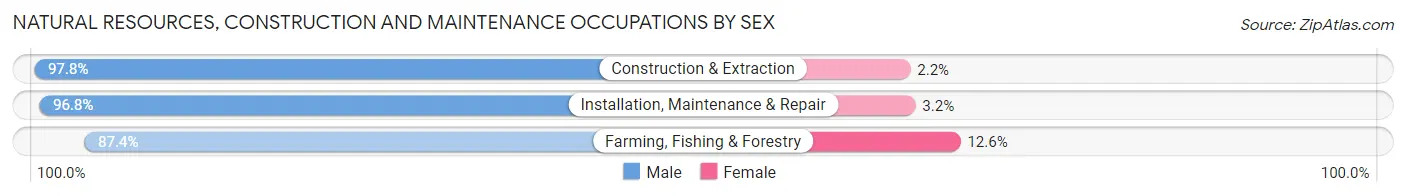
| Occupation | Male | Female |
| Farming, Fishing & Forestry | 9,007 (87.4%) | 1,298 (12.6%) |
| Construction & Extraction | 38,427 (97.8%) | 853 (2.2%) |
| Installation, Maintenance & Repair | 21,747 (96.8%) | 724 (3.2%) |
| Total (Category) | 69,181 (96.0%) | 2,875 (4.0%) |
| Total (Overall) | 351,116 (51.4%) | 332,254 (48.6%) |
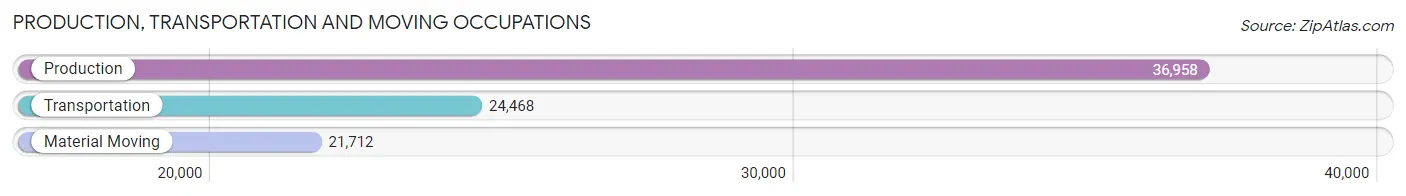
Production, Transportation and Moving Occupations
The most common Production, Transportation and Moving occupations in Maine are Production (36,958 | 5.4%), Transportation (24,468 | 3.6%), and Material Moving (21,712 | 3.2%).
Production, Transportation and Moving Occupations by Sex
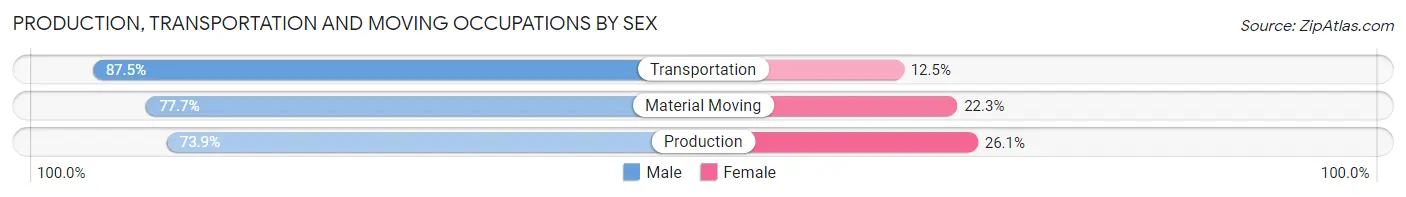
| Occupation | Male | Female |
| Production | 27,312 (73.9%) | 9,646 (26.1%) |
| Transportation | 21,406 (87.5%) | 3,062 (12.5%) |
| Material Moving | 16,863 (77.7%) | 4,849 (22.3%) |
| Total (Category) | 65,581 (78.9%) | 17,557 (21.1%) |
| Total (Overall) | 351,116 (51.4%) | 332,254 (48.6%) |
Employment Industries by Sex in Maine
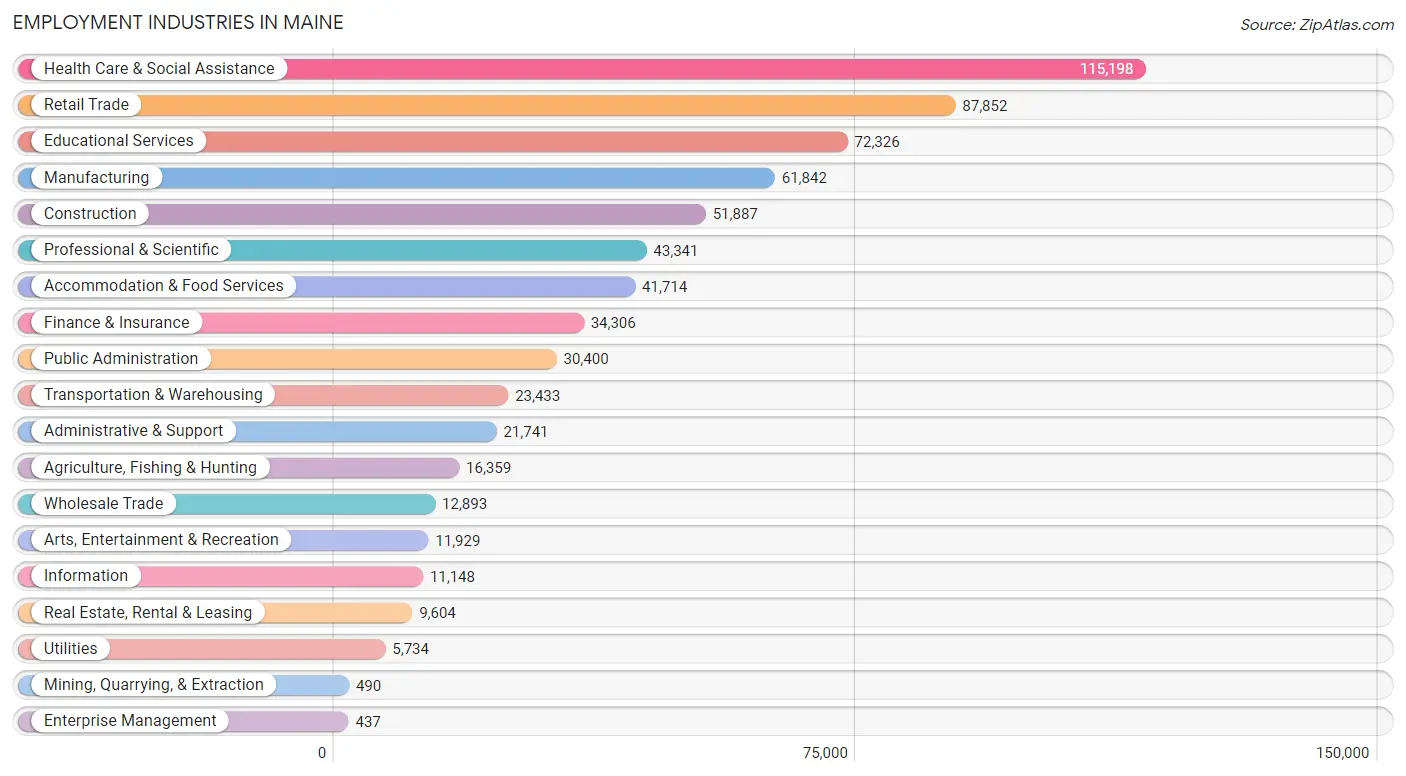
Employment Industries in Maine
The major employment industries in Maine include Health Care & Social Assistance (115,198 | 16.9%), Retail Trade (87,852 | 12.9%), Educational Services (72,326 | 10.6%), Manufacturing (61,842 | 9.0%), and Construction (51,887 | 7.6%).
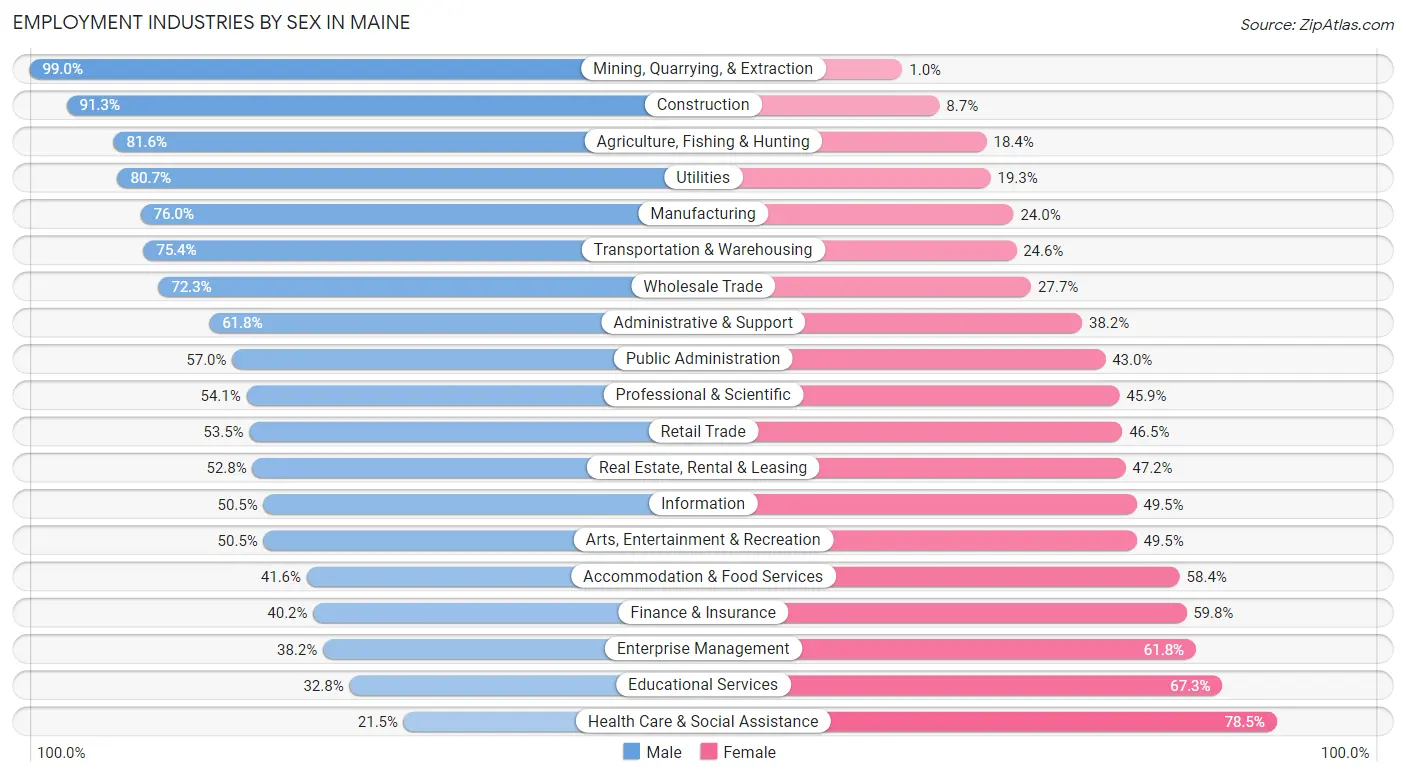
Employment Industries by Sex in Maine
The Maine industries that see more men than women are Mining, Quarrying, & Extraction (99.0%), Construction (91.3%), and Agriculture, Fishing & Hunting (81.6%), whereas the industries that tend to have a higher number of women are Health Care & Social Assistance (78.5%), Educational Services (67.2%), and Enterprise Management (61.8%).
| Industry | Male | Female |
| Agriculture, Fishing & Hunting | 13,343 (81.6%) | 3,016 (18.4%) |
| Mining, Quarrying, & Extraction | 485 (99.0%) | 5 (1.0%) |
| Construction | 47,378 (91.3%) | 4,509 (8.7%) |
| Manufacturing | 46,985 (76.0%) | 14,857 (24.0%) |
| Wholesale Trade | 9,324 (72.3%) | 3,569 (27.7%) |
| Retail Trade | 46,975 (53.5%) | 40,877 (46.5%) |
| Transportation & Warehousing | 17,673 (75.4%) | 5,760 (24.6%) |
| Utilities | 4,629 (80.7%) | 1,105 (19.3%) |
| Information | 5,634 (50.5%) | 5,514 (49.5%) |
| Finance & Insurance | 13,802 (40.2%) | 20,504 (59.8%) |
| Real Estate, Rental & Leasing | 5,073 (52.8%) | 4,531 (47.2%) |
| Professional & Scientific | 23,432 (54.1%) | 19,909 (45.9%) |
| Enterprise Management | 167 (38.2%) | 270 (61.8%) |
| Administrative & Support | 13,432 (61.8%) | 8,309 (38.2%) |
| Educational Services | 23,688 (32.8%) | 48,638 (67.2%) |
| Health Care & Social Assistance | 24,765 (21.5%) | 90,433 (78.5%) |
| Arts, Entertainment & Recreation | 6,026 (50.5%) | 5,903 (49.5%) |
| Accommodation & Food Services | 17,345 (41.6%) | 24,369 (58.4%) |
| Public Administration | 17,326 (57.0%) | 13,074 (43.0%) |
| Total | 351,116 (51.4%) | 332,254 (48.6%) |
Education in Maine
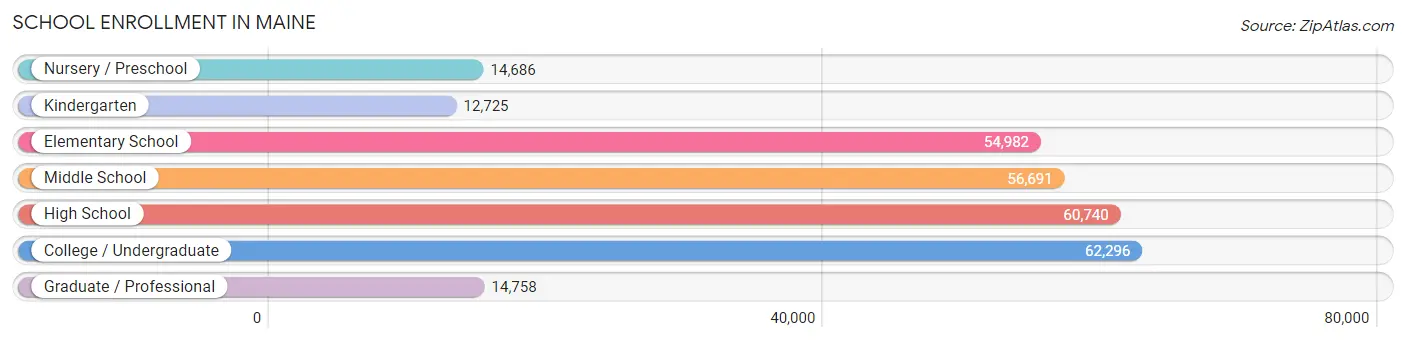
School Enrollment in Maine
The most common levels of schooling among the 276,878 students in Maine are college / undergraduate (62,296 | 22.5%), high school (60,740 | 21.9%), and middle school (56,691 | 20.5%).
| School Level | # Students | % Students |
| Nursery / Preschool | 14,686 | 5.3% |
| Kindergarten | 12,725 | 4.6% |
| Elementary School | 54,982 | 19.9% |
| Middle School | 56,691 | 20.5% |
| High School | 60,740 | 21.9% |
| College / Undergraduate | 62,296 | 22.5% |
| Graduate / Professional | 14,758 | 5.3% |
| Total | 276,878 | 100.0% |
School Enrollment by Age by Funding Source in Maine
Out of a total of 276,878 students who are enrolled in schools in Maine, 54,545 (19.7%) attend a private institution, while the remaining 222,333 (80.3%) are enrolled in public schools. The age group of 3 to 4 year olds has the highest likelihood of being enrolled in private schools, with 4,753 (45.1% in the age bracket) enrolled. Conversely, the age group of 10 to 14 year olds has the lowest likelihood of being enrolled in a private school, with 62,551 (88.6% in the age bracket) attending a public institution.
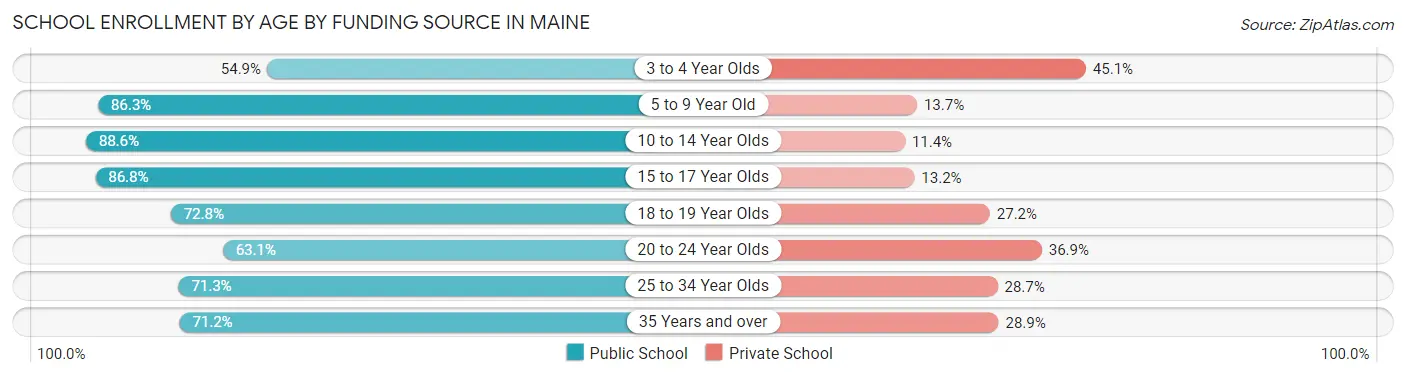
| Age Bracket | Public School | Private School |
| 3 to 4 Year Olds | 5,780 (54.9%) | 4,753 (45.1%) |
| 5 to 9 Year Old | 56,253 (86.3%) | 8,898 (13.7%) |
| 10 to 14 Year Olds | 62,551 (88.6%) | 8,060 (11.4%) |
| 15 to 17 Year Olds | 38,245 (86.8%) | 5,807 (13.2%) |
| 18 to 19 Year Olds | 17,790 (72.8%) | 6,658 (27.2%) |
| 20 to 24 Year Olds | 18,533 (63.1%) | 10,838 (36.9%) |
| 25 to 34 Year Olds | 11,801 (71.3%) | 4,740 (28.7%) |
| 35 Years and over | 11,505 (71.2%) | 4,666 (28.8%) |
| Total | 222,333 (80.3%) | 54,545 (19.7%) |
Educational Attainment by Field of Study in Maine
Business (51,104 | 13.6%), education (48,182 | 12.8%), science & technology (41,102 | 10.9%), social sciences (33,912 | 9.0%), and bio, nature & agricultural (30,113 | 8.0%) are the most common fields of study among 376,338 individuals in Maine who have obtained a bachelor's degree or higher.
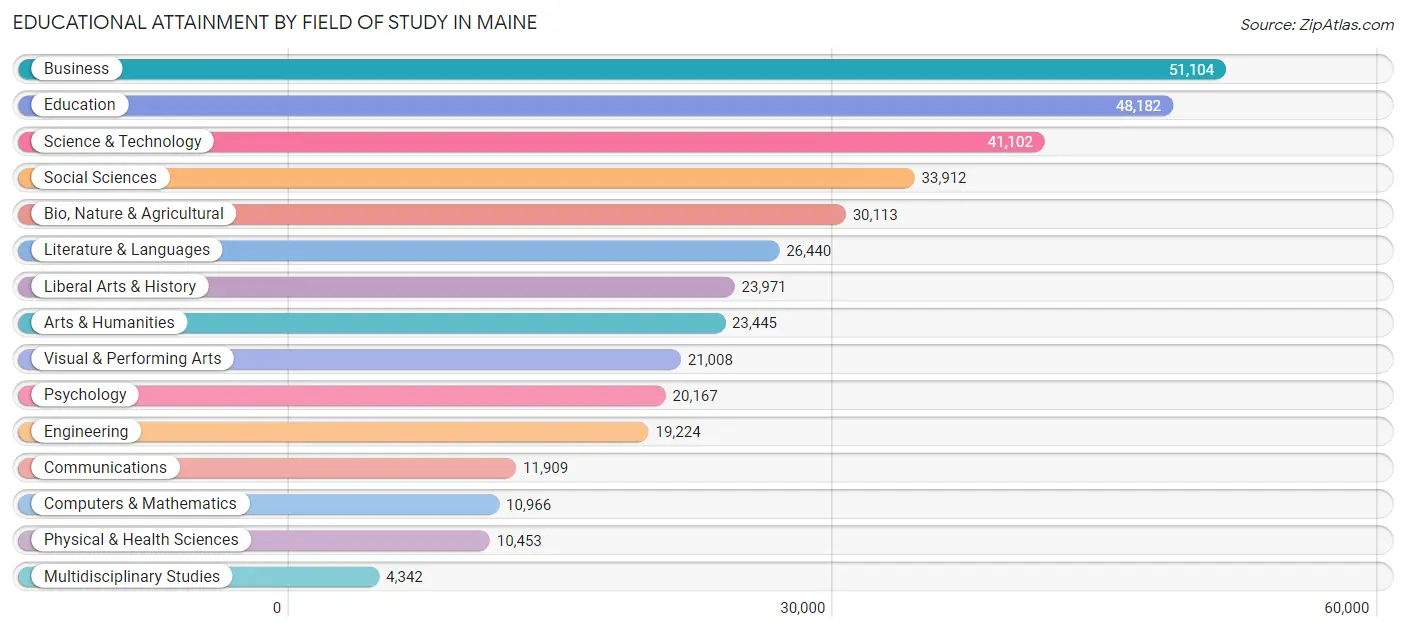
| Field of Study | # Graduates | % Graduates |
| Computers & Mathematics | 10,966 | 2.9% |
| Bio, Nature & Agricultural | 30,113 | 8.0% |
| Physical & Health Sciences | 10,453 | 2.8% |
| Psychology | 20,167 | 5.4% |
| Social Sciences | 33,912 | 9.0% |
| Engineering | 19,224 | 5.1% |
| Multidisciplinary Studies | 4,342 | 1.1% |
| Science & Technology | 41,102 | 10.9% |
| Business | 51,104 | 13.6% |
| Education | 48,182 | 12.8% |
| Literature & Languages | 26,440 | 7.0% |
| Liberal Arts & History | 23,971 | 6.4% |
| Visual & Performing Arts | 21,008 | 5.6% |
| Communications | 11,909 | 3.2% |
| Arts & Humanities | 23,445 | 6.2% |
| Total | 376,338 | 100.0% |
Transportation & Commute in Maine
Vehicle Availability by Sex in Maine
The most prevalent vehicle ownership categories in Maine are males with 2 vehicles (158,651, accounting for 46.4%) and females with 2 vehicles (141,606, making up 49.6%).
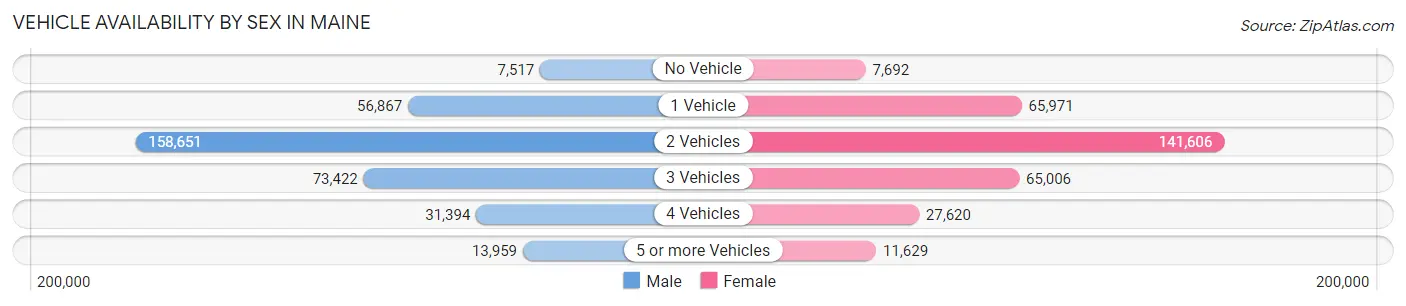
| Vehicles Available | Male | Female |
| No Vehicle | 7,517 (2.2%) | 7,692 (2.4%) |
| 1 Vehicle | 56,867 (16.6%) | 65,971 (20.6%) |
| 2 Vehicles | 158,651 (46.4%) | 141,606 (44.3%) |
| 3 Vehicles | 73,422 (21.5%) | 65,006 (20.3%) |
| 4 Vehicles | 31,394 (9.2%) | 27,620 (8.6%) |
| 5 or more Vehicles | 13,959 (4.1%) | 11,629 (3.6%) |
| Total | 341,810 (100.0%) | 319,524 (100.0%) |
Commute Time in Maine
The most frequently occuring commute durations in Maine are 10 to 14 minutes (88,810 commuters, 15.1%), 15 to 19 minutes (87,500 commuters, 14.9%), and 20 to 24 minutes (77,312 commuters, 13.2%).
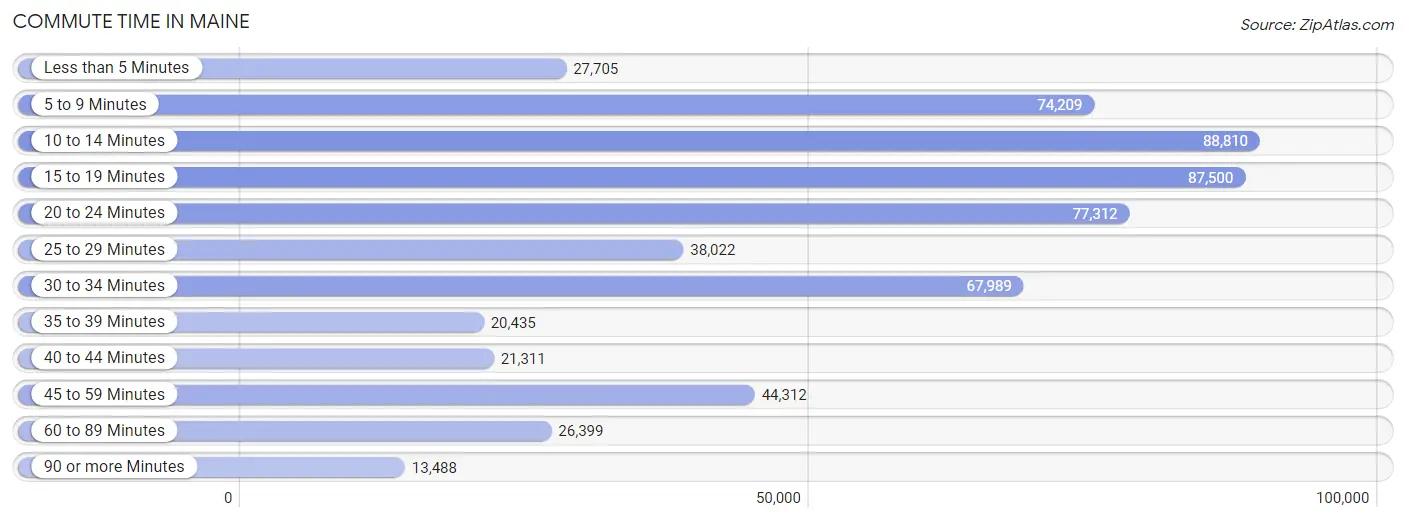
| Commute Time | # Commuters | % Commuters |
| Less than 5 Minutes | 27,705 | 4.7% |
| 5 to 9 Minutes | 74,209 | 12.6% |
| 10 to 14 Minutes | 88,810 | 15.1% |
| 15 to 19 Minutes | 87,500 | 14.9% |
| 20 to 24 Minutes | 77,312 | 13.2% |
| 25 to 29 Minutes | 38,022 | 6.5% |
| 30 to 34 Minutes | 67,989 | 11.6% |
| 35 to 39 Minutes | 20,435 | 3.5% |
| 40 to 44 Minutes | 21,311 | 3.6% |
| 45 to 59 Minutes | 44,312 | 7.5% |
| 60 to 89 Minutes | 26,399 | 4.5% |
| 90 or more Minutes | 13,488 | 2.3% |
Commute Time by Sex in Maine
The most common commute times in Maine are 15 to 19 minutes (44,018 commuters, 14.4%) for males and 10 to 14 minutes (45,517 commuters, 16.2%) for females.
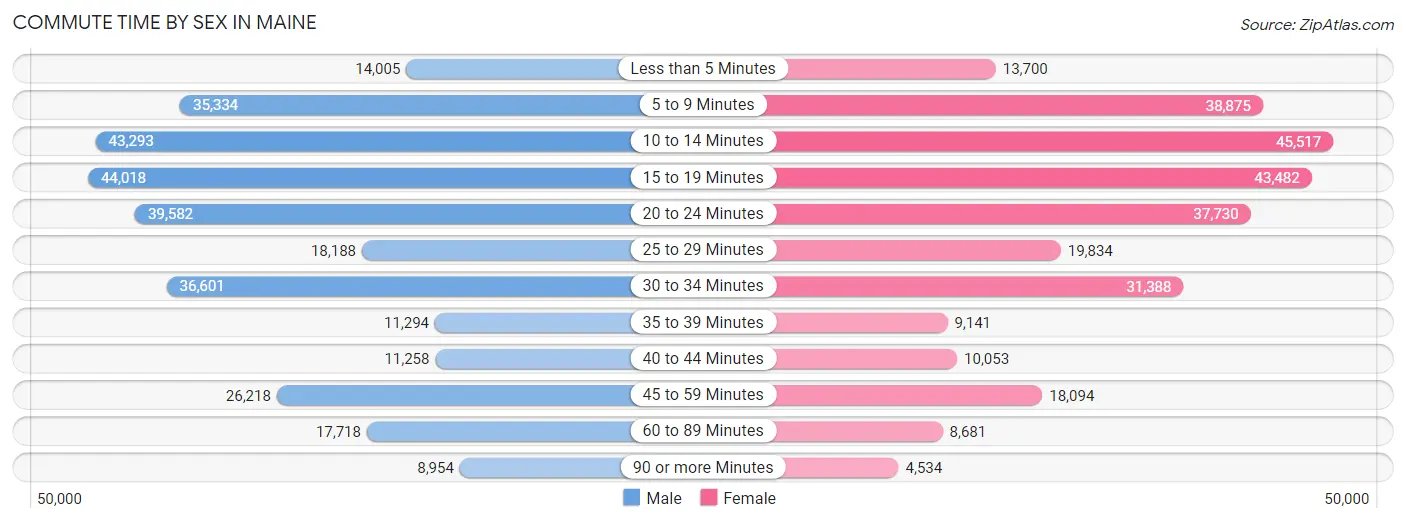
| Commute Time | Male | Female |
| Less than 5 Minutes | 14,005 (4.6%) | 13,700 (4.9%) |
| 5 to 9 Minutes | 35,334 (11.5%) | 38,875 (13.8%) |
| 10 to 14 Minutes | 43,293 (14.1%) | 45,517 (16.2%) |
| 15 to 19 Minutes | 44,018 (14.4%) | 43,482 (15.5%) |
| 20 to 24 Minutes | 39,582 (12.9%) | 37,730 (13.4%) |
| 25 to 29 Minutes | 18,188 (5.9%) | 19,834 (7.1%) |
| 30 to 34 Minutes | 36,601 (11.9%) | 31,388 (11.2%) |
| 35 to 39 Minutes | 11,294 (3.7%) | 9,141 (3.3%) |
| 40 to 44 Minutes | 11,258 (3.7%) | 10,053 (3.6%) |
| 45 to 59 Minutes | 26,218 (8.6%) | 18,094 (6.4%) |
| 60 to 89 Minutes | 17,718 (5.8%) | 8,681 (3.1%) |
| 90 or more Minutes | 8,954 (2.9%) | 4,534 (1.6%) |
Time of Departure to Work by Sex in Maine
The most frequent times of departure to work in Maine are 7:00 AM to 7:29 AM (44,444, 14.5%) for males and 7:00 AM to 7:29 AM (48,232, 17.2%) for females.
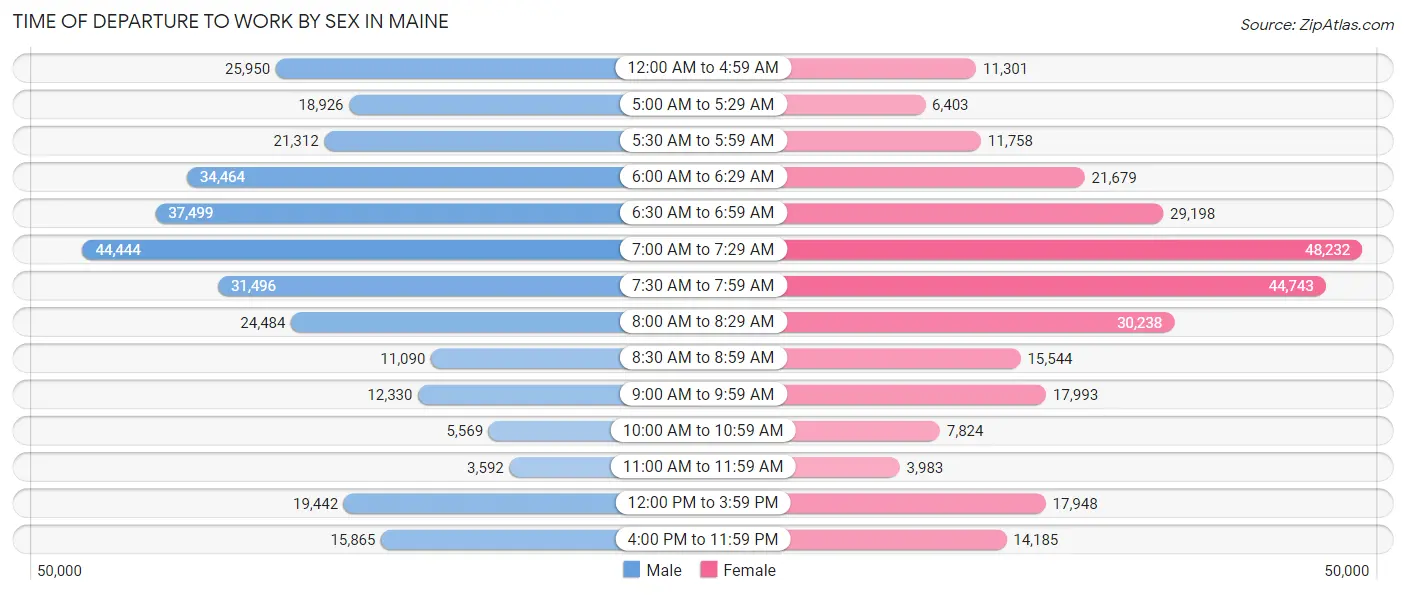
| Time of Departure | Male | Female |
| 12:00 AM to 4:59 AM | 25,950 (8.5%) | 11,301 (4.0%) |
| 5:00 AM to 5:29 AM | 18,926 (6.2%) | 6,403 (2.3%) |
| 5:30 AM to 5:59 AM | 21,312 (7.0%) | 11,758 (4.2%) |
| 6:00 AM to 6:29 AM | 34,464 (11.3%) | 21,679 (7.7%) |
| 6:30 AM to 6:59 AM | 37,499 (12.2%) | 29,198 (10.4%) |
| 7:00 AM to 7:29 AM | 44,444 (14.5%) | 48,232 (17.2%) |
| 7:30 AM to 7:59 AM | 31,496 (10.3%) | 44,743 (15.9%) |
| 8:00 AM to 8:29 AM | 24,484 (8.0%) | 30,238 (10.8%) |
| 8:30 AM to 8:59 AM | 11,090 (3.6%) | 15,544 (5.5%) |
| 9:00 AM to 9:59 AM | 12,330 (4.0%) | 17,993 (6.4%) |
| 10:00 AM to 10:59 AM | 5,569 (1.8%) | 7,824 (2.8%) |
| 11:00 AM to 11:59 AM | 3,592 (1.2%) | 3,983 (1.4%) |
| 12:00 PM to 3:59 PM | 19,442 (6.3%) | 17,948 (6.4%) |
| 4:00 PM to 11:59 PM | 15,865 (5.2%) | 14,185 (5.1%) |
| Total | 306,463 (100.0%) | 281,029 (100.0%) |
Housing Occupancy in Maine
Occupancy by Ownership in Maine
Of the total 580,172 dwellings in Maine, owner-occupied units account for 426,239 (73.5%), while renter-occupied units make up 153,933 (26.5%).
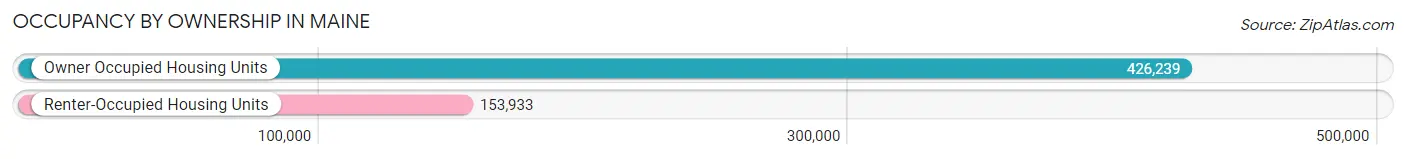
| Occupancy | # Housing Units | % Housing Units |
| Owner Occupied Housing Units | 426,239 | 73.5% |
| Renter-Occupied Housing Units | 153,933 | 26.5% |
| Total Occupied Housing Units | 580,172 | 100.0% |
Occupancy by Household Size in Maine
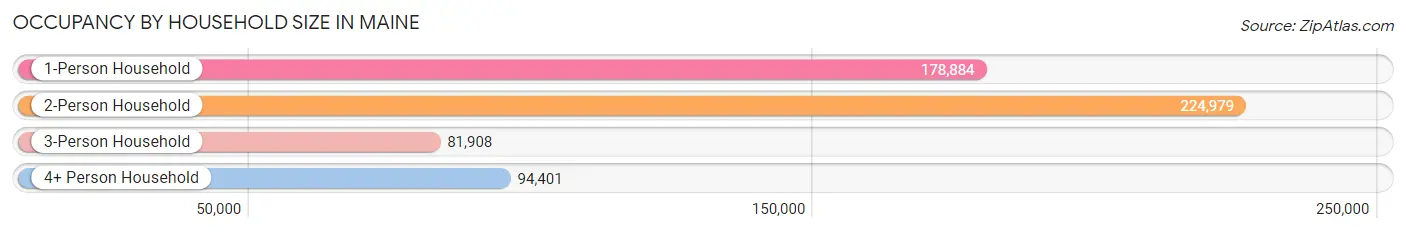
| Household Size | # Housing Units | % Housing Units |
| 1-Person Household | 178,884 | 30.8% |
| 2-Person Household | 224,979 | 38.8% |
| 3-Person Household | 81,908 | 14.1% |
| 4+ Person Household | 94,401 | 16.3% |
| Total Housing Units | 580,172 | 100.0% |
Occupancy by Ownership by Household Size in Maine
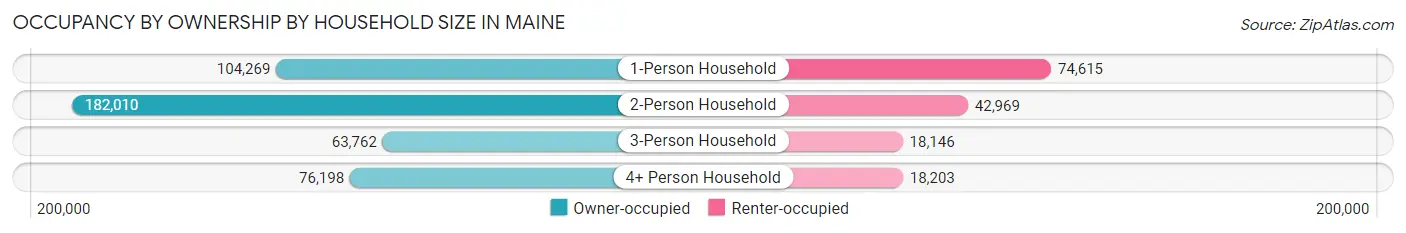
| Household Size | Owner-occupied | Renter-occupied |
| 1-Person Household | 104,269 (58.3%) | 74,615 (41.7%) |
| 2-Person Household | 182,010 (80.9%) | 42,969 (19.1%) |
| 3-Person Household | 63,762 (77.8%) | 18,146 (22.2%) |
| 4+ Person Household | 76,198 (80.7%) | 18,203 (19.3%) |
| Total Housing Units | 426,239 (73.5%) | 153,933 (26.5%) |
Occupancy by Educational Attainment in Maine
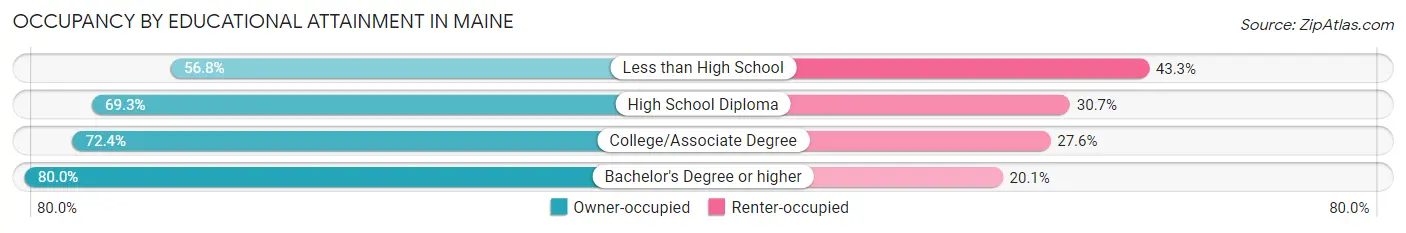
| Household Size | Owner-occupied | Renter-occupied |
| Less than High School | 16,580 (56.8%) | 12,637 (43.2%) |
| High School Diploma | 113,604 (69.3%) | 50,378 (30.7%) |
| College/Associate Degree | 127,276 (72.4%) | 48,579 (27.6%) |
| Bachelor's Degree or higher | 168,779 (79.9%) | 42,339 (20.1%) |
Occupancy by Age of Householder in Maine
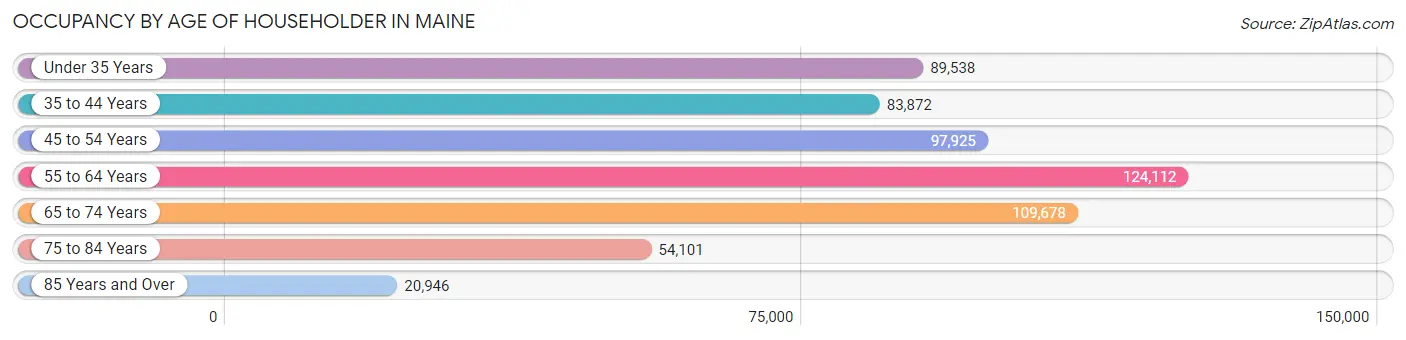
| Age Bracket | # Households | % Households |
| Under 35 Years | 89,538 | 15.4% |
| 35 to 44 Years | 83,872 | 14.5% |
| 45 to 54 Years | 97,925 | 16.9% |
| 55 to 64 Years | 124,112 | 21.4% |
| 65 to 74 Years | 109,678 | 18.9% |
| 75 to 84 Years | 54,101 | 9.3% |
| 85 Years and Over | 20,946 | 3.6% |
| Total | 580,172 | 100.0% |
Housing Finances in Maine
Median Income by Occupancy in Maine
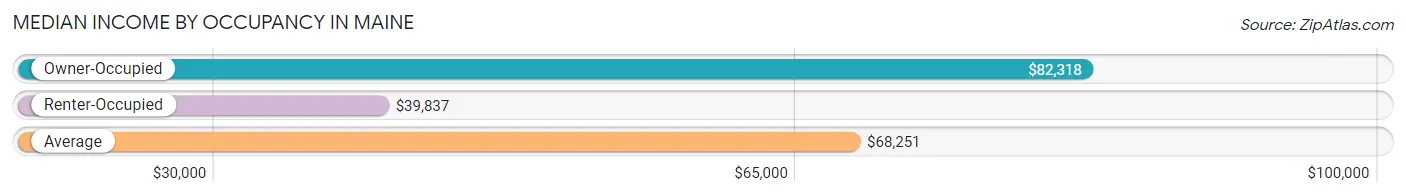
| Occupancy Type | # Households | Median Income |
| Owner-Occupied | 426,239 (73.5%) | $82,318 |
| Renter-Occupied | 153,933 (26.5%) | $39,837 |
| Average | 580,172 (100.0%) | $68,251 |
Occupancy by Householder Income Bracket in Maine
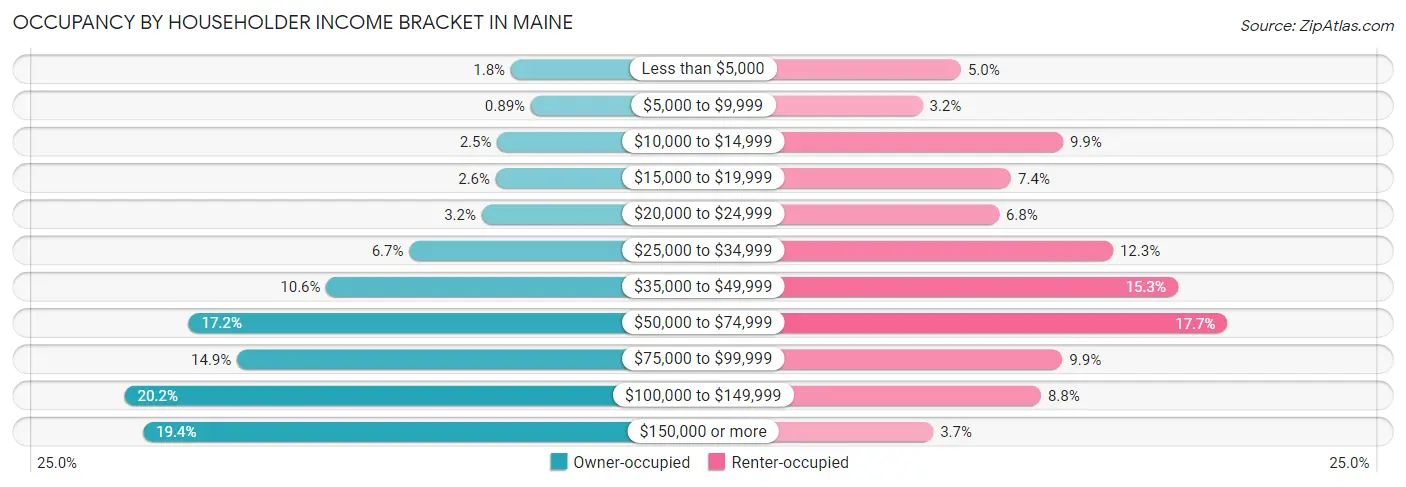
| Income Bracket | Owner-occupied | Renter-occupied |
| Less than $5,000 | 7,860 (1.8%) | 7,730 (5.0%) |
| $5,000 to $9,999 | 3,802 (0.9%) | 4,903 (3.2%) |
| $10,000 to $14,999 | 10,632 (2.5%) | 15,212 (9.9%) |
| $15,000 to $19,999 | 10,908 (2.6%) | 11,405 (7.4%) |
| $20,000 to $24,999 | 13,766 (3.2%) | 10,515 (6.8%) |
| $25,000 to $34,999 | 28,455 (6.7%) | 18,865 (12.3%) |
| $35,000 to $49,999 | 45,326 (10.6%) | 23,613 (15.3%) |
| $50,000 to $74,999 | 73,271 (17.2%) | 27,247 (17.7%) |
| $75,000 to $99,999 | 63,413 (14.9%) | 15,162 (9.9%) |
| $100,000 to $149,999 | 86,278 (20.2%) | 13,593 (8.8%) |
| $150,000 or more | 82,528 (19.4%) | 5,688 (3.7%) |
| Total | 426,239 (100.0%) | 153,933 (100.0%) |
Monthly Housing Cost Tiers in Maine
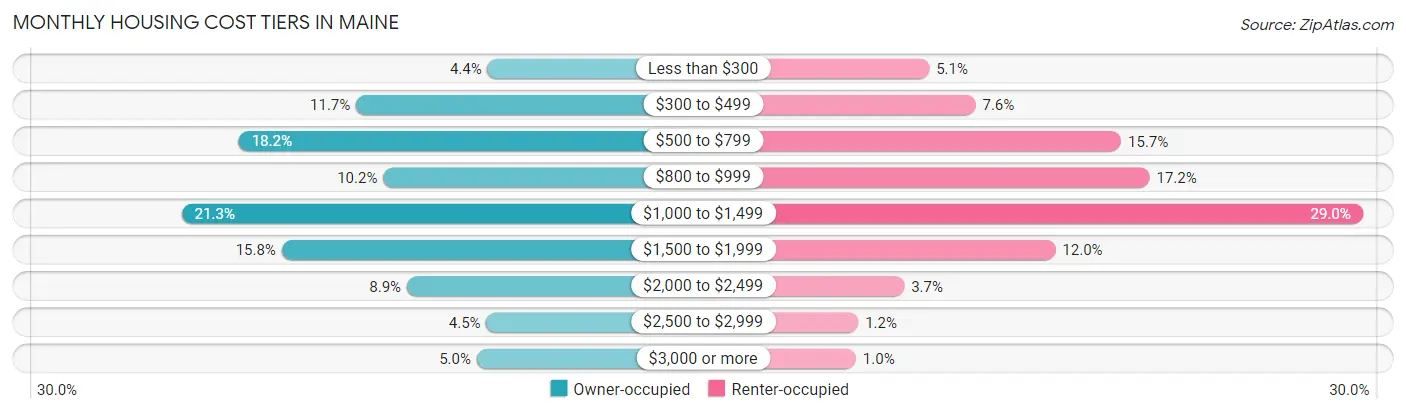
| Monthly Cost | Owner-occupied | Renter-occupied |
| Less than $300 | 18,891 (4.4%) | 7,808 (5.1%) |
| $300 to $499 | 49,817 (11.7%) | 11,741 (7.6%) |
| $500 to $799 | 77,449 (18.2%) | 24,115 (15.7%) |
| $800 to $999 | 43,422 (10.2%) | 26,540 (17.2%) |
| $1,000 to $1,499 | 90,914 (21.3%) | 44,656 (29.0%) |
| $1,500 to $1,999 | 67,335 (15.8%) | 18,535 (12.0%) |
| $2,000 to $2,499 | 37,849 (8.9%) | 5,687 (3.7%) |
| $2,500 to $2,999 | 19,148 (4.5%) | 1,764 (1.1%) |
| $3,000 or more | 21,414 (5.0%) | 1,574 (1.0%) |
| Total | 426,239 (100.0%) | 153,933 (100.0%) |
Physical Housing Characteristics in Maine
Housing Structures in Maine
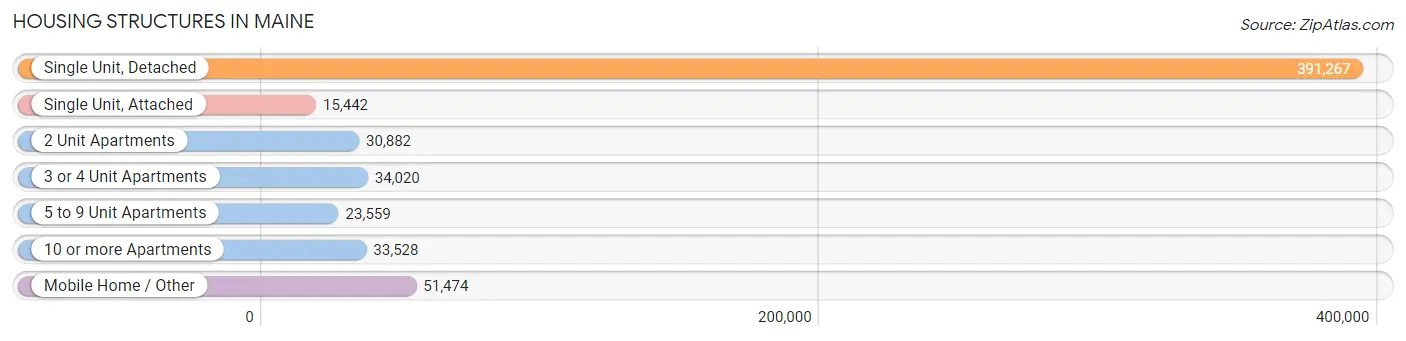
| Structure Type | # Housing Units | % Housing Units |
| Single Unit, Detached | 391,267 | 67.4% |
| Single Unit, Attached | 15,442 | 2.7% |
| 2 Unit Apartments | 30,882 | 5.3% |
| 3 or 4 Unit Apartments | 34,020 | 5.9% |
| 5 to 9 Unit Apartments | 23,559 | 4.1% |
| 10 or more Apartments | 33,528 | 5.8% |
| Mobile Home / Other | 51,474 | 8.9% |
| Total | 580,172 | 100.0% |
Housing Structures by Occupancy in Maine
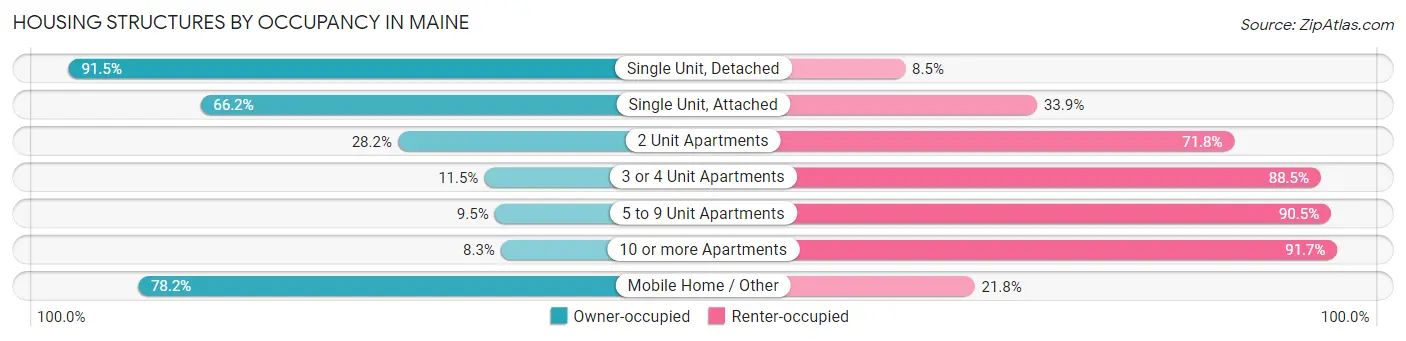
| Structure Type | Owner-occupied | Renter-occupied |
| Single Unit, Detached | 358,131 (91.5%) | 33,136 (8.5%) |
| Single Unit, Attached | 10,215 (66.1%) | 5,227 (33.9%) |
| 2 Unit Apartments | 8,697 (28.2%) | 22,185 (71.8%) |
| 3 or 4 Unit Apartments | 3,915 (11.5%) | 30,105 (88.5%) |
| 5 to 9 Unit Apartments | 2,245 (9.5%) | 21,314 (90.5%) |
| 10 or more Apartments | 2,797 (8.3%) | 30,731 (91.7%) |
| Mobile Home / Other | 40,239 (78.2%) | 11,235 (21.8%) |
| Total | 426,239 (73.5%) | 153,933 (26.5%) |
Housing Structures by Number of Rooms in Maine
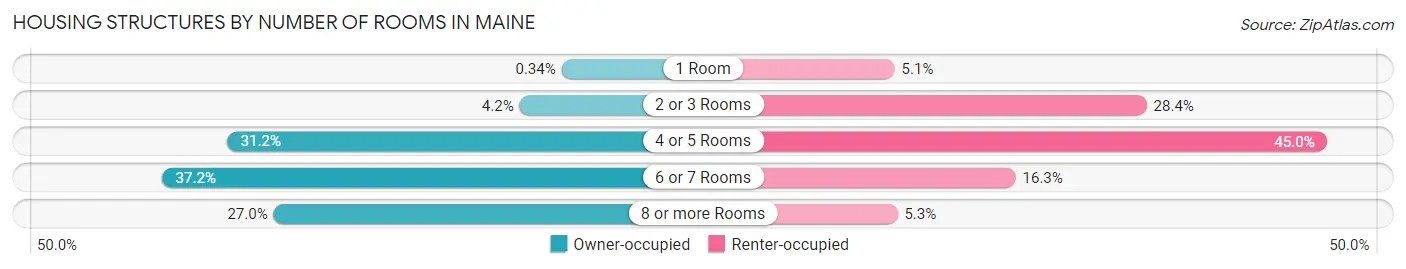
| Number of Rooms | Owner-occupied | Renter-occupied |
| 1 Room | 1,455 (0.3%) | 7,796 (5.1%) |
| 2 or 3 Rooms | 18,040 (4.2%) | 43,667 (28.4%) |
| 4 or 5 Rooms | 133,064 (31.2%) | 69,272 (45.0%) |
| 6 or 7 Rooms | 158,688 (37.2%) | 25,013 (16.3%) |
| 8 or more Rooms | 114,992 (27.0%) | 8,185 (5.3%) |
| Total | 426,239 (100.0%) | 153,933 (100.0%) |
Housing Structure by Heating Type in Maine
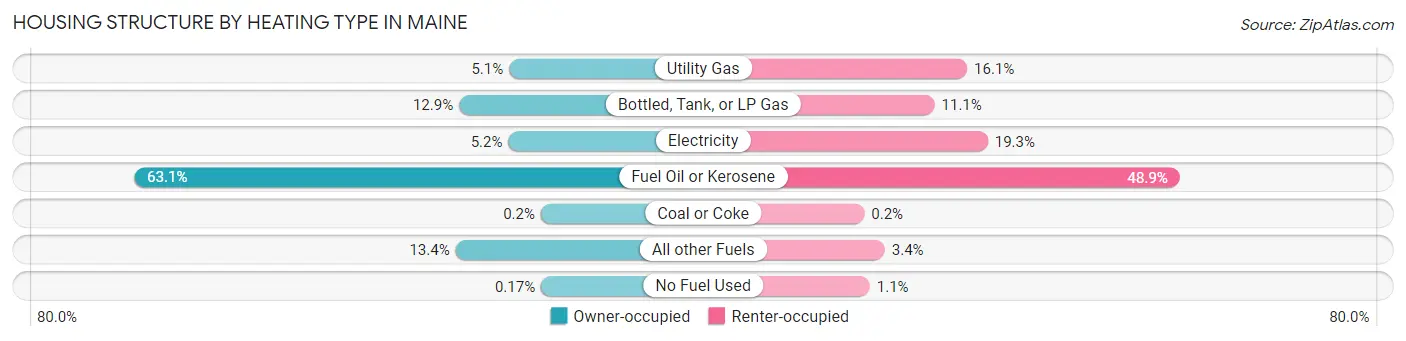
| Heating Type | Owner-occupied | Renter-occupied |
| Utility Gas | 21,794 (5.1%) | 24,770 (16.1%) |
| Bottled, Tank, or LP Gas | 54,751 (12.9%) | 17,018 (11.1%) |
| Electricity | 22,301 (5.2%) | 29,693 (19.3%) |
| Fuel Oil or Kerosene | 268,793 (63.1%) | 75,335 (48.9%) |
| Coal or Coke | 836 (0.2%) | 314 (0.2%) |
| All other Fuels | 57,060 (13.4%) | 5,193 (3.4%) |
| No Fuel Used | 704 (0.2%) | 1,610 (1.1%) |
| Total | 426,239 (100.0%) | 153,933 (100.0%) |
Household Vehicle Usage in Maine
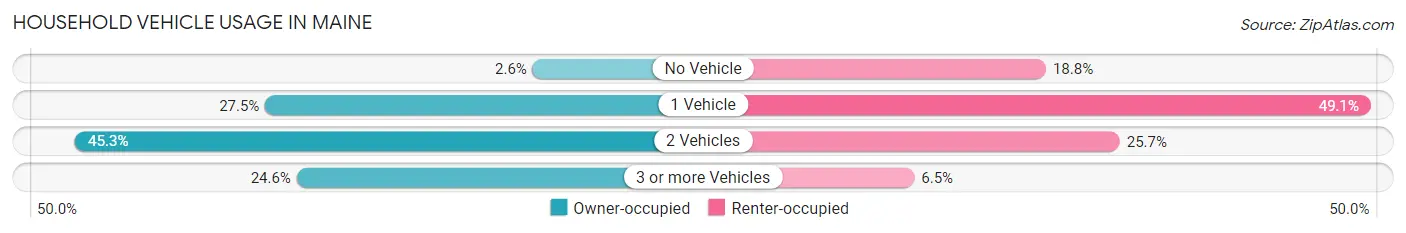
| Vehicles per Household | Owner-occupied | Renter-occupied |
| No Vehicle | 10,972 (2.6%) | 28,895 (18.8%) |
| 1 Vehicle | 117,365 (27.5%) | 75,567 (49.1%) |
| 2 Vehicles | 193,049 (45.3%) | 39,499 (25.7%) |
| 3 or more Vehicles | 104,853 (24.6%) | 9,972 (6.5%) |
| Total | 426,239 (100.0%) | 153,933 (100.0%) |
Real Estate & Mortgages in Maine
Real Estate and Mortgage Overview in Maine
| Characteristic | Without Mortgage | With Mortgage |
| Housing Units | 171,540 | 254,699 |
| Median Property Value | $219,500 | $259,300 |
| Median Household Income | $59,347 | $60,933 |
| Monthly Housing Costs | $579 | $20,710 |
| Real Estate Taxes | $2,596 | $2,106 |
Property Value by Mortgage Status in Maine
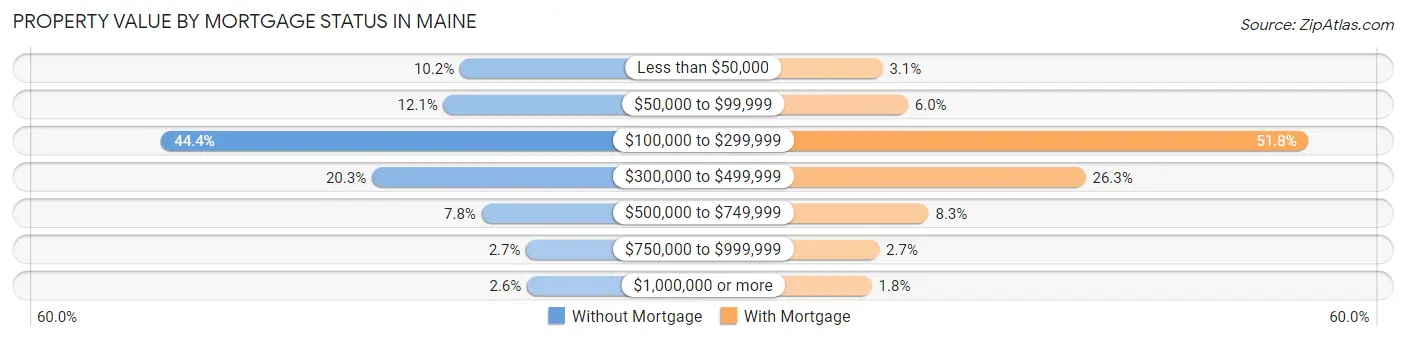
| Property Value | Without Mortgage | With Mortgage |
| Less than $50,000 | 17,565 (10.2%) | 7,851 (3.1%) |
| $50,000 to $99,999 | 20,769 (12.1%) | 15,223 (6.0%) |
| $100,000 to $299,999 | 76,101 (44.4%) | 131,865 (51.8%) |
| $300,000 to $499,999 | 34,815 (20.3%) | 66,973 (26.3%) |
| $500,000 to $749,999 | 13,315 (7.8%) | 21,233 (8.3%) |
| $750,000 to $999,999 | 4,563 (2.7%) | 6,871 (2.7%) |
| $1,000,000 or more | 4,412 (2.6%) | 4,683 (1.8%) |
| Total | 171,540 (100.0%) | 254,699 (100.0%) |
Household Income by Mortgage Status in Maine
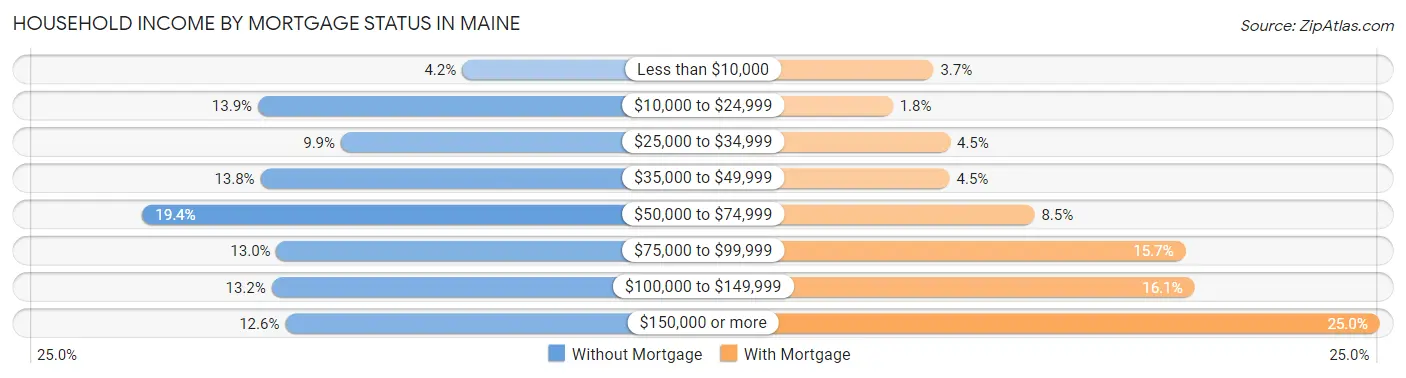
| Household Income | Without Mortgage | With Mortgage |
| Less than $10,000 | 7,151 (4.2%) | 9,452 (3.7%) |
| $10,000 to $24,999 | 23,835 (13.9%) | 4,511 (1.8%) |
| $25,000 to $34,999 | 17,056 (9.9%) | 11,471 (4.5%) |
| $35,000 to $49,999 | 23,621 (13.8%) | 11,399 (4.5%) |
| $50,000 to $74,999 | 33,260 (19.4%) | 21,705 (8.5%) |
| $75,000 to $99,999 | 22,317 (13.0%) | 40,011 (15.7%) |
| $100,000 to $149,999 | 22,705 (13.2%) | 41,096 (16.1%) |
| $150,000 or more | 21,595 (12.6%) | 63,573 (25.0%) |
| Total | 171,540 (100.0%) | 254,699 (100.0%) |
Property Value to Household Income Ratio in Maine
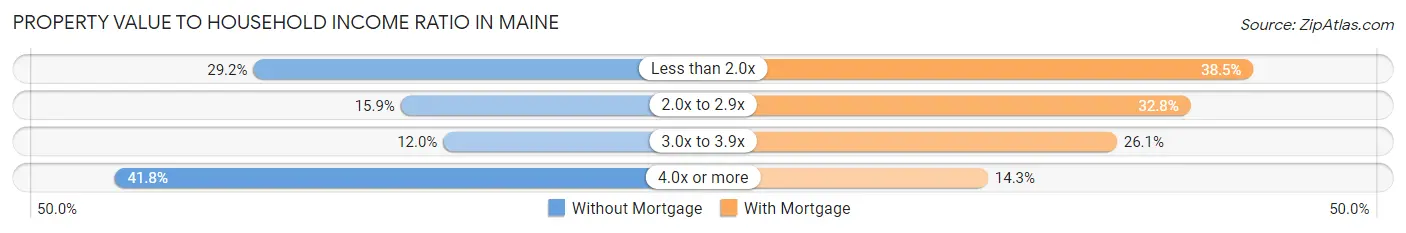
| Value-to-Income Ratio | Without Mortgage | With Mortgage |
| Less than 2.0x | 50,145 (29.2%) | 97,930 (38.5%) |
| 2.0x to 2.9x | 27,187 (15.9%) | 83,408 (32.8%) |
| 3.0x to 3.9x | 20,561 (12.0%) | 66,346 (26.1%) |
| 4.0x or more | 71,760 (41.8%) | 36,523 (14.3%) |
| Total | 171,540 (100.0%) | 254,699 (100.0%) |
Real Estate Taxes by Mortgage Status in Maine
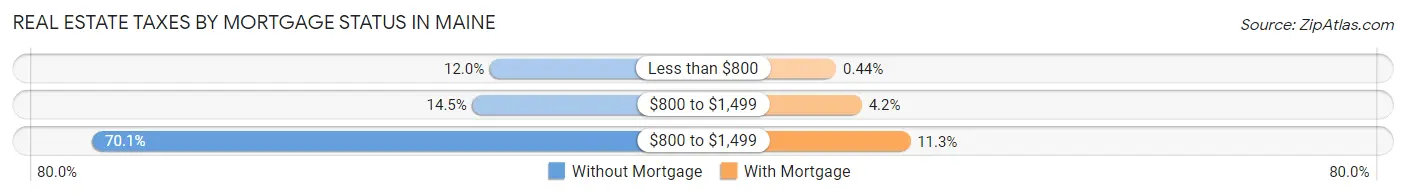
| Property Taxes | Without Mortgage | With Mortgage |
| Less than $800 | 20,570 (12.0%) | 1,109 (0.4%) |
| $800 to $1,499 | 24,938 (14.5%) | 10,680 (4.2%) |
| $800 to $1,499 | 120,282 (70.1%) | 28,717 (11.3%) |
| Total | 171,540 (100.0%) | 254,699 (100.0%) |
Health & Disability in Maine
Health Insurance Coverage by Age in Maine
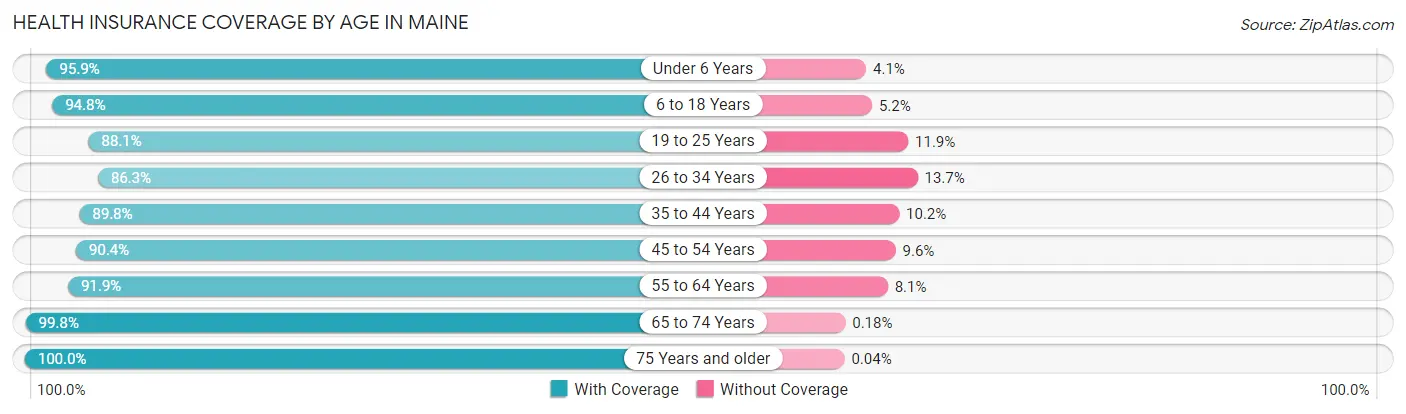
| Age Bracket | With Coverage | Without Coverage |
| Under 6 Years | 73,602 (95.9%) | 3,122 (4.1%) |
| 6 to 18 Years | 181,010 (94.8%) | 9,841 (5.2%) |
| 19 to 25 Years | 93,341 (88.1%) | 12,608 (11.9%) |
| 26 to 34 Years | 127,809 (86.3%) | 20,224 (13.7%) |
| 35 to 44 Years | 142,791 (89.8%) | 16,251 (10.2%) |
| 45 to 54 Years | 157,225 (90.4%) | 16,638 (9.6%) |
| 55 to 64 Years | 194,361 (91.9%) | 17,108 (8.1%) |
| 65 to 74 Years | 173,705 (99.8%) | 317 (0.2%) |
| 75 Years and older | 109,573 (100.0%) | 49 (0.0%) |
| Total | 1,253,417 (92.9%) | 96,158 (7.1%) |
Health Insurance Coverage by Citizenship Status in Maine
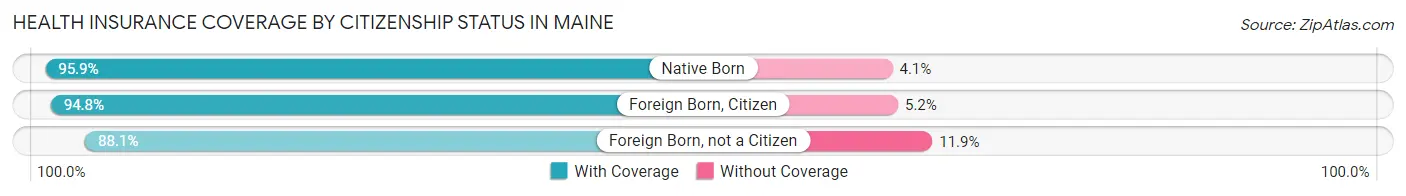
| Citizenship Status | With Coverage | Without Coverage |
| Native Born | 73,602 (95.9%) | 3,122 (4.1%) |
| Foreign Born, Citizen | 181,010 (94.8%) | 9,841 (5.2%) |
| Foreign Born, not a Citizen | 93,341 (88.1%) | 12,608 (11.9%) |
Health Insurance Coverage by Household Income in Maine

| Household Income | With Coverage | Without Coverage |
| Under $25,000 | 127,925 (91.2%) | 12,395 (8.8%) |
| $25,000 to $49,999 | 194,440 (89.7%) | 22,262 (10.3%) |
| $50,000 to $74,999 | 200,206 (90.8%) | 20,384 (9.2%) |
| $75,000 to $99,999 | 183,310 (92.2%) | 15,462 (7.8%) |
| $100,000 and over | 527,233 (95.6%) | 24,508 (4.4%) |
Public vs Private Health Insurance Coverage by Age in Maine
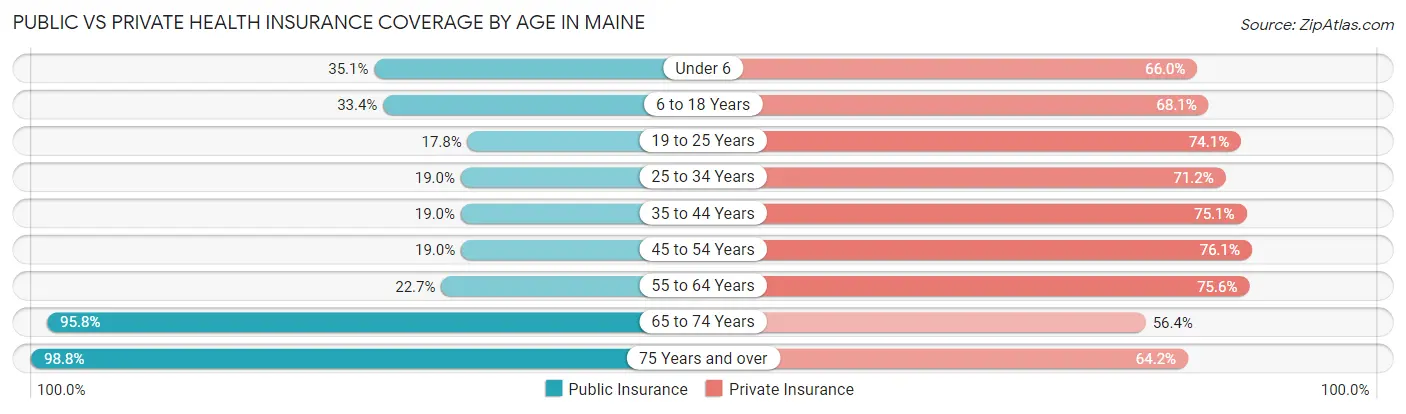
| Age Bracket | Public Insurance | Private Insurance |
| Under 6 | 26,931 (35.1%) | 50,630 (66.0%) |
| 6 to 18 Years | 63,825 (33.4%) | 129,945 (68.1%) |
| 19 to 25 Years | 18,841 (17.8%) | 78,493 (74.1%) |
| 25 to 34 Years | 28,168 (19.0%) | 105,435 (71.2%) |
| 35 to 44 Years | 30,257 (19.0%) | 119,423 (75.1%) |
| 45 to 54 Years | 33,024 (19.0%) | 132,304 (76.1%) |
| 55 to 64 Years | 47,898 (22.7%) | 159,904 (75.6%) |
| 65 to 74 Years | 166,763 (95.8%) | 98,166 (56.4%) |
| 75 Years and over | 108,302 (98.8%) | 70,422 (64.2%) |
| Total | 524,009 (38.8%) | 944,722 (70.0%) |
Disability Status by Sex by Age in Maine
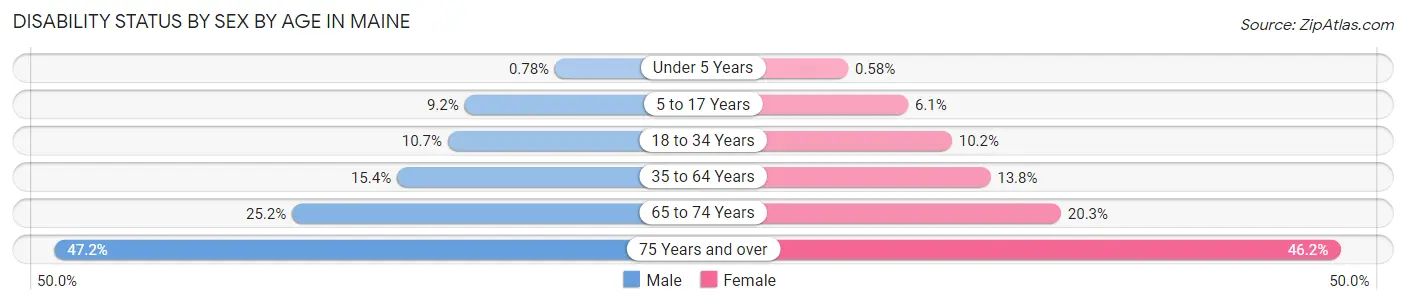
| Age Bracket | Male | Female |
| Under 5 Years | 252 (0.8%) | 178 (0.6%) |
| 5 to 17 Years | 8,822 (9.2%) | 5,582 (6.1%) |
| 18 to 34 Years | 14,655 (10.7%) | 13,718 (10.2%) |
| 35 to 64 Years | 41,427 (15.4%) | 38,033 (13.8%) |
| 65 to 74 Years | 21,055 (25.2%) | 18,376 (20.3%) |
| 75 Years and over | 22,181 (47.2%) | 28,967 (46.2%) |
Disability Class by Sex by Age in Maine
Disability Class: Hearing Difficulty
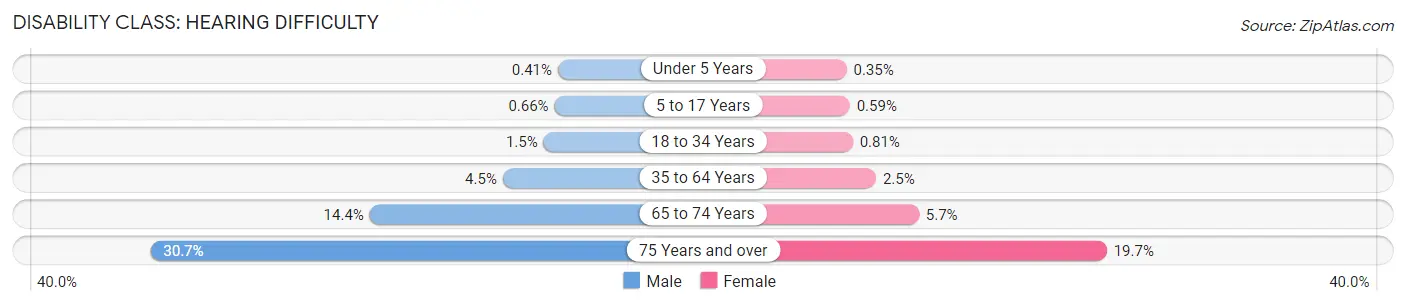
| Age Bracket | Male | Female |
| Under 5 Years | 133 (0.4%) | 108 (0.4%) |
| 5 to 17 Years | 636 (0.7%) | 534 (0.6%) |
| 18 to 34 Years | 2,009 (1.5%) | 1,086 (0.8%) |
| 35 to 64 Years | 12,082 (4.5%) | 7,005 (2.5%) |
| 65 to 74 Years | 12,026 (14.4%) | 5,170 (5.7%) |
| 75 Years and over | 14,398 (30.7%) | 12,323 (19.7%) |
Disability Class: Vision Difficulty
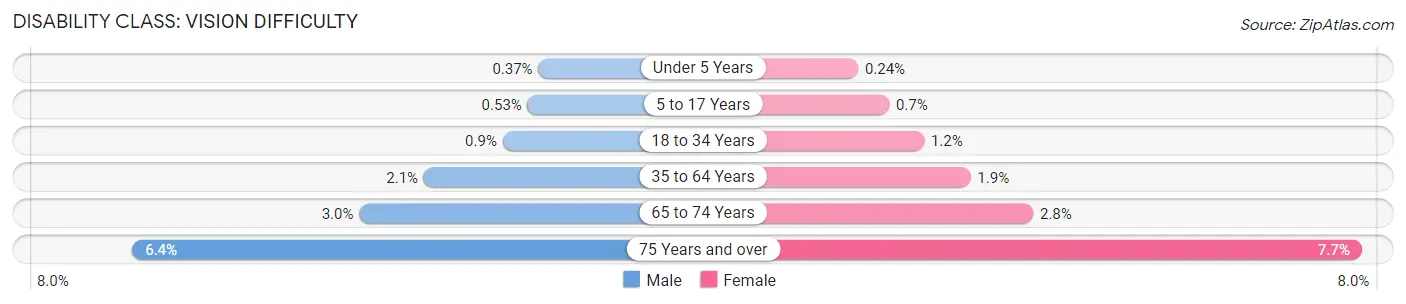
| Age Bracket | Male | Female |
| Under 5 Years | 119 (0.4%) | 74 (0.2%) |
| 5 to 17 Years | 512 (0.5%) | 636 (0.7%) |
| 18 to 34 Years | 1,237 (0.9%) | 1,636 (1.2%) |
| 35 to 64 Years | 5,568 (2.1%) | 5,281 (1.9%) |
| 65 to 74 Years | 2,535 (3.0%) | 2,570 (2.8%) |
| 75 Years and over | 3,008 (6.4%) | 4,836 (7.7%) |
Disability Class: Cognitive Difficulty
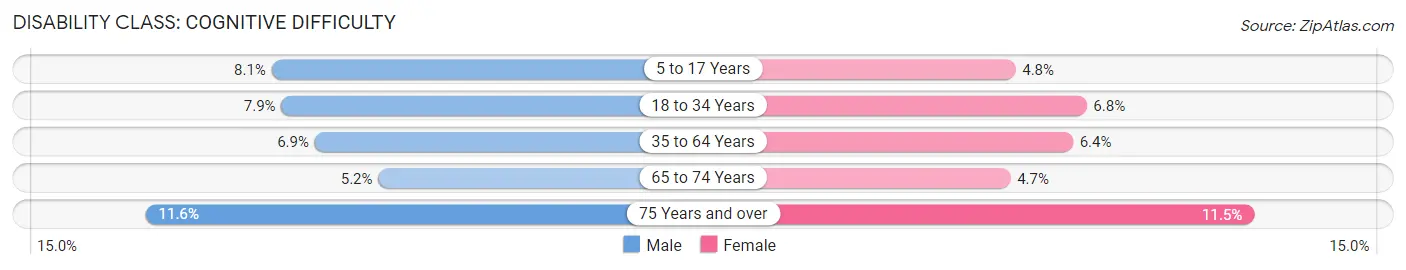
| Age Bracket | Male | Female |
| 5 to 17 Years | 7,819 (8.1%) | 4,394 (4.8%) |
| 18 to 34 Years | 10,731 (7.9%) | 9,150 (6.8%) |
| 35 to 64 Years | 18,571 (6.9%) | 17,743 (6.4%) |
| 65 to 74 Years | 4,308 (5.1%) | 4,244 (4.7%) |
| 75 Years and over | 5,460 (11.6%) | 7,191 (11.5%) |
Disability Class: Ambulatory Difficulty
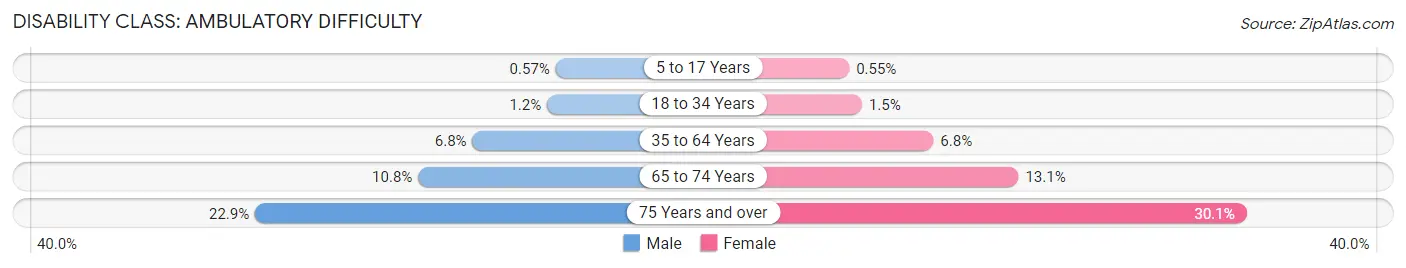
| Age Bracket | Male | Female |
| 5 to 17 Years | 550 (0.6%) | 503 (0.5%) |
| 18 to 34 Years | 1,660 (1.2%) | 2,020 (1.5%) |
| 35 to 64 Years | 18,127 (6.8%) | 18,777 (6.8%) |
| 65 to 74 Years | 9,018 (10.8%) | 11,862 (13.1%) |
| 75 Years and over | 10,750 (22.9%) | 18,830 (30.0%) |
Disability Class: Self-Care Difficulty
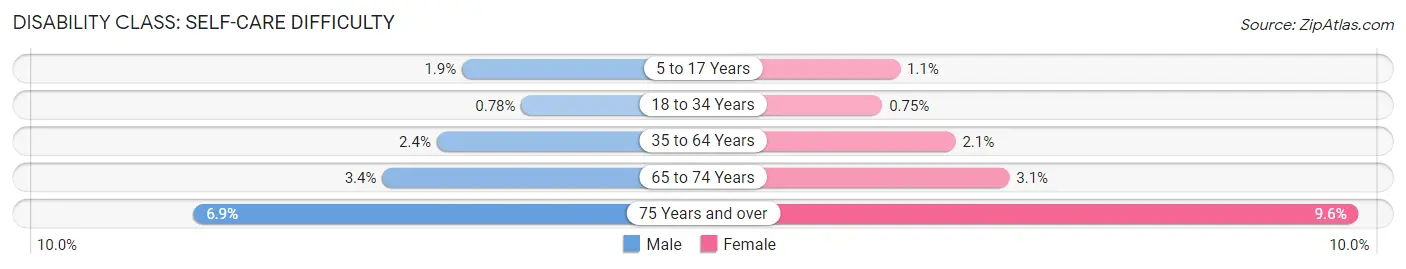
| Age Bracket | Male | Female |
| 5 to 17 Years | 1,808 (1.9%) | 978 (1.1%) |
| 18 to 34 Years | 1,066 (0.8%) | 1,012 (0.7%) |
| 35 to 64 Years | 6,313 (2.4%) | 5,811 (2.1%) |
| 65 to 74 Years | 2,807 (3.4%) | 2,807 (3.1%) |
| 75 Years and over | 3,228 (6.9%) | 6,010 (9.6%) |
Technology Access in Maine
Computing Device Access in Maine
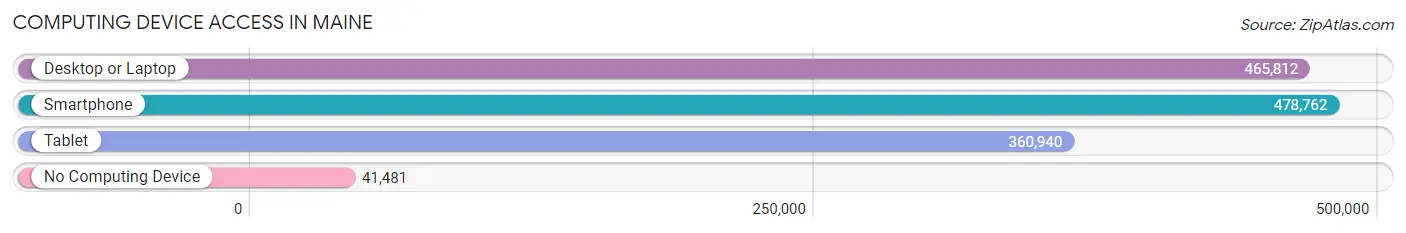
| Device Type | # Households | % Households |
| Desktop or Laptop | 465,812 | 80.3% |
| Smartphone | 478,762 | 82.5% |
| Tablet | 360,940 | 62.2% |
| No Computing Device | 41,481 | 7.1% |
| Total | 580,172 | 100.0% |
Internet Access in Maine
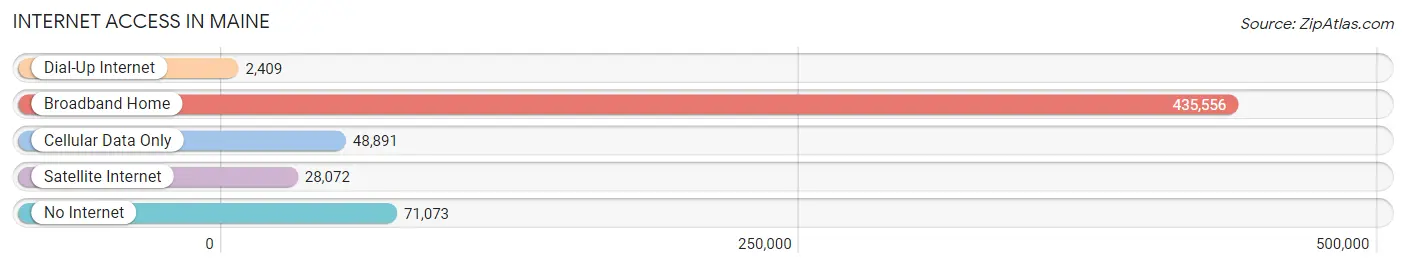
| Internet Type | # Households | % Households |
| Dial-Up Internet | 2,409 | 0.4% |
| Broadband Home | 435,556 | 75.1% |
| Cellular Data Only | 48,891 | 8.4% |
| Satellite Internet | 28,072 | 4.8% |
| No Internet | 71,073 | 12.2% |
| Total | 580,172 | 100.0% |
Maine Summary
Maine is a state located in the northeastern region of the United States. It is bordered by the Canadian provinces of Quebec and New Brunswick, as well as the Atlantic Ocean. Maine is the 12th smallest state in the country, with a total area of 35,385 square miles. It is the northernmost state in the contiguous United States and is known for its rugged coastline, rocky mountains, and picturesque forests.
History
Maine was originally inhabited by Native American tribes, including the Abenaki, Passamaquoddy, and Penobscot. The first Europeans to explore the area were French explorers in the 16th century. In 1622, the French established a trading post at present-day Castine, which became the first permanent European settlement in Maine. The area was part of the French colony of Acadia until 1713, when it was ceded to the British.
In 1775, the American Revolutionary War began and Maine became a battleground between the British and the American colonists. In 1776, the British captured the city of Portland, which remained under their control until the end of the war in 1783. After the war, Maine became part of the newly formed United States of America. In 1820, Maine was admitted to the Union as the 23rd state.
Geography
Maine is located in the northeastern region of the United States. It is bordered by the Canadian provinces of Quebec and New Brunswick, as well as the Atlantic Ocean. Maine is the 12th smallest state in the country, with a total area of 35,385 square miles.
Maine is known for its rugged coastline, which is dotted with numerous islands and bays. The state is also home to the highest point in the northeastern United States, Mount Katahdin, which stands at 5,267 feet. The state is also home to numerous rivers, lakes, and forests.
Economy
Maine’s economy is largely based on its natural resources. The state is a major producer of seafood, including lobster, clams, and scallops. It is also a major producer of timber, paper, and other forest products. In addition, the state is home to numerous manufacturing companies, including shipbuilding, electronics, and textiles.
Maine is also a major tourist destination, with its rugged coastline, picturesque forests, and numerous outdoor activities. Tourism is a major contributor to the state’s economy, with visitors spending over $5 billion annually.
Demographics
As of 2019, Maine had a population of 1,344,212. The state is predominantly white, with 92.3% of the population identifying as white. The largest ethnic group is French-Canadian, with 8.2% of the population. Other ethnic groups include African American (1.6%), Native American (1.3%), and Asian (1.2%).
The median household income in Maine is $56,277, and the median home value is $219,400. The state has a poverty rate of 11.3%, which is slightly higher than the national average.
Maine is also home to numerous colleges and universities, including the University of Maine, Bates College, and Bowdoin College. The state is also home to numerous cultural attractions, including the Portland Museum of Art, the Maine State Museum, and the Portland Symphony Orchestra.
Common Questions
When was Maine Incorporated?
Maine was Incorporated into the Union on Mar 15, 1820.
What is the Total Area of Maine?
Total Area of Maine is 35,384 Square Miles.
What is the Total Land Area of Maine?
Total Land Area of Maine is 30,841 Square Miles.
What is the Total Water Area of Maine?
Total Water Area of Maine is 4,543 Square Miles.
What is the Average Elevation in Maine?
Average Elevation in Maine is 600 Feet.
What is the Highest Elevation in Maine?
Highest Elevation in Maine is 5,276 Feet.
What is the Lowest Elevation in Maine?
Lowest Elevation in Maine is 0 Feet.
What is the Population Density in Maine?
Population Density in Maine is 44.3 People per Square Mile.
What is Per Capita Income in Maine?
Per Capita income in Maine is $39,718.
What is the Median Family Income in Maine?
Median Family Income in Maine is $89,012.
What is the Median Household income in Maine?
Median Household Income in Maine is $68,251.
What is Income or Wage Gap in Maine?
Income or Wage Gap in Maine is 25.0%.
Women in Maine earn 75.0 cents for every dollar earned by a man.
What is Family Income Deficit in Maine?
Family Income Deficit in Maine is $9,582.
Families that are below poverty line in Maine earn $9,582 less on average than the poverty threshold level.
What is Inequality or Gini Index in Maine?
Inequality or Gini Index in Maine is 0.46.
What is the Total Population of Maine?
Total Population of Maine is 1,366,949.
What is the Total Male Population of Maine?
Total Male Population of Maine is 674,230.
What is the Total Female Population of Maine?
Total Female Population of Maine is 692,719.
What is the Ratio of Males per 100 Females in Maine?
There are 97.33 Males per 100 Females in Maine.
What is the Ratio of Females per 100 Males in Maine?
There are 102.74 Females per 100 Males in Maine.
What is the Median Population Age in Maine?
Median Population Age in Maine is 44.8 Years.
What is the Average Family Size in Maine
Average Family Size in Maine is 2.9 People.
What is the Average Household Size in Maine
Average Household Size in Maine is 2.3 People.
How Large is the Labor Force in Maine?
There are 714,007 People in the Labor Forcein in Maine.
What is the Percentage of People in the Labor Force in Maine?
62.2% of People are in the Labor Force in Maine.
What is the Unemployment Rate in Maine?
Unemployment Rate in Maine is 4.0%.