Dorchester County, SC Map & Demographics
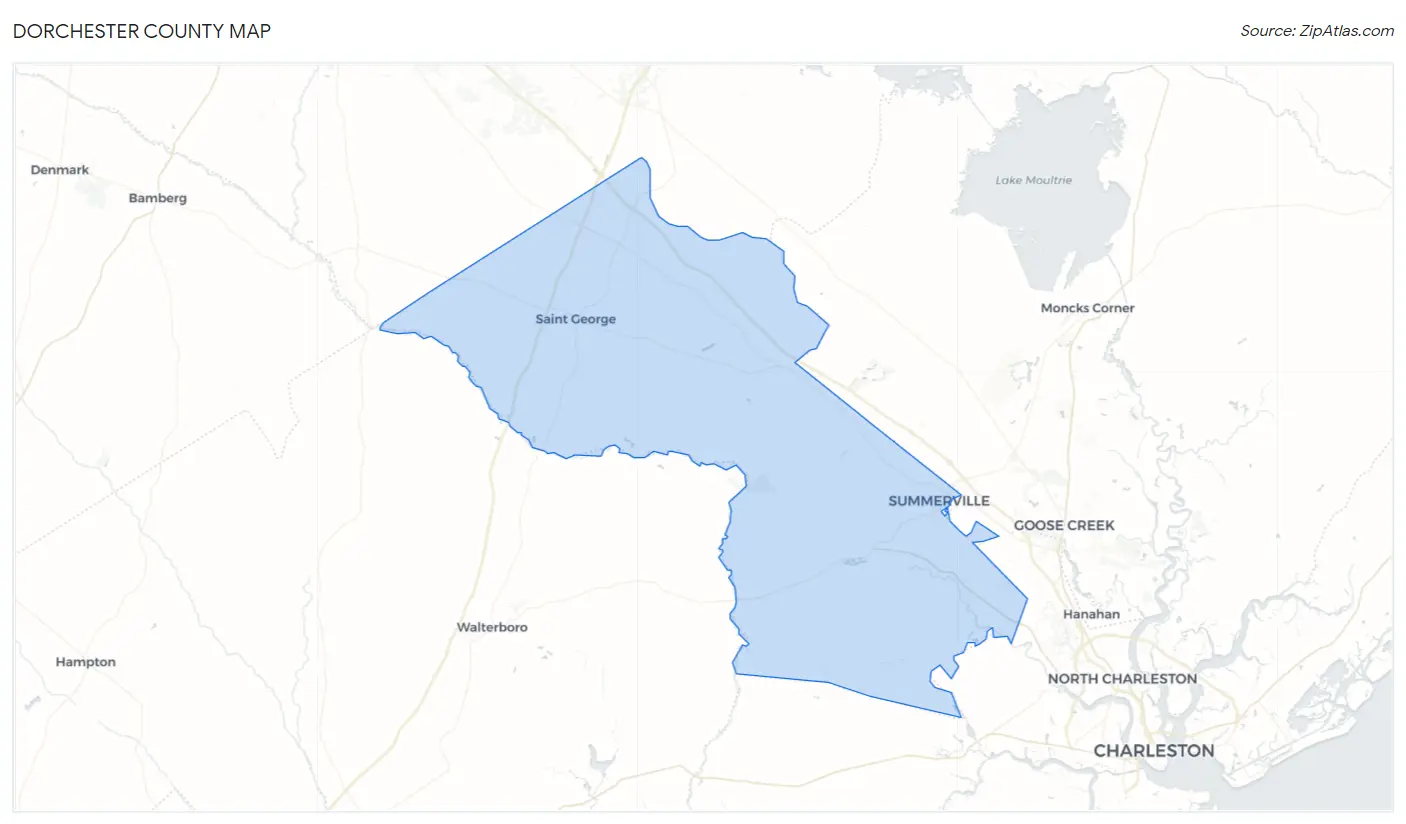
Dorchester County Map
Dorchester County Overview
$36,543
PER CAPITA INCOME
$91,847
AVG FAMILY INCOME
$73,686
AVG HOUSEHOLD INCOME
33.1%
WAGE / INCOME GAP [ % ]
66.9¢/ $1
WAGE / INCOME GAP [ $ ]
$12,181
FAMILY INCOME DEFICIT
0.43
INEQUALITY / GINI INDEX
162,139
TOTAL POPULATION
79,482
MALE POPULATION
82,657
FEMALE POPULATION
96.16
MALES / 100 FEMALES
103.99
FEMALES / 100 MALES
37.7
MEDIAN AGE
3.2
AVG FAMILY SIZE
2.7
AVG HOUSEHOLD SIZE
83,354
LABOR FORCE [ PEOPLE ]
65.1%
PERCENT IN LABOR FORCE
5.5%
UNEMPLOYMENT RATE
Dorchester County Area Codes
Income in Dorchester County
Income Overview in Dorchester County
Per Capita Income in Dorchester County is $36,543, while median incomes of families and households are $91,847 and $73,686 respectively.
| Characteristic | Number | Measure |
| Per Capita Income | 162,139 | $36,543 |
| Median Family Income | 42,481 | $91,847 |
| Mean Family Income | 42,481 | $109,878 |
| Median Household Income | 59,731 | $73,686 |
| Mean Household Income | 59,731 | $95,551 |
| Income Deficit | 42,481 | $12,181 |
| Wage / Income Gap (%) | 162,139 | 33.09% |
| Wage / Income Gap ($) | 162,139 | 66.91¢ per $1 |
| Gini / Inequality Index | 162,139 | 0.43 |
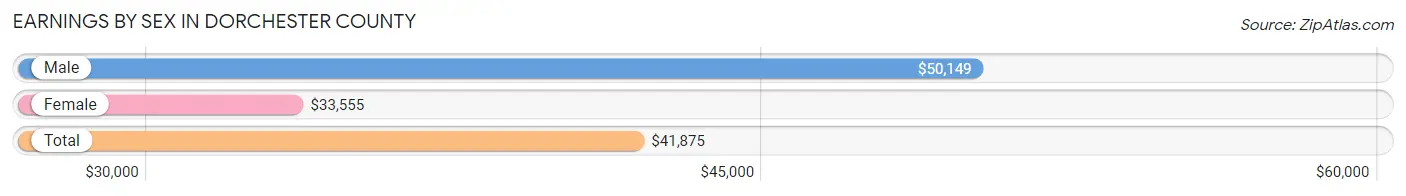
Earnings by Sex in Dorchester County
Average Earnings in Dorchester County are $41,875, $50,149 for men and $33,555 for women, a difference of 33.1%.
| Sex | Number | Average Earnings |
| Male | 44,857 (52.2%) | $50,149 |
| Female | 41,125 (47.8%) | $33,555 |
| Total | 85,982 (100.0%) | $41,875 |
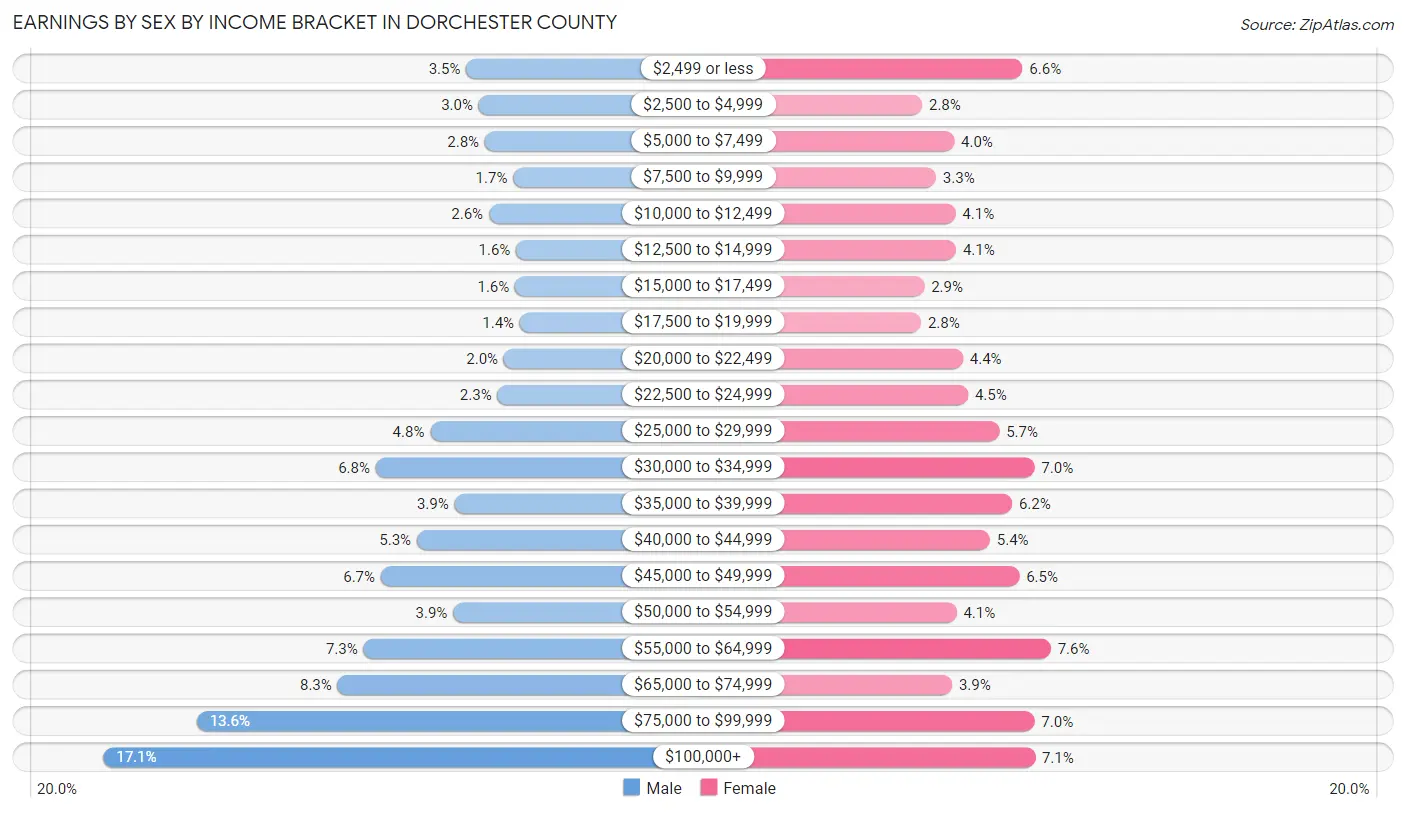
Earnings by Sex by Income Bracket in Dorchester County
The most common earnings brackets in Dorchester County are $100,000+ for men (7,647 | 17.1%) and $55,000 to $64,999 for women (3,140 | 7.6%).
| Income | Male | Female |
| $2,499 or less | 1,546 (3.5%) | 2,707 (6.6%) |
| $2,500 to $4,999 | 1,335 (3.0%) | 1,159 (2.8%) |
| $5,000 to $7,499 | 1,235 (2.8%) | 1,655 (4.0%) |
| $7,500 to $9,999 | 758 (1.7%) | 1,373 (3.3%) |
| $10,000 to $12,499 | 1,167 (2.6%) | 1,674 (4.1%) |
| $12,500 to $14,999 | 707 (1.6%) | 1,683 (4.1%) |
| $15,000 to $17,499 | 725 (1.6%) | 1,191 (2.9%) |
| $17,500 to $19,999 | 644 (1.4%) | 1,142 (2.8%) |
| $20,000 to $22,499 | 917 (2.0%) | 1,787 (4.3%) |
| $22,500 to $24,999 | 1,023 (2.3%) | 1,866 (4.5%) |
| $25,000 to $29,999 | 2,155 (4.8%) | 2,350 (5.7%) |
| $30,000 to $34,999 | 3,067 (6.8%) | 2,891 (7.0%) |
| $35,000 to $39,999 | 1,745 (3.9%) | 2,545 (6.2%) |
| $40,000 to $44,999 | 2,377 (5.3%) | 2,206 (5.4%) |
| $45,000 to $49,999 | 2,982 (6.7%) | 2,655 (6.5%) |
| $50,000 to $54,999 | 1,766 (3.9%) | 1,689 (4.1%) |
| $55,000 to $64,999 | 3,274 (7.3%) | 3,140 (7.6%) |
| $65,000 to $74,999 | 3,708 (8.3%) | 1,619 (3.9%) |
| $75,000 to $99,999 | 6,079 (13.6%) | 2,892 (7.0%) |
| $100,000+ | 7,647 (17.1%) | 2,901 (7.0%) |
| Total | 44,857 (100.0%) | 41,125 (100.0%) |
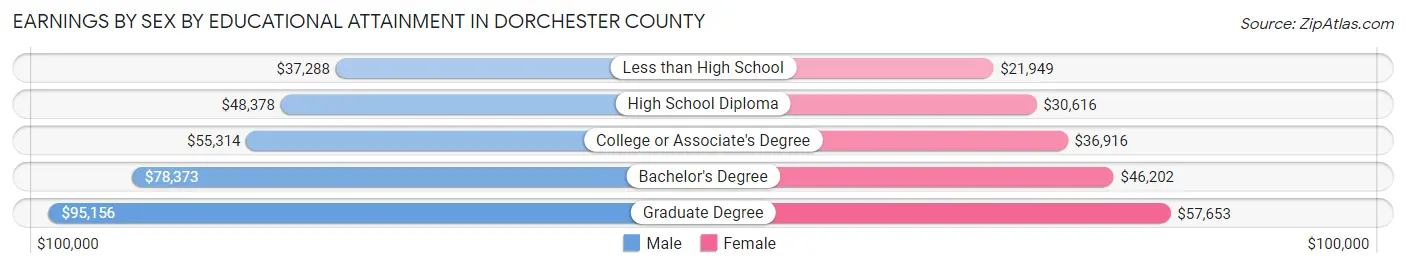
Earnings by Sex by Educational Attainment in Dorchester County
Average earnings in Dorchester County are $58,739 for men and $38,557 for women, a difference of 34.4%. Men with an educational attainment of graduate degree enjoy the highest average annual earnings of $95,156, while those with less than high school education earn the least with $37,288. Women with an educational attainment of graduate degree earn the most with the average annual earnings of $57,653, while those with less than high school education have the smallest earnings of $21,949.
| Educational Attainment | Male Income | Female Income |
| Less than High School | $37,288 | $21,949 |
| High School Diploma | $48,378 | $30,616 |
| College or Associate's Degree | $55,314 | $36,916 |
| Bachelor's Degree | $78,373 | $46,202 |
| Graduate Degree | $95,156 | $57,653 |
| Total | $58,739 | $38,557 |
Family Income in Dorchester County
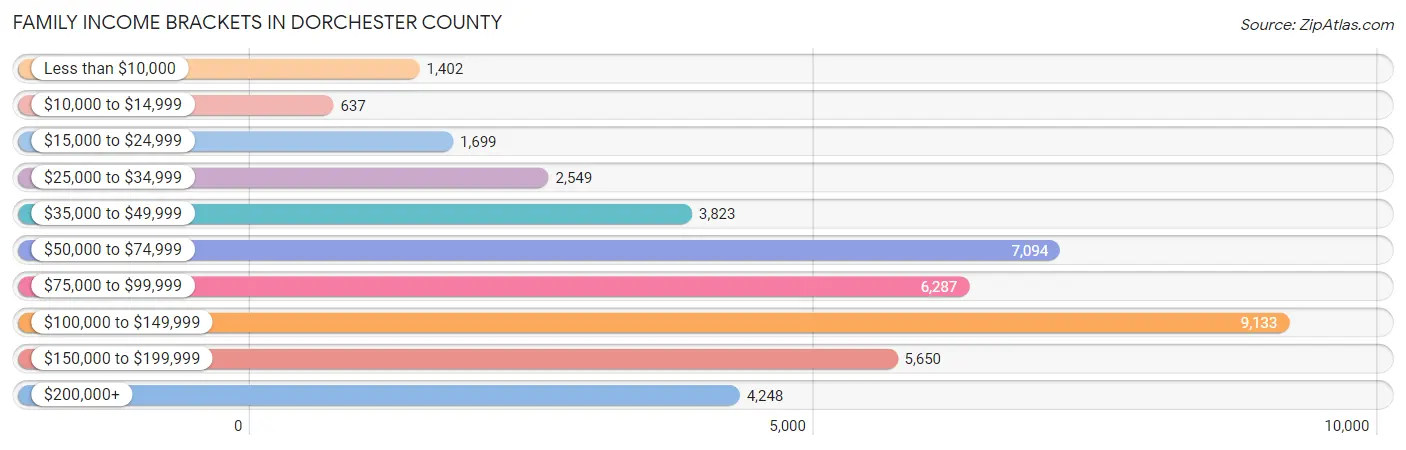
Family Income Brackets in Dorchester County
According to the Dorchester County family income data, there are 9,133 families falling into the $100,000 to $149,999 income range, which is the most common income bracket and makes up 21.5% of all families. Conversely, the $10,000 to $14,999 income bracket is the least frequent group with only 637 families (1.5%) belonging to this category.
| Income Bracket | # Families | % Families |
| Less than $10,000 | 1,402 | 3.3% |
| $10,000 to $14,999 | 637 | 1.5% |
| $15,000 to $24,999 | 1,699 | 4.0% |
| $25,000 to $34,999 | 2,549 | 6.0% |
| $35,000 to $49,999 | 3,823 | 9.0% |
| $50,000 to $74,999 | 7,094 | 16.7% |
| $75,000 to $99,999 | 6,287 | 14.8% |
| $100,000 to $149,999 | 9,133 | 21.5% |
| $150,000 to $199,999 | 5,650 | 13.3% |
| $200,000+ | 4,248 | 10.0% |
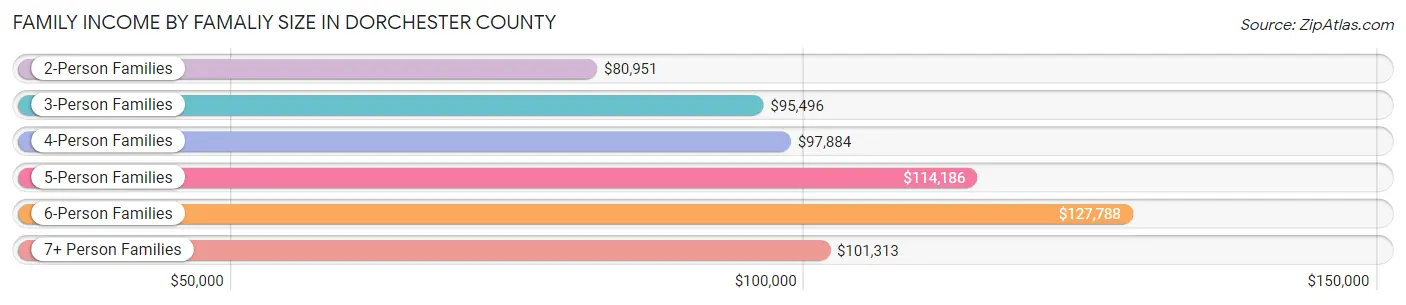
Family Income by Famaliy Size in Dorchester County
6-person families (903 | 2.1%) account for the highest median family income in Dorchester County with $127,788 per family, while 2-person families (20,123 | 47.4%) have the highest median income of $40,476 per family member.
| Income Bracket | # Families | Median Income |
| 2-Person Families | 20,123 (47.4%) | $80,951 |
| 3-Person Families | 9,584 (22.6%) | $95,496 |
| 4-Person Families | 7,618 (17.9%) | $97,884 |
| 5-Person Families | 3,616 (8.5%) | $114,186 |
| 6-Person Families | 903 (2.1%) | $127,788 |
| 7+ Person Families | 637 (1.5%) | $101,313 |
| Total | 42,481 (100.0%) | $91,847 |
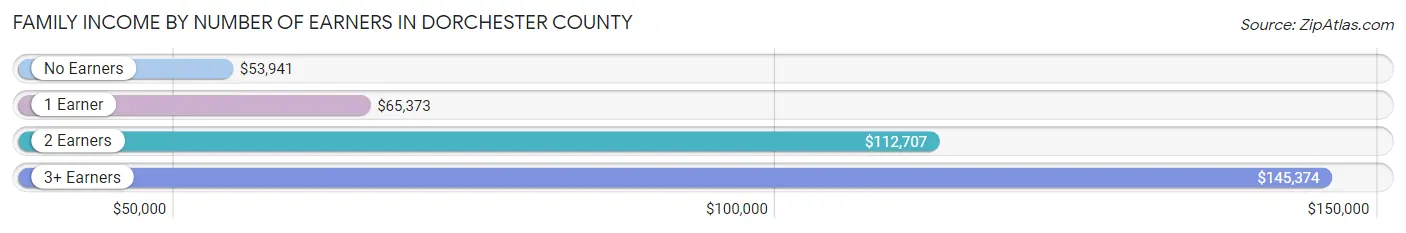
Family Income by Number of Earners in Dorchester County
The median family income in Dorchester County is $91,847, with families comprising 3+ earners (4,258) having the highest median family income of $145,374, while families with no earners (5,919) have the lowest median family income of $53,941, accounting for 10.0% and 13.9% of families, respectively.
| Number of Earners | # Families | Median Income |
| No Earners | 5,919 (13.9%) | $53,941 |
| 1 Earner | 14,185 (33.4%) | $65,373 |
| 2 Earners | 18,119 (42.6%) | $112,707 |
| 3+ Earners | 4,258 (10.0%) | $145,374 |
| Total | 42,481 (100.0%) | $91,847 |
Household Income in Dorchester County
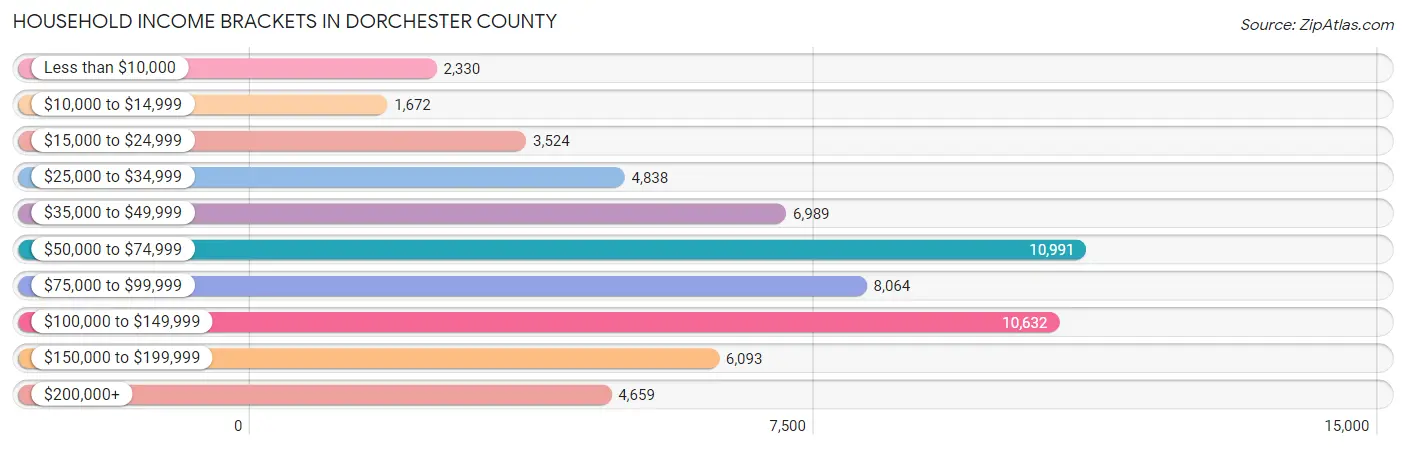
Household Income Brackets in Dorchester County
With 10,991 households falling in the category, the $50,000 to $74,999 income range is the most frequent in Dorchester County, accounting for 18.4% of all households. In contrast, only 1,672 households (2.8%) fall into the $10,000 to $14,999 income bracket, making it the least populous group.
| Income Bracket | # Households | % Households |
| Less than $10,000 | 2,330 | 3.9% |
| $10,000 to $14,999 | 1,672 | 2.8% |
| $15,000 to $24,999 | 3,524 | 5.9% |
| $25,000 to $34,999 | 4,838 | 8.1% |
| $35,000 to $49,999 | 6,989 | 11.7% |
| $50,000 to $74,999 | 10,991 | 18.4% |
| $75,000 to $99,999 | 8,064 | 13.5% |
| $100,000 to $149,999 | 10,632 | 17.8% |
| $150,000 to $199,999 | 6,093 | 10.2% |
| $200,000+ | 4,659 | 7.8% |
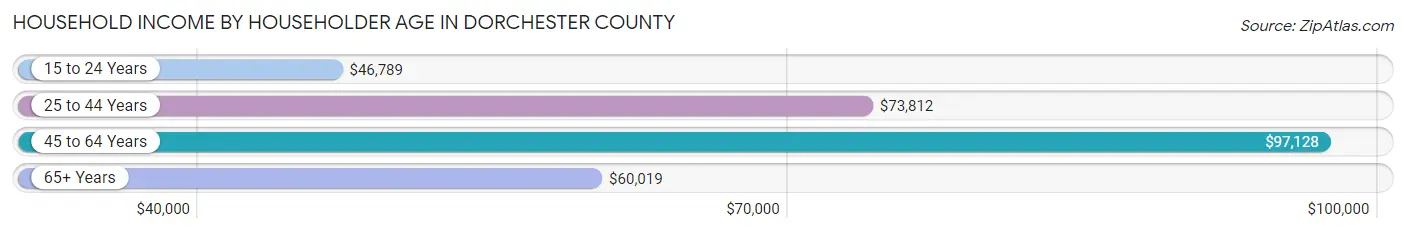
Household Income by Householder Age in Dorchester County
The median household income in Dorchester County is $73,686, with the highest median household income of $97,128 found in the 45 to 64 years age bracket for the primary householder. A total of 22,211 households (37.2%) fall into this category. Meanwhile, the 15 to 24 years age bracket for the primary householder has the lowest median household income of $46,789, with 1,684 households (2.8%) in this group.
| Income Bracket | # Households | Median Income |
| 15 to 24 Years | 1,684 (2.8%) | $46,789 |
| 25 to 44 Years | 21,512 (36.0%) | $73,812 |
| 45 to 64 Years | 22,211 (37.2%) | $97,128 |
| 65+ Years | 14,324 (24.0%) | $60,019 |
| Total | 59,731 (100.0%) | $73,686 |
Poverty in Dorchester County
Income Below Poverty by Sex and Age in Dorchester County
With 10.2% poverty level for males and 14.3% for females among the residents of Dorchester County, 12 to 14 year old males and 5 year old females are the most vulnerable to poverty, with 1,329 males (32.1%) and 207 females (34.3%) in their respective age groups living below the poverty level.
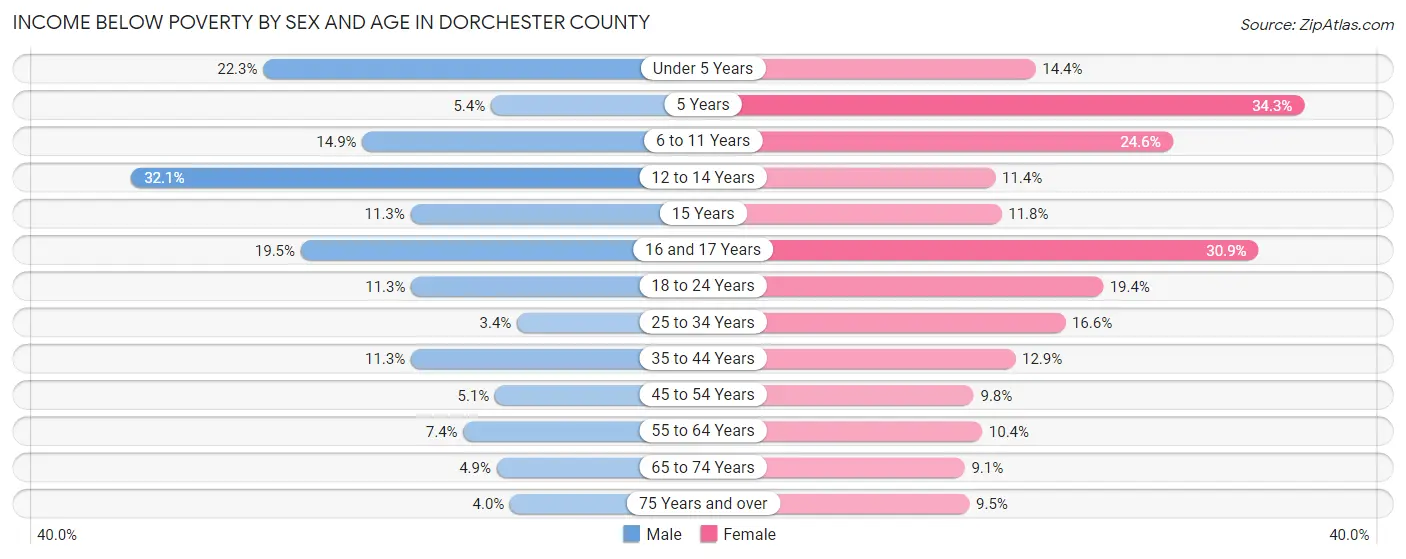
| Age Bracket | Male | Female |
| Under 5 Years | 997 (22.3%) | 619 (14.4%) |
| 5 Years | 59 (5.4%) | 207 (34.3%) |
| 6 to 11 Years | 931 (14.9%) | 1,712 (24.5%) |
| 12 to 14 Years | 1,329 (32.1%) | 358 (11.4%) |
| 15 Years | 129 (11.3%) | 106 (11.8%) |
| 16 and 17 Years | 465 (19.5%) | 799 (30.9%) |
| 18 to 24 Years | 751 (11.3%) | 1,258 (19.4%) |
| 25 to 34 Years | 358 (3.4%) | 1,823 (16.6%) |
| 35 to 44 Years | 1,223 (11.3%) | 1,488 (12.9%) |
| 45 to 54 Years | 509 (5.1%) | 1,041 (9.8%) |
| 55 to 64 Years | 718 (7.4%) | 1,101 (10.4%) |
| 65 to 74 Years | 341 (4.9%) | 734 (9.1%) |
| 75 Years and over | 142 (4.0%) | 467 (9.5%) |
| Total | 7,952 (10.2%) | 11,713 (14.3%) |
Income Above Poverty by Sex and Age in Dorchester County
According to the poverty statistics in Dorchester County, males aged 25 to 34 years and females aged 65 to 74 years are the age groups that are most secure financially, with 96.6% of males and 90.9% of females in these age groups living above the poverty line.
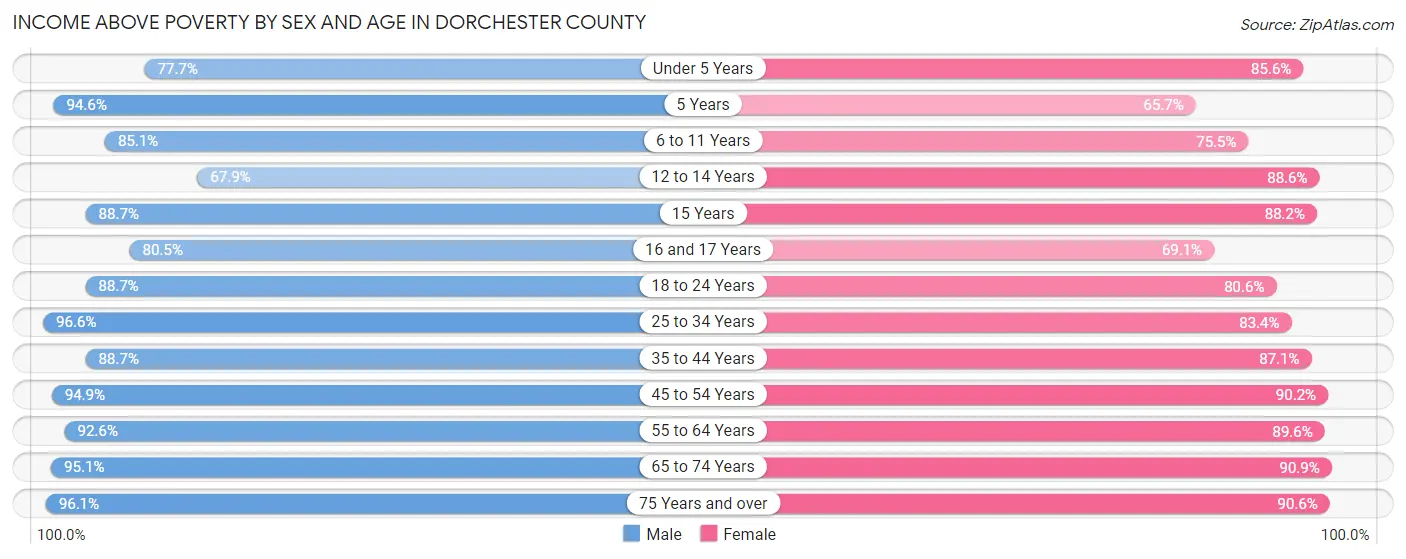
| Age Bracket | Male | Female |
| Under 5 Years | 3,478 (77.7%) | 3,688 (85.6%) |
| 5 Years | 1,040 (94.6%) | 396 (65.7%) |
| 6 to 11 Years | 5,309 (85.1%) | 5,262 (75.4%) |
| 12 to 14 Years | 2,814 (67.9%) | 2,788 (88.6%) |
| 15 Years | 1,009 (88.7%) | 789 (88.2%) |
| 16 and 17 Years | 1,921 (80.5%) | 1,784 (69.1%) |
| 18 to 24 Years | 5,902 (88.7%) | 5,235 (80.6%) |
| 25 to 34 Years | 10,092 (96.6%) | 9,177 (83.4%) |
| 35 to 44 Years | 9,587 (88.7%) | 10,085 (87.1%) |
| 45 to 54 Years | 9,544 (94.9%) | 9,606 (90.2%) |
| 55 to 64 Years | 8,962 (92.6%) | 9,487 (89.6%) |
| 65 to 74 Years | 6,556 (95.1%) | 7,322 (90.9%) |
| 75 Years and over | 3,455 (96.1%) | 4,476 (90.5%) |
| Total | 69,669 (89.8%) | 70,095 (85.7%) |
Income Below Poverty Among Married-Couple Families in Dorchester County
The poverty statistics for married-couple families in Dorchester County show that 3.0% or 939 of the total 31,728 families live below the poverty line. Families with 1 or 2 children have the highest poverty rate of 4.5%, comprising of 478 families. On the other hand, families with 5 or more children have the lowest poverty rate of 0.0%, which includes 0 families.
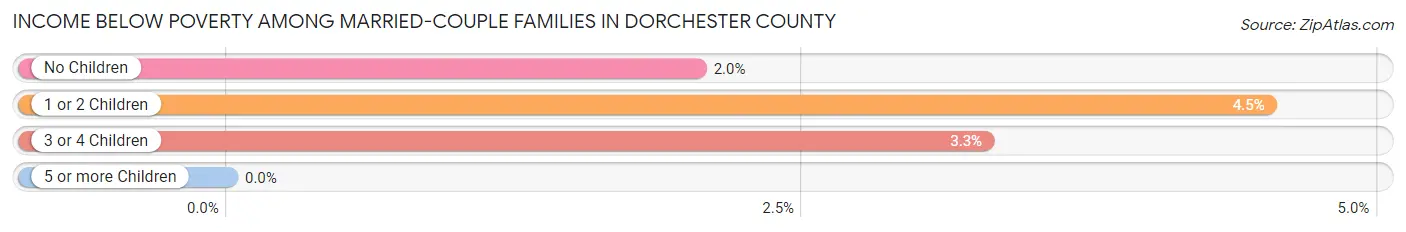
| Children | Above Poverty | Below Poverty |
| No Children | 17,993 (98.0%) | 374 (2.0%) |
| 1 or 2 Children | 10,099 (95.5%) | 478 (4.5%) |
| 3 or 4 Children | 2,558 (96.7%) | 87 (3.3%) |
| 5 or more Children | 139 (100.0%) | 0 (0.0%) |
| Total | 30,789 (97.0%) | 939 (3.0%) |
Income Below Poverty Among Single-Parent Households in Dorchester County
According to the poverty data in Dorchester County, 17.9% or 431 single-father households and 26.8% or 2,239 single-mother households are living below the poverty line. Among single-father households, those with 3 or 4 children have the highest poverty rate, with 74 households (34.9%) experiencing poverty. Likewise, among single-mother households, those with 5 or more children have the highest poverty rate, with 307 households (100.0%) falling below the poverty line.
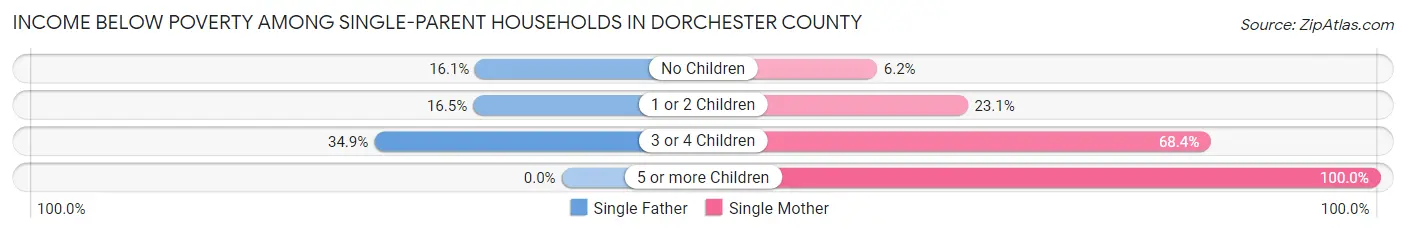
| Children | Single Father | Single Mother |
| No Children | 208 (16.1%) | 165 (6.2%) |
| 1 or 2 Children | 149 (16.5%) | 968 (23.1%) |
| 3 or 4 Children | 74 (34.9%) | 799 (68.4%) |
| 5 or more Children | 0 (0.0%) | 307 (100.0%) |
| Total | 431 (17.9%) | 2,239 (26.8%) |
Income Below Poverty Among Married-Couple vs Single-Parent Households in Dorchester County
The poverty data for Dorchester County shows that 939 of the married-couple family households (3.0%) and 2,670 of the single-parent households (24.8%) are living below the poverty level. Within the married-couple family households, those with 1 or 2 children have the highest poverty rate, with 478 households (4.5%) falling below the poverty line. Among the single-parent households, those with 5 or more children have the highest poverty rate, with 307 household (100.0%) living below poverty.
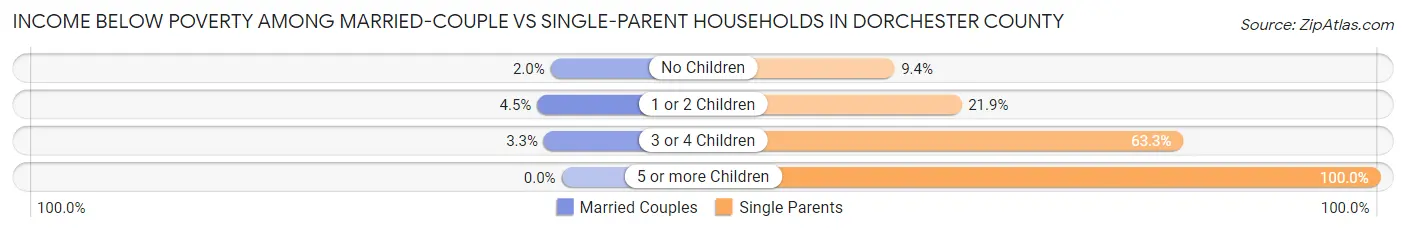
| Children | Married-Couple Families | Single-Parent Households |
| No Children | 374 (2.0%) | 373 (9.4%) |
| 1 or 2 Children | 478 (4.5%) | 1,117 (21.9%) |
| 3 or 4 Children | 87 (3.3%) | 873 (63.3%) |
| 5 or more Children | 0 (0.0%) | 307 (100.0%) |
| Total | 939 (3.0%) | 2,670 (24.8%) |
Race in Dorchester County
The most populous races in Dorchester County are White / Caucasian (104,519 | 64.5%), Black / African American (41,248 | 25.4%), and Hispanic or Latino (9,906 | 6.1%).
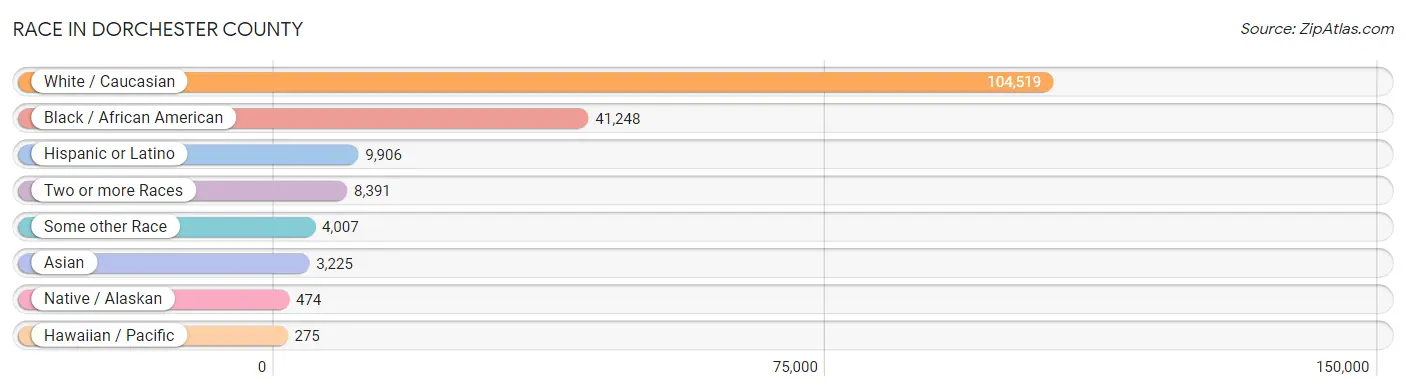
| Race | # Population | % Population |
| Asian | 3,225 | 2.0% |
| Black / African American | 41,248 | 25.4% |
| Hawaiian / Pacific | 275 | 0.2% |
| Hispanic or Latino | 9,906 | 6.1% |
| Native / Alaskan | 474 | 0.3% |
| White / Caucasian | 104,519 | 64.5% |
| Two or more Races | 8,391 | 5.2% |
| Some other Race | 4,007 | 2.5% |
| Total | 162,139 | 100.0% |
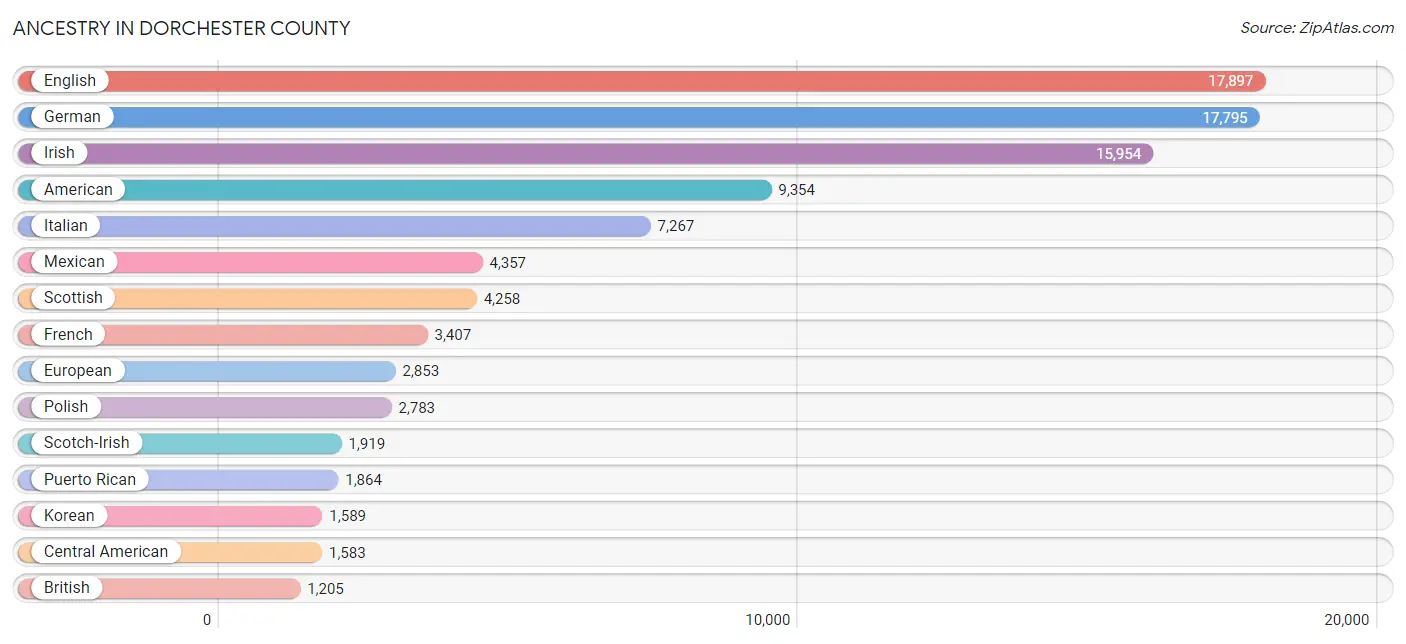
Ancestry in Dorchester County
The most populous ancestries reported in Dorchester County are English (17,897 | 11.0%), German (17,795 | 11.0%), Irish (15,954 | 9.8%), American (9,354 | 5.8%), and Italian (7,267 | 4.5%), together accounting for 42.1% of all Dorchester County residents.
| Ancestry | # Population | % Population |
| African | 755 | 0.5% |
| Albanian | 25 | 0.0% |
| American | 9,354 | 5.8% |
| Apache | 89 | 0.1% |
| Arab | 443 | 0.3% |
| Argentinean | 11 | 0.0% |
| Armenian | 130 | 0.1% |
| Australian | 52 | 0.0% |
| Austrian | 194 | 0.1% |
| Barbadian | 2 | 0.0% |
| Belgian | 216 | 0.1% |
| Belizean | 13 | 0.0% |
| Bermudan | 47 | 0.0% |
| Bhutanese | 359 | 0.2% |
| Blackfeet | 29 | 0.0% |
| Brazilian | 449 | 0.3% |
| British | 1,205 | 0.7% |
| Burmese | 314 | 0.2% |
| Cajun | 46 | 0.0% |
| Canadian | 334 | 0.2% |
| Central American | 1,583 | 1.0% |
| Cherokee | 516 | 0.3% |
| Chickasaw | 11 | 0.0% |
| Chilean | 23 | 0.0% |
| Choctaw | 46 | 0.0% |
| Colombian | 316 | 0.2% |
| Costa Rican | 37 | 0.0% |
| Croatian | 270 | 0.2% |
| Cuban | 254 | 0.2% |
| Czech | 422 | 0.3% |
| Czechoslovakian | 75 | 0.1% |
| Danish | 410 | 0.3% |
| Dominican | 377 | 0.2% |
| Dutch | 931 | 0.6% |
| Eastern European | 240 | 0.2% |
| Ecuadorian | 53 | 0.0% |
| Egyptian | 18 | 0.0% |
| English | 17,897 | 11.0% |
| Estonian | 25 | 0.0% |
| Ethiopian | 27 | 0.0% |
| European | 2,853 | 1.8% |
| Filipino | 105 | 0.1% |
| Finnish | 283 | 0.2% |
| French | 3,407 | 2.1% |
| French American Indian | 19 | 0.0% |
| French Canadian | 880 | 0.5% |
| German | 17,795 | 11.0% |
| German Russian | 13 | 0.0% |
| Ghanaian | 2 | 0.0% |
| Greek | 646 | 0.4% |
| Guamanian / Chamorro | 22 | 0.0% |
| Guatemalan | 773 | 0.5% |
| Haitian | 80 | 0.1% |
| Honduran | 375 | 0.2% |
| Hungarian | 287 | 0.2% |
| Icelander | 17 | 0.0% |
| Indian (Asian) | 878 | 0.5% |
| Irish | 15,954 | 9.8% |
| Iroquois | 11 | 0.0% |
| Israeli | 55 | 0.0% |
| Italian | 7,267 | 4.5% |
| Jamaican | 207 | 0.1% |
| Japanese | 15 | 0.0% |
| Jordanian | 13 | 0.0% |
| Korean | 1,589 | 1.0% |
| Lebanese | 354 | 0.2% |
| Lithuanian | 122 | 0.1% |
| Luxembourger | 22 | 0.0% |
| Malaysian | 96 | 0.1% |
| Mexican | 4,357 | 2.7% |
| Mexican American Indian | 57 | 0.0% |
| Native Hawaiian | 112 | 0.1% |
| Navajo | 14 | 0.0% |
| Nicaraguan | 129 | 0.1% |
| Nigerian | 22 | 0.0% |
| Northern European | 95 | 0.1% |
| Norwegian | 746 | 0.5% |
| Osage | 60 | 0.0% |
| Pakistani | 32 | 0.0% |
| Palestinian | 33 | 0.0% |
| Panamanian | 220 | 0.1% |
| Pennsylvania German | 15 | 0.0% |
| Peruvian | 163 | 0.1% |
| Polish | 2,783 | 1.7% |
| Portuguese | 484 | 0.3% |
| Puerto Rican | 1,864 | 1.1% |
| Romanian | 251 | 0.2% |
| Russian | 613 | 0.4% |
| Salvadoran | 49 | 0.0% |
| Scandinavian | 524 | 0.3% |
| Scotch-Irish | 1,919 | 1.2% |
| Scottish | 4,258 | 2.6% |
| Serbian | 15 | 0.0% |
| Sierra Leonean | 24 | 0.0% |
| Slavic | 22 | 0.0% |
| Slovak | 192 | 0.1% |
| Slovene | 15 | 0.0% |
| South American | 782 | 0.5% |
| Spaniard | 88 | 0.1% |
| Spanish | 269 | 0.2% |
| Sri Lankan | 670 | 0.4% |
| Subsaharan African | 830 | 0.5% |
| Swedish | 1,030 | 0.6% |
| Swiss | 120 | 0.1% |
| Syrian | 23 | 0.0% |
| Thai | 469 | 0.3% |
| Trinidadian and Tobagonian | 13 | 0.0% |
| U.S. Virgin Islander | 45 | 0.0% |
| Ukrainian | 344 | 0.2% |
| Ute | 14 | 0.0% |
| Venezuelan | 216 | 0.1% |
| Vietnamese | 94 | 0.1% |
| Welsh | 631 | 0.4% |
| West Indian | 126 | 0.1% |
| Yugoslavian | 15 | 0.0% | View All 115 Rows |
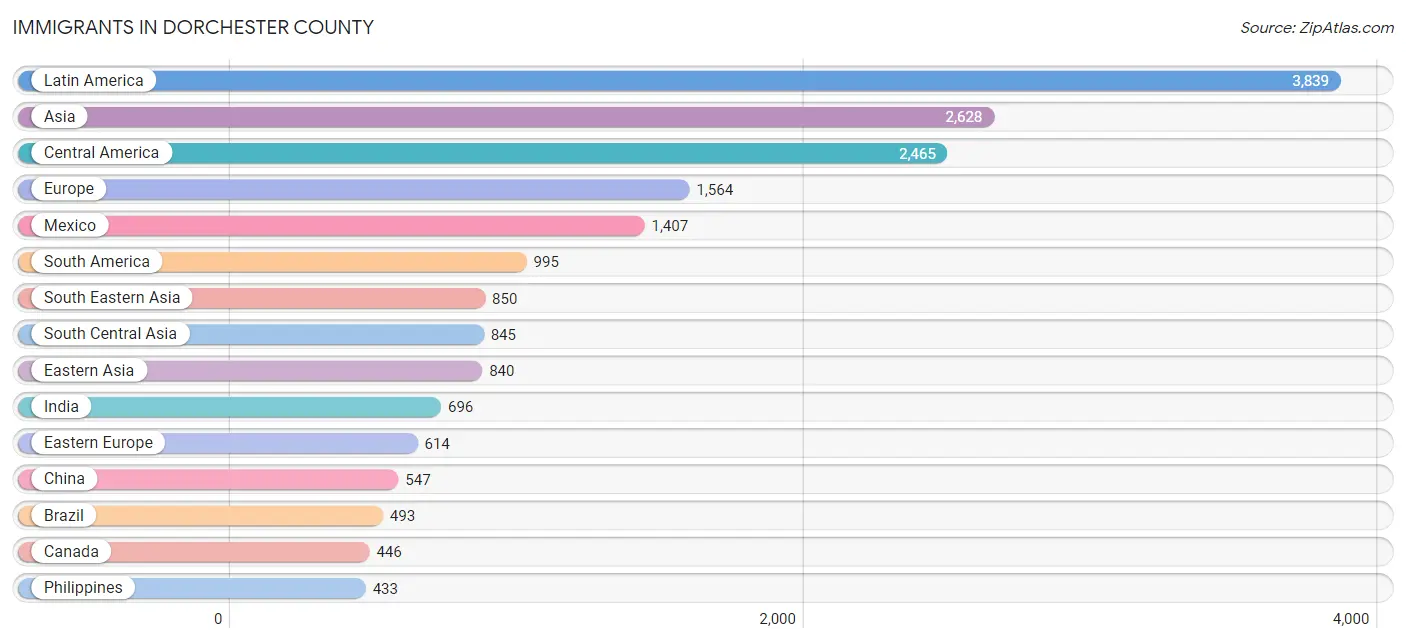
Immigrants in Dorchester County
The most numerous immigrant groups reported in Dorchester County came from Latin America (3,839 | 2.4%), Asia (2,628 | 1.6%), Central America (2,465 | 1.5%), Europe (1,564 | 1.0%), and Mexico (1,407 | 0.9%), together accounting for 7.3% of all Dorchester County residents.
| Immigration Origin | # Population | % Population |
| Afghanistan | 44 | 0.0% |
| Africa | 135 | 0.1% |
| Albania | 25 | 0.0% |
| Asia | 2,628 | 1.6% |
| Austria | 26 | 0.0% |
| Bahamas | 42 | 0.0% |
| Bangladesh | 67 | 0.0% |
| Belize | 40 | 0.0% |
| Bolivia | 14 | 0.0% |
| Brazil | 493 | 0.3% |
| Bulgaria | 49 | 0.0% |
| Cambodia | 32 | 0.0% |
| Canada | 446 | 0.3% |
| Caribbean | 379 | 0.2% |
| Central America | 2,465 | 1.5% |
| China | 547 | 0.3% |
| Colombia | 151 | 0.1% |
| Costa Rica | 22 | 0.0% |
| Cuba | 12 | 0.0% |
| Czechoslovakia | 52 | 0.0% |
| Dominican Republic | 118 | 0.1% |
| Eastern Africa | 94 | 0.1% |
| Eastern Asia | 840 | 0.5% |
| Eastern Europe | 614 | 0.4% |
| Ecuador | 41 | 0.0% |
| England | 133 | 0.1% |
| Ethiopia | 28 | 0.0% |
| Europe | 1,564 | 1.0% |
| France | 61 | 0.0% |
| Germany | 266 | 0.2% |
| Greece | 71 | 0.0% |
| Guatemala | 398 | 0.3% |
| Guyana | 163 | 0.1% |
| Honduras | 378 | 0.2% |
| Hong Kong | 153 | 0.1% |
| Hungary | 16 | 0.0% |
| India | 696 | 0.4% |
| Israel | 69 | 0.0% |
| Italy | 50 | 0.0% |
| Jamaica | 105 | 0.1% |
| Japan | 80 | 0.1% |
| Jordan | 13 | 0.0% |
| Kazakhstan | 16 | 0.0% |
| Kenya | 66 | 0.0% |
| Korea | 213 | 0.1% |
| Latin America | 3,839 | 2.4% |
| Mexico | 1,407 | 0.9% |
| Micronesia | 97 | 0.1% |
| Northern Africa | 8 | 0.0% |
| Northern Europe | 370 | 0.2% |
| Oceania | 104 | 0.1% |
| Panama | 220 | 0.1% |
| Philippines | 433 | 0.3% |
| Poland | 91 | 0.1% |
| Portugal | 9 | 0.0% |
| Romania | 157 | 0.1% |
| Russia | 136 | 0.1% |
| Saudi Arabia | 11 | 0.0% |
| Scotland | 182 | 0.1% |
| South Africa | 33 | 0.0% |
| South America | 995 | 0.6% |
| South Central Asia | 845 | 0.5% |
| South Eastern Asia | 850 | 0.5% |
| Southern Europe | 175 | 0.1% |
| Spain | 45 | 0.0% |
| Sri Lanka | 1 | 0.0% |
| Taiwan | 91 | 0.1% |
| Thailand | 124 | 0.1% |
| Trinidad and Tobago | 44 | 0.0% |
| Ukraine | 88 | 0.1% |
| Uzbekistan | 21 | 0.0% |
| Venezuela | 133 | 0.1% |
| Vietnam | 261 | 0.2% |
| Western Asia | 93 | 0.1% |
| Western Europe | 353 | 0.2% | View All 75 Rows |
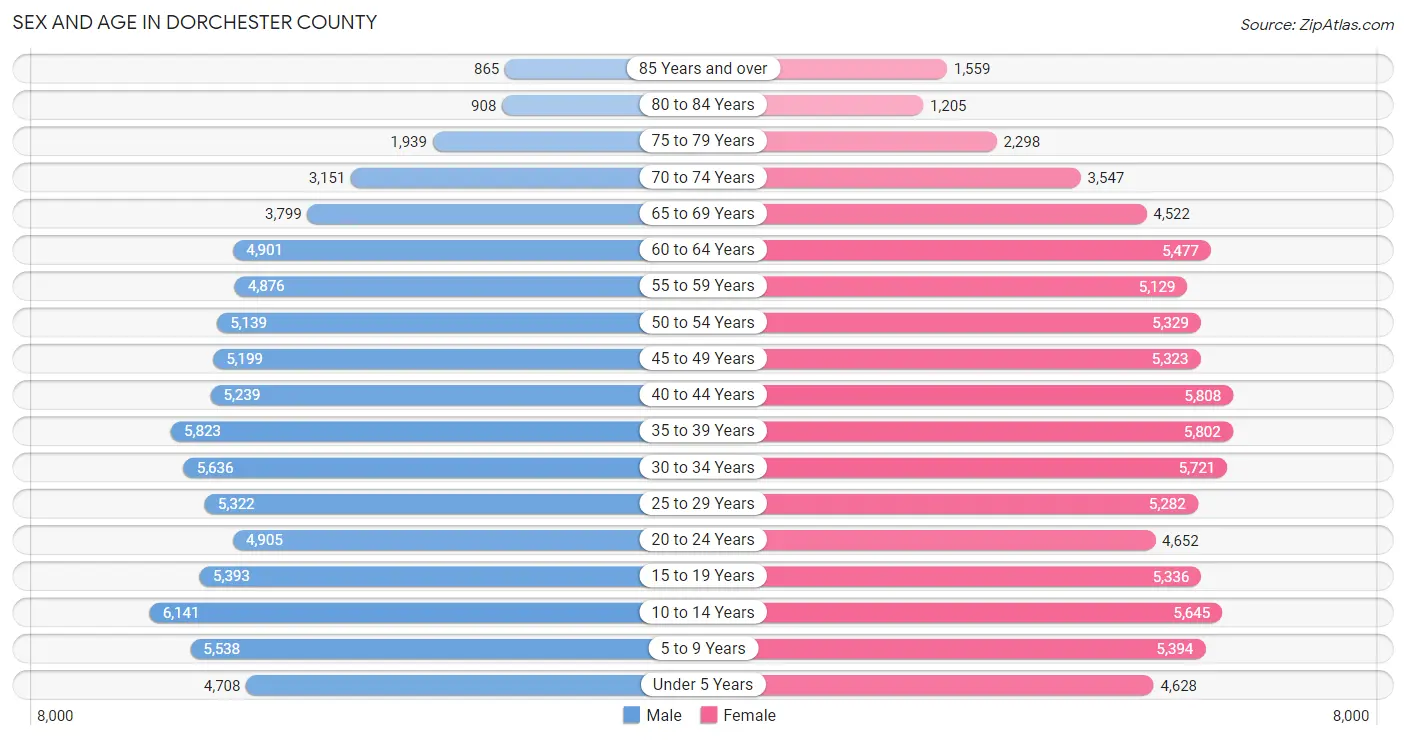
Sex and Age in Dorchester County
Sex and Age in Dorchester County
The most populous age groups in Dorchester County are 10 to 14 Years (6,141 | 7.7%) for men and 40 to 44 Years (5,808 | 7.0%) for women.
| Age Bracket | Male | Female |
| Under 5 Years | 4,708 (5.9%) | 4,628 (5.6%) |
| 5 to 9 Years | 5,538 (7.0%) | 5,394 (6.5%) |
| 10 to 14 Years | 6,141 (7.7%) | 5,645 (6.8%) |
| 15 to 19 Years | 5,393 (6.8%) | 5,336 (6.5%) |
| 20 to 24 Years | 4,905 (6.2%) | 4,652 (5.6%) |
| 25 to 29 Years | 5,322 (6.7%) | 5,282 (6.4%) |
| 30 to 34 Years | 5,636 (7.1%) | 5,721 (6.9%) |
| 35 to 39 Years | 5,823 (7.3%) | 5,802 (7.0%) |
| 40 to 44 Years | 5,239 (6.6%) | 5,808 (7.0%) |
| 45 to 49 Years | 5,199 (6.5%) | 5,323 (6.4%) |
| 50 to 54 Years | 5,139 (6.5%) | 5,329 (6.5%) |
| 55 to 59 Years | 4,876 (6.1%) | 5,129 (6.2%) |
| 60 to 64 Years | 4,901 (6.2%) | 5,477 (6.6%) |
| 65 to 69 Years | 3,799 (4.8%) | 4,522 (5.5%) |
| 70 to 74 Years | 3,151 (4.0%) | 3,547 (4.3%) |
| 75 to 79 Years | 1,939 (2.4%) | 2,298 (2.8%) |
| 80 to 84 Years | 908 (1.1%) | 1,205 (1.5%) |
| 85 Years and over | 865 (1.1%) | 1,559 (1.9%) |
| Total | 79,482 (100.0%) | 82,657 (100.0%) |
Families and Households in Dorchester County
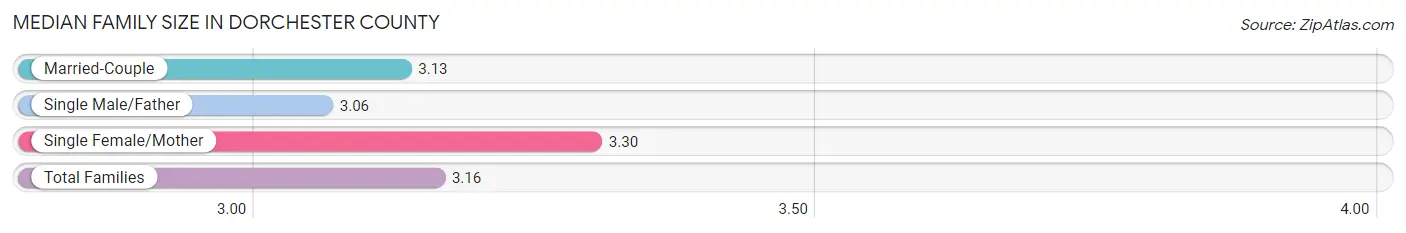
Median Family Size in Dorchester County
The median family size in Dorchester County is 3.16 persons per family, with single female/mother families (8,343 | 19.6%) accounting for the largest median family size of 3.3 persons per family. On the other hand, single male/father families (2,410 | 5.7%) represent the smallest median family size with 3.06 persons per family.
| Family Type | # Families | Family Size |
| Married-Couple | 31,728 (74.7%) | 3.13 |
| Single Male/Father | 2,410 (5.7%) | 3.06 |
| Single Female/Mother | 8,343 (19.6%) | 3.30 |
| Total Families | 42,481 (100.0%) | 3.16 |
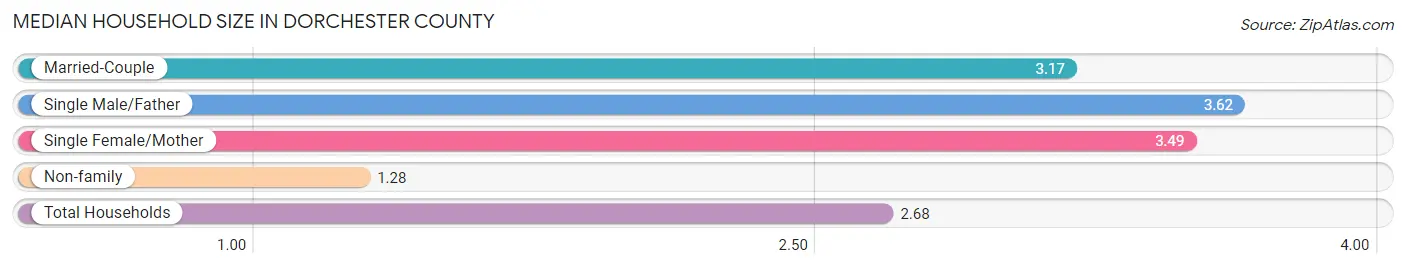
Median Household Size in Dorchester County
The median household size in Dorchester County is 2.68 persons per household, with single male/father households (2,410 | 4.0%) accounting for the largest median household size of 3.62 persons per household. non-family households (17,250 | 28.9%) represent the smallest median household size with 1.28 persons per household.
| Household Type | # Households | Household Size |
| Married-Couple | 31,728 (53.1%) | 3.17 |
| Single Male/Father | 2,410 (4.0%) | 3.62 |
| Single Female/Mother | 8,343 (14.0%) | 3.49 |
| Non-family | 17,250 (28.9%) | 1.28 |
| Total Households | 59,731 (100.0%) | 2.68 |
Household Size by Marriage Status in Dorchester County
Out of a total of 59,731 households in Dorchester County, 42,481 (71.1%) are family households, while 17,250 (28.9%) are nonfamily households. The most numerous type of family households are 2-person households, comprising 19,005, and the most common type of nonfamily households are 1-person households, comprising 14,486.
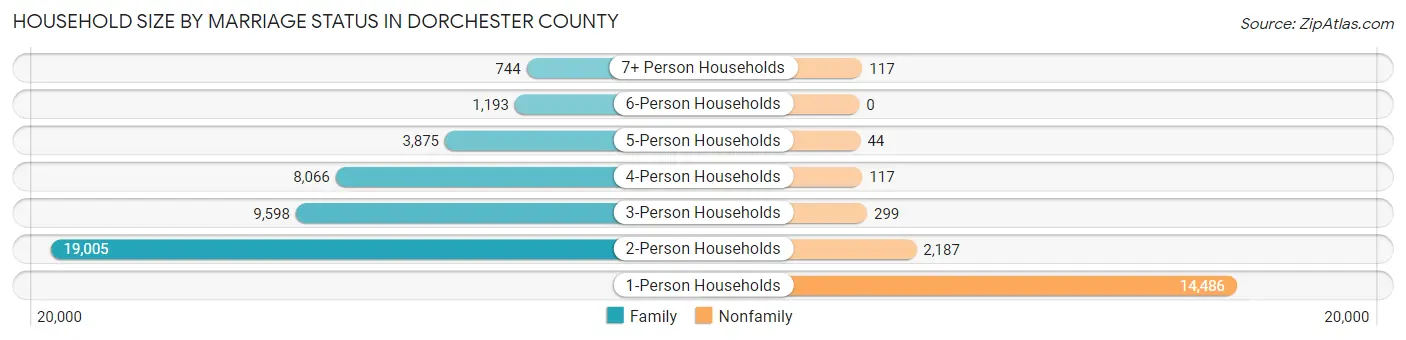
| Household Size | Family Households | Nonfamily Households |
| 1-Person Households | - | 14,486 (24.2%) |
| 2-Person Households | 19,005 (31.8%) | 2,187 (3.7%) |
| 3-Person Households | 9,598 (16.1%) | 299 (0.5%) |
| 4-Person Households | 8,066 (13.5%) | 117 (0.2%) |
| 5-Person Households | 3,875 (6.5%) | 44 (0.1%) |
| 6-Person Households | 1,193 (2.0%) | 0 (0.0%) |
| 7+ Person Households | 744 (1.3%) | 117 (0.2%) |
| Total | 42,481 (71.1%) | 17,250 (28.9%) |
Female Fertility in Dorchester County
Fertility by Age in Dorchester County
Average fertility rate in Dorchester County is 58.0 births per 1,000 women. Women in the age bracket of 20 to 34 years have the highest fertility rate with 103.0 births per 1,000 women. Women in the age bracket of 20 to 34 years acount for 72.4% of all women with births.
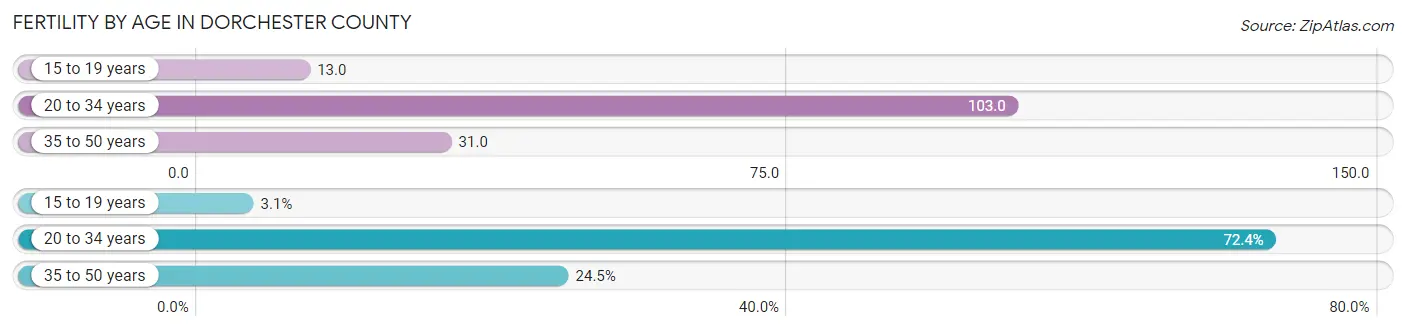
| Age Bracket | Women with Births | Births / 1,000 Women |
| 15 to 19 years | 69 (3.1%) | 13.0 |
| 20 to 34 years | 1,619 (72.4%) | 103.0 |
| 35 to 50 years | 547 (24.5%) | 31.0 |
| Total | 2,235 (100.0%) | 58.0 |
Fertility by Age by Marriage Status in Dorchester County
55.7% of women with births (2,235) in Dorchester County are married. The highest percentage of unmarried women with births falls into 20 to 34 years age bracket with 53.8% of them unmarried at the time of birth, while the lowest percentage of unmarried women with births belong to 35 to 50 years age bracket with 15.9% of them unmarried.
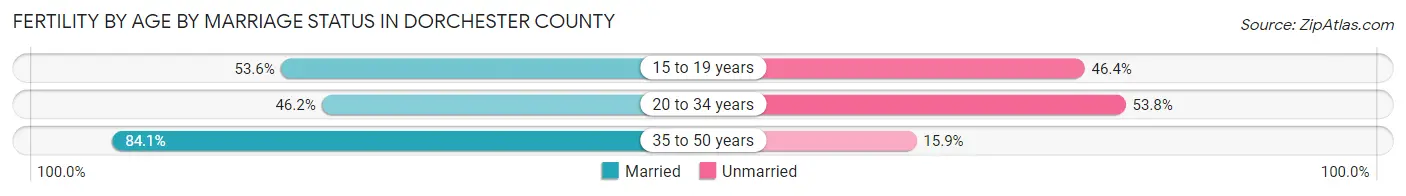
| Age Bracket | Married | Unmarried |
| 15 to 19 years | 37 (53.6%) | 32 (46.4%) |
| 20 to 34 years | 748 (46.2%) | 871 (53.8%) |
| 35 to 50 years | 460 (84.1%) | 87 (15.9%) |
| Total | 1,245 (55.7%) | 990 (44.3%) |
Fertility by Education in Dorchester County
Average fertility rate in Dorchester County is 58.0 births per 1,000 women. Women with the education attainment of graduate degree have the highest fertility rate of 113.0 births per 1,000 women, while women with the education attainment of high school diploma have the lowest fertility at 42.0 births per 1,000 women. Women with the education attainment of college or associate's degree represent 32.2% of all women with births.
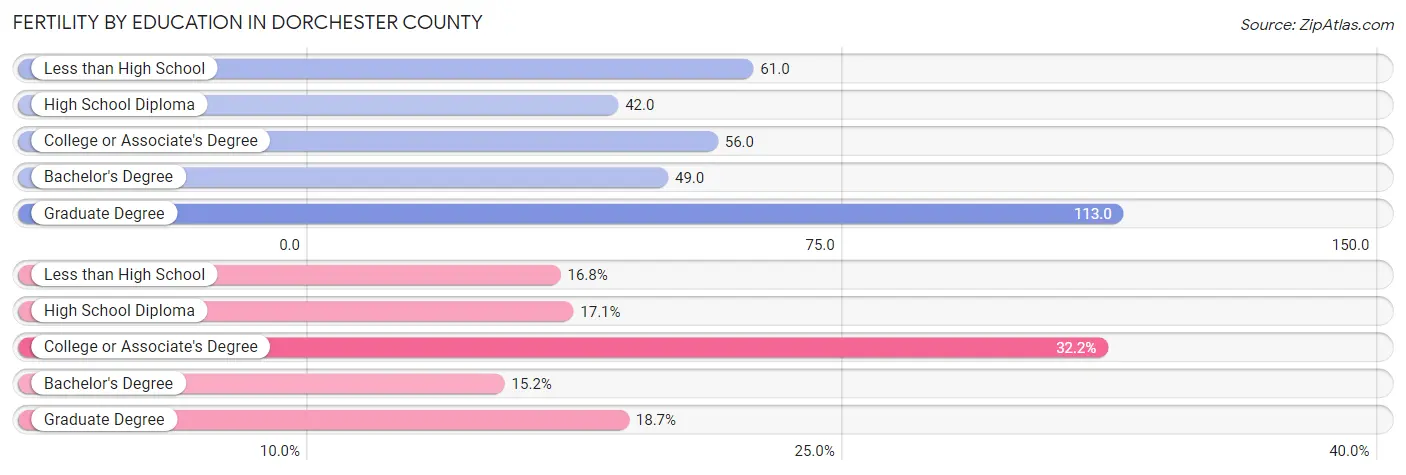
| Educational Attainment | Women with Births | Births / 1,000 Women |
| Less than High School | 375 (16.8%) | 61.0 |
| High School Diploma | 383 (17.1%) | 42.0 |
| College or Associate's Degree | 719 (32.2%) | 56.0 |
| Bachelor's Degree | 340 (15.2%) | 49.0 |
| Graduate Degree | 418 (18.7%) | 113.0 |
| Total | 2,235 (100.0%) | 58.0 |
Fertility by Education by Marriage Status in Dorchester County
44.3% of women with births in Dorchester County are unmarried. Women with the educational attainment of bachelor's degree are most likely to be married with 93.2% of them married at childbirth, while women with the educational attainment of high school diploma are least likely to be married with 74.9% of them unmarried at childbirth.
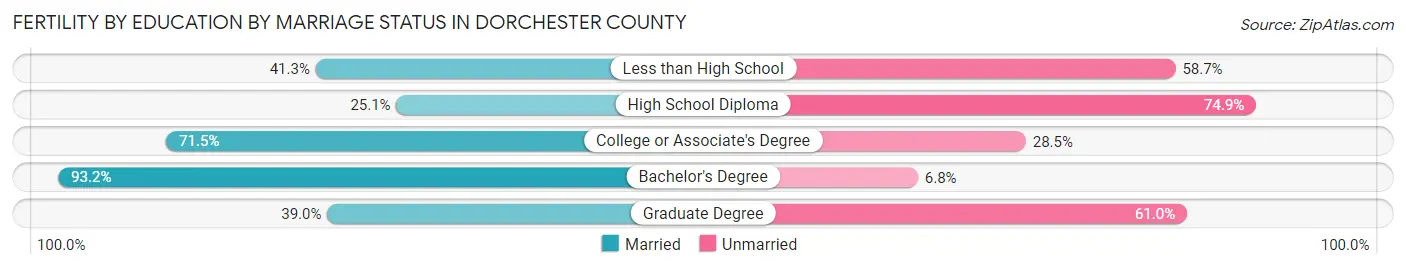
| Educational Attainment | Married | Unmarried |
| Less than High School | 155 (41.3%) | 220 (58.7%) |
| High School Diploma | 96 (25.1%) | 287 (74.9%) |
| College or Associate's Degree | 514 (71.5%) | 205 (28.5%) |
| Bachelor's Degree | 317 (93.2%) | 23 (6.8%) |
| Graduate Degree | 163 (39.0%) | 255 (61.0%) |
| Total | 1,245 (55.7%) | 990 (44.3%) |
Employment Characteristics in Dorchester County
Employment by Class of Employer in Dorchester County
Among the 77,259 employed individuals in Dorchester County, private company employees (51,619 | 66.8%), federal government employees (5,631 | 7.3%), and local government employees (5,406 | 7.0%) make up the most common classes of employment.
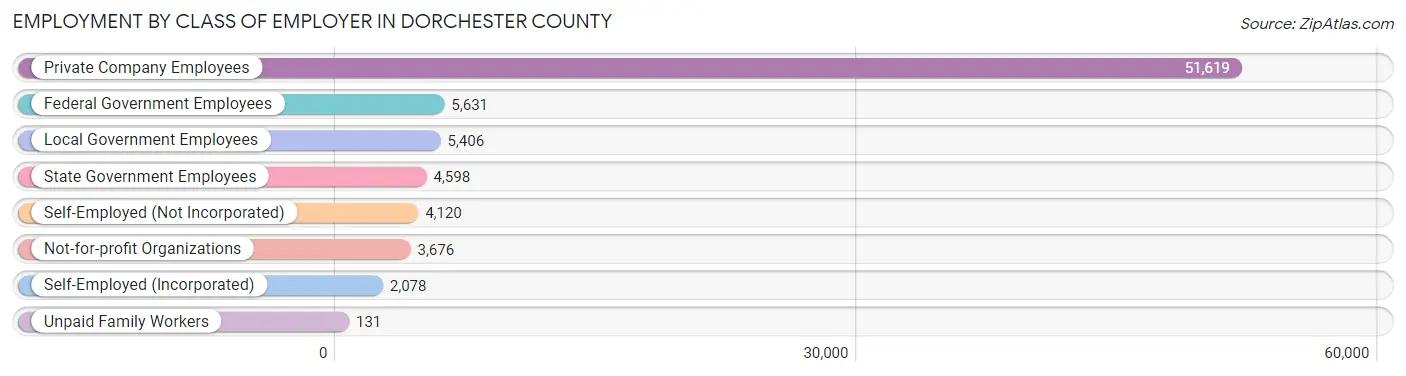
| Employer Class | # Employees | % Employees |
| Private Company Employees | 51,619 | 66.8% |
| Self-Employed (Incorporated) | 2,078 | 2.7% |
| Self-Employed (Not Incorporated) | 4,120 | 5.3% |
| Not-for-profit Organizations | 3,676 | 4.8% |
| Local Government Employees | 5,406 | 7.0% |
| State Government Employees | 4,598 | 5.9% |
| Federal Government Employees | 5,631 | 7.3% |
| Unpaid Family Workers | 131 | 0.2% |
| Total | 77,259 | 100.0% |
Employment Status by Age in Dorchester County
According to the labor force statistics for Dorchester County, out of the total population over 16 years of age (128,040), 65.1% or 83,354 individuals are in the labor force, with 5.5% or 4,584 of them unemployed. The age group with the highest labor force participation rate is 20 to 24 years, with 84.1% or 8,037 individuals in the labor force. Within the labor force, the 16 to 19 years age range has the highest percentage of unemployed individuals, with 16.7% or 605 of them being unemployed.
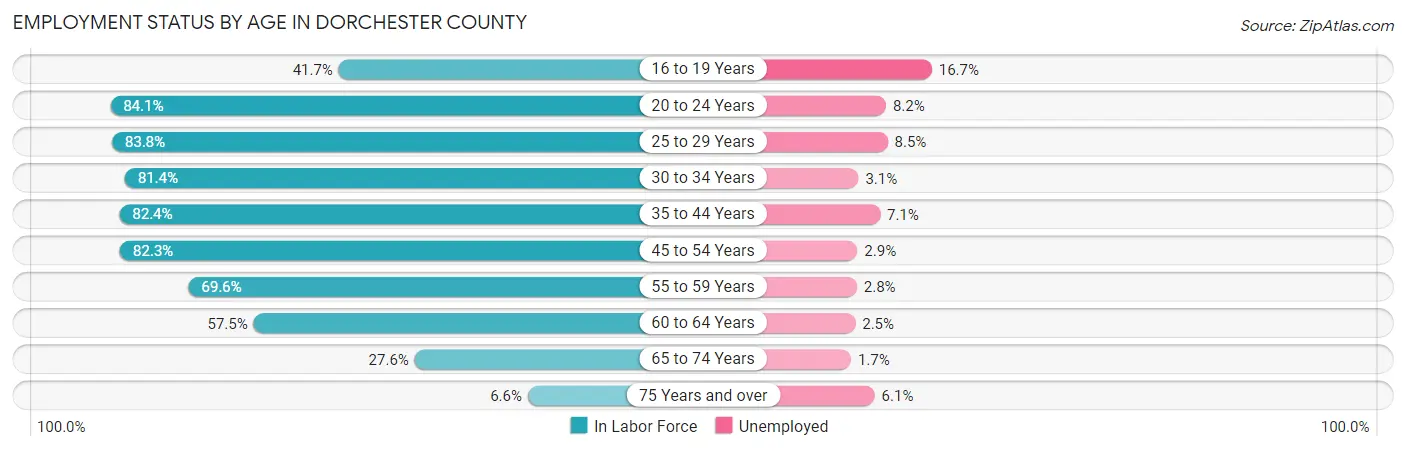
| Age Bracket | In Labor Force | Unemployed |
| 16 to 19 Years | 3,621 (41.7%) | 605 (16.7%) |
| 20 to 24 Years | 8,037 (84.1%) | 659 (8.2%) |
| 25 to 29 Years | 8,886 (83.8%) | 755 (8.5%) |
| 30 to 34 Years | 9,245 (81.4%) | 287 (3.1%) |
| 35 to 44 Years | 18,682 (82.4%) | 1,326 (7.1%) |
| 45 to 54 Years | 17,275 (82.3%) | 501 (2.9%) |
| 55 to 59 Years | 6,963 (69.6%) | 195 (2.8%) |
| 60 to 64 Years | 5,967 (57.5%) | 149 (2.5%) |
| 65 to 74 Years | 4,145 (27.6%) | 70 (1.7%) |
| 75 Years and over | 579 (6.6%) | 35 (6.1%) |
| Total | 83,354 (65.1%) | 4,584 (5.5%) |
Employment Status by Educational Attainment in Dorchester County
According to labor force statistics for Dorchester County, 77.9% of individuals (66,999) out of the total population between 25 and 64 years of age (86,006) are in the labor force, with 4.8% or 3,216 of them being unemployed. The group with the highest labor force participation rate are those with the educational attainment of bachelor's degree or higher, with 87.1% or 22,422 individuals in the labor force. Within the labor force, individuals with less than high school education have the highest percentage of unemployment, with 6.3% or 229 of them being unemployed.
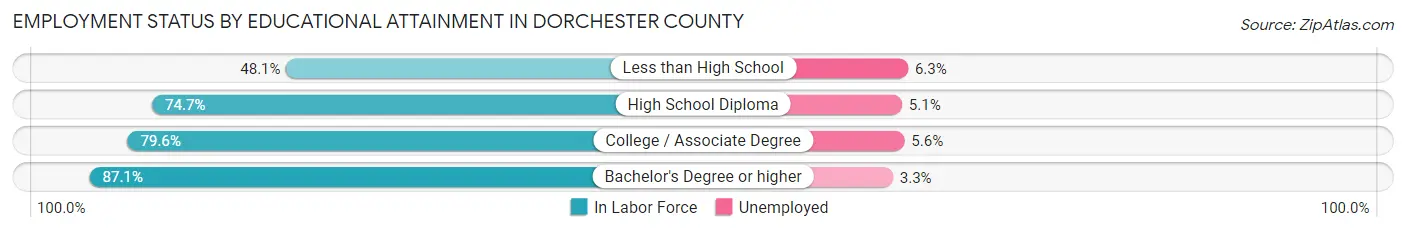
| Educational Attainment | In Labor Force | Unemployed |
| Less than High School | 3,631 (48.1%) | 476 (6.3%) |
| High School Diploma | 15,390 (74.7%) | 1,051 (5.1%) |
| College / Associate Degree | 25,561 (79.6%) | 1,798 (5.6%) |
| Bachelor's Degree or higher | 22,422 (87.1%) | 850 (3.3%) |
| Total | 66,999 (77.9%) | 4,128 (4.8%) |
Employment Occupations by Sex in Dorchester County
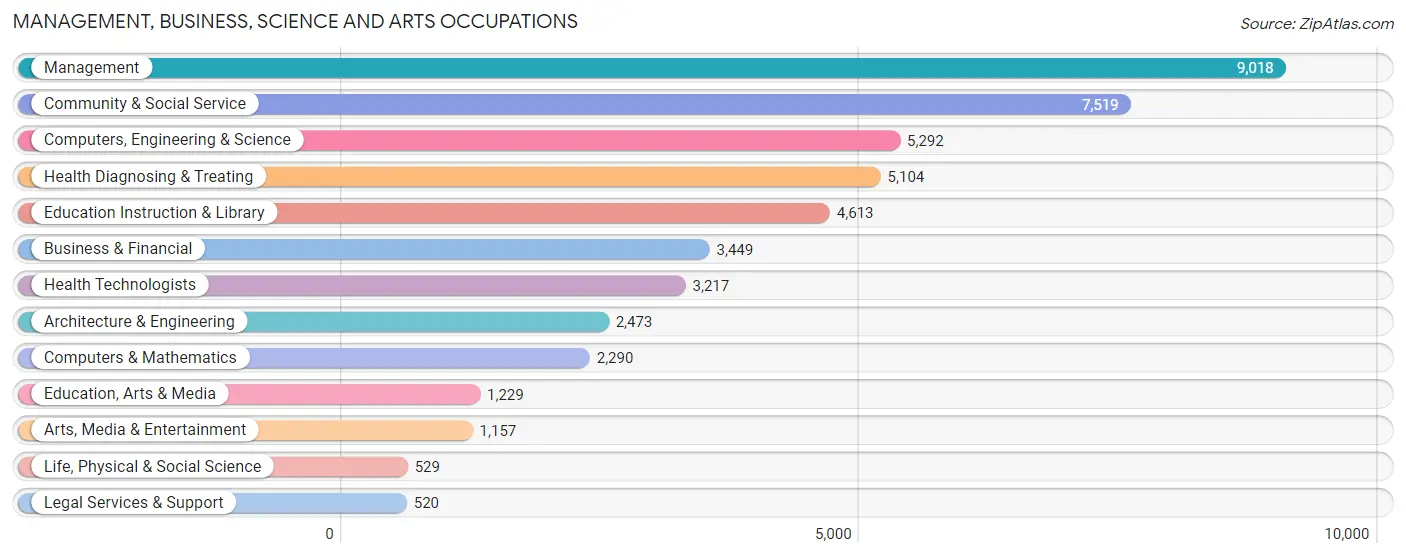
Management, Business, Science and Arts Occupations
The most common Management, Business, Science and Arts occupations in Dorchester County are Management (9,018 | 11.6%), Community & Social Service (7,519 | 9.7%), Computers, Engineering & Science (5,292 | 6.8%), Health Diagnosing & Treating (5,104 | 6.6%), and Education Instruction & Library (4,613 | 5.9%).
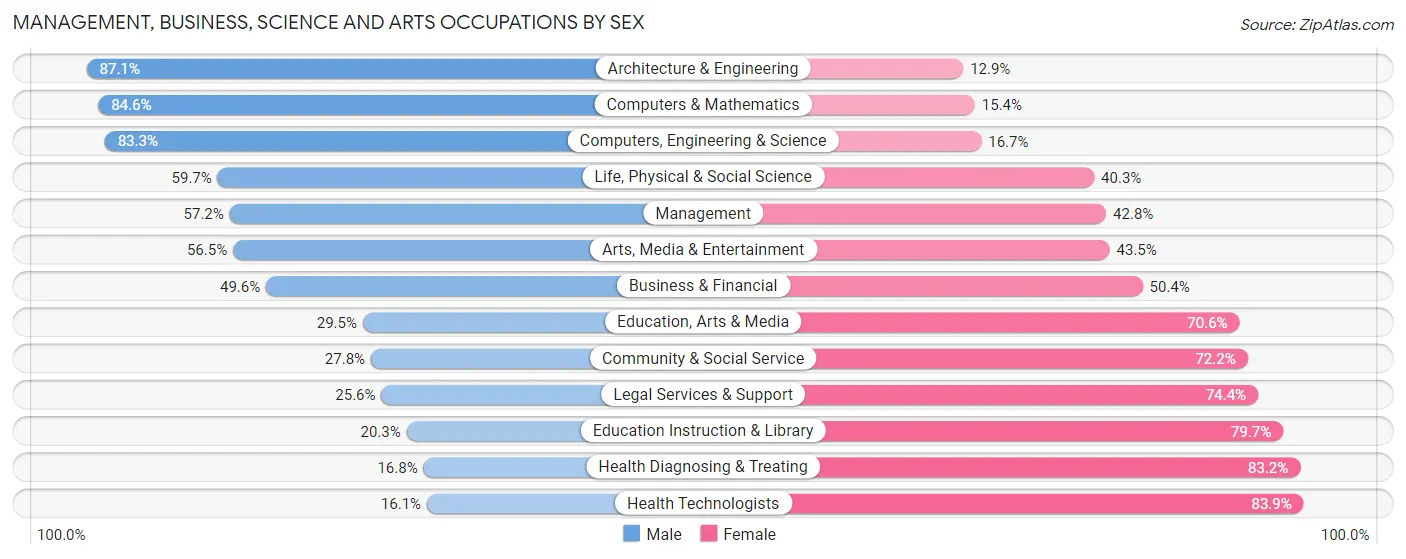
Management, Business, Science and Arts Occupations by Sex
Within the Management, Business, Science and Arts occupations in Dorchester County, the most male-oriented occupations are Architecture & Engineering (87.1%), Computers & Mathematics (84.6%), and Computers, Engineering & Science (83.3%), while the most female-oriented occupations are Health Technologists (83.9%), Health Diagnosing & Treating (83.2%), and Education Instruction & Library (79.7%).
| Occupation | Male | Female |
| Management | 5,162 (57.2%) | 3,856 (42.8%) |
| Business & Financial | 1,712 (49.6%) | 1,737 (50.4%) |
| Computers, Engineering & Science | 4,407 (83.3%) | 885 (16.7%) |
| Computers & Mathematics | 1,938 (84.6%) | 352 (15.4%) |
| Architecture & Engineering | 2,153 (87.1%) | 320 (12.9%) |
| Life, Physical & Social Science | 316 (59.7%) | 213 (40.3%) |
| Community & Social Service | 2,087 (27.8%) | 5,432 (72.2%) |
| Education, Arts & Media | 362 (29.4%) | 867 (70.6%) |
| Legal Services & Support | 133 (25.6%) | 387 (74.4%) |
| Education Instruction & Library | 938 (20.3%) | 3,675 (79.7%) |
| Arts, Media & Entertainment | 654 (56.5%) | 503 (43.5%) |
| Health Diagnosing & Treating | 857 (16.8%) | 4,247 (83.2%) |
| Health Technologists | 517 (16.1%) | 2,700 (83.9%) |
| Total (Category) | 14,225 (46.8%) | 16,157 (53.2%) |
| Total (Overall) | 40,634 (52.4%) | 36,885 (47.6%) |
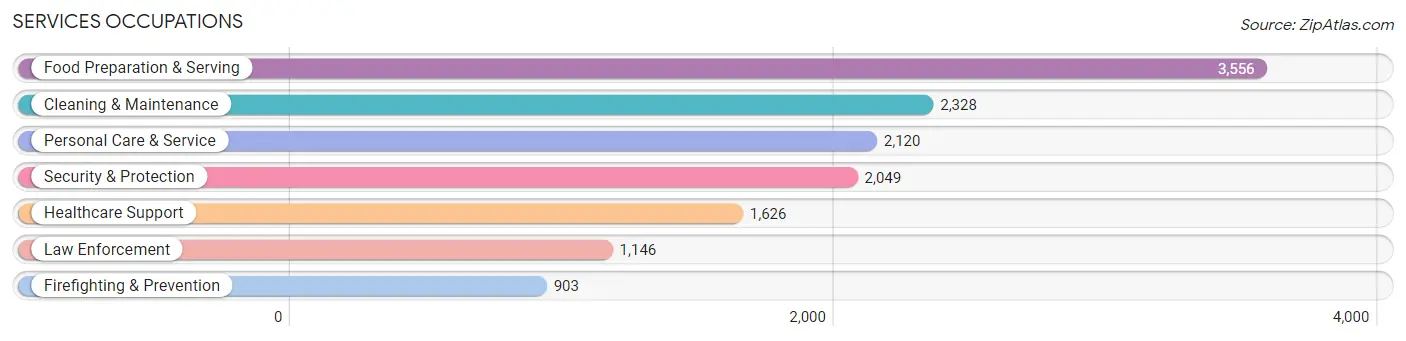
Services Occupations
The most common Services occupations in Dorchester County are Food Preparation & Serving (3,556 | 4.6%), Cleaning & Maintenance (2,328 | 3.0%), Personal Care & Service (2,120 | 2.7%), Security & Protection (2,049 | 2.6%), and Healthcare Support (1,626 | 2.1%).
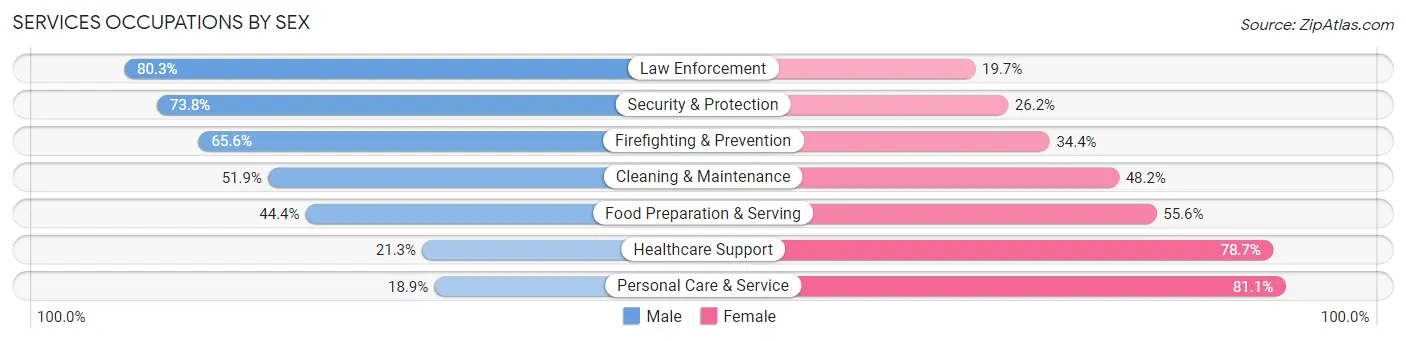
Services Occupations by Sex
Within the Services occupations in Dorchester County, the most male-oriented occupations are Law Enforcement (80.3%), Security & Protection (73.8%), and Firefighting & Prevention (65.6%), while the most female-oriented occupations are Personal Care & Service (81.1%), Healthcare Support (78.7%), and Food Preparation & Serving (55.6%).
| Occupation | Male | Female |
| Healthcare Support | 347 (21.3%) | 1,279 (78.7%) |
| Security & Protection | 1,512 (73.8%) | 537 (26.2%) |
| Firefighting & Prevention | 592 (65.6%) | 311 (34.4%) |
| Law Enforcement | 920 (80.3%) | 226 (19.7%) |
| Food Preparation & Serving | 1,579 (44.4%) | 1,977 (55.6%) |
| Cleaning & Maintenance | 1,207 (51.8%) | 1,121 (48.1%) |
| Personal Care & Service | 401 (18.9%) | 1,719 (81.1%) |
| Total (Category) | 5,046 (43.2%) | 6,633 (56.8%) |
| Total (Overall) | 40,634 (52.4%) | 36,885 (47.6%) |
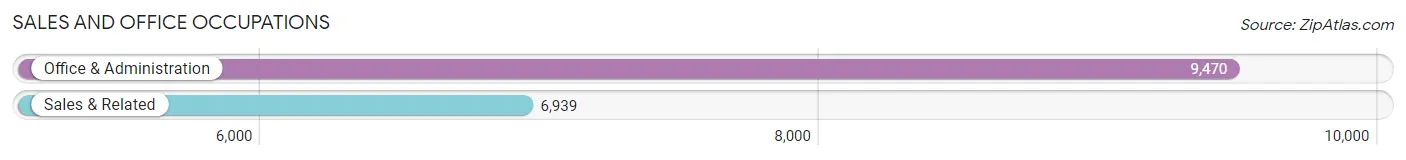
Sales and Office Occupations
The most common Sales and Office occupations in Dorchester County are Office & Administration (9,470 | 12.2%), and Sales & Related (6,939 | 8.9%).
Sales and Office Occupations by Sex
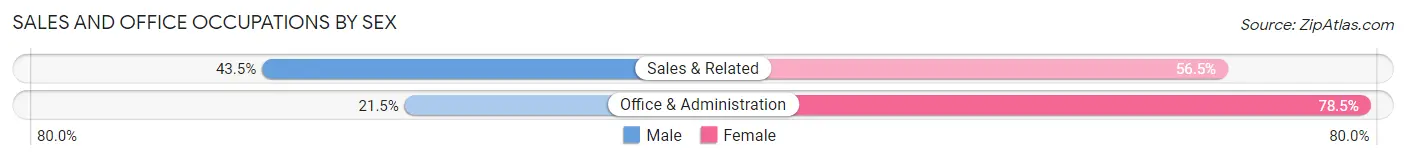
| Occupation | Male | Female |
| Sales & Related | 3,017 (43.5%) | 3,922 (56.5%) |
| Office & Administration | 2,040 (21.5%) | 7,430 (78.5%) |
| Total (Category) | 5,057 (30.8%) | 11,352 (69.2%) |
| Total (Overall) | 40,634 (52.4%) | 36,885 (47.6%) |
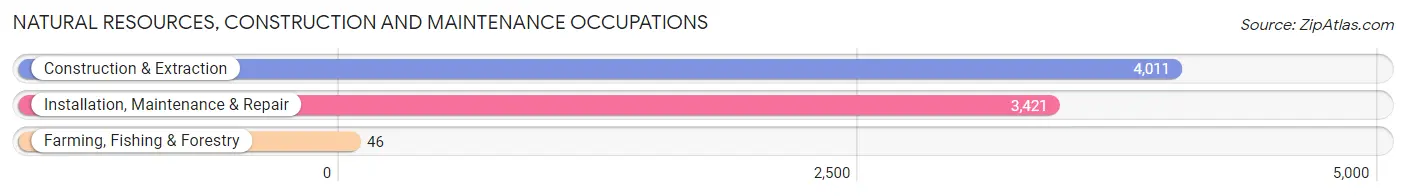
Natural Resources, Construction and Maintenance Occupations
The most common Natural Resources, Construction and Maintenance occupations in Dorchester County are Construction & Extraction (4,011 | 5.2%), Installation, Maintenance & Repair (3,421 | 4.4%), and Farming, Fishing & Forestry (46 | 0.1%).
Natural Resources, Construction and Maintenance Occupations by Sex
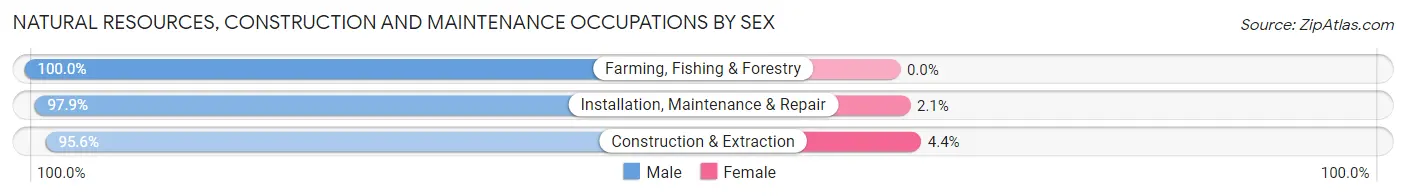
| Occupation | Male | Female |
| Farming, Fishing & Forestry | 46 (100.0%) | 0 (0.0%) |
| Construction & Extraction | 3,836 (95.6%) | 175 (4.4%) |
| Installation, Maintenance & Repair | 3,349 (97.9%) | 72 (2.1%) |
| Total (Category) | 7,231 (96.7%) | 247 (3.3%) |
| Total (Overall) | 40,634 (52.4%) | 36,885 (47.6%) |
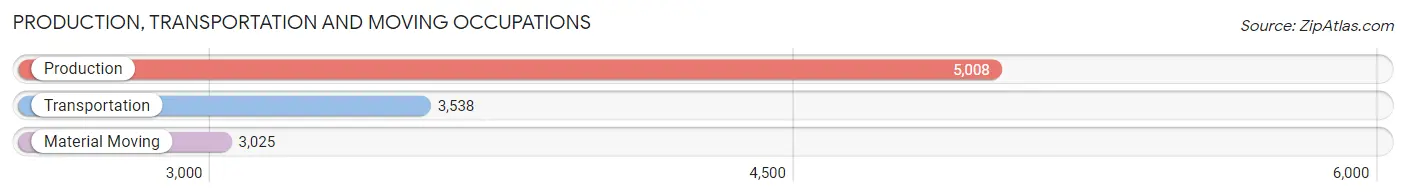
Production, Transportation and Moving Occupations
The most common Production, Transportation and Moving occupations in Dorchester County are Production (5,008 | 6.5%), Transportation (3,538 | 4.6%), and Material Moving (3,025 | 3.9%).
Production, Transportation and Moving Occupations by Sex
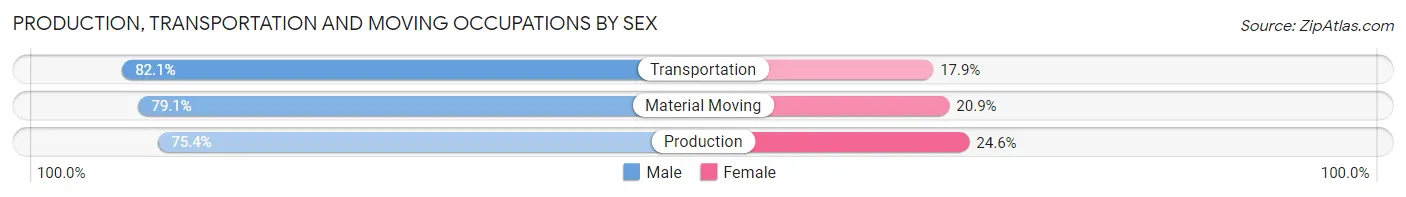
| Occupation | Male | Female |
| Production | 3,778 (75.4%) | 1,230 (24.6%) |
| Transportation | 2,904 (82.1%) | 634 (17.9%) |
| Material Moving | 2,393 (79.1%) | 632 (20.9%) |
| Total (Category) | 9,075 (78.4%) | 2,496 (21.6%) |
| Total (Overall) | 40,634 (52.4%) | 36,885 (47.6%) |
Employment Industries by Sex in Dorchester County
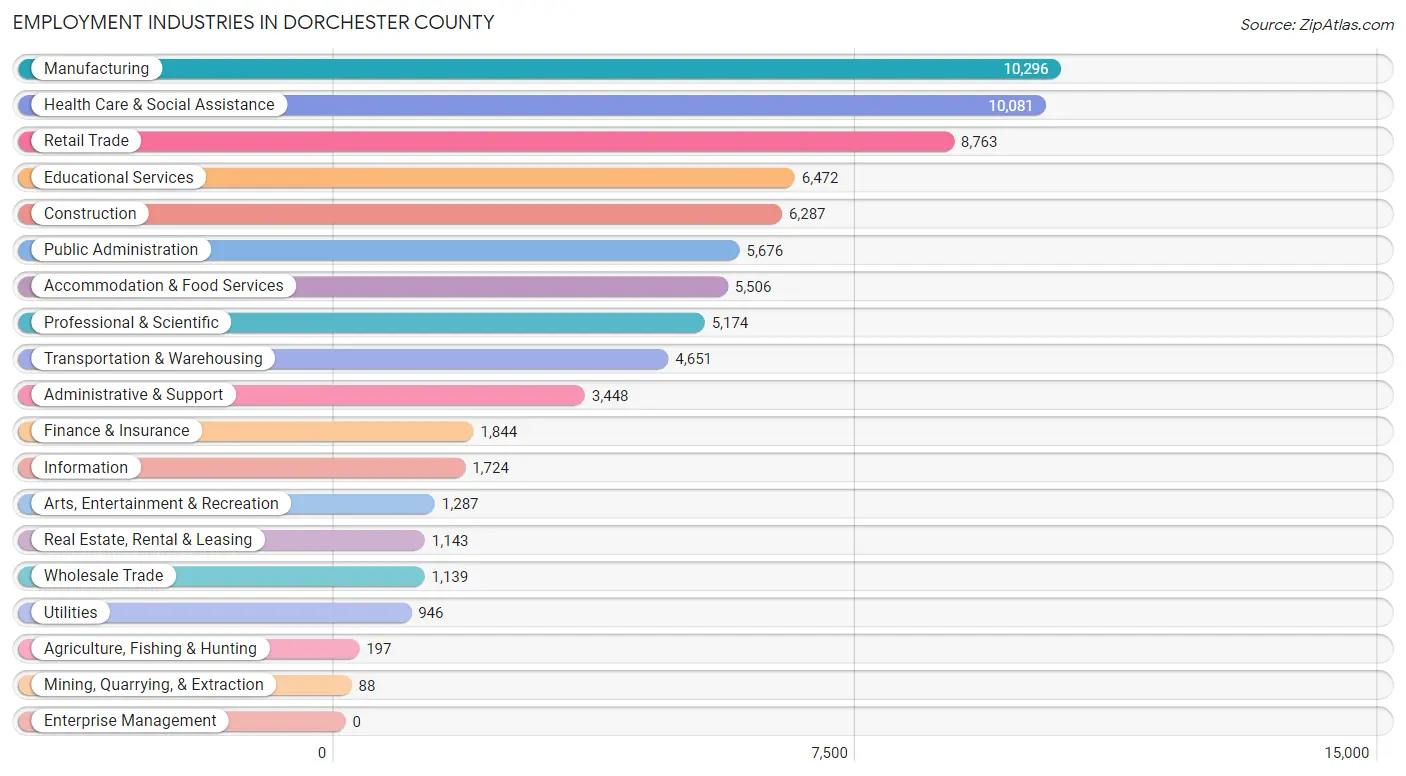
Employment Industries in Dorchester County
The major employment industries in Dorchester County include Manufacturing (10,296 | 13.3%), Health Care & Social Assistance (10,081 | 13.0%), Retail Trade (8,763 | 11.3%), Educational Services (6,472 | 8.4%), and Construction (6,287 | 8.1%).
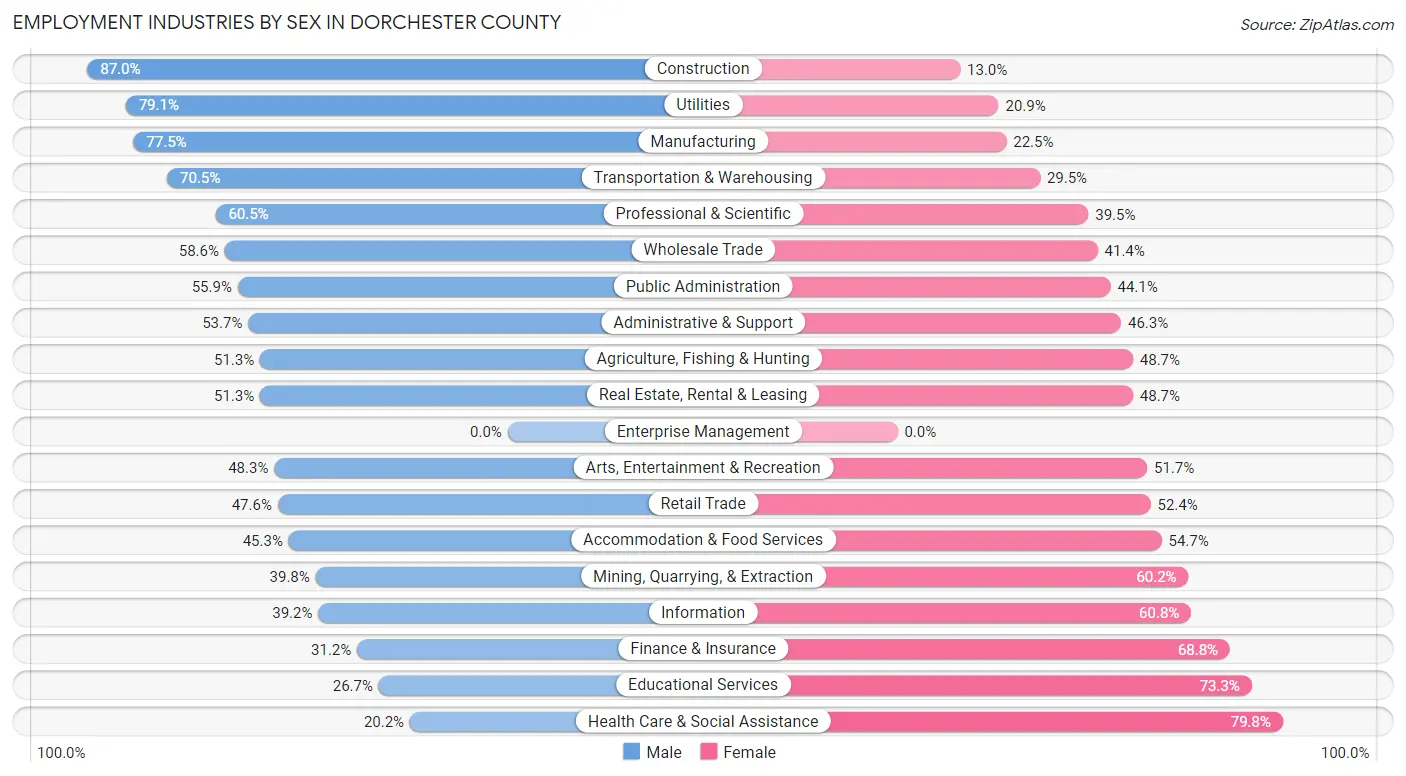
Employment Industries by Sex in Dorchester County
The Dorchester County industries that see more men than women are Construction (87.0%), Utilities (79.1%), and Manufacturing (77.5%), whereas the industries that tend to have a higher number of women are Health Care & Social Assistance (79.8%), Educational Services (73.3%), and Finance & Insurance (68.8%).
| Industry | Male | Female |
| Agriculture, Fishing & Hunting | 101 (51.3%) | 96 (48.7%) |
| Mining, Quarrying, & Extraction | 35 (39.8%) | 53 (60.2%) |
| Construction | 5,471 (87.0%) | 816 (13.0%) |
| Manufacturing | 7,976 (77.5%) | 2,320 (22.5%) |
| Wholesale Trade | 667 (58.6%) | 472 (41.4%) |
| Retail Trade | 4,171 (47.6%) | 4,592 (52.4%) |
| Transportation & Warehousing | 3,279 (70.5%) | 1,372 (29.5%) |
| Utilities | 748 (79.1%) | 198 (20.9%) |
| Information | 676 (39.2%) | 1,048 (60.8%) |
| Finance & Insurance | 575 (31.2%) | 1,269 (68.8%) |
| Real Estate, Rental & Leasing | 586 (51.3%) | 557 (48.7%) |
| Professional & Scientific | 3,130 (60.5%) | 2,044 (39.5%) |
| Enterprise Management | 0 (0.0%) | 0 (0.0%) |
| Administrative & Support | 1,852 (53.7%) | 1,596 (46.3%) |
| Educational Services | 1,727 (26.7%) | 4,745 (73.3%) |
| Health Care & Social Assistance | 2,040 (20.2%) | 8,041 (79.8%) |
| Arts, Entertainment & Recreation | 622 (48.3%) | 665 (51.7%) |
| Accommodation & Food Services | 2,496 (45.3%) | 3,010 (54.7%) |
| Public Administration | 3,172 (55.9%) | 2,504 (44.1%) |
| Total | 40,634 (52.4%) | 36,885 (47.6%) |
Education in Dorchester County
School Enrollment in Dorchester County
The most common levels of schooling among the 38,912 students in Dorchester County are elementary school (9,561 | 24.6%), high school (9,290 | 23.9%), and middle school (9,106 | 23.4%).
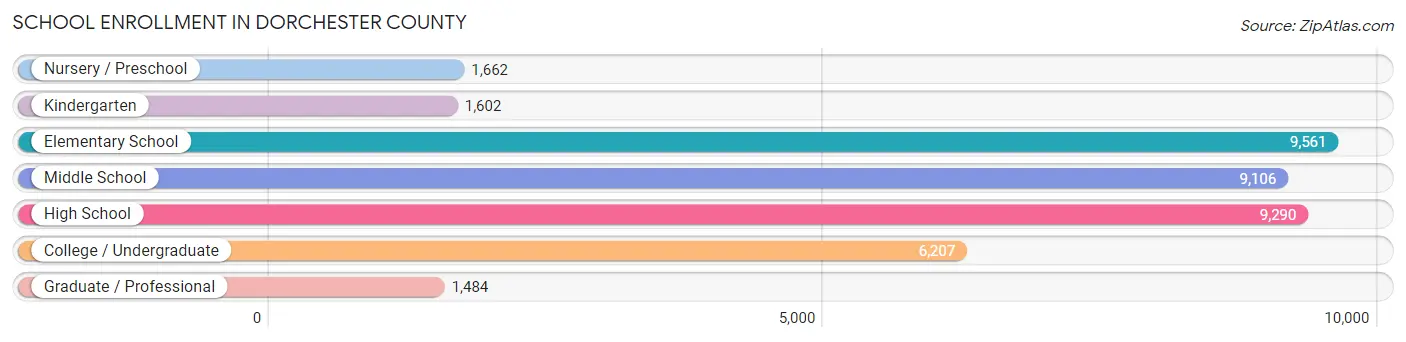
| School Level | # Students | % Students |
| Nursery / Preschool | 1,662 | 4.3% |
| Kindergarten | 1,602 | 4.1% |
| Elementary School | 9,561 | 24.6% |
| Middle School | 9,106 | 23.4% |
| High School | 9,290 | 23.9% |
| College / Undergraduate | 6,207 | 16.0% |
| Graduate / Professional | 1,484 | 3.8% |
| Total | 38,912 | 100.0% |
School Enrollment by Age by Funding Source in Dorchester County
Out of a total of 38,912 students who are enrolled in schools in Dorchester County, 5,020 (12.9%) attend a private institution, while the remaining 33,892 (87.1%) are enrolled in public schools. The age group of 3 to 4 year olds has the highest likelihood of being enrolled in private schools, with 596 (47.8% in the age bracket) enrolled. Conversely, the age group of 10 to 14 year olds has the lowest likelihood of being enrolled in a private school, with 10,282 (90.4% in the age bracket) attending a public institution.
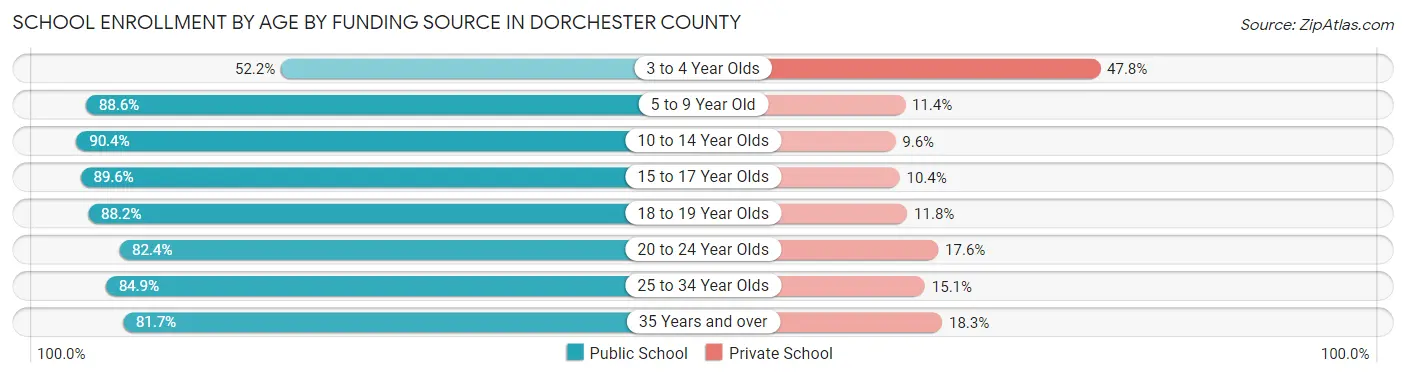
| Age Bracket | Public School | Private School |
| 3 to 4 Year Olds | 652 (52.2%) | 596 (47.8%) |
| 5 to 9 Year Old | 9,233 (88.6%) | 1,191 (11.4%) |
| 10 to 14 Year Olds | 10,282 (90.4%) | 1,096 (9.6%) |
| 15 to 17 Year Olds | 6,033 (89.6%) | 701 (10.4%) |
| 18 to 19 Year Olds | 1,946 (88.2%) | 261 (11.8%) |
| 20 to 24 Year Olds | 1,830 (82.4%) | 391 (17.6%) |
| 25 to 34 Year Olds | 2,145 (84.9%) | 382 (15.1%) |
| 35 Years and over | 1,775 (81.7%) | 398 (18.3%) |
| Total | 33,892 (87.1%) | 5,020 (12.9%) |
Educational Attainment by Field of Study in Dorchester County
Business (7,603 | 22.2%), education (4,094 | 12.0%), science & technology (3,919 | 11.5%), social sciences (2,506 | 7.3%), and arts & humanities (2,420 | 7.1%) are the most common fields of study among 34,217 individuals in Dorchester County who have obtained a bachelor's degree or higher.
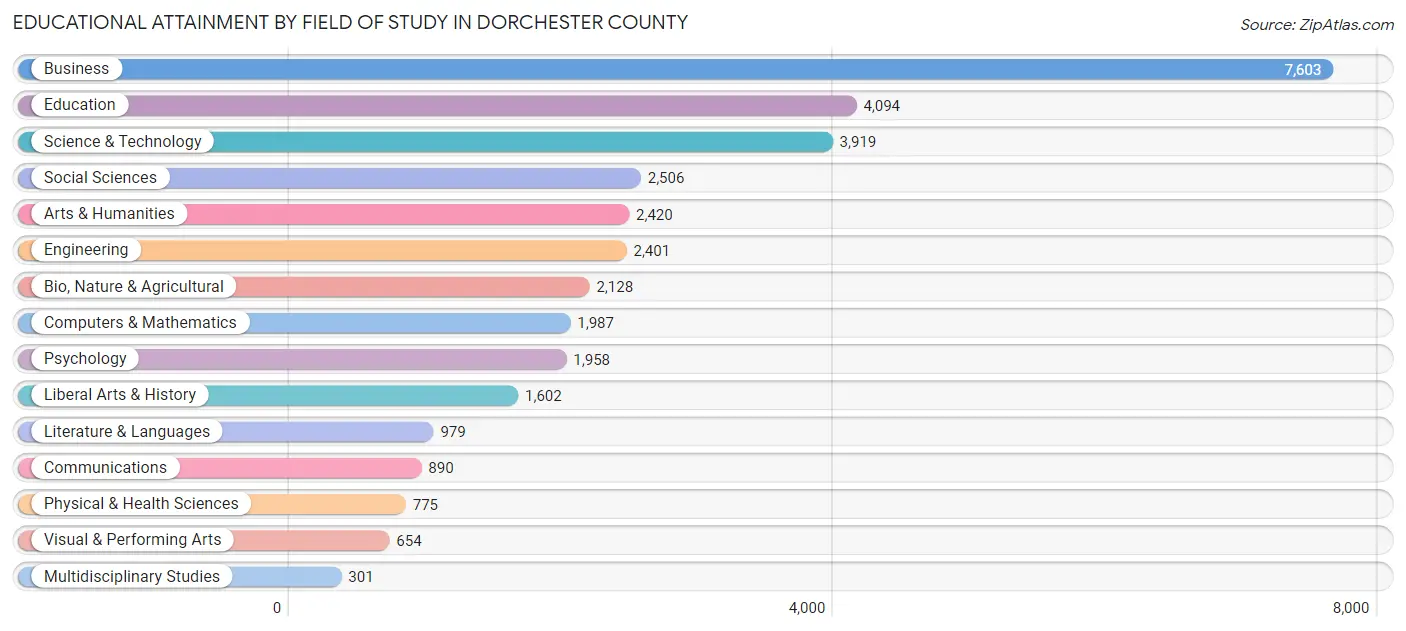
| Field of Study | # Graduates | % Graduates |
| Computers & Mathematics | 1,987 | 5.8% |
| Bio, Nature & Agricultural | 2,128 | 6.2% |
| Physical & Health Sciences | 775 | 2.3% |
| Psychology | 1,958 | 5.7% |
| Social Sciences | 2,506 | 7.3% |
| Engineering | 2,401 | 7.0% |
| Multidisciplinary Studies | 301 | 0.9% |
| Science & Technology | 3,919 | 11.5% |
| Business | 7,603 | 22.2% |
| Education | 4,094 | 12.0% |
| Literature & Languages | 979 | 2.9% |
| Liberal Arts & History | 1,602 | 4.7% |
| Visual & Performing Arts | 654 | 1.9% |
| Communications | 890 | 2.6% |
| Arts & Humanities | 2,420 | 7.1% |
| Total | 34,217 | 100.0% |
Transportation & Commute in Dorchester County
Vehicle Availability by Sex in Dorchester County
The most prevalent vehicle ownership categories in Dorchester County are males with 2 vehicles (17,638, accounting for 43.1%) and females with 2 vehicles (15,316, making up 48.6%).
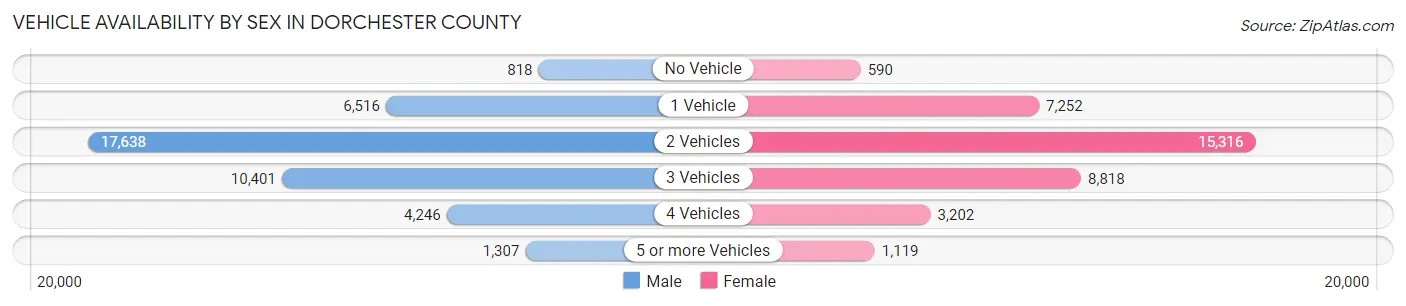
| Vehicles Available | Male | Female |
| No Vehicle | 818 (2.0%) | 590 (1.6%) |
| 1 Vehicle | 6,516 (15.9%) | 7,252 (20.0%) |
| 2 Vehicles | 17,638 (43.1%) | 15,316 (42.2%) |
| 3 Vehicles | 10,401 (25.4%) | 8,818 (24.3%) |
| 4 Vehicles | 4,246 (10.4%) | 3,202 (8.8%) |
| 5 or more Vehicles | 1,307 (3.2%) | 1,119 (3.1%) |
| Total | 40,926 (100.0%) | 36,297 (100.0%) |
Commute Time in Dorchester County
The most frequently occuring commute durations in Dorchester County are 30 to 34 minutes (12,535 commuters, 17.5%), 45 to 59 minutes (9,993 commuters, 14.0%), and 20 to 24 minutes (9,094 commuters, 12.7%).
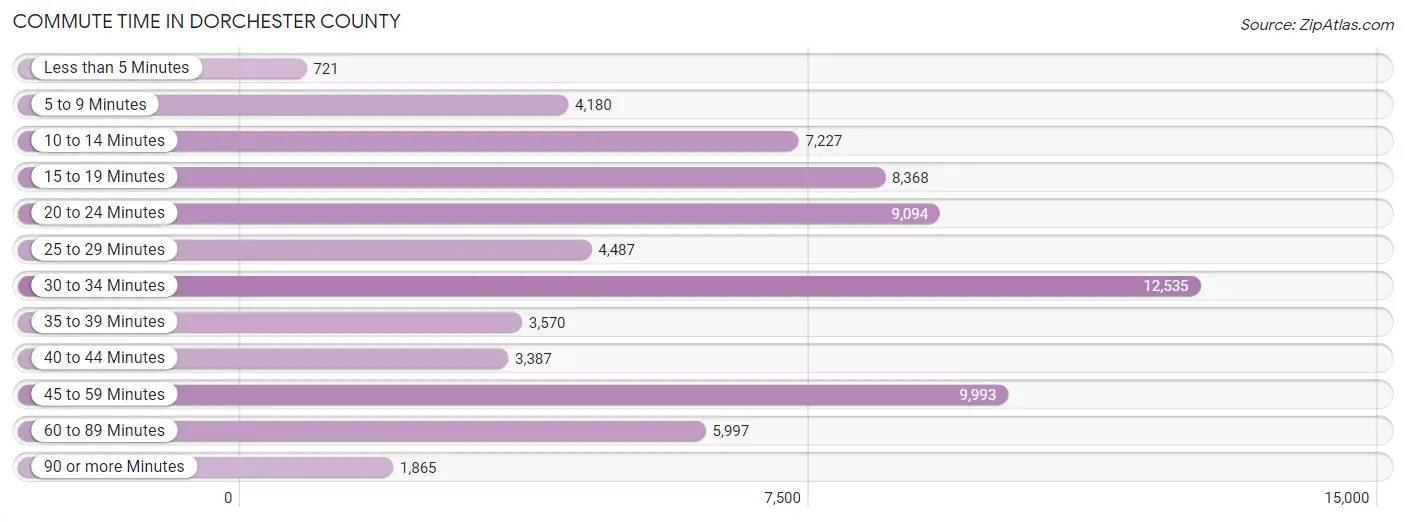
| Commute Time | # Commuters | % Commuters |
| Less than 5 Minutes | 721 | 1.0% |
| 5 to 9 Minutes | 4,180 | 5.9% |
| 10 to 14 Minutes | 7,227 | 10.1% |
| 15 to 19 Minutes | 8,368 | 11.7% |
| 20 to 24 Minutes | 9,094 | 12.7% |
| 25 to 29 Minutes | 4,487 | 6.3% |
| 30 to 34 Minutes | 12,535 | 17.5% |
| 35 to 39 Minutes | 3,570 | 5.0% |
| 40 to 44 Minutes | 3,387 | 4.7% |
| 45 to 59 Minutes | 9,993 | 14.0% |
| 60 to 89 Minutes | 5,997 | 8.4% |
| 90 or more Minutes | 1,865 | 2.6% |
Commute Time by Sex in Dorchester County
The most common commute times in Dorchester County are 30 to 34 minutes (8,098 commuters, 21.2%) for males and 30 to 34 minutes (4,437 commuters, 13.4%) for females.
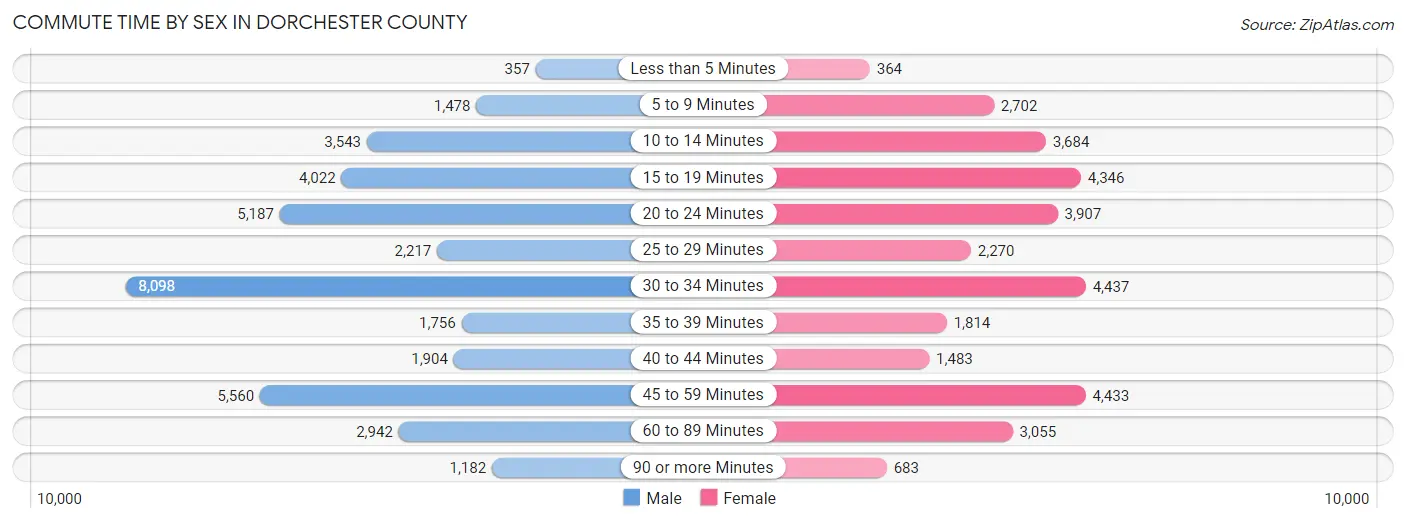
| Commute Time | Male | Female |
| Less than 5 Minutes | 357 (0.9%) | 364 (1.1%) |
| 5 to 9 Minutes | 1,478 (3.9%) | 2,702 (8.1%) |
| 10 to 14 Minutes | 3,543 (9.3%) | 3,684 (11.1%) |
| 15 to 19 Minutes | 4,022 (10.5%) | 4,346 (13.1%) |
| 20 to 24 Minutes | 5,187 (13.6%) | 3,907 (11.8%) |
| 25 to 29 Minutes | 2,217 (5.8%) | 2,270 (6.8%) |
| 30 to 34 Minutes | 8,098 (21.2%) | 4,437 (13.4%) |
| 35 to 39 Minutes | 1,756 (4.6%) | 1,814 (5.5%) |
| 40 to 44 Minutes | 1,904 (5.0%) | 1,483 (4.5%) |
| 45 to 59 Minutes | 5,560 (14.5%) | 4,433 (13.4%) |
| 60 to 89 Minutes | 2,942 (7.7%) | 3,055 (9.2%) |
| 90 or more Minutes | 1,182 (3.1%) | 683 (2.1%) |
Time of Departure to Work by Sex in Dorchester County
The most frequent times of departure to work in Dorchester County are 6:00 AM to 6:29 AM (6,725, 17.6%) for males and 6:30 AM to 6:59 AM (4,725, 14.2%) for females.
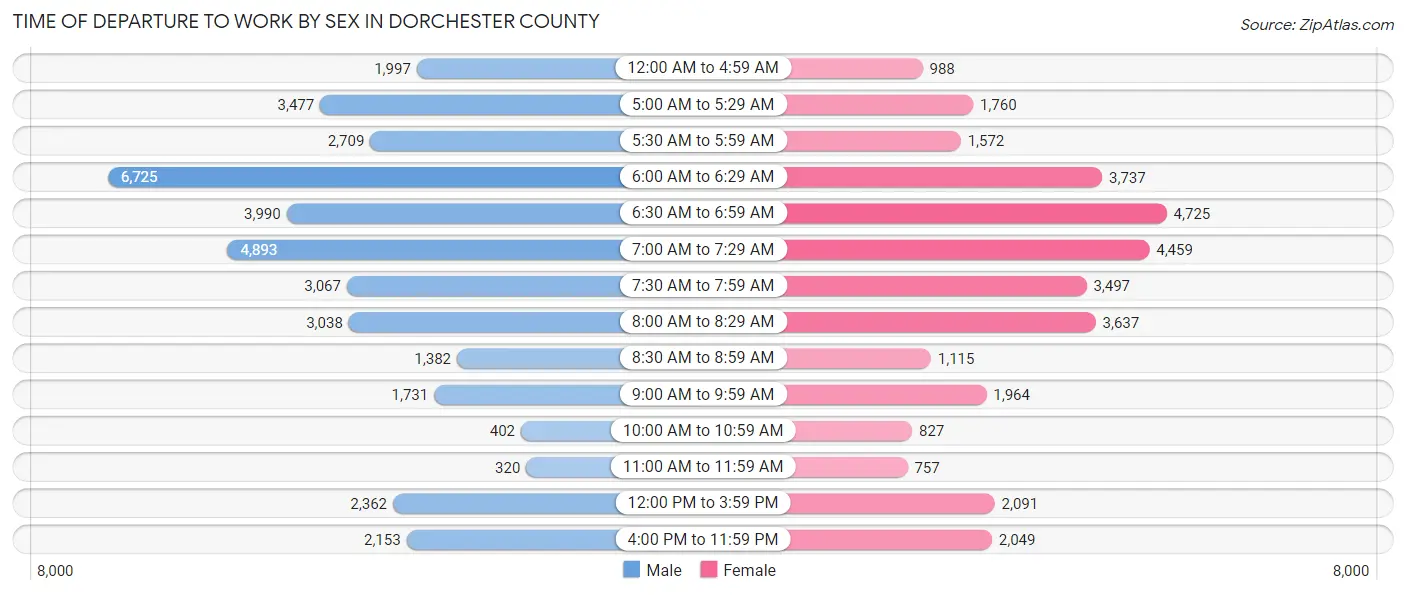
| Time of Departure | Male | Female |
| 12:00 AM to 4:59 AM | 1,997 (5.2%) | 988 (3.0%) |
| 5:00 AM to 5:29 AM | 3,477 (9.1%) | 1,760 (5.3%) |
| 5:30 AM to 5:59 AM | 2,709 (7.1%) | 1,572 (4.7%) |
| 6:00 AM to 6:29 AM | 6,725 (17.6%) | 3,737 (11.3%) |
| 6:30 AM to 6:59 AM | 3,990 (10.4%) | 4,725 (14.2%) |
| 7:00 AM to 7:29 AM | 4,893 (12.8%) | 4,459 (13.4%) |
| 7:30 AM to 7:59 AM | 3,067 (8.0%) | 3,497 (10.5%) |
| 8:00 AM to 8:29 AM | 3,038 (7.9%) | 3,637 (11.0%) |
| 8:30 AM to 8:59 AM | 1,382 (3.6%) | 1,115 (3.4%) |
| 9:00 AM to 9:59 AM | 1,731 (4.5%) | 1,964 (5.9%) |
| 10:00 AM to 10:59 AM | 402 (1.1%) | 827 (2.5%) |
| 11:00 AM to 11:59 AM | 320 (0.8%) | 757 (2.3%) |
| 12:00 PM to 3:59 PM | 2,362 (6.2%) | 2,091 (6.3%) |
| 4:00 PM to 11:59 PM | 2,153 (5.6%) | 2,049 (6.2%) |
| Total | 38,246 (100.0%) | 33,178 (100.0%) |
Housing Occupancy in Dorchester County
Occupancy by Ownership in Dorchester County
Of the total 59,731 dwellings in Dorchester County, owner-occupied units account for 44,697 (74.8%), while renter-occupied units make up 15,034 (25.2%).
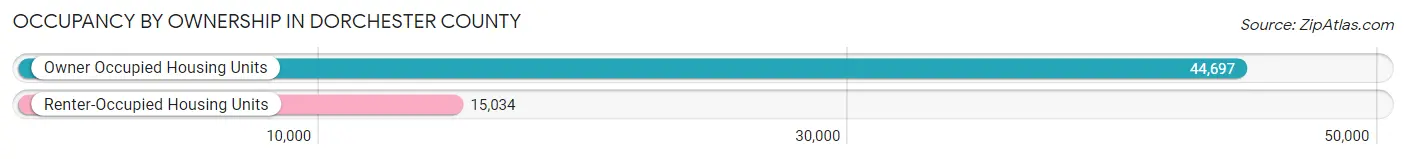
| Occupancy | # Housing Units | % Housing Units |
| Owner Occupied Housing Units | 44,697 | 74.8% |
| Renter-Occupied Housing Units | 15,034 | 25.2% |
| Total Occupied Housing Units | 59,731 | 100.0% |
Occupancy by Household Size in Dorchester County
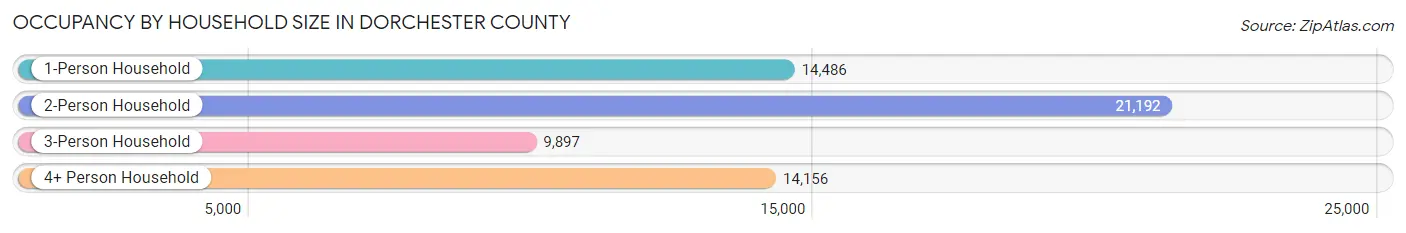
| Household Size | # Housing Units | % Housing Units |
| 1-Person Household | 14,486 | 24.2% |
| 2-Person Household | 21,192 | 35.5% |
| 3-Person Household | 9,897 | 16.6% |
| 4+ Person Household | 14,156 | 23.7% |
| Total Housing Units | 59,731 | 100.0% |
Occupancy by Ownership by Household Size in Dorchester County
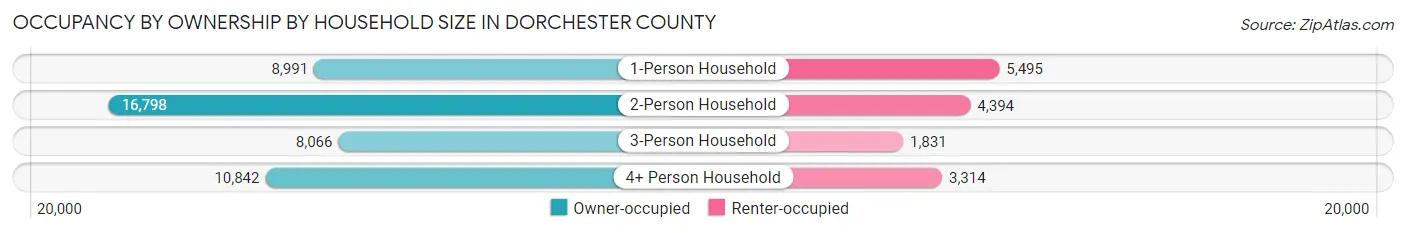
| Household Size | Owner-occupied | Renter-occupied |
| 1-Person Household | 8,991 (62.1%) | 5,495 (37.9%) |
| 2-Person Household | 16,798 (79.3%) | 4,394 (20.7%) |
| 3-Person Household | 8,066 (81.5%) | 1,831 (18.5%) |
| 4+ Person Household | 10,842 (76.6%) | 3,314 (23.4%) |
| Total Housing Units | 44,697 (74.8%) | 15,034 (25.2%) |
Occupancy by Educational Attainment in Dorchester County
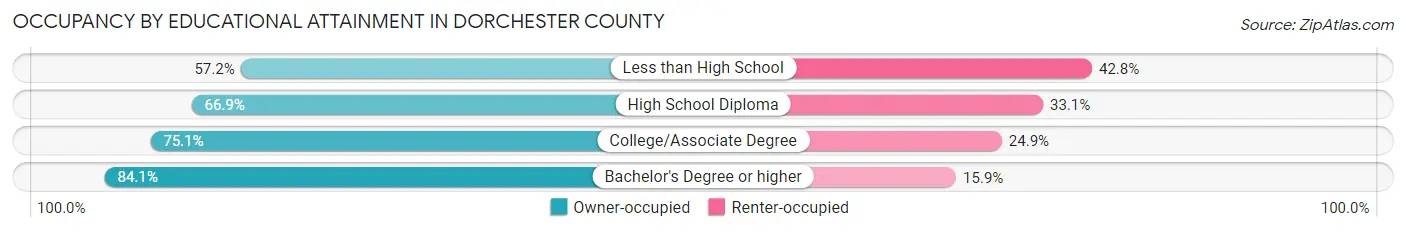
| Household Size | Owner-occupied | Renter-occupied |
| Less than High School | 2,597 (57.2%) | 1,943 (42.8%) |
| High School Diploma | 8,613 (66.9%) | 4,262 (33.1%) |
| College/Associate Degree | 17,521 (75.1%) | 5,819 (24.9%) |
| Bachelor's Degree or higher | 15,966 (84.1%) | 3,010 (15.9%) |
Occupancy by Age of Householder in Dorchester County
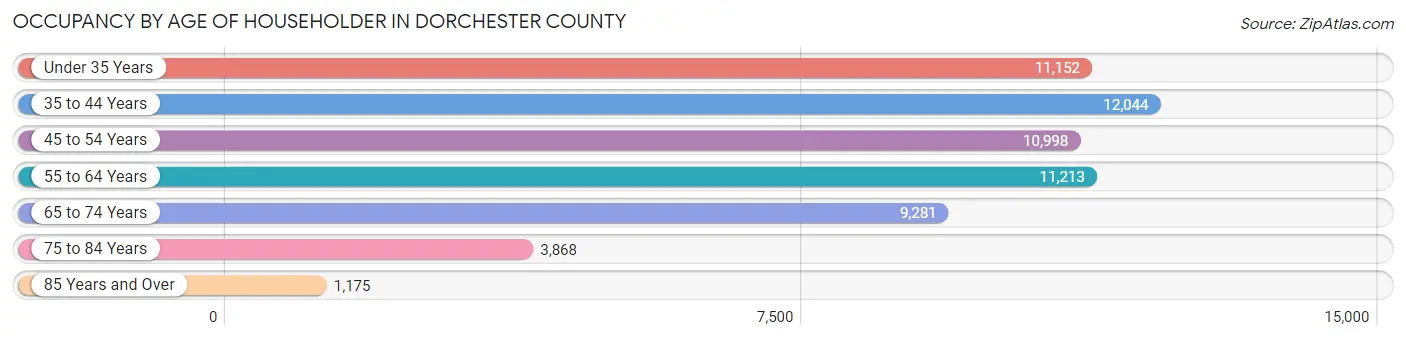
| Age Bracket | # Households | % Households |
| Under 35 Years | 11,152 | 18.7% |
| 35 to 44 Years | 12,044 | 20.2% |
| 45 to 54 Years | 10,998 | 18.4% |
| 55 to 64 Years | 11,213 | 18.8% |
| 65 to 74 Years | 9,281 | 15.5% |
| 75 to 84 Years | 3,868 | 6.5% |
| 85 Years and Over | 1,175 | 2.0% |
| Total | 59,731 | 100.0% |
Housing Finances in Dorchester County
Median Income by Occupancy in Dorchester County
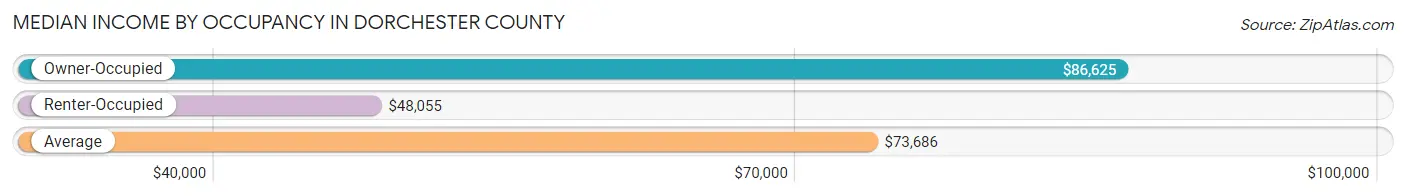
| Occupancy Type | # Households | Median Income |
| Owner-Occupied | 44,697 (74.8%) | $86,625 |
| Renter-Occupied | 15,034 (25.2%) | $48,055 |
| Average | 59,731 (100.0%) | $73,686 |
Occupancy by Householder Income Bracket in Dorchester County
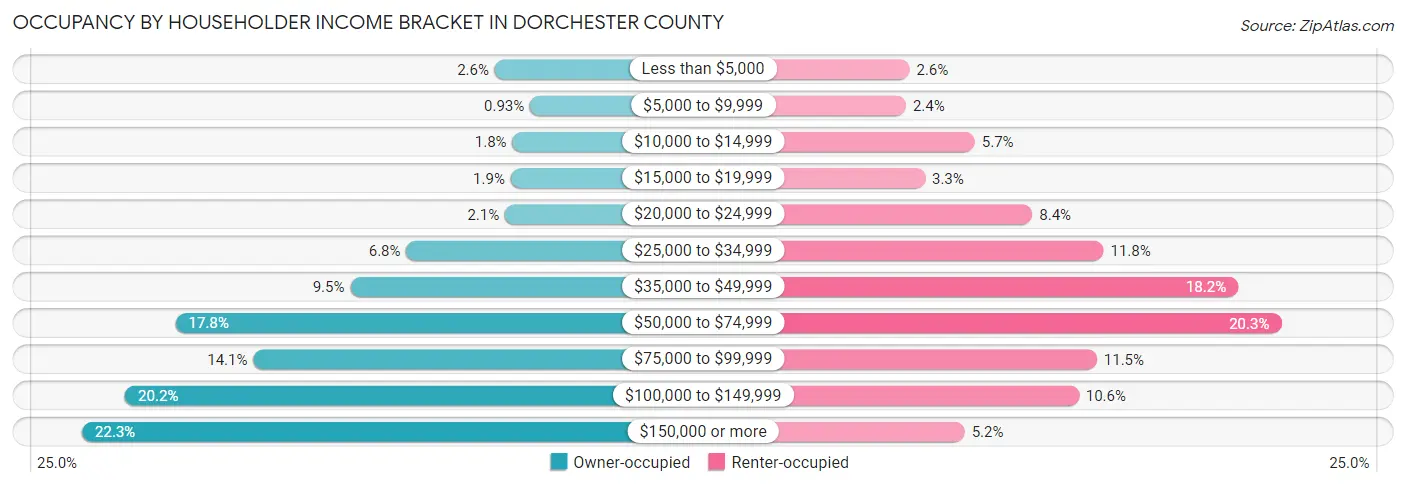
| Income Bracket | Owner-occupied | Renter-occupied |
| Less than $5,000 | 1,166 (2.6%) | 386 (2.6%) |
| $5,000 to $9,999 | 416 (0.9%) | 361 (2.4%) |
| $10,000 to $14,999 | 793 (1.8%) | 854 (5.7%) |
| $15,000 to $19,999 | 827 (1.8%) | 498 (3.3%) |
| $20,000 to $24,999 | 948 (2.1%) | 1,266 (8.4%) |
| $25,000 to $34,999 | 3,048 (6.8%) | 1,775 (11.8%) |
| $35,000 to $49,999 | 4,243 (9.5%) | 2,738 (18.2%) |
| $50,000 to $74,999 | 7,962 (17.8%) | 3,048 (20.3%) |
| $75,000 to $99,999 | 6,308 (14.1%) | 1,728 (11.5%) |
| $100,000 to $149,999 | 9,034 (20.2%) | 1,598 (10.6%) |
| $150,000 or more | 9,952 (22.3%) | 782 (5.2%) |
| Total | 44,697 (100.0%) | 15,034 (100.0%) |
Monthly Housing Cost Tiers in Dorchester County
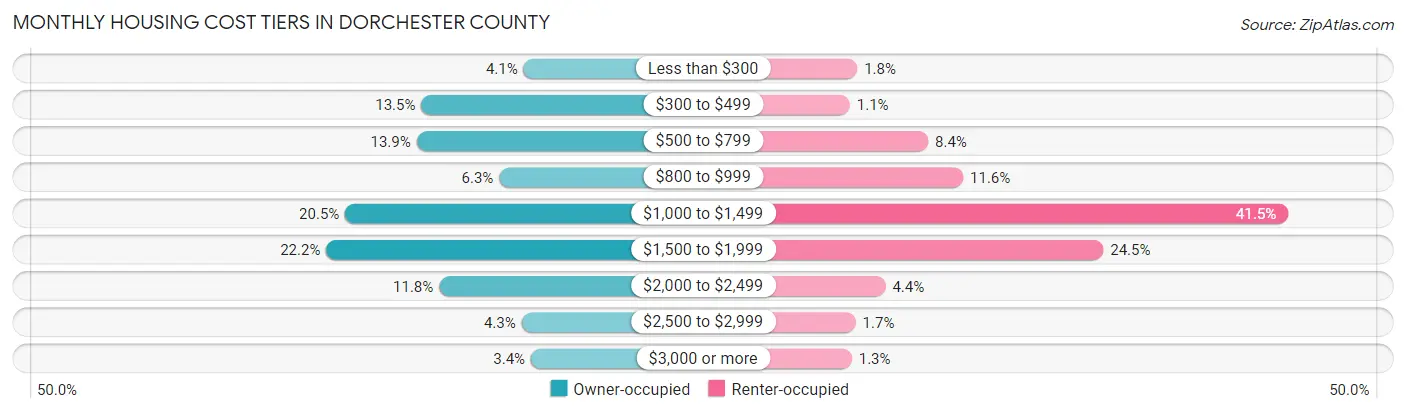
| Monthly Cost | Owner-occupied | Renter-occupied |
| Less than $300 | 1,820 (4.1%) | 273 (1.8%) |
| $300 to $499 | 6,027 (13.5%) | 172 (1.1%) |
| $500 to $799 | 6,224 (13.9%) | 1,255 (8.4%) |
| $800 to $999 | 2,821 (6.3%) | 1,740 (11.6%) |
| $1,000 to $1,499 | 9,159 (20.5%) | 6,237 (41.5%) |
| $1,500 to $1,999 | 9,937 (22.2%) | 3,681 (24.5%) |
| $2,000 to $2,499 | 5,293 (11.8%) | 664 (4.4%) |
| $2,500 to $2,999 | 1,900 (4.3%) | 253 (1.7%) |
| $3,000 or more | 1,516 (3.4%) | 199 (1.3%) |
| Total | 44,697 (100.0%) | 15,034 (100.0%) |
Physical Housing Characteristics in Dorchester County
Housing Structures in Dorchester County
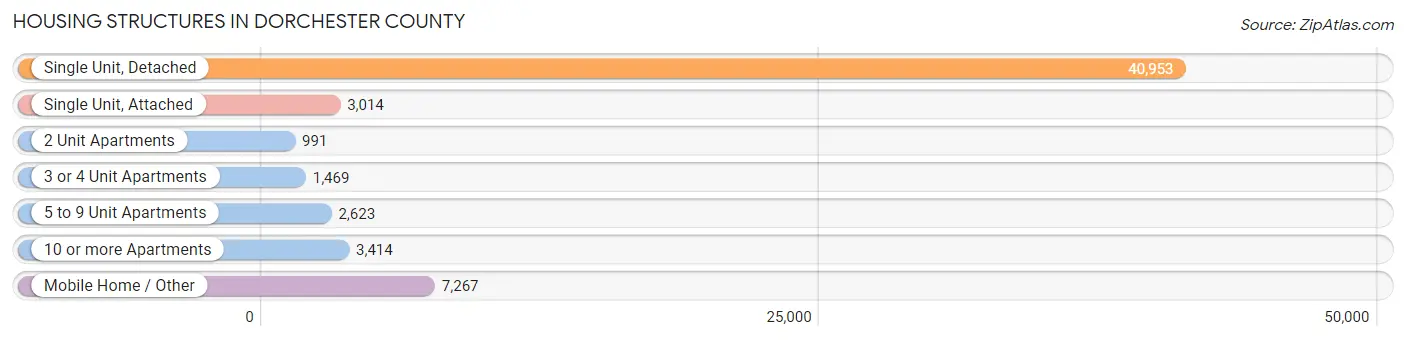
| Structure Type | # Housing Units | % Housing Units |
| Single Unit, Detached | 40,953 | 68.6% |
| Single Unit, Attached | 3,014 | 5.1% |
| 2 Unit Apartments | 991 | 1.7% |
| 3 or 4 Unit Apartments | 1,469 | 2.5% |
| 5 to 9 Unit Apartments | 2,623 | 4.4% |
| 10 or more Apartments | 3,414 | 5.7% |
| Mobile Home / Other | 7,267 | 12.2% |
| Total | 59,731 | 100.0% |
Housing Structures by Occupancy in Dorchester County
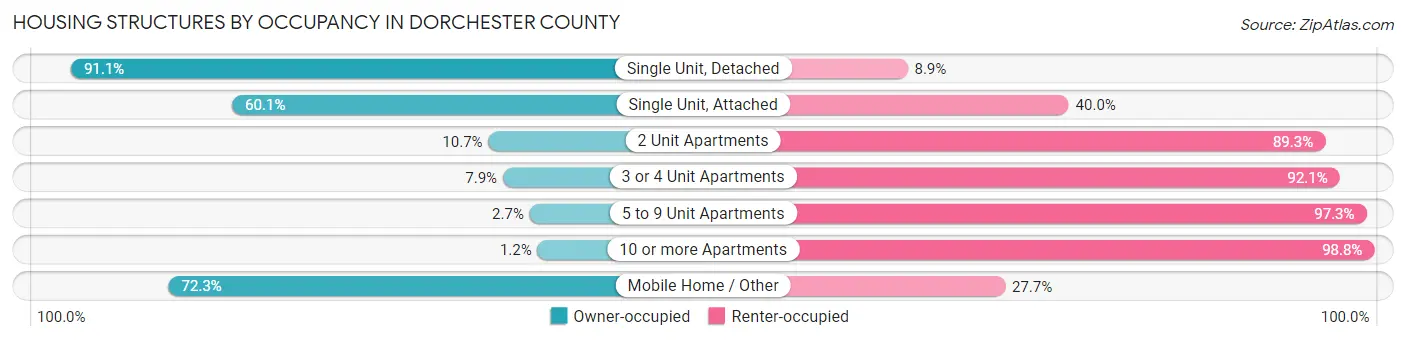
| Structure Type | Owner-occupied | Renter-occupied |
| Single Unit, Detached | 37,297 (91.1%) | 3,656 (8.9%) |
| Single Unit, Attached | 1,810 (60.1%) | 1,204 (40.0%) |
| 2 Unit Apartments | 106 (10.7%) | 885 (89.3%) |
| 3 or 4 Unit Apartments | 116 (7.9%) | 1,353 (92.1%) |
| 5 to 9 Unit Apartments | 72 (2.7%) | 2,551 (97.3%) |
| 10 or more Apartments | 42 (1.2%) | 3,372 (98.8%) |
| Mobile Home / Other | 5,254 (72.3%) | 2,013 (27.7%) |
| Total | 44,697 (74.8%) | 15,034 (25.2%) |
Housing Structures by Number of Rooms in Dorchester County
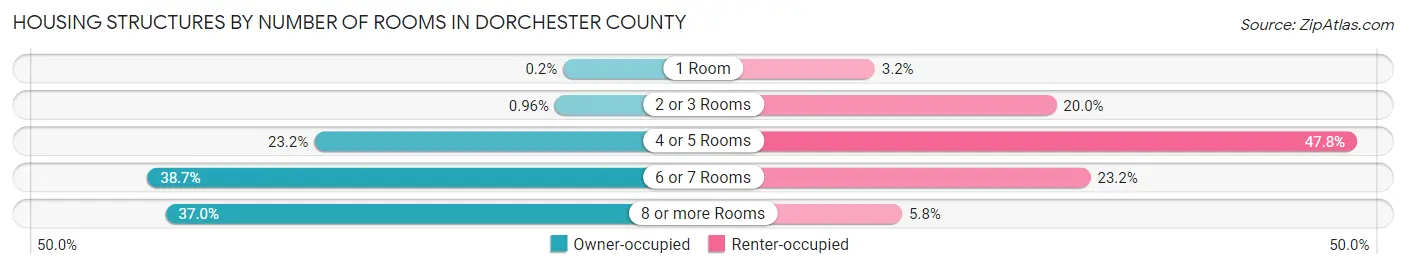
| Number of Rooms | Owner-occupied | Renter-occupied |
| 1 Room | 91 (0.2%) | 486 (3.2%) |
| 2 or 3 Rooms | 431 (1.0%) | 3,010 (20.0%) |
| 4 or 5 Rooms | 10,385 (23.2%) | 7,188 (47.8%) |
| 6 or 7 Rooms | 17,276 (38.7%) | 3,485 (23.2%) |
| 8 or more Rooms | 16,514 (36.9%) | 865 (5.8%) |
| Total | 44,697 (100.0%) | 15,034 (100.0%) |
Housing Structure by Heating Type in Dorchester County
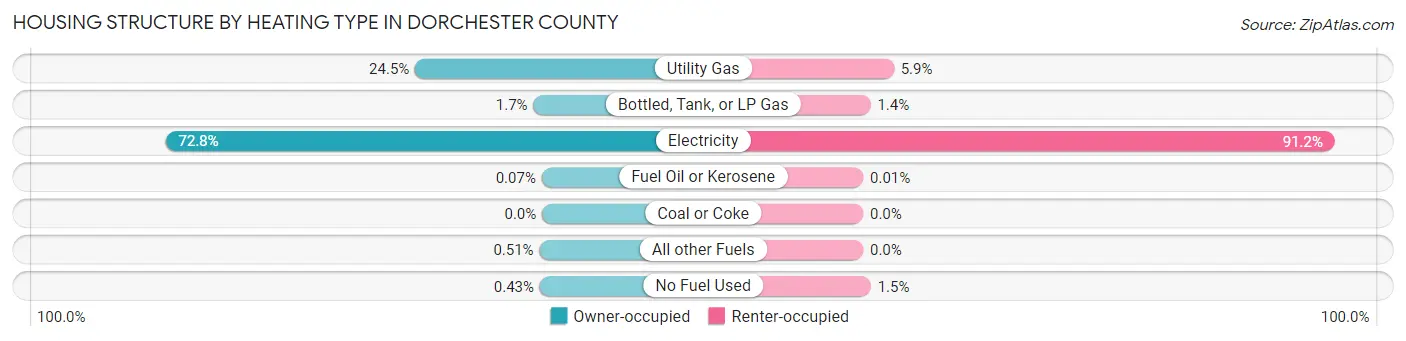
| Heating Type | Owner-occupied | Renter-occupied |
| Utility Gas | 10,964 (24.5%) | 890 (5.9%) |
| Bottled, Tank, or LP Gas | 751 (1.7%) | 216 (1.4%) |
| Electricity | 32,535 (72.8%) | 13,703 (91.1%) |
| Fuel Oil or Kerosene | 31 (0.1%) | 2 (0.0%) |
| Coal or Coke | 0 (0.0%) | 0 (0.0%) |
| All other Fuels | 226 (0.5%) | 0 (0.0%) |
| No Fuel Used | 190 (0.4%) | 223 (1.5%) |
| Total | 44,697 (100.0%) | 15,034 (100.0%) |
Household Vehicle Usage in Dorchester County
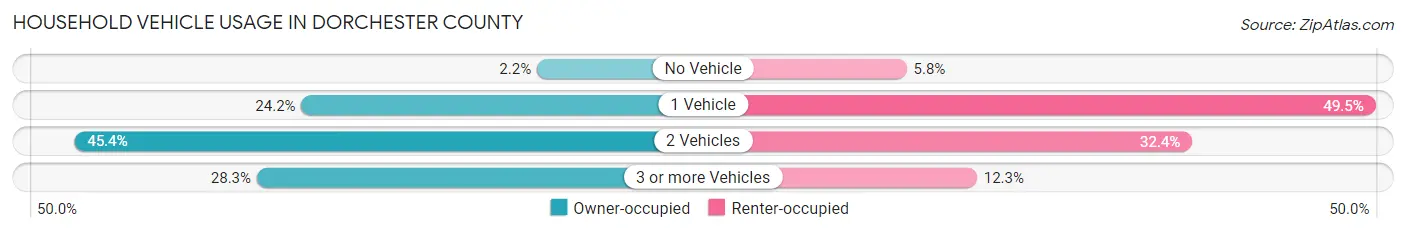
| Vehicles per Household | Owner-occupied | Renter-occupied |
| No Vehicle | 968 (2.2%) | 866 (5.8%) |
| 1 Vehicle | 10,797 (24.2%) | 7,446 (49.5%) |
| 2 Vehicles | 20,275 (45.4%) | 4,872 (32.4%) |
| 3 or more Vehicles | 12,657 (28.3%) | 1,850 (12.3%) |
| Total | 44,697 (100.0%) | 15,034 (100.0%) |
Real Estate & Mortgages in Dorchester County
Real Estate and Mortgage Overview in Dorchester County
| Characteristic | Without Mortgage | With Mortgage |
| Housing Units | 14,474 | 30,223 |
| Median Property Value | $226,400 | $287,400 |
| Median Household Income | $60,352 | $7,836 |
| Monthly Housing Costs | $488 | $1,516 |
| Real Estate Taxes | $1,216 | $1,156 |
Property Value by Mortgage Status in Dorchester County
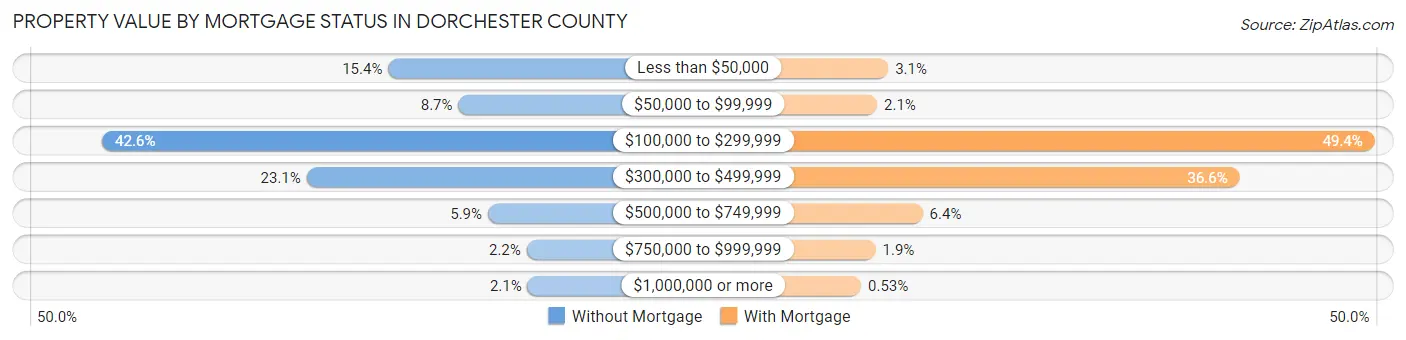
| Property Value | Without Mortgage | With Mortgage |
| Less than $50,000 | 2,225 (15.4%) | 940 (3.1%) |
| $50,000 to $99,999 | 1,258 (8.7%) | 619 (2.1%) |
| $100,000 to $299,999 | 6,169 (42.6%) | 14,943 (49.4%) |
| $300,000 to $499,999 | 3,350 (23.1%) | 11,053 (36.6%) |
| $500,000 to $749,999 | 851 (5.9%) | 1,931 (6.4%) |
| $750,000 to $999,999 | 317 (2.2%) | 577 (1.9%) |
| $1,000,000 or more | 304 (2.1%) | 160 (0.5%) |
| Total | 14,474 (100.0%) | 30,223 (100.0%) |
Household Income by Mortgage Status in Dorchester County
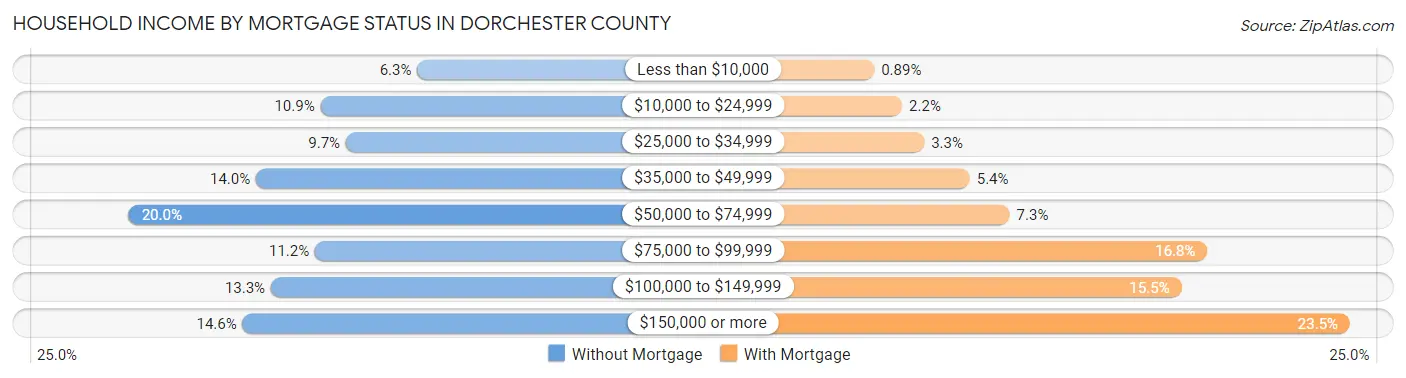
| Household Income | Without Mortgage | With Mortgage |
| Less than $10,000 | 912 (6.3%) | 269 (0.9%) |
| $10,000 to $24,999 | 1,579 (10.9%) | 670 (2.2%) |
| $25,000 to $34,999 | 1,404 (9.7%) | 989 (3.3%) |
| $35,000 to $49,999 | 2,024 (14.0%) | 1,644 (5.4%) |
| $50,000 to $74,999 | 2,901 (20.0%) | 2,219 (7.3%) |
| $75,000 to $99,999 | 1,617 (11.2%) | 5,061 (16.8%) |
| $100,000 to $149,999 | 1,921 (13.3%) | 4,691 (15.5%) |
| $150,000 or more | 2,116 (14.6%) | 7,113 (23.5%) |
| Total | 14,474 (100.0%) | 30,223 (100.0%) |
Property Value to Household Income Ratio in Dorchester County
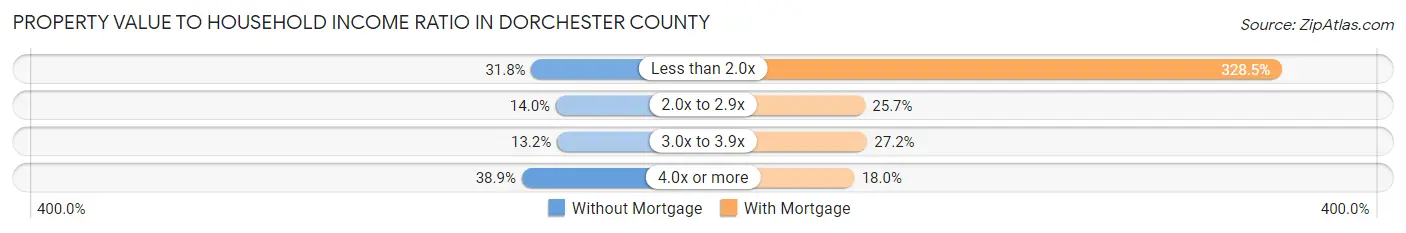
| Value-to-Income Ratio | Without Mortgage | With Mortgage |
| Less than 2.0x | 4,604 (31.8%) | 99,269 (328.5%) |
| 2.0x to 2.9x | 2,031 (14.0%) | 7,779 (25.7%) |
| 3.0x to 3.9x | 1,915 (13.2%) | 8,232 (27.2%) |
| 4.0x or more | 5,623 (38.9%) | 5,443 (18.0%) |
| Total | 14,474 (100.0%) | 30,223 (100.0%) |
Real Estate Taxes by Mortgage Status in Dorchester County
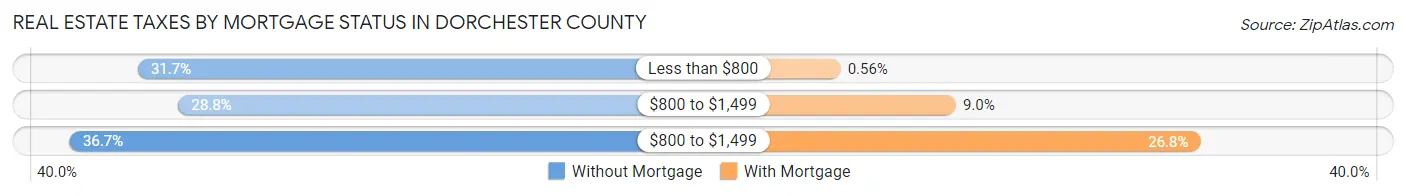
| Property Taxes | Without Mortgage | With Mortgage |
| Less than $800 | 4,592 (31.7%) | 169 (0.6%) |
| $800 to $1,499 | 4,162 (28.8%) | 2,713 (9.0%) |
| $800 to $1,499 | 5,310 (36.7%) | 8,110 (26.8%) |
| Total | 14,474 (100.0%) | 30,223 (100.0%) |
Health & Disability in Dorchester County
Health Insurance Coverage by Age in Dorchester County
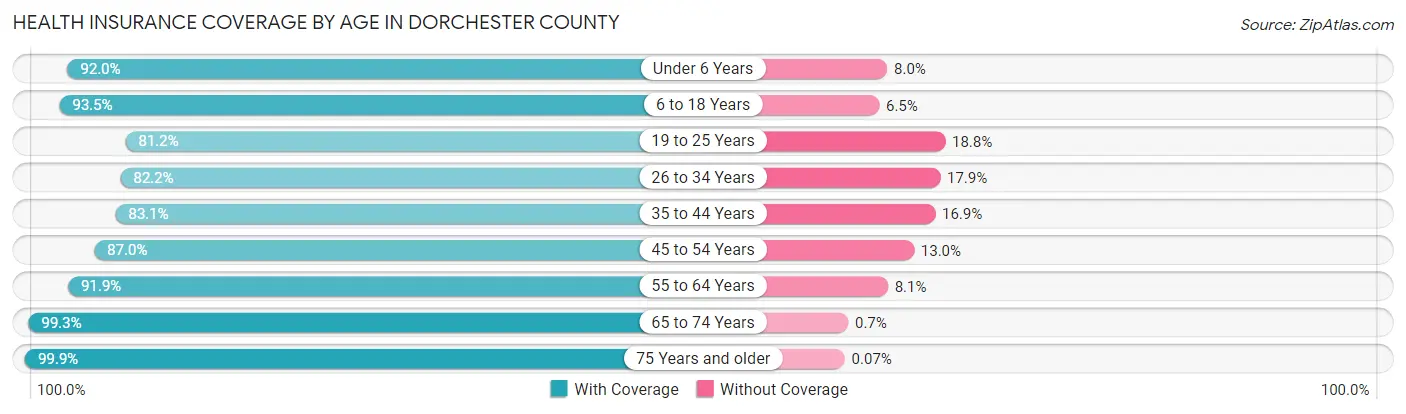
| Age Bracket | With Coverage | Without Coverage |
| Under 6 Years | 10,187 (92.0%) | 884 (8.0%) |
| 6 to 18 Years | 28,026 (93.5%) | 1,942 (6.5%) |
| 19 to 25 Years | 10,577 (81.2%) | 2,448 (18.8%) |
| 26 to 34 Years | 15,173 (82.2%) | 3,297 (17.8%) |
| 35 to 44 Years | 18,406 (83.1%) | 3,748 (16.9%) |
| 45 to 54 Years | 17,971 (87.0%) | 2,679 (13.0%) |
| 55 to 64 Years | 18,628 (91.9%) | 1,640 (8.1%) |
| 65 to 74 Years | 14,848 (99.3%) | 105 (0.7%) |
| 75 Years and older | 8,534 (99.9%) | 6 (0.1%) |
| Total | 142,350 (89.5%) | 16,749 (10.5%) |
Health Insurance Coverage by Citizenship Status in Dorchester County
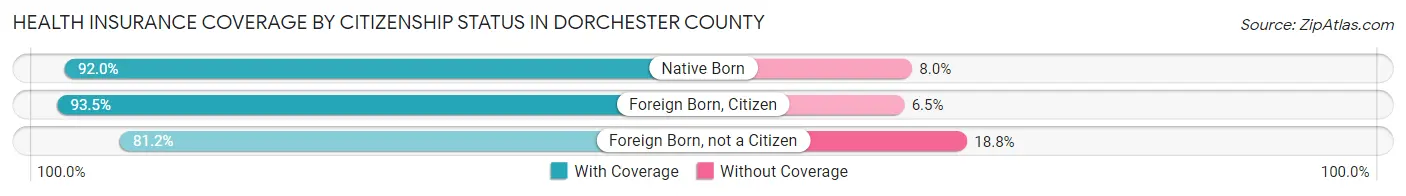
| Citizenship Status | With Coverage | Without Coverage |
| Native Born | 10,187 (92.0%) | 884 (8.0%) |
| Foreign Born, Citizen | 28,026 (93.5%) | 1,942 (6.5%) |
| Foreign Born, not a Citizen | 10,577 (81.2%) | 2,448 (18.8%) |
Health Insurance Coverage by Household Income in Dorchester County
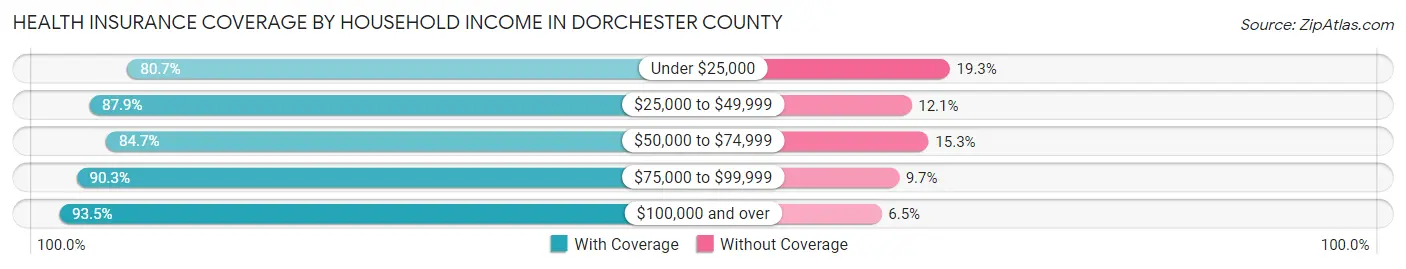
| Household Income | With Coverage | Without Coverage |
| Under $25,000 | 11,464 (80.7%) | 2,735 (19.3%) |
| $25,000 to $49,999 | 23,641 (87.9%) | 3,251 (12.1%) |
| $50,000 to $74,999 | 22,756 (84.7%) | 4,108 (15.3%) |
| $75,000 to $99,999 | 19,953 (90.3%) | 2,151 (9.7%) |
| $100,000 and over | 64,372 (93.5%) | 4,459 (6.5%) |
Public vs Private Health Insurance Coverage by Age in Dorchester County
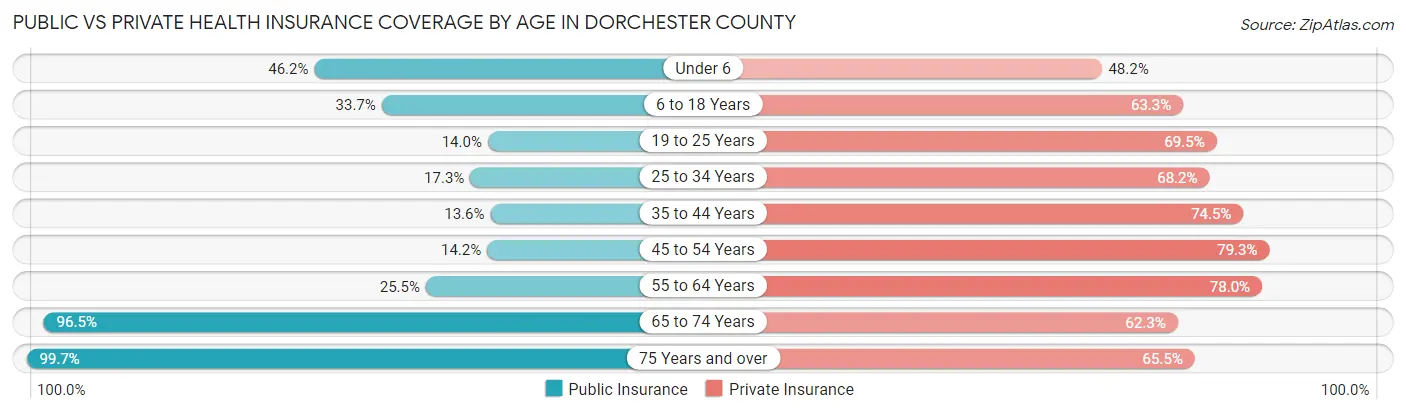
| Age Bracket | Public Insurance | Private Insurance |
| Under 6 | 5,118 (46.2%) | 5,336 (48.2%) |
| 6 to 18 Years | 10,108 (33.7%) | 18,981 (63.3%) |
| 19 to 25 Years | 1,829 (14.0%) | 9,058 (69.5%) |
| 25 to 34 Years | 3,196 (17.3%) | 12,597 (68.2%) |
| 35 to 44 Years | 3,005 (13.6%) | 16,504 (74.5%) |
| 45 to 54 Years | 2,924 (14.2%) | 16,384 (79.3%) |
| 55 to 64 Years | 5,175 (25.5%) | 15,803 (78.0%) |
| 65 to 74 Years | 14,423 (96.5%) | 9,317 (62.3%) |
| 75 Years and over | 8,510 (99.7%) | 5,593 (65.5%) |
| Total | 54,288 (34.1%) | 109,573 (68.9%) |
Disability Status by Sex by Age in Dorchester County
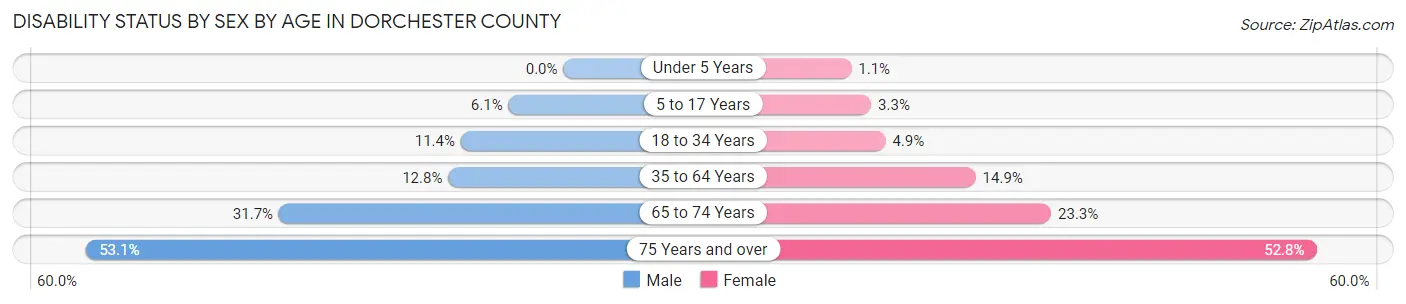
| Age Bracket | Male | Female |
| Under 5 Years | 0 (0.0%) | 49 (1.1%) |
| 5 to 17 Years | 928 (6.1%) | 475 (3.3%) |
| 18 to 34 Years | 1,865 (11.4%) | 834 (4.9%) |
| 35 to 64 Years | 3,882 (12.8%) | 4,889 (14.9%) |
| 65 to 74 Years | 2,185 (31.7%) | 1,878 (23.3%) |
| 75 Years and over | 1,911 (53.1%) | 2,612 (52.8%) |
Disability Class by Sex by Age in Dorchester County
Disability Class: Hearing Difficulty
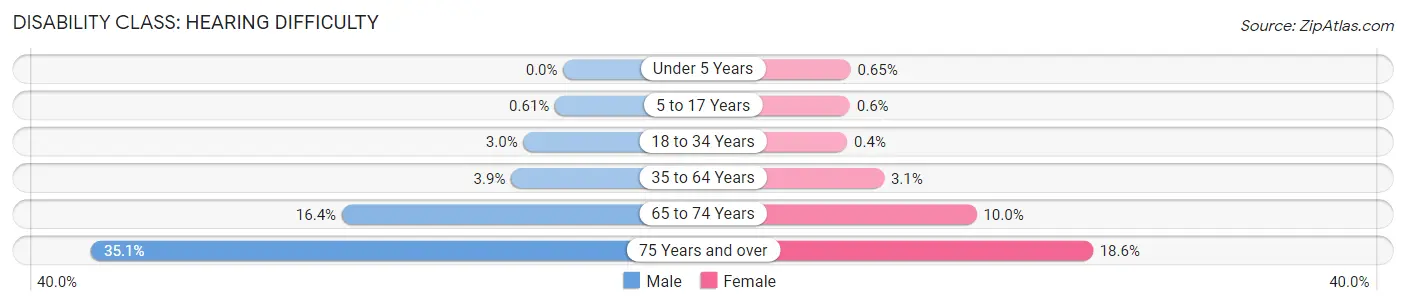
| Age Bracket | Male | Female |
| Under 5 Years | 0 (0.0%) | 30 (0.6%) |
| 5 to 17 Years | 93 (0.6%) | 87 (0.6%) |
| 18 to 34 Years | 484 (3.0%) | 68 (0.4%) |
| 35 to 64 Years | 1,173 (3.9%) | 1,026 (3.1%) |
| 65 to 74 Years | 1,134 (16.4%) | 806 (10.0%) |
| 75 Years and over | 1,261 (35.1%) | 921 (18.6%) |
Disability Class: Vision Difficulty
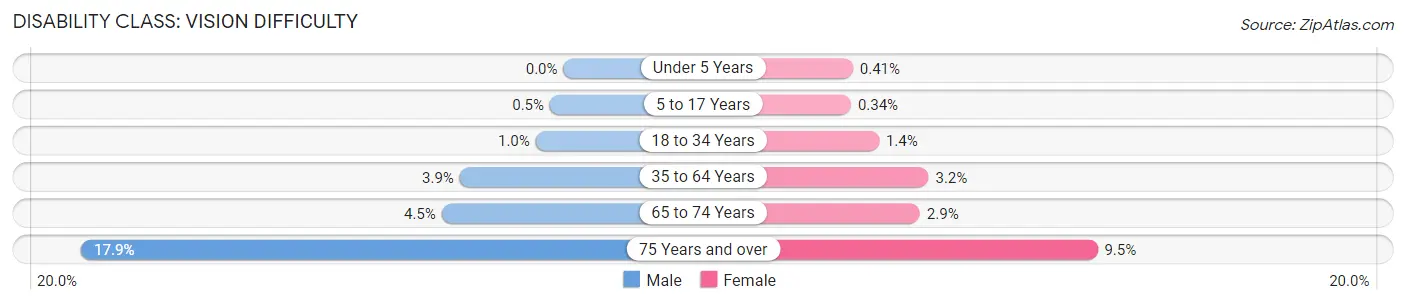
| Age Bracket | Male | Female |
| Under 5 Years | 0 (0.0%) | 19 (0.4%) |
| 5 to 17 Years | 76 (0.5%) | 49 (0.3%) |
| 18 to 34 Years | 168 (1.0%) | 236 (1.4%) |
| 35 to 64 Years | 1,166 (3.8%) | 1,056 (3.2%) |
| 65 to 74 Years | 312 (4.5%) | 234 (2.9%) |
| 75 Years and over | 644 (17.9%) | 469 (9.5%) |
Disability Class: Cognitive Difficulty
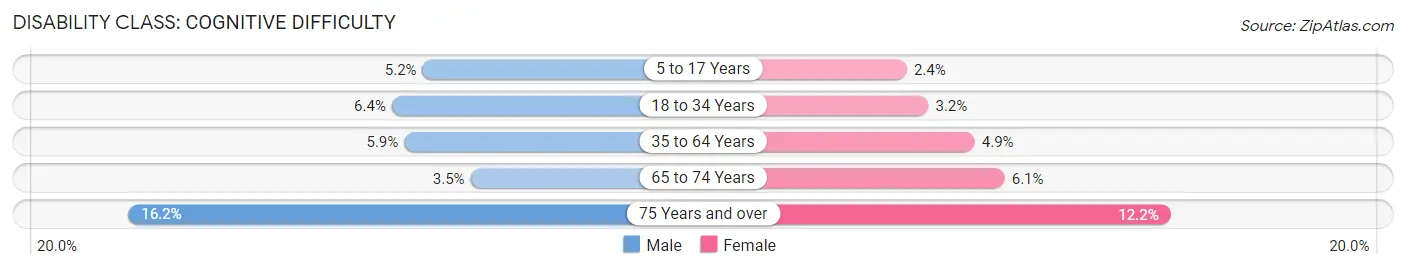
| Age Bracket | Male | Female |
| 5 to 17 Years | 795 (5.2%) | 351 (2.4%) |
| 18 to 34 Years | 1,041 (6.4%) | 553 (3.2%) |
| 35 to 64 Years | 1,789 (5.9%) | 1,619 (4.9%) |
| 65 to 74 Years | 238 (3.5%) | 487 (6.0%) |
| 75 Years and over | 581 (16.2%) | 603 (12.2%) |
Disability Class: Ambulatory Difficulty
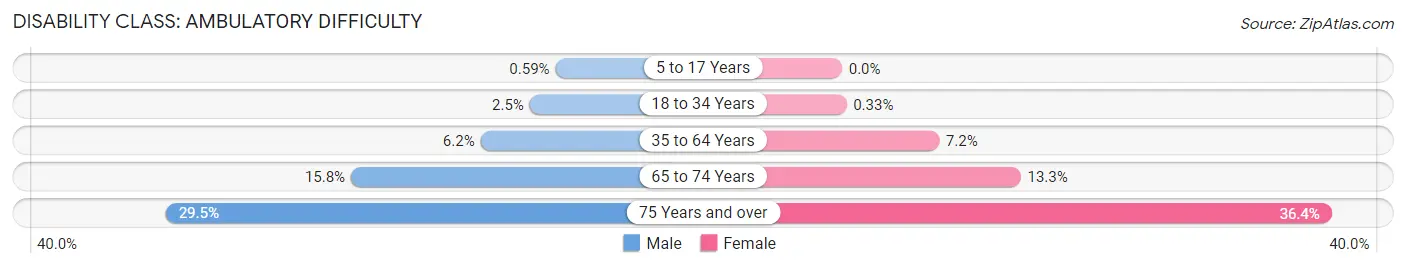
| Age Bracket | Male | Female |
| 5 to 17 Years | 90 (0.6%) | 0 (0.0%) |
| 18 to 34 Years | 409 (2.5%) | 56 (0.3%) |
| 35 to 64 Years | 1,863 (6.1%) | 2,364 (7.2%) |
| 65 to 74 Years | 1,088 (15.8%) | 1,069 (13.3%) |
| 75 Years and over | 1,062 (29.5%) | 1,798 (36.4%) |
Disability Class: Self-Care Difficulty
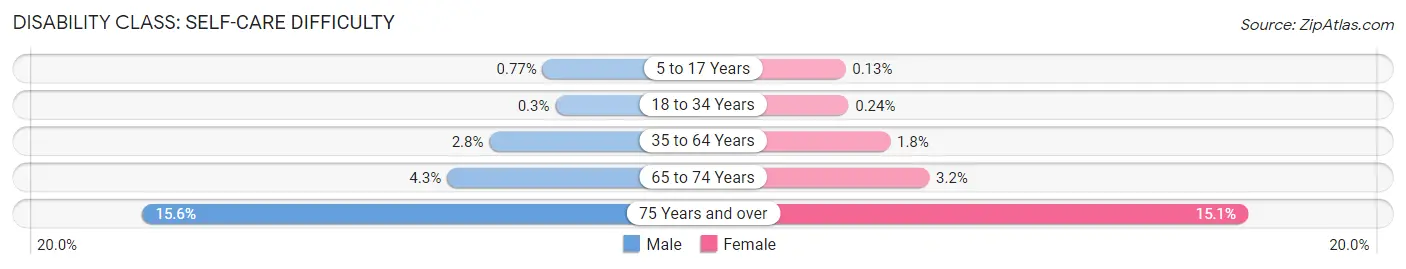
| Age Bracket | Male | Female |
| 5 to 17 Years | 117 (0.8%) | 19 (0.1%) |
| 18 to 34 Years | 49 (0.3%) | 41 (0.2%) |
| 35 to 64 Years | 832 (2.8%) | 587 (1.8%) |
| 65 to 74 Years | 298 (4.3%) | 261 (3.2%) |
| 75 Years and over | 562 (15.6%) | 745 (15.1%) |
Technology Access in Dorchester County
Computing Device Access in Dorchester County
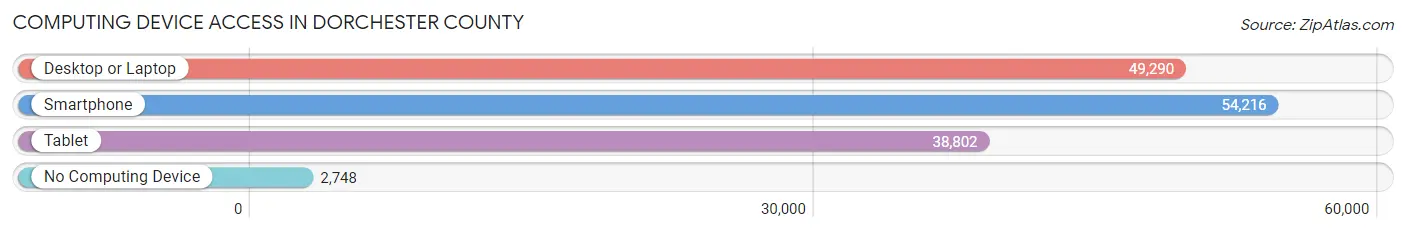
| Device Type | # Households | % Households |
| Desktop or Laptop | 49,290 | 82.5% |
| Smartphone | 54,216 | 90.8% |
| Tablet | 38,802 | 65.0% |
| No Computing Device | 2,748 | 4.6% |
| Total | 59,731 | 100.0% |
Internet Access in Dorchester County
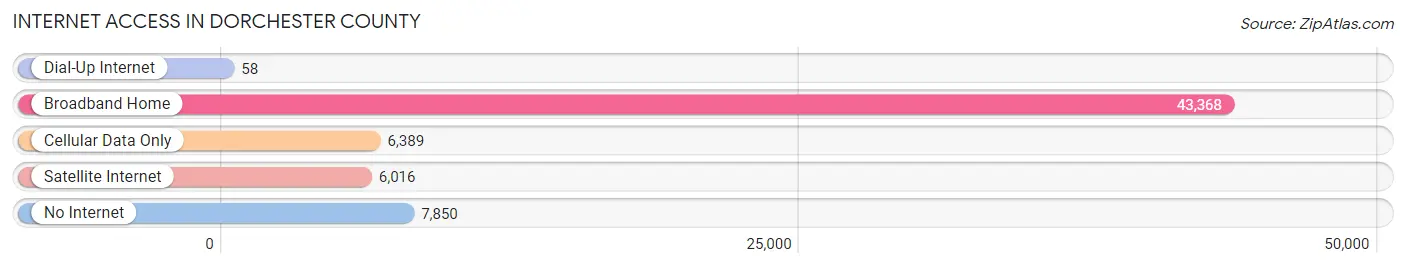
| Internet Type | # Households | % Households |
| Dial-Up Internet | 58 | 0.1% |
| Broadband Home | 43,368 | 72.6% |
| Cellular Data Only | 6,389 | 10.7% |
| Satellite Internet | 6,016 | 10.1% |
| No Internet | 7,850 | 13.1% |
| Total | 59,731 | 100.0% |
Dorchester County Summary
Dorchester County, South Carolina is located in the Lowcountry region of the state, and is part of the Charleston-North Charleston-Summerville Metropolitan Statistical Area. The county is bordered by Berkeley, Charleston, and Colleton Counties. Dorchester County is home to a population of over 150,000 people, and is the fourth most populous county in South Carolina.
History
Dorchester County was established in 1897 from parts of Colleton and Berkeley Counties. The county was named after the town of Dorchester, which was founded in 1696 by Puritans from Dorchester, Massachusetts. The town was abandoned in 1778 during the Revolutionary War, but the county kept the name.
The county was home to several Native American tribes, including the Catawba, Santee, and Edisto. The Catawba were the most prominent tribe in the area, and their presence is still felt today in the county’s many rivers and streams.
In the early 19th century, Dorchester County was a major cotton producer. The county was also home to several large plantations, which relied on the labor of enslaved African Americans. After the Civil War, the county’s economy shifted to timber and turpentine production.
Geography
Dorchester County is located in the Lowcountry region of South Carolina, and is bordered by Berkeley, Charleston, and Colleton Counties. The county covers an area of 837 square miles, and is home to several rivers and streams, including the Ashley, Cooper, and Edisto Rivers. The county is also home to several state parks, including Givhans Ferry State Park and Santee State Park.
The county’s terrain is mostly flat, with some rolling hills in the northern part of the county. The climate is humid subtropical, with hot, humid summers and mild winters.
Economy
Dorchester County’s economy is largely based on manufacturing, agriculture, and tourism. The county is home to several large manufacturing companies, including Boeing, Bosch, and Volvo. The county is also home to several large farms, which produce a variety of crops, including corn, soybeans, and cotton.
Tourism is also an important part of the county’s economy. The county is home to several popular tourist attractions, including the Angel Oak Tree, the Edisto Memorial Gardens, and the Summerville Historic District.
Demographics
As of the 2010 census, Dorchester County had a population of 136,555. The population is made up of a variety of racial and ethnic groups, including White (63.3%), African American (30.2%), Hispanic or Latino (3.2%), and Asian (1.7%). The median household income in the county is $50,945, and the median home value is $179,400.
Conclusion
Dorchester County, South Carolina is a vibrant and diverse county located in the Lowcountry region of the state. The county is home to a population of over 150,000 people, and is the fourth most populous county in South Carolina. The county’s economy is largely based on manufacturing, agriculture, and tourism, and the county is home to several popular tourist attractions. The county is also home to a variety of racial and ethnic groups, and the median household income in the county is $50,945.
Common Questions
What is Per Capita Income in Dorchester County?
Per Capita income in Dorchester County is $36,543.
What is the Median Family Income in Dorchester County?
Median Family Income in Dorchester County is $91,847.
What is the Median Household income in Dorchester County?
Median Household Income in Dorchester County is $73,686.
What is Income or Wage Gap in Dorchester County?
Income or Wage Gap in Dorchester County is 33.1%.
Women in Dorchester County earn 66.9 cents for every dollar earned by a man.
What is Family Income Deficit in Dorchester County?
Family Income Deficit in Dorchester County is $12,181.
Families that are below poverty line in Dorchester County earn $12,181 less on average than the poverty threshold level.
What is Inequality or Gini Index in Dorchester County?
Inequality or Gini Index in Dorchester County is 0.43.
What is the Total Population of Dorchester County?
Total Population of Dorchester County is 162,139.
What is the Total Male Population of Dorchester County?
Total Male Population of Dorchester County is 79,482.
What is the Total Female Population of Dorchester County?
Total Female Population of Dorchester County is 82,657.
What is the Ratio of Males per 100 Females in Dorchester County?
There are 96.16 Males per 100 Females in Dorchester County.
What is the Ratio of Females per 100 Males in Dorchester County?
There are 103.99 Females per 100 Males in Dorchester County.
What is the Median Population Age in Dorchester County?
Median Population Age in Dorchester County is 37.7 Years.
What is the Average Family Size in Dorchester County
Average Family Size in Dorchester County is 3.2 People.
What is the Average Household Size in Dorchester County
Average Household Size in Dorchester County is 2.7 People.
How Large is the Labor Force in Dorchester County?
There are 83,354 People in the Labor Forcein in Dorchester County.
What is the Percentage of People in the Labor Force in Dorchester County?
65.1% of People are in the Labor Force in Dorchester County.
What is the Unemployment Rate in Dorchester County?
Unemployment Rate in Dorchester County is 5.5%.