Cities with the Lowest Births per 1,000 Women in Labor Force in the United States
RELATED REPORTS & OPTIONS
Lowest Birth Rate | In Labor Force
United States
Compare Cities
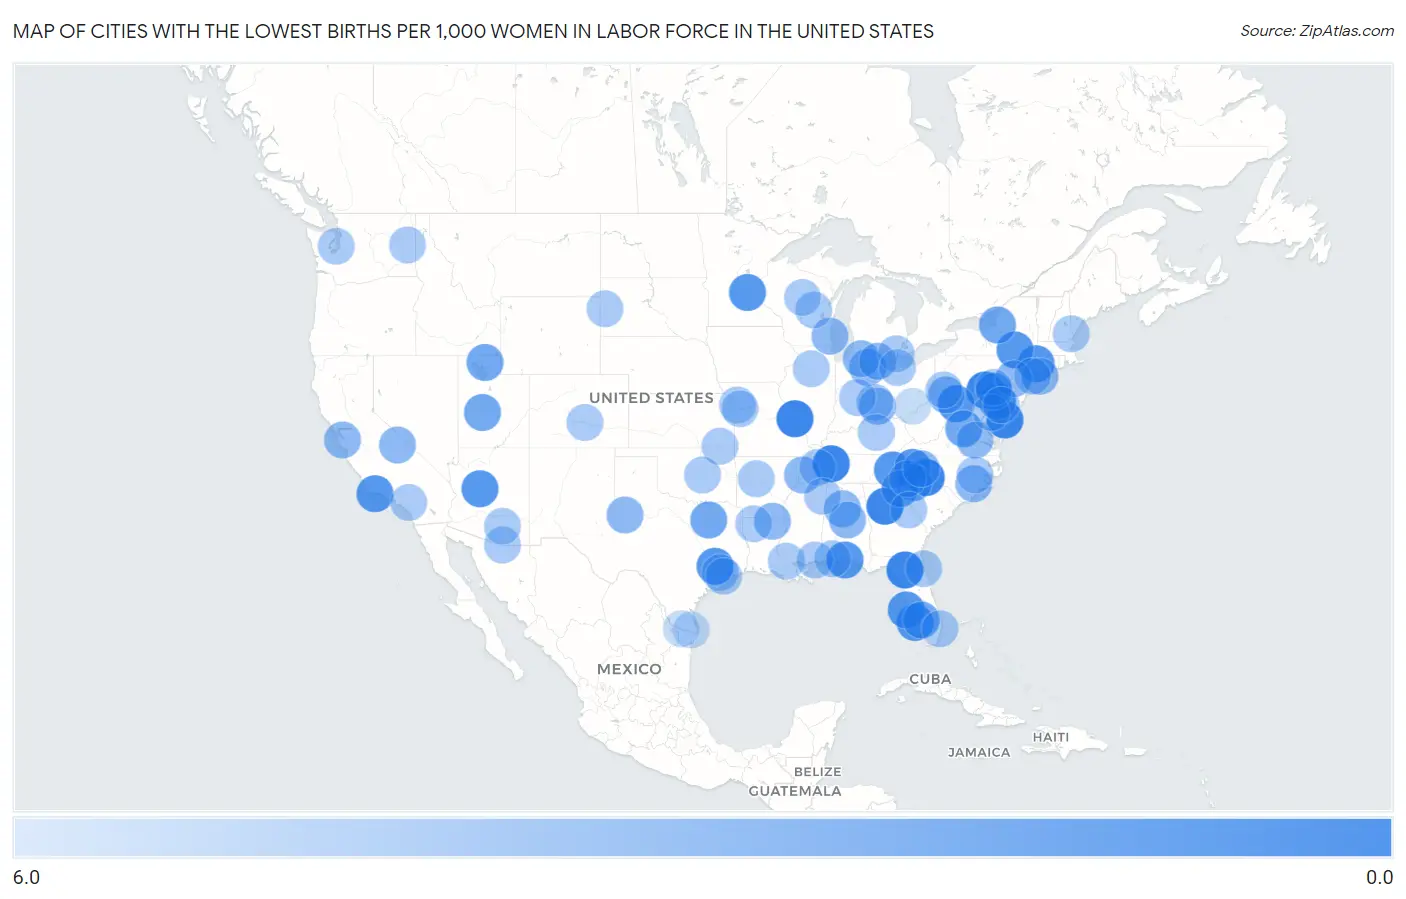
Map of Cities with the Lowest Births per 1,000 Women in Labor Force in the United States
6.0
0.0
Cities with the Lowest Births per 1,000 Women in Labor Force in the United States
| City | Births / 1,000 Women | vs State | vs National | |
| 1. | Conyers | 1.0 | 47.0(-46.0)#1 | 48.0(-47.0)#1 |
| 2. | Maplewood | 1.0 | 51.0(-50.0)#1 | 48.0(-47.0)#2 |
| 3. | High Springs | 1.0 | 44.0(-43.0)#1 | 48.0(-47.0)#3 |
| 4. | Ranlo | 1.0 | 46.0(-45.0)#1 | 48.0(-47.0)#4 |
| 5. | Waverly | 1.0 | 47.0(-46.0)#1 | 48.0(-47.0)#5 |
| 6. | Laurel | 1.0 | 43.0(-42.0)#1 | 48.0(-47.0)#6 |
| 7. | Messiah College | 1.0 | 47.0(-46.0)#1 | 48.0(-47.0)#7 |
| 8. | Navarre | 2.0 | 44.0(-42.0)#2 | 48.0(-46.0)#8 |
| 9. | Havre De Grace | 2.0 | 50.0(-48.0)#1 | 48.0(-46.0)#9 |
| 10. | Isla Vista | 2.0 | 45.0(-43.0)#1 | 48.0(-46.0)#10 |
| 11. | Prairie View | 2.0 | 50.0(-48.0)#1 | 48.0(-46.0)#11 |
| 12. | Albertville | 2.0 | 54.0(-52.0)#1 | 48.0(-46.0)#12 |
| 13. | Mcgregor | 2.0 | 44.0(-42.0)#3 | 48.0(-46.0)#13 |
| 14. | New Milford | 2.0 | 43.0(-41.0)#1 | 48.0(-46.0)#14 |
| 15. | Williamson | 2.0 | 47.0(-45.0)#1 | 48.0(-46.0)#15 |
| 16. | Keyser | 2.0 | 45.0(-43.0)#1 | 48.0(-46.0)#16 |
| 17. | Gatlinburg | 2.0 | 47.0(-45.0)#2 | 48.0(-46.0)#17 |
| 18. | Kensington Park | 2.0 | 44.0(-42.0)#4 | 48.0(-46.0)#18 |
| 19. | Kane Borough | 2.0 | 47.0(-45.0)#2 | 48.0(-46.0)#19 |
| 20. | Delhi | 2.0 | 47.0(-45.0)#1 | 48.0(-46.0)#20 |
| 21. | Spruce Pine | 2.0 | 46.0(-44.0)#2 | 48.0(-46.0)#21 |
| 22. | Boiling Springs | 3.0 | 49.0(-46.0)#1 | 48.0(-45.0)#22 |
| 23. | University Of Virginia | 3.0 | 45.0(-42.0)#1 | 48.0(-45.0)#23 |
| 24. | Middletown Borough | 3.0 | 47.0(-44.0)#3 | 48.0(-45.0)#24 |
| 25. | Seneca | 3.0 | 49.0(-46.0)#2 | 48.0(-45.0)#25 |
| 26. | Labelle | 3.0 | 44.0(-41.0)#5 | 48.0(-45.0)#26 |
| 27. | Mclendon Chisholm | 3.0 | 50.0(-47.0)#2 | 48.0(-45.0)#27 |
| 28. | Landisville | 3.0 | 47.0(-44.0)#4 | 48.0(-45.0)#28 |
| 29. | Fillmore | 3.0 | 47.0(-44.0)#1 | 48.0(-45.0)#29 |
| 30. | Tullytown Borough | 3.0 | 47.0(-44.0)#5 | 48.0(-45.0)#30 |
| 31. | Pulaski | 3.0 | 47.0(-44.0)#2 | 48.0(-45.0)#31 |
| 32. | Elwood | 3.0 | 47.0(-44.0)#2 | 48.0(-45.0)#32 |
| 33. | Forest Park | 4.0 | 51.0(-47.0)#1 | 48.0(-44.0)#33 |
| 34. | Stanford | 4.0 | 45.0(-41.0)#2 | 48.0(-44.0)#34 |
| 35. | Atoka | 4.0 | 47.0(-43.0)#3 | 48.0(-44.0)#35 |
| 36. | Bastrop | 4.0 | 52.0(-48.0)#1 | 48.0(-44.0)#36 |
| 37. | Pleasant Grove | 4.0 | 49.0(-45.0)#1 | 48.0(-44.0)#37 |
| 38. | St Francis | 4.0 | 48.0(-44.0)#1 | 48.0(-44.0)#38 |
| 39. | Brownfield | 4.0 | 50.0(-46.0)#3 | 48.0(-44.0)#39 |
| 40. | Clanton | 4.0 | 49.0(-45.0)#2 | 48.0(-44.0)#40 |
| 41. | Stony Brook University | 4.0 | 47.0(-43.0)#3 | 48.0(-44.0)#41 |
| 42. | Woodlake | 4.0 | 45.0(-41.0)#2 | 48.0(-44.0)#42 |
| 43. | Elkins Park | 4.0 | 47.0(-43.0)#6 | 48.0(-44.0)#43 |
| 44. | East Flat Rock | 4.0 | 46.0(-42.0)#3 | 48.0(-44.0)#44 |
| 45. | Sawmills | 4.0 | 46.0(-42.0)#4 | 48.0(-44.0)#45 |
| 46. | Avilla | 4.0 | 51.0(-47.0)#1 | 48.0(-44.0)#46 |
| 47. | Leith Hatfield | 4.0 | 47.0(-43.0)#7 | 48.0(-44.0)#47 |
| 48. | Constantine | 4.0 | 48.0(-44.0)#1 | 48.0(-44.0)#48 |
| 49. | Big Pine | 4.0 | 45.0(-41.0)#3 | 48.0(-44.0)#49 |
| 50. | Youngsville Borough | 4.0 | 47.0(-43.0)#8 | 48.0(-44.0)#50 |
| 51. | Beulaville | 4.0 | 46.0(-42.0)#5 | 48.0(-44.0)#51 |
| 52. | Pioneer | 4.0 | 51.0(-47.0)#2 | 48.0(-44.0)#52 |
| 53. | Oxford | 4.0 | 50.0(-46.0)#1 | 48.0(-44.0)#53 |
| 54. | Glen Cove | 5.0 | 47.0(-42.0)#4 | 48.0(-43.0)#54 |
| 55. | Oxford | 5.0 | 51.0(-46.0)#3 | 48.0(-43.0)#55 |
| 56. | Nogales | 5.0 | 47.0(-42.0)#2 | 48.0(-43.0)#56 |
| 57. | Shenandoah | 5.0 | 52.0(-47.0)#2 | 48.0(-43.0)#57 |
| 58. | St Augustine | 5.0 | 44.0(-39.0)#6 | 48.0(-43.0)#58 |
| 59. | D Iberville | 5.0 | 56.0(-51.0)#1 | 48.0(-43.0)#59 |
| 60. | Cheney | 5.0 | 45.0(-40.0)#1 | 48.0(-43.0)#60 |
| 61. | Minden | 5.0 | 52.0(-47.0)#3 | 48.0(-43.0)#61 |
| 62. | Four Corners | 5.0 | 50.0(-45.0)#4 | 48.0(-43.0)#62 |
| 63. | Wilton Manors | 5.0 | 44.0(-39.0)#7 | 48.0(-43.0)#63 |
| 64. | Manvel | 5.0 | 50.0(-45.0)#5 | 48.0(-43.0)#64 |
| 65. | Durham | 5.0 | 44.0(-39.0)#1 | 48.0(-43.0)#65 |
| 66. | Kearney | 5.0 | 51.0(-46.0)#2 | 48.0(-43.0)#66 |
| 67. | Wakefield-Peace Dale | 5.0 | 44.0(-39.0)#1 | 48.0(-43.0)#67 |
| 68. | Keansburg Borough | 5.0 | 50.0(-45.0)#2 | 48.0(-43.0)#68 |
| 69. | Edgewater | 5.0 | 50.0(-45.0)#2 | 48.0(-43.0)#69 |
| 70. | Coffeyville | 5.0 | 54.0(-49.0)#1 | 48.0(-43.0)#70 |
| 71. | Milan | 5.0 | 47.0(-42.0)#4 | 48.0(-43.0)#71 |
| 72. | Rumson Borough | 5.0 | 50.0(-45.0)#3 | 48.0(-43.0)#72 |
| 73. | Robertsdale | 5.0 | 49.0(-44.0)#3 | 48.0(-43.0)#73 |
| 74. | Catalina | 5.0 | 47.0(-42.0)#3 | 48.0(-43.0)#74 |
| 75. | Waupaca | 5.0 | 48.0(-43.0)#2 | 48.0(-43.0)#75 |
| 76. | Wilmore | 5.0 | 50.0(-45.0)#1 | 48.0(-43.0)#76 |
| 77. | Cumberland | 5.0 | 51.0(-46.0)#2 | 48.0(-43.0)#77 |
| 78. | Spring Valley | 5.0 | 49.0(-44.0)#1 | 48.0(-43.0)#78 |
| 79. | El Cerrito | 5.0 | 45.0(-40.0)#4 | 48.0(-43.0)#79 |
| 80. | Gibraltar | 5.0 | 48.0(-43.0)#2 | 48.0(-43.0)#80 |
| 81. | Fulton | 5.0 | 56.0(-51.0)#2 | 48.0(-43.0)#81 |
| 82. | Bethel | 5.0 | 45.0(-40.0)#2 | 48.0(-43.0)#82 |
| 83. | Monongahela | 5.0 | 47.0(-42.0)#9 | 48.0(-43.0)#83 |
| 84. | Florence | 5.0 | 42.0(-37.0)#1 | 48.0(-43.0)#84 |
| 85. | Harlem | 5.0 | 47.0(-42.0)#2 | 48.0(-43.0)#85 |
| 86. | Pottsville | 5.0 | 51.0(-46.0)#1 | 48.0(-43.0)#86 |
| 87. | Buckner | 5.0 | 51.0(-46.0)#3 | 48.0(-43.0)#87 |
| 88. | Reynoldsville Borough | 5.0 | 47.0(-42.0)#10 | 48.0(-43.0)#88 |
| 89. | Bentleyville Borough | 5.0 | 47.0(-42.0)#11 | 48.0(-43.0)#89 |
| 90. | New Wilmington Borough | 5.0 | 47.0(-42.0)#12 | 48.0(-43.0)#90 |
| 91. | Snow Hill | 5.0 | 46.0(-41.0)#6 | 48.0(-43.0)#91 |
| 92. | Stony Prairie | 5.0 | 51.0(-46.0)#4 | 48.0(-43.0)#92 |
| 93. | Deadwood | 5.0 | 59.0(-54.0)#1 | 48.0(-43.0)#93 |
| 94. | Avon | 5.0 | 47.0(-42.0)#13 | 48.0(-43.0)#94 |
| 95. | Marathon City | 5.0 | 48.0(-43.0)#3 | 48.0(-43.0)#95 |
| 96. | Meeker | 5.0 | 51.0(-46.0)#1 | 48.0(-43.0)#96 |
| 97. | Galena | 5.0 | 50.0(-45.0)#3 | 48.0(-43.0)#97 |
| 98. | San Benito | 6.0 | 50.0(-44.0)#6 | 48.0(-42.0)#98 |
| 99. | Athens | 6.0 | 51.0(-45.0)#5 | 48.0(-42.0)#99 |
| 100. | Palmview | 6.0 | 50.0(-44.0)#7 | 48.0(-42.0)#100 |
Common Questions
What are the Top 10 Cities with the Lowest Births per 1,000 Women in Labor Force in the United States?
Top 10 Cities with the Lowest Births per 1,000 Women in Labor Force in the United States are:
#1
1.0
#2
1.0
#3
1.0
#4
1.0
#5
1.0
#6
1.0
#7
1.0
#8
2.0
#9
2.0
#10
2.0
What city has the Lowest Births per 1,000 Women in Labor Force in the United States?
Conyers has the Lowest Births per 1,000 Women in Labor Force in the United States with 1.0.
What is the Number Births per 1,000 Women in Labor Force in the United States?
Number Births per 1,000 Women in Labor Force in the United States is 48.0.