Cities with the Highest Percentage of Immigrants from France in the United States
RELATED REPORTS & OPTIONS
France
United States
Compare Cities
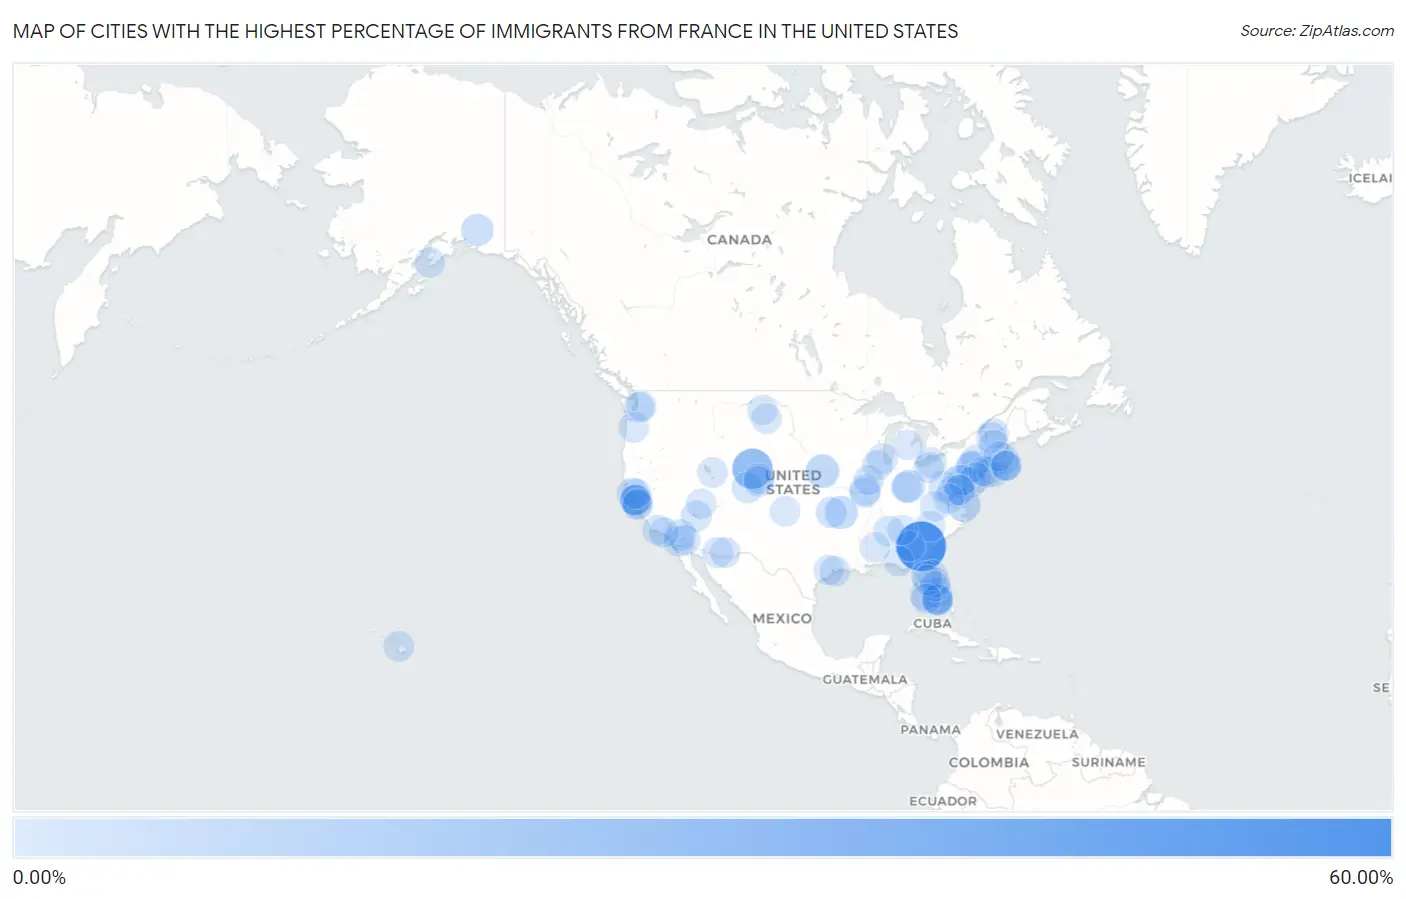
Map of Cities with the Highest Percentage of Immigrants from France in the United States
0.00%
60.00%
Cities with the Highest Percentage of Immigrants from France in the United States
| City | France | vs State | vs National | |
| 1. | Norristown | 60.00% | 0.035%(+60.0)#1 | 0.056%(+59.9)#1 |
| 2. | Albany | 31.25% | 0.023%(+31.2)#1 | 0.056%(+31.2)#2 |
| 3. | South Bend | 10.87% | 0.015%(+10.9)#1 | 0.056%(+10.8)#3 |
| 4. | Yorktown | 10.60% | 0.059%(+10.5)#1 | 0.056%(+10.5)#4 |
| 5. | Beaver | 9.18% | 0.016%(+9.17)#1 | 0.056%(+9.13)#5 |
| 6. | Rocky Hill Borough | 8.31% | 0.074%(+8.24)#1 | 0.056%(+8.26)#6 |
| 7. | Kings Mills | 8.02% | 0.027%(+8.00)#1 | 0.056%(+7.97)#7 |
| 8. | Table Rock | 7.00% | 0.034%(+6.97)#1 | 0.056%(+6.94)#8 |
| 9. | Kenny Lake | 6.76% | 0.026%(+6.73)#1 | 0.056%(+6.70)#9 |
| 10. | Bay Harbor Islands | 5.01% | 0.092%(+4.92)#1 | 0.056%(+4.96)#10 |
| 11. | The Hideout | 4.88% | 0.034%(+4.85)#2 | 0.056%(+4.83)#11 |
| 12. | Cornwall | 4.82% | 0.078%(+4.74)#1 | 0.056%(+4.76)#12 |
| 13. | Cazadero | 4.53% | 0.10%(+4.43)#1 | 0.056%(+4.48)#13 |
| 14. | Bridgehampton | 4.16% | 0.13%(+4.03)#1 | 0.056%(+4.10)#14 |
| 15. | Highlands Borough | 3.68% | 0.074%(+3.61)#2 | 0.056%(+3.62)#15 |
| 16. | Snowmass Village | 3.51% | 0.045%(+3.47)#1 | 0.056%(+3.46)#16 |
| 17. | Langley | 3.50% | 0.014%(+3.49)#1 | 0.056%(+3.45)#17 |
| 18. | Loretto Borough | 3.34% | 0.034%(+3.31)#3 | 0.056%(+3.29)#18 |
| 19. | Desert Edge | 3.34% | 0.10%(+3.24)#2 | 0.056%(+3.28)#19 |
| 20. | West Point | 3.26% | 0.022%(+3.24)#1 | 0.056%(+3.21)#20 |
| 21. | White Mills | 3.08% | 0.034%(+3.05)#4 | 0.056%(+3.03)#21 |
| 22. | Elsah | 2.86% | 0.046%(+2.82)#1 | 0.056%(+2.81)#22 |
| 23. | Berkshire Lakes | 2.75% | 0.092%(+2.65)#2 | 0.056%(+2.69)#23 |
| 24. | Margaretville | 2.74% | 0.13%(+2.61)#2 | 0.056%(+2.69)#24 |
| 25. | Meadview | 2.58% | 0.051%(+2.53)#1 | 0.056%(+2.52)#25 |
| 26. | Surfside | 2.52% | 0.092%(+2.43)#3 | 0.056%(+2.47)#26 |
| 27. | Mcconnells | 2.48% | 0.038%(+2.44)#1 | 0.056%(+2.42)#27 |
| 28. | Arivaca Junction | 2.48% | 0.051%(+2.42)#2 | 0.056%(+2.42)#28 |
| 29. | Eldorado Springs | 2.46% | 0.045%(+2.42)#2 | 0.056%(+2.41)#29 |
| 30. | Lyons | 2.43% | 0.045%(+2.38)#3 | 0.056%(+2.37)#30 |
| 31. | Puako | 2.38% | 0.067%(+2.31)#1 | 0.056%(+2.33)#31 |
| 32. | Deer Park | 2.37% | 0.068%(+2.31)#1 | 0.056%(+2.32)#32 |
| 33. | Glen Echo Park | 2.33% | 0.020%(+2.31)#1 | 0.056%(+2.27)#33 |
| 34. | Julian | 2.25% | 0.10%(+2.15)#3 | 0.056%(+2.20)#34 |
| 35. | Geneva On The Lake | 2.21% | 0.027%(+2.18)#2 | 0.056%(+2.16)#35 |
| 36. | Muir Beach | 2.21% | 0.10%(+2.11)#4 | 0.056%(+2.16)#36 |
| 37. | Flint Hill | 2.19% | 0.059%(+2.14)#2 | 0.056%(+2.14)#37 |
| 38. | Sausalito | 2.16% | 0.10%(+2.05)#5 | 0.056%(+2.10)#38 |
| 39. | Stinson Beach | 2.16% | 0.10%(+2.05)#6 | 0.056%(+2.10)#39 |
| 40. | Hingham | 2.10% | 0.11%(+2.00)#1 | 0.056%(+2.05)#40 |
| 41. | Stowe | 2.08% | 0.049%(+2.03)#1 | 0.056%(+2.02)#41 |
| 42. | Bombay Beach | 2.07% | 0.10%(+1.96)#7 | 0.056%(+2.01)#42 |
| 43. | Underhill Flats | 2.00% | 0.049%(+1.95)#2 | 0.056%(+1.94)#43 |
| 44. | Princeton | 1.94% | 0.074%(+1.87)#3 | 0.056%(+1.89)#44 |
| 45. | Chunky | 1.87% | 0.0088%(+1.86)#1 | 0.056%(+1.82)#45 |
| 46. | Emigration Canyon | 1.86% | 0.030%(+1.83)#1 | 0.056%(+1.81)#46 |
| 47. | Mettawa | 1.83% | 0.046%(+1.78)#2 | 0.056%(+1.77)#47 |
| 48. | Harlem Heights | 1.83% | 0.092%(+1.74)#4 | 0.056%(+1.77)#48 |
| 49. | Chagrin Falls | 1.82% | 0.027%(+1.79)#3 | 0.056%(+1.77)#49 |
| 50. | Tombstone | 1.82% | 0.051%(+1.77)#3 | 0.056%(+1.76)#50 |
| 51. | Ardentown | 1.79% | 0.020%(+1.77)#1 | 0.056%(+1.74)#51 |
| 52. | Finneytown | 1.79% | 0.027%(+1.76)#4 | 0.056%(+1.73)#52 |
| 53. | Laurel Run Borough | 1.78% | 0.034%(+1.75)#5 | 0.056%(+1.73)#53 |
| 54. | Glen Echo | 1.77% | 0.068%(+1.70)#2 | 0.056%(+1.72)#54 |
| 55. | Yorklyn | 1.77% | 0.034%(+1.74)#6 | 0.056%(+1.72)#55 |
| 56. | Chevy Chase | 1.75% | 0.068%(+1.68)#3 | 0.056%(+1.69)#56 |
| 57. | Bolivar Peninsula | 1.71% | 0.042%(+1.67)#1 | 0.056%(+1.66)#57 |
| 58. | Cedar Hills | 1.69% | 0.065%(+1.62)#1 | 0.056%(+1.63)#58 |
| 59. | Bolinas | 1.64% | 0.10%(+1.54)#8 | 0.056%(+1.58)#59 |
| 60. | Maple Heights Lake Desire | 1.63% | 0.064%(+1.57)#1 | 0.056%(+1.57)#60 |
| 61. | Tequesta | 1.62% | 0.092%(+1.53)#5 | 0.056%(+1.56)#61 |
| 62. | Ivy | 1.61% | 0.059%(+1.55)#3 | 0.056%(+1.56)#62 |
| 63. | Goodwell | 1.61% | 0.014%(+1.59)#2 | 0.056%(+1.55)#63 |
| 64. | Roosevelt Gardens | 1.59% | 0.092%(+1.50)#6 | 0.056%(+1.54)#64 |
| 65. | Plano | 1.59% | 0.046%(+1.55)#3 | 0.056%(+1.54)#65 |
| 66. | Irasburg | 1.59% | 0.049%(+1.54)#3 | 0.056%(+1.53)#66 |
| 67. | Lake Petersburg | 1.57% | 0.046%(+1.53)#4 | 0.056%(+1.52)#67 |
| 68. | Stony Brook University | 1.56% | 0.13%(+1.44)#3 | 0.056%(+1.51)#68 |
| 69. | Chipley | 1.56% | 0.092%(+1.47)#7 | 0.056%(+1.51)#69 |
| 70. | Toro Canyon | 1.54% | 0.10%(+1.43)#9 | 0.056%(+1.48)#70 |
| 71. | Baker | 1.53% | 0.017%(+1.52)#1 | 0.056%(+1.48)#71 |
| 72. | Reynolds | 1.51% | 0.035%(+1.48)#2 | 0.056%(+1.46)#72 |
| 73. | Mamaroneck | 1.51% | 0.13%(+1.38)#4 | 0.056%(+1.45)#73 |
| 74. | Harrisville | 1.50% | 0.015%(+1.49)#1 | 0.056%(+1.45)#74 |
| 75. | Little Ponderosa | 1.49% | 0.014%(+1.47)#3 | 0.056%(+1.43)#75 |
| 76. | Prices Fork | 1.48% | 0.059%(+1.42)#4 | 0.056%(+1.42)#76 |
| 77. | La Honda | 1.48% | 0.10%(+1.37)#10 | 0.056%(+1.42)#77 |
| 78. | Strawberry Cdp Marin County | 1.47% | 0.10%(+1.37)#11 | 0.056%(+1.42)#78 |
| 79. | Hanover | 1.46% | 0.051%(+1.41)#1 | 0.056%(+1.40)#79 |
| 80. | Sanford | 1.45% | 0.026%(+1.43)#1 | 0.056%(+1.40)#80 |
| 81. | Biscayne Park | 1.45% | 0.092%(+1.36)#8 | 0.056%(+1.40)#81 |
| 82. | Seldovia Village | 1.44% | 0.026%(+1.41)#2 | 0.056%(+1.38)#82 |
| 83. | Silver Lake | 1.43% | 0.092%(+1.33)#9 | 0.056%(+1.37)#83 |
| 84. | Indialantic | 1.43% | 0.092%(+1.33)#10 | 0.056%(+1.37)#84 |
| 85. | West Glendive | 1.41% | 0.017%(+1.40)#2 | 0.056%(+1.36)#85 |
| 86. | Woods Hole | 1.41% | 0.11%(+1.31)#2 | 0.056%(+1.36)#86 |
| 87. | New Harmony | 1.40% | 0.030%(+1.37)#2 | 0.056%(+1.35)#87 |
| 88. | Topanga | 1.38% | 0.10%(+1.28)#12 | 0.056%(+1.32)#88 |
| 89. | Southside Place | 1.37% | 0.042%(+1.33)#2 | 0.056%(+1.31)#89 |
| 90. | Ponce Inlet | 1.37% | 0.092%(+1.27)#11 | 0.056%(+1.31)#90 |
| 91. | Devens | 1.36% | 0.11%(+1.26)#3 | 0.056%(+1.31)#91 |
| 92. | New Seabury | 1.36% | 0.11%(+1.25)#4 | 0.056%(+1.30)#92 |
| 93. | Bay Hill | 1.35% | 0.092%(+1.26)#12 | 0.056%(+1.30)#93 |
| 94. | Mashpee Neck | 1.34% | 0.11%(+1.23)#5 | 0.056%(+1.28)#94 |
| 95. | Snoqualmie | 1.32% | 0.064%(+1.25)#2 | 0.056%(+1.26)#95 |
| 96. | Emerald Lake Hills | 1.29% | 0.10%(+1.19)#13 | 0.056%(+1.23)#96 |
| 97. | Plainville | 1.27% | 0.035%(+1.24)#3 | 0.056%(+1.22)#97 |
| 98. | Gifford | 1.27% | 0.092%(+1.18)#13 | 0.056%(+1.22)#98 |
| 99. | Calistoga | 1.27% | 0.10%(+1.17)#14 | 0.056%(+1.22)#99 |
| 100. | Verona Walk | 1.27% | 0.092%(+1.18)#14 | 0.056%(+1.21)#100 |
Common Questions
What are the Top 10 Cities with the Highest Percentage of Immigrants from France in the United States?
Top 10 Cities with the Highest Percentage of Immigrants from France in the United States are:
#1
60.00%
#2
31.25%
#3
10.87%
#4
10.60%
#5
9.18%
#6
8.02%
#7
7.00%
#8
6.76%
#9
5.01%
#10
4.88%
What city has the Highest Percentage of Immigrants from France in the United States?
Norristown has the Highest Percentage of Immigrants from France in the United States with 60.00%.
What is the Percentage of Immigrants from France in the United States?
Percentage of Immigrants from France in the United States is 0.056%.