Cities with the Lowest Poverty Level Among Children Under the Age of 5 in the United States
RELATED REPORTS & OPTIONS
Lowest Poverty | Child 0-5
United States
Compare Cities
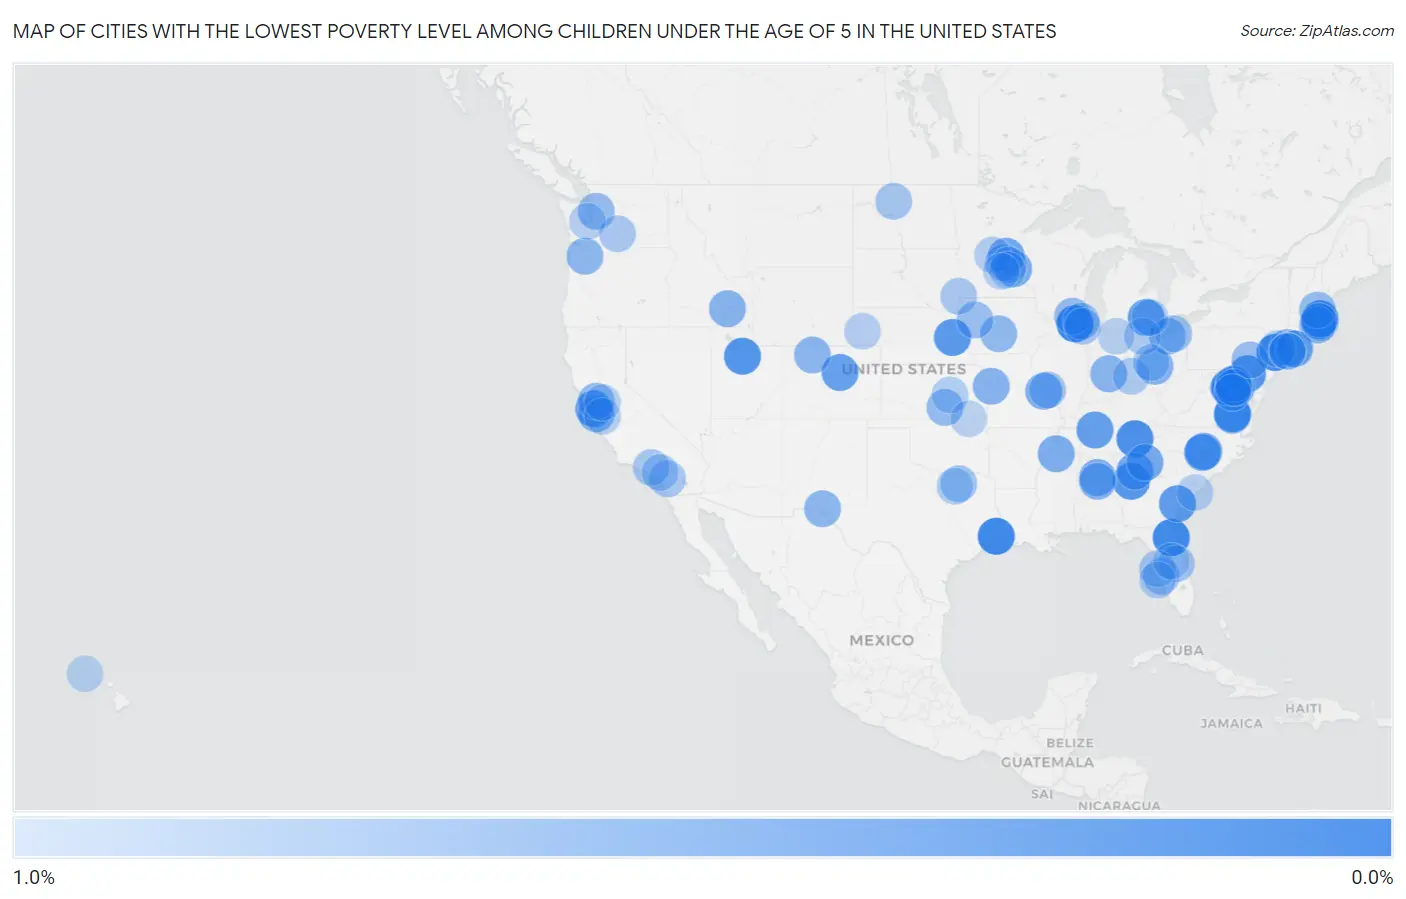
Map of Cities with the Lowest Poverty Level Among Children Under the Age of 5 in the United States
1.0%
0.0%
Cities with the Lowest Poverty Level Among Children Under the Age of 5 in the United States
| City | Child Poverty | vs State | vs National | |
| 1. | Huntley | 0.17% | 16.9%(-16.7)#1 | 18.1%(-17.9)#1 |
| 2. | Vidor | 0.21% | 21.1%(-20.9)#1 | 18.1%(-17.9)#2 |
| 3. | Westfield | 0.22% | 14.3%(-14.1)#1 | 18.1%(-17.8)#3 |
| 4. | Fruit Cove | 0.22% | 19.3%(-19.0)#1 | 18.1%(-17.8)#4 |
| 5. | Farragut | 0.29% | 21.4%(-21.1)#1 | 18.1%(-17.8)#5 |
| 6. | Sudley | 0.31% | 13.9%(-13.6)#1 | 18.1%(-17.8)#6 |
| 7. | Highland | 0.33% | 10.0%(-9.66)#1 | 18.1%(-17.7)#7 |
| 8. | Fayetteville | 0.36% | 20.3%(-20.0)#1 | 18.1%(-17.7)#8 |
| 9. | Schuyler | 0.37% | 13.8%(-13.4)#1 | 18.1%(-17.7)#9 |
| 10. | Bel Air South | 0.37% | 12.3%(-11.9)#1 | 18.1%(-17.7)#10 |
| 11. | Oakton | 0.37% | 13.9%(-13.5)#2 | 18.1%(-17.7)#11 |
| 12. | Pooler | 0.40% | 20.3%(-19.9)#2 | 18.1%(-17.7)#12 |
| 13. | Farmington Hills | 0.41% | 20.1%(-19.7)#1 | 18.1%(-17.7)#13 |
| 14. | Fort Lee | 0.41% | 13.9%(-13.5)#3 | 18.1%(-17.6)#14 |
| 15. | Sewickley Borough | 0.41% | 17.3%(-16.8)#1 | 18.1%(-17.6)#15 |
| 16. | Arlington | 0.42% | 12.6%(-12.2)#1 | 18.1%(-17.6)#16 |
| 17. | Foster City | 0.43% | 15.6%(-15.2)#1 | 18.1%(-17.6)#17 |
| 18. | Pleasant View | 0.44% | 21.4%(-21.0)#2 | 18.1%(-17.6)#18 |
| 19. | Highlands Ranch | 0.44% | 11.9%(-11.4)#1 | 18.1%(-17.6)#19 |
| 20. | Southern Pines | 0.48% | 20.3%(-19.8)#1 | 18.1%(-17.6)#20 |
| 21. | Enon | 0.50% | 13.9%(-13.4)#4 | 18.1%(-17.6)#21 |
| 22. | Fort Hunt | 0.50% | 13.9%(-13.4)#5 | 18.1%(-17.6)#22 |
| 23. | Johns Creek | 0.51% | 20.3%(-19.8)#3 | 18.1%(-17.5)#23 |
| 24. | Linton Hall | 0.53% | 13.9%(-13.4)#6 | 18.1%(-17.5)#24 |
| 25. | Cambridge | 0.54% | 11.3%(-10.8)#1 | 18.1%(-17.5)#25 |
| 26. | Cornelia | 0.55% | 20.3%(-19.8)#4 | 18.1%(-17.5)#26 |
| 27. | Pinebluff | 0.56% | 20.3%(-19.7)#2 | 18.1%(-17.5)#27 |
| 28. | Hudson | 0.58% | 14.9%(-14.3)#1 | 18.1%(-17.5)#28 |
| 29. | Newington Forest | 0.59% | 13.9%(-13.3)#7 | 18.1%(-17.5)#29 |
| 30. | Wildwood | 0.60% | 18.4%(-17.8)#1 | 18.1%(-17.5)#30 |
| 31. | Collierville | 0.60% | 21.4%(-20.8)#3 | 18.1%(-17.5)#31 |
| 32. | Gardendale | 0.61% | 25.1%(-24.5)#1 | 18.1%(-17.5)#32 |
| 33. | Aberdeen | 0.64% | 15.8%(-15.2)#1 | 18.1%(-17.4)#33 |
| 34. | Wolf Trap | 0.64% | 13.9%(-13.2)#8 | 18.1%(-17.4)#34 |
| 35. | Dedham | 0.65% | 12.6%(-11.9)#2 | 18.1%(-17.4)#35 |
| 36. | Pleasant Hill | 0.65% | 18.4%(-17.8)#2 | 18.1%(-17.4)#36 |
| 37. | Pickerington | 0.65% | 20.7%(-20.0)#1 | 18.1%(-17.4)#37 |
| 38. | Franklin | 0.66% | 18.4%(-17.8)#1 | 18.1%(-17.4)#38 |
| 39. | Homewood | 0.66% | 25.1%(-24.5)#2 | 18.1%(-17.4)#39 |
| 40. | Cupertino | 0.66% | 15.6%(-14.9)#2 | 18.1%(-17.4)#40 |
| 41. | Burke | 0.67% | 13.9%(-13.2)#9 | 18.1%(-17.4)#41 |
| 42. | Lloyd Harbor | 0.67% | 18.7%(-18.1)#1 | 18.1%(-17.4)#42 |
| 43. | Winchester | 0.68% | 12.6%(-11.9)#3 | 18.1%(-17.4)#43 |
| 44. | Steamboat Springs | 0.68% | 11.9%(-11.2)#2 | 18.1%(-17.4)#44 |
| 45. | Bethany | 0.69% | 14.6%(-13.9)#1 | 18.1%(-17.4)#45 |
| 46. | Homestead Meadows South | 0.69% | 21.1%(-20.4)#2 | 18.1%(-17.4)#46 |
| 47. | Bay Village | 0.70% | 20.7%(-20.0)#2 | 18.1%(-17.4)#47 |
| 48. | Clive | 0.70% | 14.3%(-13.6)#1 | 18.1%(-17.4)#48 |
| 49. | Waimea Cdp Hawaii County | 0.71% | 12.7%(-12.0)#1 | 18.1%(-17.4)#49 |
| 50. | Martinez | 0.72% | 15.6%(-14.9)#3 | 18.1%(-17.3)#50 |
| 51. | Goddard | 0.73% | 16.0%(-15.3)#1 | 18.1%(-17.3)#51 |
| 52. | Selden | 0.74% | 18.7%(-18.0)#2 | 18.1%(-17.3)#52 |
| 53. | Cottage Lake | 0.74% | 12.6%(-11.9)#1 | 18.1%(-17.3)#53 |
| 54. | Bellmawr Borough | 0.74% | 14.3%(-13.5)#2 | 18.1%(-17.3)#54 |
| 55. | Franklin Town | 0.74% | 12.6%(-11.8)#4 | 18.1%(-17.3)#55 |
| 56. | Walworth | 0.75% | 14.9%(-14.1)#2 | 18.1%(-17.3)#56 |
| 57. | Londonderry | 0.75% | 9.4%(-8.63)#1 | 18.1%(-17.3)#57 |
| 58. | Ida Grove | 0.77% | 14.3%(-13.5)#2 | 18.1%(-17.3)#58 |
| 59. | Reinholds | 0.77% | 17.3%(-16.5)#2 | 18.1%(-17.3)#59 |
| 60. | Ramsey | 0.77% | 11.3%(-10.6)#2 | 18.1%(-17.3)#60 |
| 61. | Libertyville | 0.80% | 16.9%(-16.1)#2 | 18.1%(-17.3)#61 |
| 62. | Melissa | 0.81% | 21.1%(-20.3)#3 | 18.1%(-17.3)#62 |
| 63. | Eastlake | 0.81% | 20.7%(-19.9)#3 | 18.1%(-17.3)#63 |
| 64. | Needham | 0.81% | 12.6%(-11.8)#5 | 18.1%(-17.2)#64 |
| 65. | Medford | 0.82% | 18.7%(-17.9)#3 | 18.1%(-17.2)#65 |
| 66. | Richmond Heights | 0.82% | 18.4%(-17.6)#3 | 18.1%(-17.2)#66 |
| 67. | Sun City Center | 0.83% | 19.3%(-18.4)#2 | 18.1%(-17.2)#67 |
| 68. | Surrey | 0.83% | 13.1%(-12.3)#1 | 18.1%(-17.2)#68 |
| 69. | Conway | 0.84% | 19.3%(-18.4)#3 | 18.1%(-17.2)#69 |
| 70. | Aquia Harbour | 0.85% | 13.9%(-13.0)#10 | 18.1%(-17.2)#70 |
| 71. | French Valley | 0.85% | 15.6%(-14.8)#4 | 18.1%(-17.2)#71 |
| 72. | Brandon | 0.85% | 17.4%(-16.6)#1 | 18.1%(-17.2)#72 |
| 73. | La Crescenta Montrose | 0.86% | 15.6%(-14.8)#5 | 18.1%(-17.2)#73 |
| 74. | Gleed | 0.86% | 12.6%(-11.8)#2 | 18.1%(-17.2)#74 |
| 75. | Mount Prospect | 0.86% | 16.9%(-16.1)#3 | 18.1%(-17.2)#75 |
| 76. | Keystone | 0.88% | 19.3%(-18.4)#4 | 18.1%(-17.2)#76 |
| 77. | Perrysburg | 0.88% | 20.7%(-19.8)#4 | 18.1%(-17.2)#77 |
| 78. | Eastvale | 0.88% | 15.6%(-14.7)#6 | 18.1%(-17.2)#78 |
| 79. | Beckett Ridge | 0.88% | 20.7%(-19.8)#5 | 18.1%(-17.2)#79 |
| 80. | Worthington | 0.90% | 20.7%(-19.8)#6 | 18.1%(-17.2)#80 |
| 81. | Hillsboro | 0.92% | 16.0%(-15.1)#2 | 18.1%(-17.1)#81 |
| 82. | Upper Montclair | 0.92% | 14.3%(-13.4)#3 | 18.1%(-17.1)#82 |
| 83. | Bayshore Gardens | 0.92% | 19.3%(-18.3)#5 | 18.1%(-17.1)#83 |
| 84. | Levittown | 0.92% | 18.7%(-17.8)#4 | 18.1%(-17.1)#84 |
| 85. | Bayard | 0.93% | 13.8%(-12.8)#2 | 18.1%(-17.1)#85 |
| 86. | Sartell | 0.93% | 11.3%(-10.4)#3 | 18.1%(-17.1)#86 |
| 87. | Lino Lakes | 0.93% | 11.3%(-10.4)#4 | 18.1%(-17.1)#87 |
| 88. | Artondale | 0.93% | 12.6%(-11.7)#3 | 18.1%(-17.1)#88 |
| 89. | Frisco | 0.93% | 21.1%(-20.2)#4 | 18.1%(-17.1)#89 |
| 90. | Morgan Hill | 0.93% | 15.6%(-14.7)#7 | 18.1%(-17.1)#90 |
| 91. | Royal Oak | 0.94% | 20.1%(-19.2)#2 | 18.1%(-17.1)#91 |
| 92. | Mendota Heights | 0.94% | 11.3%(-10.4)#5 | 18.1%(-17.1)#92 |
| 93. | Topeka | 0.94% | 18.4%(-17.5)#2 | 18.1%(-17.1)#93 |
| 94. | James Island | 0.95% | 22.4%(-21.4)#1 | 18.1%(-17.1)#94 |
| 95. | Caney | 0.96% | 16.0%(-15.0)#3 | 18.1%(-17.1)#95 |
| 96. | Chaska | 0.96% | 11.3%(-10.4)#6 | 18.1%(-17.1)#96 |
| 97. | Discovery Bay | 0.96% | 15.6%(-14.6)#8 | 18.1%(-17.1)#97 |
| 98. | North Massapequa | 0.97% | 18.7%(-17.8)#5 | 18.1%(-17.1)#98 |
| 99. | Montverde | 0.98% | 19.3%(-18.3)#6 | 18.1%(-17.1)#99 |
| 100. | Mililani Mauka | 0.99% | 12.7%(-11.8)#2 | 18.1%(-17.1)#100 |
Common Questions
What are the Top 10 Cities with the Lowest Poverty Level Among Children Under the Age of 5 in the United States?
Top 10 Cities with the Lowest Poverty Level Among Children Under the Age of 5 in the United States are:
What city has the Lowest Poverty Level Among Children Under the Age of 5 in the United States?
Huntley has the Lowest Poverty Level Among Children Under the Age of 5 in the United States with 0.17%.
What is the Poverty Level Among Children Under the Age of 5 in the United States?
Poverty Level Among Children Under the Age of 5 in the United States is 18.1%.