Spartanburg County, SC Map & Demographics
Spartanburg County Map
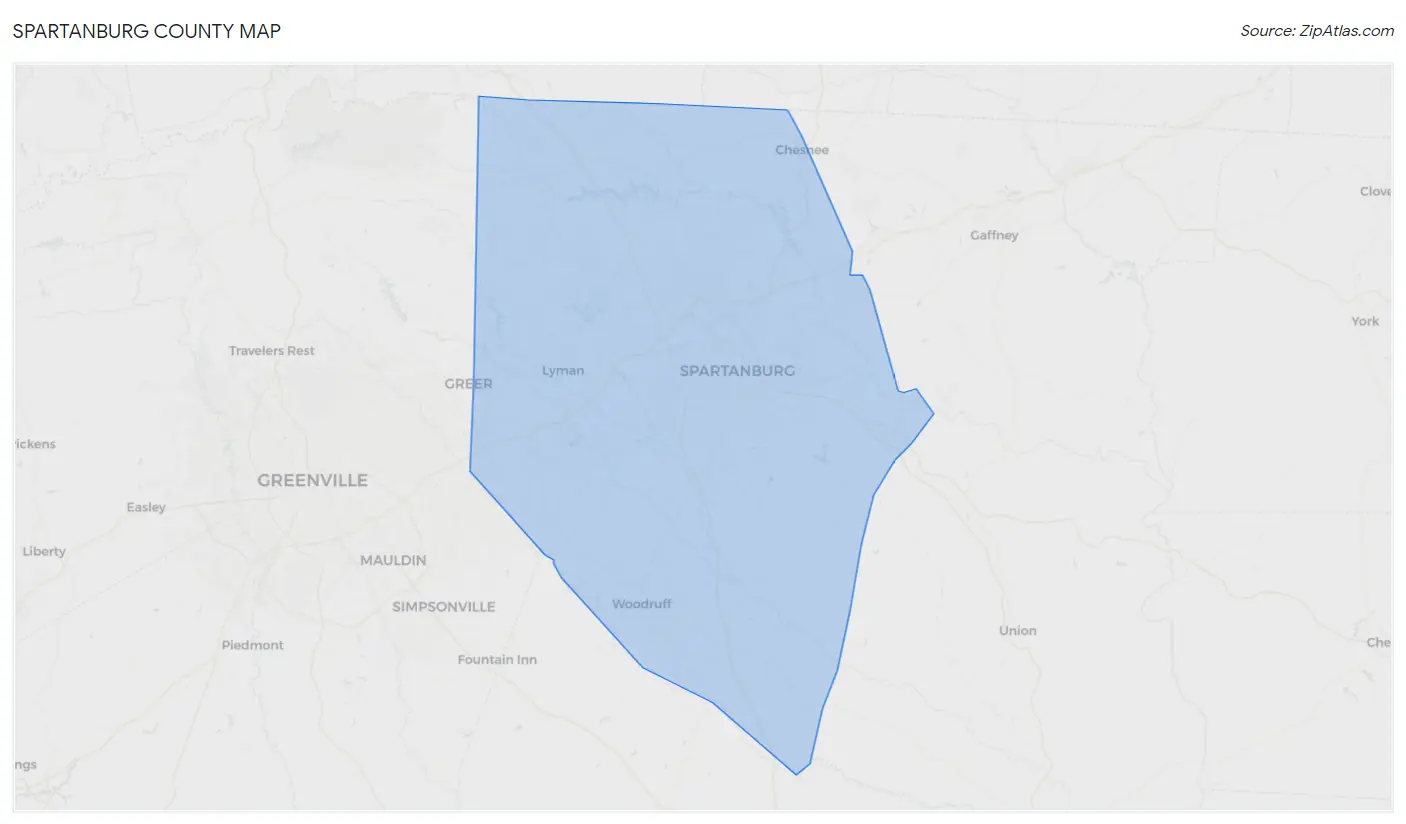
Spartanburg County Overview
$32,039
PER CAPITA INCOME
$75,197
AVG FAMILY INCOME
$61,955
AVG HOUSEHOLD INCOME
27.8%
WAGE / INCOME GAP [ % ]
72.2¢/ $1
WAGE / INCOME GAP [ $ ]
$10,325
FAMILY INCOME DEFICIT
0.45
INEQUALITY / GINI INDEX
330,119
TOTAL POPULATION
161,252
MALE POPULATION
168,867
FEMALE POPULATION
95.49
MALES / 100 FEMALES
104.72
FEMALES / 100 MALES
38.0
MEDIAN AGE
3.1
AVG FAMILY SIZE
2.6
AVG HOUSEHOLD SIZE
162,502
LABOR FORCE [ PEOPLE ]
61.8%
PERCENT IN LABOR FORCE
4.7%
UNEMPLOYMENT RATE
Spartanburg County Area Codes
Income in Spartanburg County
Income Overview in Spartanburg County
Per Capita Income in Spartanburg County is $32,039, while median incomes of families and households are $75,197 and $61,955 respectively.
| Characteristic | Number | Measure |
| Per Capita Income | 330,119 | $32,039 |
| Median Family Income | 86,841 | $75,197 |
| Mean Family Income | 86,841 | $94,406 |
| Median Household Income | 125,394 | $61,955 |
| Mean Household Income | 125,394 | $81,483 |
| Income Deficit | 86,841 | $10,325 |
| Wage / Income Gap (%) | 330,119 | 27.79% |
| Wage / Income Gap ($) | 330,119 | 72.21¢ per $1 |
| Gini / Inequality Index | 330,119 | 0.45 |
Earnings by Sex in Spartanburg County
Average Earnings in Spartanburg County are $37,562, $43,879 for men and $31,684 for women, a difference of 27.8%.
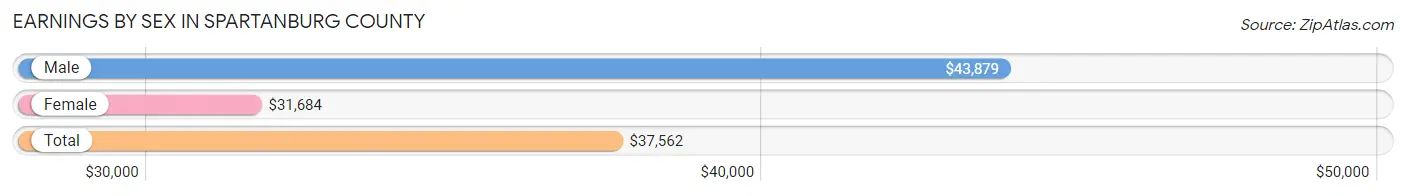
| Sex | Number | Average Earnings |
| Male | 89,621 (52.3%) | $43,879 |
| Female | 81,885 (47.7%) | $31,684 |
| Total | 171,506 (100.0%) | $37,562 |
Earnings by Sex by Income Bracket in Spartanburg County
The most common earnings brackets in Spartanburg County are $100,000+ for men (10,117 | 11.3%) and $2,499 or less for women (5,721 | 7.0%).
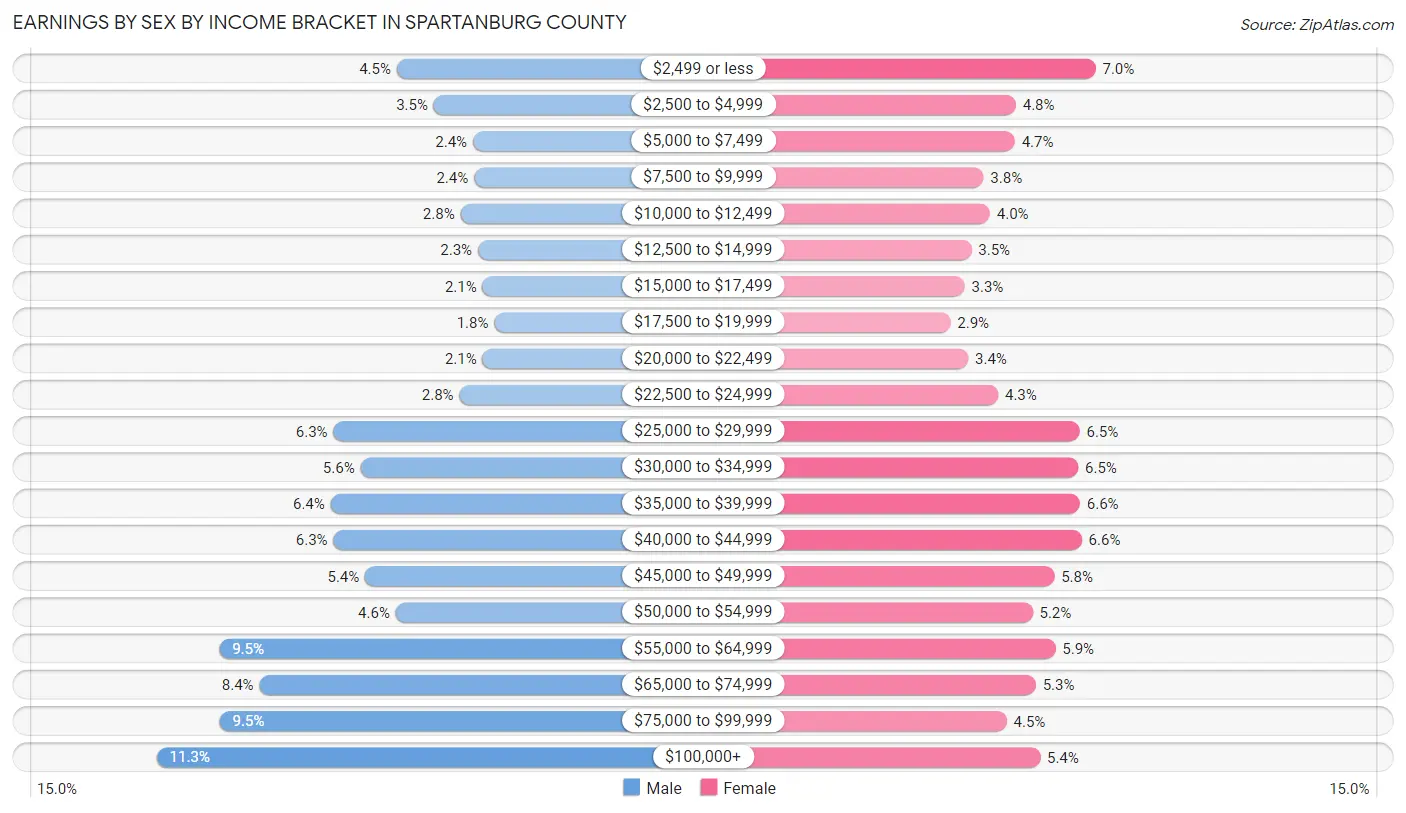
| Income | Male | Female |
| $2,499 or less | 4,067 (4.5%) | 5,721 (7.0%) |
| $2,500 to $4,999 | 3,138 (3.5%) | 3,886 (4.8%) |
| $5,000 to $7,499 | 2,155 (2.4%) | 3,867 (4.7%) |
| $7,500 to $9,999 | 2,121 (2.4%) | 3,143 (3.8%) |
| $10,000 to $12,499 | 2,463 (2.8%) | 3,288 (4.0%) |
| $12,500 to $14,999 | 2,028 (2.3%) | 2,864 (3.5%) |
| $15,000 to $17,499 | 1,909 (2.1%) | 2,708 (3.3%) |
| $17,500 to $19,999 | 1,614 (1.8%) | 2,379 (2.9%) |
| $20,000 to $22,499 | 1,908 (2.1%) | 2,791 (3.4%) |
| $22,500 to $24,999 | 2,495 (2.8%) | 3,478 (4.3%) |
| $25,000 to $29,999 | 5,668 (6.3%) | 5,357 (6.5%) |
| $30,000 to $34,999 | 4,982 (5.6%) | 5,319 (6.5%) |
| $35,000 to $39,999 | 5,735 (6.4%) | 5,365 (6.6%) |
| $40,000 to $44,999 | 5,660 (6.3%) | 5,404 (6.6%) |
| $45,000 to $49,999 | 4,865 (5.4%) | 4,777 (5.8%) |
| $50,000 to $54,999 | 4,095 (4.6%) | 4,275 (5.2%) |
| $55,000 to $64,999 | 8,538 (9.5%) | 4,799 (5.9%) |
| $65,000 to $74,999 | 7,529 (8.4%) | 4,344 (5.3%) |
| $75,000 to $99,999 | 8,534 (9.5%) | 3,675 (4.5%) |
| $100,000+ | 10,117 (11.3%) | 4,445 (5.4%) |
| Total | 89,621 (100.0%) | 81,885 (100.0%) |
Earnings by Sex by Educational Attainment in Spartanburg County
Average earnings in Spartanburg County are $50,293 for men and $36,518 for women, a difference of 27.4%. Men with an educational attainment of graduate degree enjoy the highest average annual earnings of $82,944, while those with less than high school education earn the least with $33,091. Women with an educational attainment of graduate degree earn the most with the average annual earnings of $59,577, while those with less than high school education have the smallest earnings of $18,242.
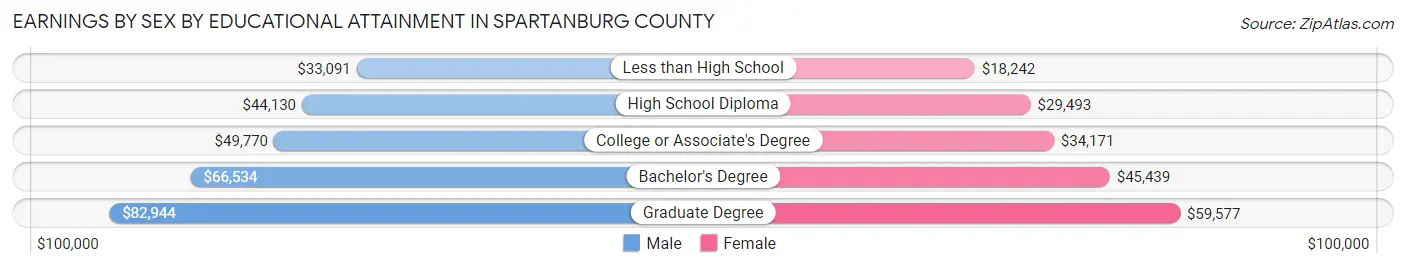
| Educational Attainment | Male Income | Female Income |
| Less than High School | $33,091 | $18,242 |
| High School Diploma | $44,130 | $29,493 |
| College or Associate's Degree | $49,770 | $34,171 |
| Bachelor's Degree | $66,534 | $45,439 |
| Graduate Degree | $82,944 | $59,577 |
| Total | $50,293 | $36,518 |
Family Income in Spartanburg County
Family Income Brackets in Spartanburg County
According to the Spartanburg County family income data, there are 16,239 families falling into the $50,000 to $74,999 income range, which is the most common income bracket and makes up 18.7% of all families. Conversely, the $10,000 to $14,999 income bracket is the least frequent group with only 1,911 families (2.2%) belonging to this category.
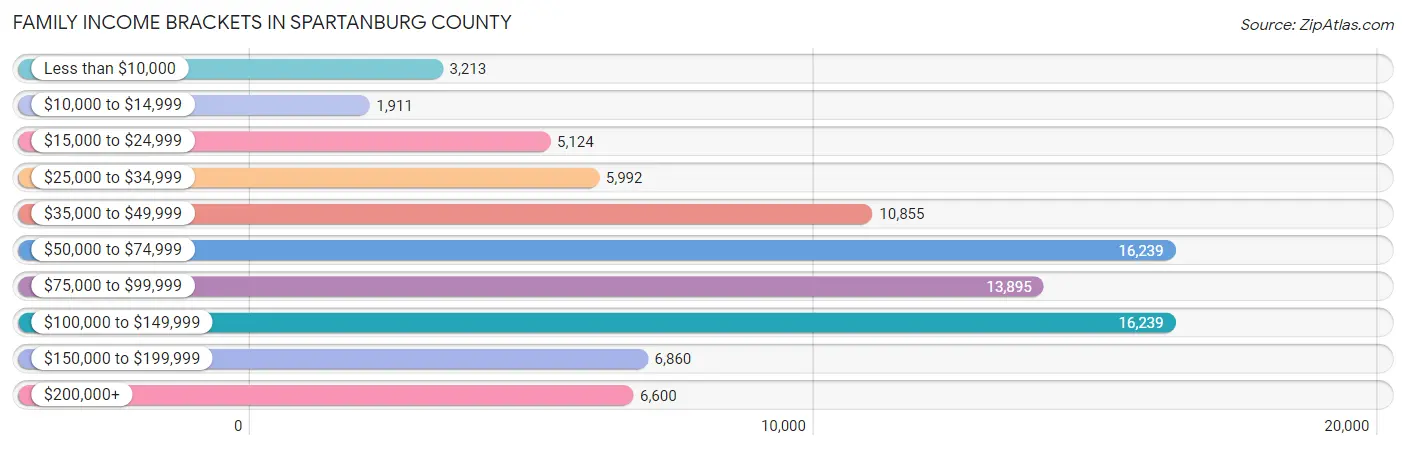
| Income Bracket | # Families | % Families |
| Less than $10,000 | 3,213 | 3.7% |
| $10,000 to $14,999 | 1,911 | 2.2% |
| $15,000 to $24,999 | 5,124 | 5.9% |
| $25,000 to $34,999 | 5,992 | 6.9% |
| $35,000 to $49,999 | 10,855 | 12.5% |
| $50,000 to $74,999 | 16,239 | 18.7% |
| $75,000 to $99,999 | 13,895 | 16.0% |
| $100,000 to $149,999 | 16,239 | 18.7% |
| $150,000 to $199,999 | 6,860 | 7.9% |
| $200,000+ | 6,600 | 7.6% |
Family Income by Famaliy Size in Spartanburg County
7+ person families (1,262 | 1.5%) account for the highest median family income in Spartanburg County with $98,400 per family, while 2-person families (41,836 | 48.2%) have the highest median income of $33,018 per family member.
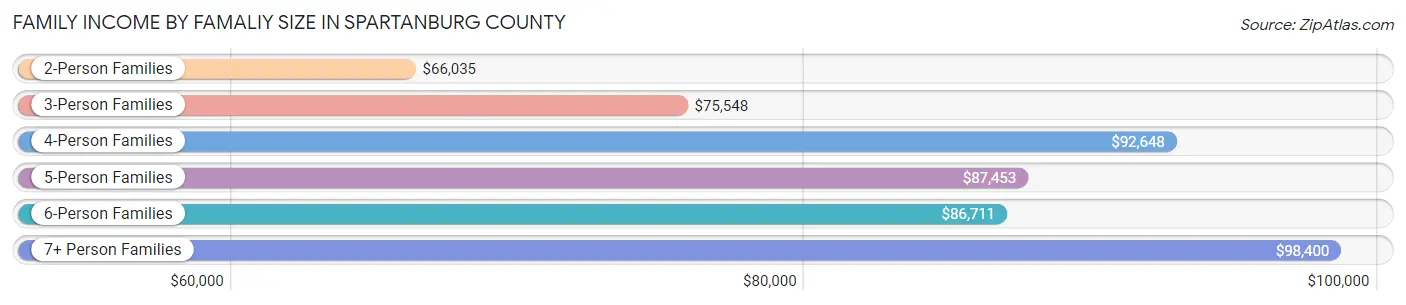
| Income Bracket | # Families | Median Income |
| 2-Person Families | 41,836 (48.2%) | $66,035 |
| 3-Person Families | 19,984 (23.0%) | $75,548 |
| 4-Person Families | 14,738 (17.0%) | $92,648 |
| 5-Person Families | 6,568 (7.6%) | $87,453 |
| 6-Person Families | 2,453 (2.8%) | $86,711 |
| 7+ Person Families | 1,262 (1.5%) | $98,400 |
| Total | 86,841 (100.0%) | $75,197 |
Family Income by Number of Earners in Spartanburg County
The median family income in Spartanburg County is $75,197, with families comprising 3+ earners (8,844) having the highest median family income of $128,824, while families with no earners (13,265) have the lowest median family income of $44,000, accounting for 10.2% and 15.3% of families, respectively.
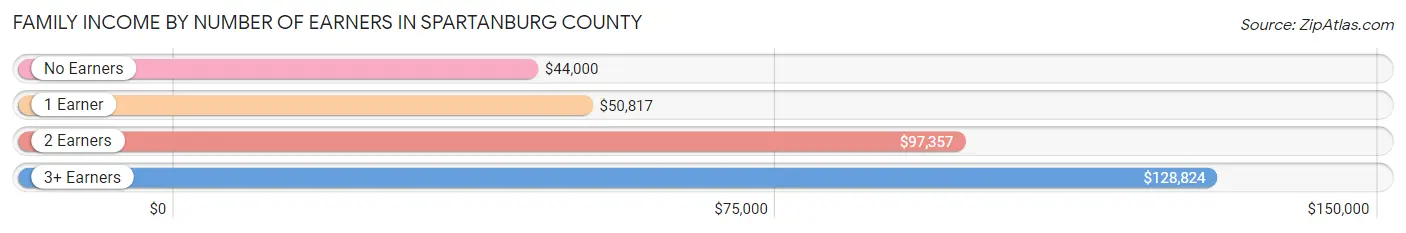
| Number of Earners | # Families | Median Income |
| No Earners | 13,265 (15.3%) | $44,000 |
| 1 Earner | 28,457 (32.8%) | $50,817 |
| 2 Earners | 36,275 (41.8%) | $97,357 |
| 3+ Earners | 8,844 (10.2%) | $128,824 |
| Total | 86,841 (100.0%) | $75,197 |
Household Income in Spartanburg County
Household Income Brackets in Spartanburg County
With 22,947 households falling in the category, the $50,000 to $74,999 income range is the most frequent in Spartanburg County, accounting for 18.3% of all households. In contrast, only 4,765 households (3.8%) fall into the $10,000 to $14,999 income bracket, making it the least populous group.
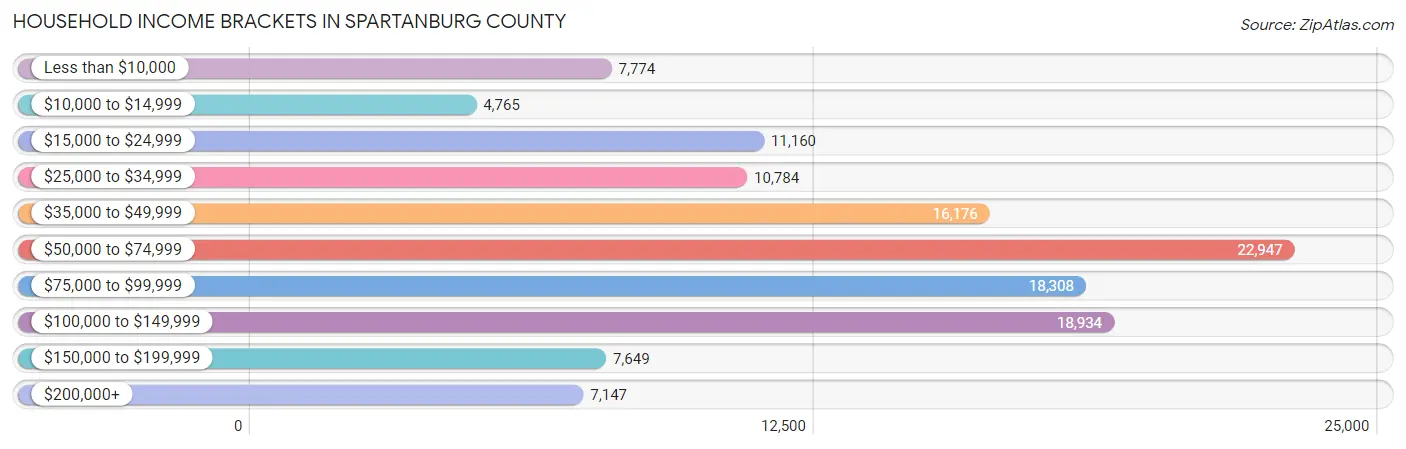
| Income Bracket | # Households | % Households |
| Less than $10,000 | 7,774 | 6.2% |
| $10,000 to $14,999 | 4,765 | 3.8% |
| $15,000 to $24,999 | 11,160 | 8.9% |
| $25,000 to $34,999 | 10,784 | 8.6% |
| $35,000 to $49,999 | 16,176 | 12.9% |
| $50,000 to $74,999 | 22,947 | 18.3% |
| $75,000 to $99,999 | 18,308 | 14.6% |
| $100,000 to $149,999 | 18,934 | 15.1% |
| $150,000 to $199,999 | 7,649 | 6.1% |
| $200,000+ | 7,147 | 5.7% |
Household Income by Householder Age in Spartanburg County
The median household income in Spartanburg County is $61,955, with the highest median household income of $73,655 found in the 45 to 64 years age bracket for the primary householder. A total of 46,083 households (36.7%) fall into this category. Meanwhile, the 65+ years age bracket for the primary householder has the lowest median household income of $44,309, with 33,659 households (26.8%) in this group.
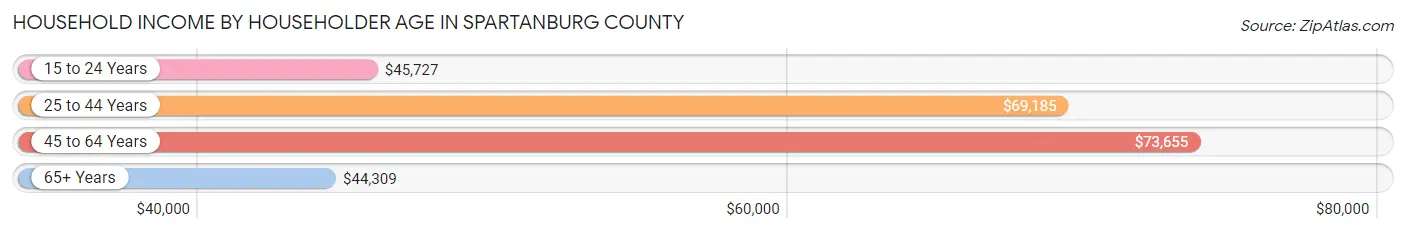
| Income Bracket | # Households | Median Income |
| 15 to 24 Years | 4,631 (3.7%) | $45,727 |
| 25 to 44 Years | 41,021 (32.7%) | $69,185 |
| 45 to 64 Years | 46,083 (36.7%) | $73,655 |
| 65+ Years | 33,659 (26.8%) | $44,309 |
| Total | 125,394 (100.0%) | $61,955 |
Poverty in Spartanburg County
Income Below Poverty by Sex and Age in Spartanburg County
With 13.1% poverty level for males and 15.6% for females among the residents of Spartanburg County, 6 to 11 year old males and 5 year old females are the most vulnerable to poverty, with 2,767 males (20.7%) and 536 females (25.5%) in their respective age groups living below the poverty level.
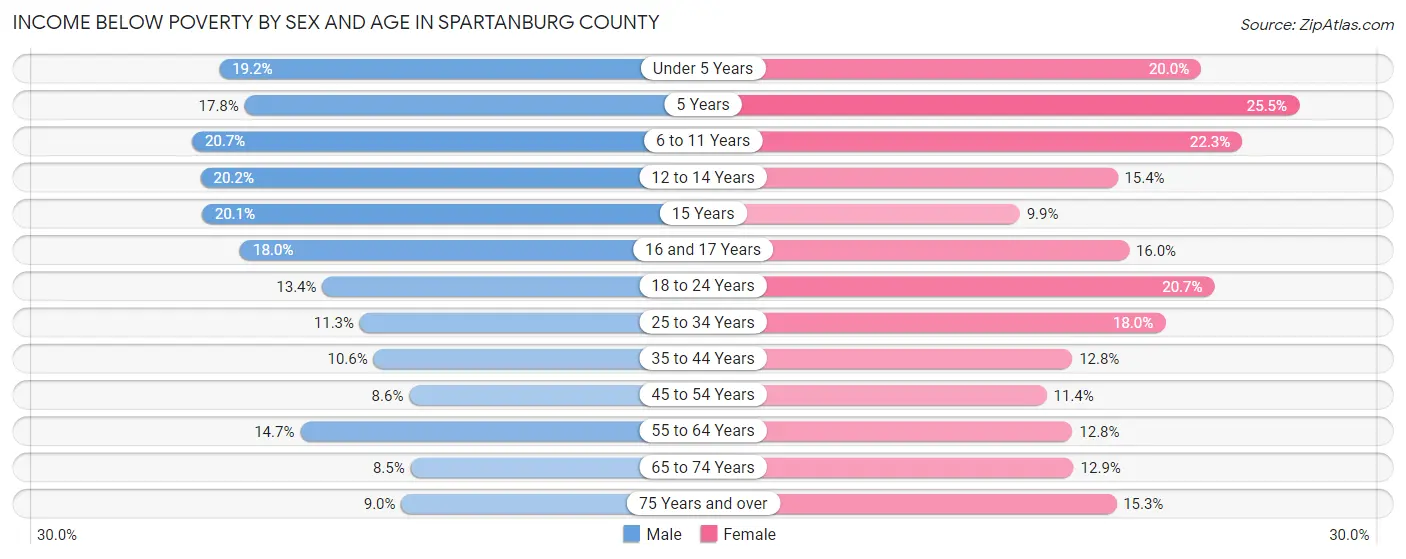
| Age Bracket | Male | Female |
| Under 5 Years | 1,898 (19.2%) | 1,928 (20.0%) |
| 5 Years | 346 (17.7%) | 536 (25.5%) |
| 6 to 11 Years | 2,767 (20.7%) | 2,775 (22.3%) |
| 12 to 14 Years | 1,254 (20.2%) | 996 (15.3%) |
| 15 Years | 415 (20.1%) | 218 (9.9%) |
| 16 and 17 Years | 858 (18.0%) | 674 (16.0%) |
| 18 to 24 Years | 1,848 (13.4%) | 2,761 (20.7%) |
| 25 to 34 Years | 2,473 (11.3%) | 4,174 (18.0%) |
| 35 to 44 Years | 2,020 (10.6%) | 2,589 (12.8%) |
| 45 to 54 Years | 1,753 (8.6%) | 2,411 (11.4%) |
| 55 to 64 Years | 2,933 (14.6%) | 2,741 (12.8%) |
| 65 to 74 Years | 1,266 (8.5%) | 2,209 (12.9%) |
| 75 Years and over | 761 (9.0%) | 1,843 (15.3%) |
| Total | 20,592 (13.1%) | 25,855 (15.6%) |
Income Above Poverty by Sex and Age in Spartanburg County
According to the poverty statistics in Spartanburg County, males aged 65 to 74 years and females aged 15 years are the age groups that are most secure financially, with 91.5% of males and 90.1% of females in these age groups living above the poverty line.
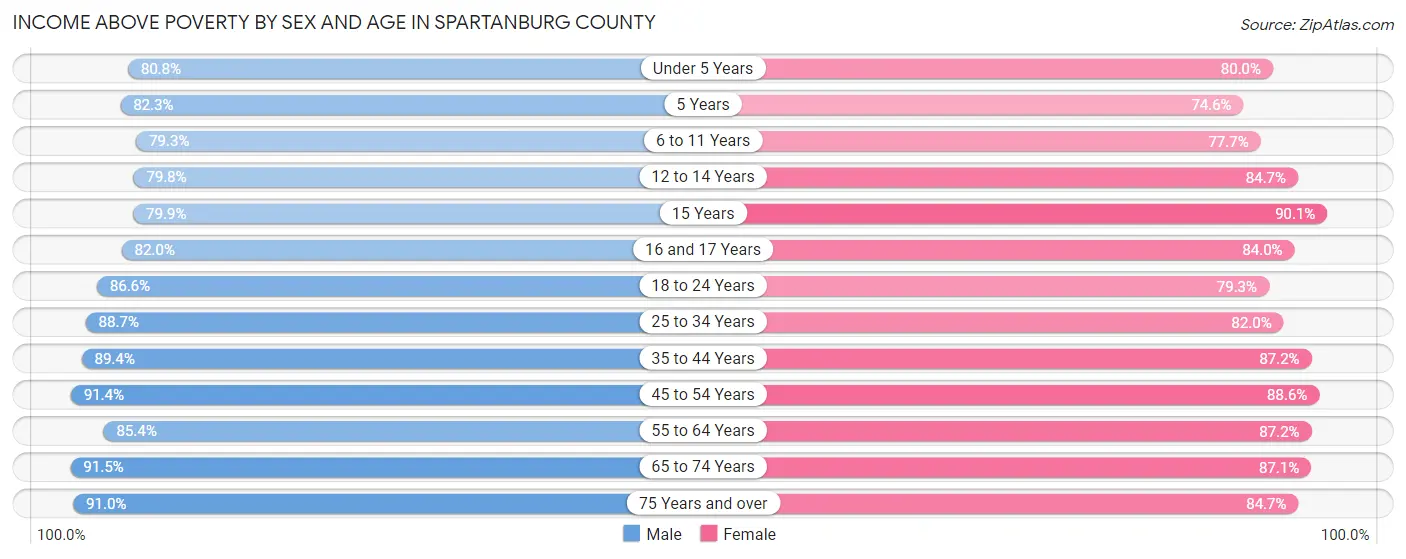
| Age Bracket | Male | Female |
| Under 5 Years | 8,010 (80.8%) | 7,710 (80.0%) |
| 5 Years | 1,603 (82.3%) | 1,570 (74.6%) |
| 6 to 11 Years | 10,614 (79.3%) | 9,674 (77.7%) |
| 12 to 14 Years | 4,954 (79.8%) | 5,493 (84.7%) |
| 15 Years | 1,647 (79.9%) | 1,982 (90.1%) |
| 16 and 17 Years | 3,909 (82.0%) | 3,541 (84.0%) |
| 18 to 24 Years | 11,918 (86.6%) | 10,549 (79.3%) |
| 25 to 34 Years | 19,361 (88.7%) | 19,020 (82.0%) |
| 35 to 44 Years | 17,095 (89.4%) | 17,587 (87.2%) |
| 45 to 54 Years | 18,667 (91.4%) | 18,742 (88.6%) |
| 55 to 64 Years | 17,093 (85.4%) | 18,600 (87.2%) |
| 65 to 74 Years | 13,615 (91.5%) | 14,903 (87.1%) |
| 75 Years and over | 7,672 (91.0%) | 10,217 (84.7%) |
| Total | 136,158 (86.9%) | 139,588 (84.4%) |
Income Below Poverty Among Married-Couple Families in Spartanburg County
The poverty statistics for married-couple families in Spartanburg County show that 5.6% or 3,496 of the total 62,292 families live below the poverty line. Families with 5 or more children have the highest poverty rate of 18.9%, comprising of 105 families. On the other hand, families with 1 or 2 children have the lowest poverty rate of 3.8%, which includes 759 families.
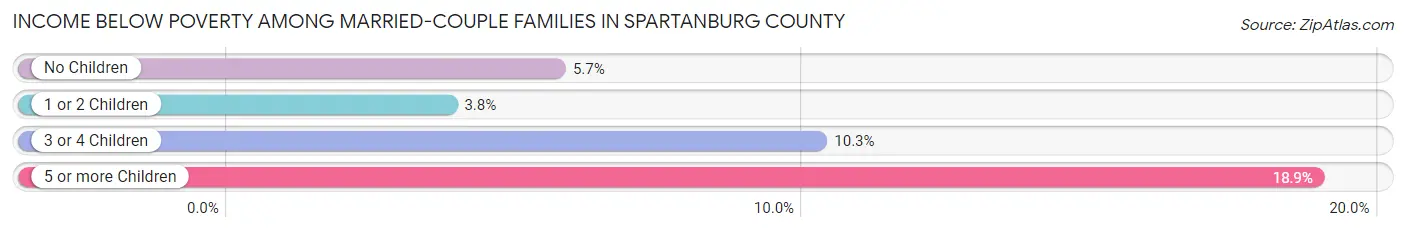
| Children | Above Poverty | Below Poverty |
| No Children | 34,509 (94.3%) | 2,090 (5.7%) |
| 1 or 2 Children | 19,095 (96.2%) | 759 (3.8%) |
| 3 or 4 Children | 4,742 (89.7%) | 542 (10.3%) |
| 5 or more Children | 450 (81.1%) | 105 (18.9%) |
| Total | 58,796 (94.4%) | 3,496 (5.6%) |
Income Below Poverty Among Single-Parent Households in Spartanburg County
According to the poverty data in Spartanburg County, 14.9% or 965 single-father households and 27.8% or 5,031 single-mother households are living below the poverty line. Among single-father households, those with 3 or 4 children have the highest poverty rate, with 366 households (52.6%) experiencing poverty. Likewise, among single-mother households, those with 5 or more children have the highest poverty rate, with 90 households (95.7%) falling below the poverty line.
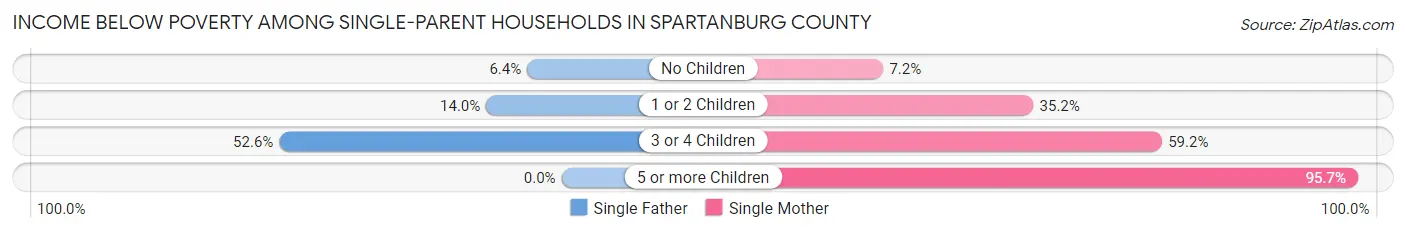
| Children | Single Father | Single Mother |
| No Children | 178 (6.4%) | 479 (7.2%) |
| 1 or 2 Children | 421 (14.0%) | 3,318 (35.2%) |
| 3 or 4 Children | 366 (52.6%) | 1,144 (59.2%) |
| 5 or more Children | 0 (0.0%) | 90 (95.7%) |
| Total | 965 (14.9%) | 5,031 (27.8%) |
Income Below Poverty Among Married-Couple vs Single-Parent Households in Spartanburg County
The poverty data for Spartanburg County shows that 3,496 of the married-couple family households (5.6%) and 5,996 of the single-parent households (24.4%) are living below the poverty level. Within the married-couple family households, those with 5 or more children have the highest poverty rate, with 105 households (18.9%) falling below the poverty line. Among the single-parent households, those with 5 or more children have the highest poverty rate, with 90 household (93.8%) living below poverty.
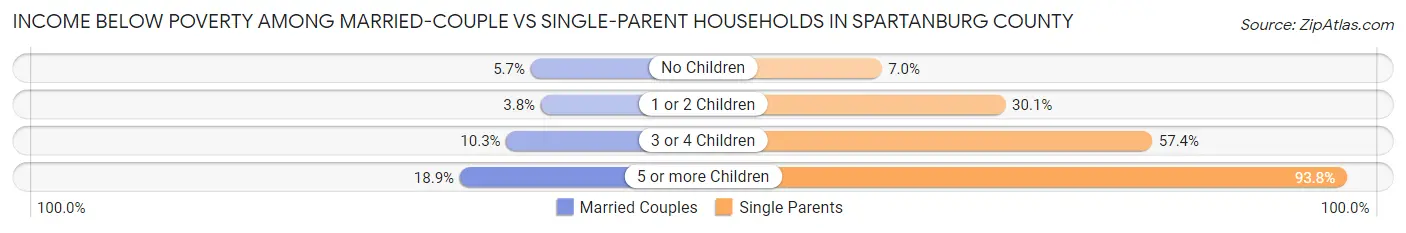
| Children | Married-Couple Families | Single-Parent Households |
| No Children | 2,090 (5.7%) | 657 (7.0%) |
| 1 or 2 Children | 759 (3.8%) | 3,739 (30.1%) |
| 3 or 4 Children | 542 (10.3%) | 1,510 (57.4%) |
| 5 or more Children | 105 (18.9%) | 90 (93.8%) |
| Total | 3,496 (5.6%) | 5,996 (24.4%) |
Race in Spartanburg County
The most populous races in Spartanburg County are White / Caucasian (228,719 | 69.3%), Black / African American (66,986 | 20.3%), and Hispanic or Latino (25,019 | 7.6%).
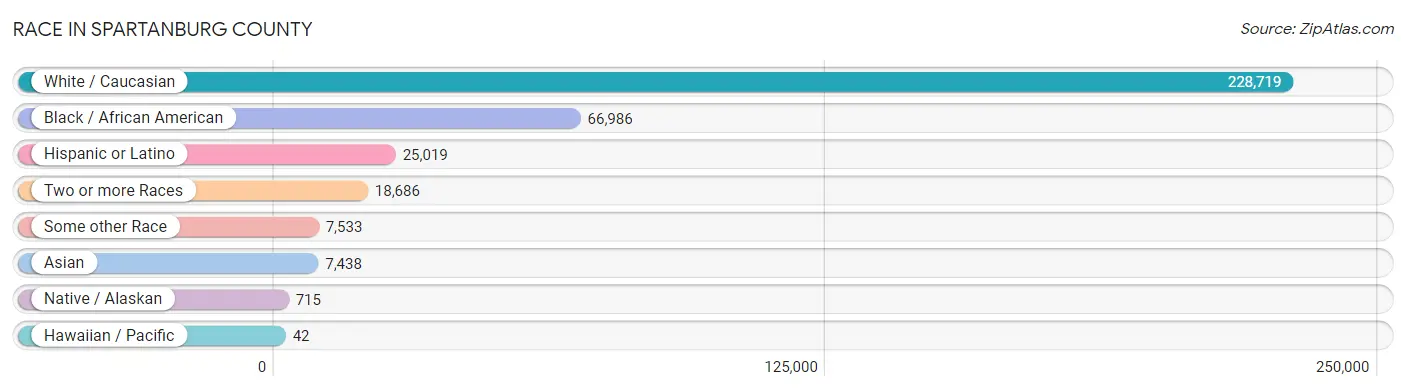
| Race | # Population | % Population |
| Asian | 7,438 | 2.2% |
| Black / African American | 66,986 | 20.3% |
| Hawaiian / Pacific | 42 | 0.0% |
| Hispanic or Latino | 25,019 | 7.6% |
| Native / Alaskan | 715 | 0.2% |
| White / Caucasian | 228,719 | 69.3% |
| Two or more Races | 18,686 | 5.7% |
| Some other Race | 7,533 | 2.3% |
| Total | 330,119 | 100.0% |
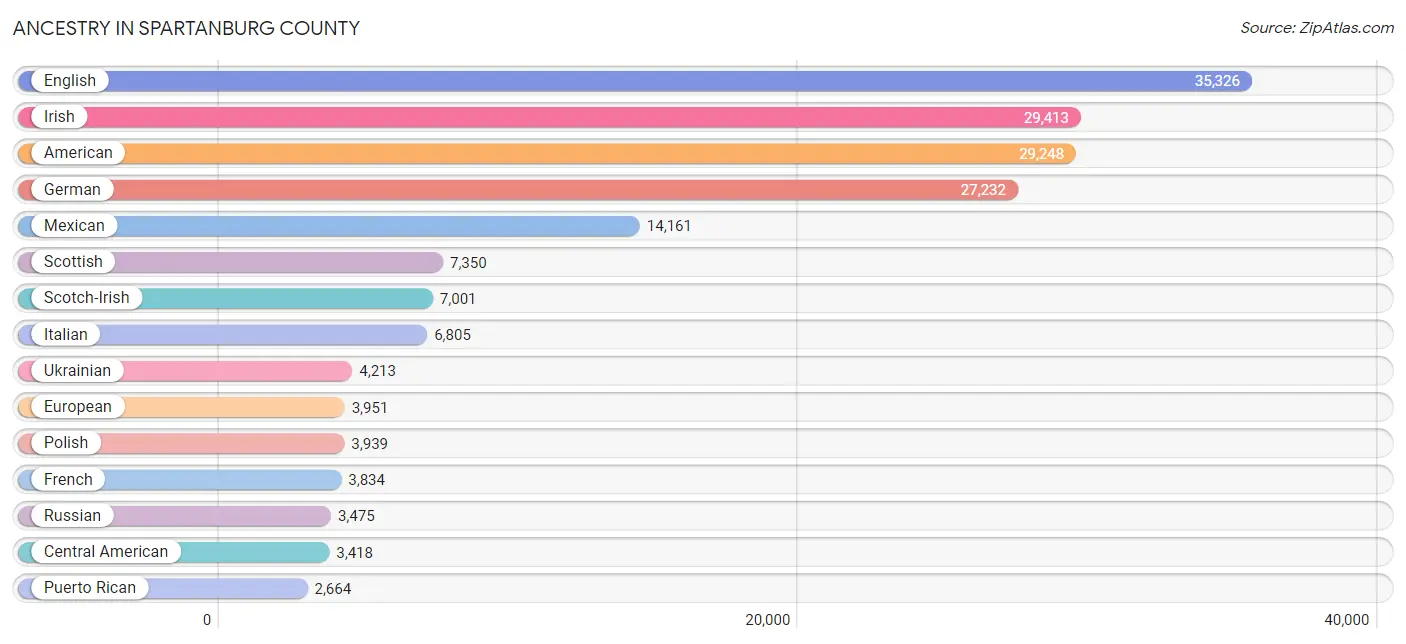
Ancestry in Spartanburg County
The most populous ancestries reported in Spartanburg County are English (35,326 | 10.7%), Irish (29,413 | 8.9%), American (29,248 | 8.9%), German (27,232 | 8.3%), and Mexican (14,161 | 4.3%), together accounting for 41.0% of all Spartanburg County residents.
| Ancestry | # Population | % Population |
| African | 1,450 | 0.4% |
| Alaskan Athabascan | 1 | 0.0% |
| Albanian | 187 | 0.1% |
| Alsatian | 16 | 0.0% |
| American | 29,248 | 8.9% |
| Apache | 46 | 0.0% |
| Arab | 398 | 0.1% |
| Argentinean | 217 | 0.1% |
| Armenian | 33 | 0.0% |
| Assyrian / Chaldean / Syriac | 14 | 0.0% |
| Australian | 14 | 0.0% |
| Austrian | 419 | 0.1% |
| Bahamian | 97 | 0.0% |
| Bangladeshi | 978 | 0.3% |
| Barbadian | 13 | 0.0% |
| Basque | 88 | 0.0% |
| Belgian | 183 | 0.1% |
| Bermudan | 14 | 0.0% |
| Bhutanese | 320 | 0.1% |
| Blackfeet | 285 | 0.1% |
| Brazilian | 208 | 0.1% |
| British | 1,675 | 0.5% |
| Bulgarian | 429 | 0.1% |
| Burmese | 438 | 0.1% |
| Cajun | 120 | 0.0% |
| Cambodian | 61 | 0.0% |
| Canadian | 318 | 0.1% |
| Cape Verdean | 34 | 0.0% |
| Celtic | 216 | 0.1% |
| Central American | 3,418 | 1.0% |
| Central American Indian | 144 | 0.0% |
| Cherokee | 994 | 0.3% |
| Chickasaw | 45 | 0.0% |
| Chilean | 167 | 0.1% |
| Chinese | 378 | 0.1% |
| Chippewa | 44 | 0.0% |
| Choctaw | 7 | 0.0% |
| Colombian | 1,058 | 0.3% |
| Costa Rican | 32 | 0.0% |
| Cree | 8 | 0.0% |
| Creek | 15 | 0.0% |
| Croatian | 140 | 0.0% |
| Cuban | 1,355 | 0.4% |
| Cypriot | 168 | 0.1% |
| Czech | 296 | 0.1% |
| Czechoslovakian | 149 | 0.1% |
| Danish | 351 | 0.1% |
| Dominican | 212 | 0.1% |
| Dutch | 2,197 | 0.7% |
| Dutch West Indian | 11 | 0.0% |
| Eastern European | 354 | 0.1% |
| Ecuadorian | 182 | 0.1% |
| Egyptian | 94 | 0.0% |
| English | 35,326 | 10.7% |
| Estonian | 126 | 0.0% |
| Ethiopian | 85 | 0.0% |
| European | 3,951 | 1.2% |
| Finnish | 897 | 0.3% |
| French | 3,834 | 1.2% |
| French Canadian | 825 | 0.3% |
| German | 27,232 | 8.3% |
| Greek | 576 | 0.2% |
| Guamanian / Chamorro | 20 | 0.0% |
| Guatemalan | 1,038 | 0.3% |
| Haitian | 110 | 0.0% |
| Honduran | 1,938 | 0.6% |
| Hungarian | 357 | 0.1% |
| Icelander | 138 | 0.0% |
| Indian (Asian) | 1,282 | 0.4% |
| Indonesian | 248 | 0.1% |
| Iranian | 110 | 0.0% |
| Irish | 29,413 | 8.9% |
| Iroquois | 38 | 0.0% |
| Israeli | 66 | 0.0% |
| Italian | 6,805 | 2.1% |
| Jamaican | 240 | 0.1% |
| Japanese | 1,109 | 0.3% |
| Kenyan | 42 | 0.0% |
| Korean | 667 | 0.2% |
| Latvian | 26 | 0.0% |
| Lebanese | 192 | 0.1% |
| Liberian | 45 | 0.0% |
| Lithuanian | 247 | 0.1% |
| Lumbee | 57 | 0.0% |
| Macedonian | 65 | 0.0% |
| Malaysian | 942 | 0.3% |
| Maltese | 7 | 0.0% |
| Mexican | 14,161 | 4.3% |
| Mexican American Indian | 156 | 0.1% |
| Native Hawaiian | 65 | 0.0% |
| Nicaraguan | 55 | 0.0% |
| Nigerian | 248 | 0.1% |
| Northern European | 220 | 0.1% |
| Norwegian | 884 | 0.3% |
| Ottawa | 5 | 0.0% |
| Pakistani | 246 | 0.1% |
| Palestinian | 13 | 0.0% |
| Panamanian | 12 | 0.0% |
| Paraguayan | 35 | 0.0% |
| Pennsylvania German | 245 | 0.1% |
| Peruvian | 73 | 0.0% |
| Polish | 3,939 | 1.2% |
| Portuguese | 381 | 0.1% |
| Potawatomi | 13 | 0.0% |
| Puerto Rican | 2,664 | 0.8% |
| Romanian | 416 | 0.1% |
| Russian | 3,475 | 1.1% |
| Salvadoran | 343 | 0.1% |
| Samoan | 36 | 0.0% |
| Scandinavian | 857 | 0.3% |
| Scotch-Irish | 7,001 | 2.1% |
| Scottish | 7,350 | 2.2% |
| Seminole | 63 | 0.0% |
| Shoshone | 5 | 0.0% |
| Sioux | 47 | 0.0% |
| Slavic | 131 | 0.0% |
| Slovak | 144 | 0.0% |
| Slovene | 56 | 0.0% |
| South African | 33 | 0.0% |
| South American | 2,019 | 0.6% |
| South American Indian | 112 | 0.0% |
| Spaniard | 158 | 0.1% |
| Spanish | 286 | 0.1% |
| Spanish American | 15 | 0.0% |
| Sri Lankan | 713 | 0.2% |
| Subsaharan African | 2,025 | 0.6% |
| Swedish | 1,285 | 0.4% |
| Swiss | 304 | 0.1% |
| Syrian | 17 | 0.0% |
| Thai | 2,607 | 0.8% |
| Tlingit-Haida | 12 | 0.0% |
| Trinidadian and Tobagonian | 135 | 0.0% |
| Turkish | 210 | 0.1% |
| Ugandan | 26 | 0.0% |
| Ukrainian | 4,213 | 1.3% |
| Uruguayan | 161 | 0.1% |
| Venezuelan | 126 | 0.0% |
| Welsh | 1,597 | 0.5% |
| West Indian | 48 | 0.0% |
| Yugoslavian | 46 | 0.0% | View All 140 Rows |
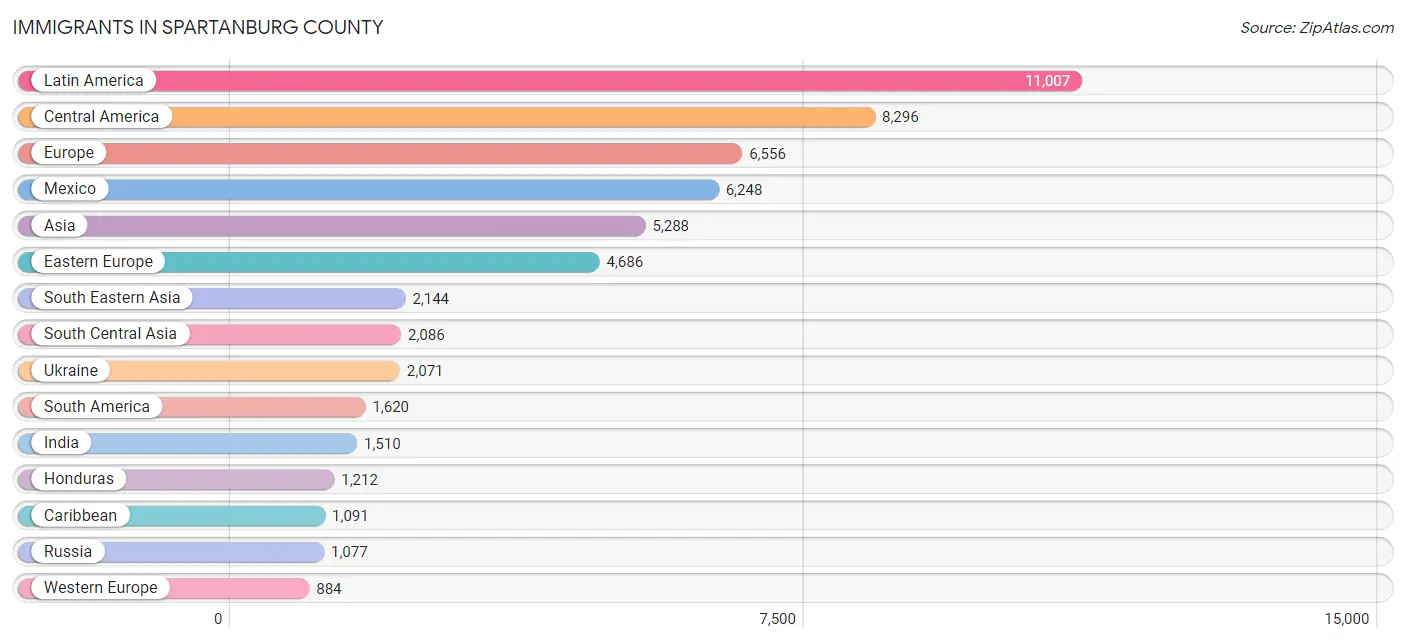
Immigrants in Spartanburg County
The most numerous immigrant groups reported in Spartanburg County came from Latin America (11,007 | 3.3%), Central America (8,296 | 2.5%), Europe (6,556 | 2.0%), Mexico (6,248 | 1.9%), and Asia (5,288 | 1.6%), together accounting for 11.3% of all Spartanburg County residents.
| Immigration Origin | # Population | % Population |
| Africa | 869 | 0.3% |
| Albania | 6 | 0.0% |
| Argentina | 199 | 0.1% |
| Asia | 5,288 | 1.6% |
| Australia | 1 | 0.0% |
| Austria | 26 | 0.0% |
| Bahamas | 14 | 0.0% |
| Belarus | 470 | 0.1% |
| Belize | 32 | 0.0% |
| Brazil | 206 | 0.1% |
| Bulgaria | 117 | 0.0% |
| Cambodia | 409 | 0.1% |
| Canada | 272 | 0.1% |
| Caribbean | 1,091 | 0.3% |
| Central America | 8,296 | 2.5% |
| Chile | 66 | 0.0% |
| China | 598 | 0.2% |
| Colombia | 842 | 0.3% |
| Congo | 50 | 0.0% |
| Costa Rica | 24 | 0.0% |
| Cuba | 620 | 0.2% |
| Czechoslovakia | 17 | 0.0% |
| Denmark | 1 | 0.0% |
| Dominican Republic | 85 | 0.0% |
| Eastern Africa | 203 | 0.1% |
| Eastern Asia | 841 | 0.3% |
| Eastern Europe | 4,686 | 1.4% |
| Ecuador | 67 | 0.0% |
| Egypt | 93 | 0.0% |
| El Salvador | 88 | 0.0% |
| England | 452 | 0.1% |
| Ethiopia | 11 | 0.0% |
| Europe | 6,556 | 2.0% |
| France | 64 | 0.0% |
| Germany | 617 | 0.2% |
| Greece | 54 | 0.0% |
| Guatemala | 666 | 0.2% |
| Haiti | 35 | 0.0% |
| Honduras | 1,212 | 0.4% |
| Hungary | 8 | 0.0% |
| India | 1,510 | 0.5% |
| Iran | 38 | 0.0% |
| Ireland | 63 | 0.0% |
| Israel | 131 | 0.0% |
| Italy | 47 | 0.0% |
| Jamaica | 95 | 0.0% |
| Japan | 84 | 0.0% |
| Jordan | 6 | 0.0% |
| Kazakhstan | 145 | 0.0% |
| Kenya | 121 | 0.0% |
| Korea | 98 | 0.0% |
| Kuwait | 19 | 0.0% |
| Laos | 780 | 0.2% |
| Latin America | 11,007 | 3.3% |
| Latvia | 48 | 0.0% |
| Liberia | 45 | 0.0% |
| Lithuania | 18 | 0.0% |
| Malaysia | 35 | 0.0% |
| Mexico | 6,248 | 1.9% |
| Middle Africa | 50 | 0.0% |
| Moldova | 262 | 0.1% |
| Morocco | 28 | 0.0% |
| Nepal | 26 | 0.0% |
| Netherlands | 16 | 0.0% |
| Nicaragua | 7 | 0.0% |
| Nigeria | 355 | 0.1% |
| North Macedonia | 33 | 0.0% |
| Northern Africa | 129 | 0.0% |
| Northern Europe | 843 | 0.3% |
| Norway | 44 | 0.0% |
| Oceania | 16 | 0.0% |
| Pakistan | 22 | 0.0% |
| Panama | 19 | 0.0% |
| Peru | 65 | 0.0% |
| Philippines | 172 | 0.1% |
| Poland | 65 | 0.0% |
| Romania | 124 | 0.0% |
| Russia | 1,077 | 0.3% |
| Singapore | 19 | 0.0% |
| South Africa | 79 | 0.0% |
| South America | 1,620 | 0.5% |
| South Central Asia | 2,086 | 0.6% |
| South Eastern Asia | 2,144 | 0.6% |
| Southern Europe | 112 | 0.0% |
| Spain | 11 | 0.0% |
| Sri Lanka | 44 | 0.0% |
| Sweden | 4 | 0.0% |
| Switzerland | 161 | 0.1% |
| Syria | 17 | 0.0% |
| Taiwan | 16 | 0.0% |
| Thailand | 335 | 0.1% |
| Trinidad and Tobago | 208 | 0.1% |
| Turkey | 10 | 0.0% |
| Uganda | 51 | 0.0% |
| Ukraine | 2,071 | 0.6% |
| Uruguay | 38 | 0.0% |
| Uzbekistan | 214 | 0.1% |
| Venezuela | 89 | 0.0% |
| Vietnam | 301 | 0.1% |
| Western Africa | 404 | 0.1% |
| Western Asia | 203 | 0.1% |
| Western Europe | 884 | 0.3% | View All 102 Rows |
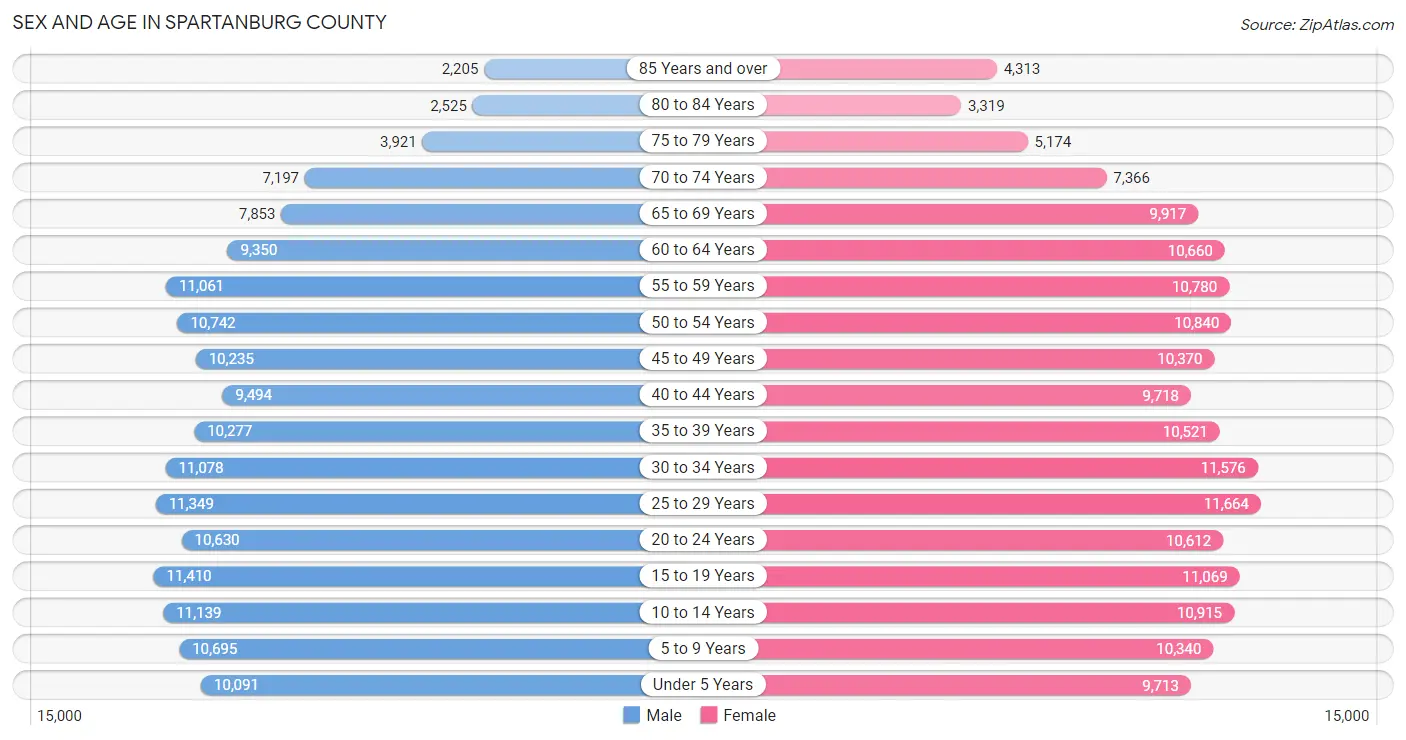
Sex and Age in Spartanburg County
Sex and Age in Spartanburg County
The most populous age groups in Spartanburg County are 15 to 19 Years (11,410 | 7.1%) for men and 25 to 29 Years (11,664 | 6.9%) for women.
| Age Bracket | Male | Female |
| Under 5 Years | 10,091 (6.3%) | 9,713 (5.8%) |
| 5 to 9 Years | 10,695 (6.6%) | 10,340 (6.1%) |
| 10 to 14 Years | 11,139 (6.9%) | 10,915 (6.5%) |
| 15 to 19 Years | 11,410 (7.1%) | 11,069 (6.6%) |
| 20 to 24 Years | 10,630 (6.6%) | 10,612 (6.3%) |
| 25 to 29 Years | 11,349 (7.0%) | 11,664 (6.9%) |
| 30 to 34 Years | 11,078 (6.9%) | 11,576 (6.9%) |
| 35 to 39 Years | 10,277 (6.4%) | 10,521 (6.2%) |
| 40 to 44 Years | 9,494 (5.9%) | 9,718 (5.8%) |
| 45 to 49 Years | 10,235 (6.4%) | 10,370 (6.1%) |
| 50 to 54 Years | 10,742 (6.7%) | 10,840 (6.4%) |
| 55 to 59 Years | 11,061 (6.9%) | 10,780 (6.4%) |
| 60 to 64 Years | 9,350 (5.8%) | 10,660 (6.3%) |
| 65 to 69 Years | 7,853 (4.9%) | 9,917 (5.9%) |
| 70 to 74 Years | 7,197 (4.5%) | 7,366 (4.4%) |
| 75 to 79 Years | 3,921 (2.4%) | 5,174 (3.1%) |
| 80 to 84 Years | 2,525 (1.6%) | 3,319 (2.0%) |
| 85 Years and over | 2,205 (1.4%) | 4,313 (2.5%) |
| Total | 161,252 (100.0%) | 168,867 (100.0%) |
Families and Households in Spartanburg County
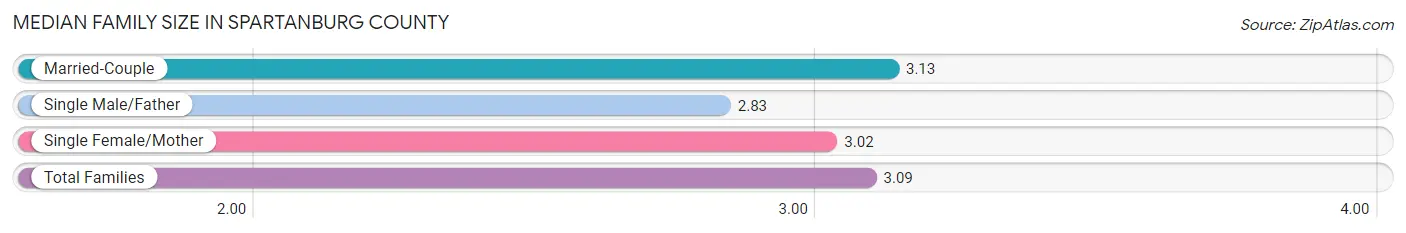
Median Family Size in Spartanburg County
The median family size in Spartanburg County is 3.09 persons per family, with married-couple families (62,292 | 71.7%) accounting for the largest median family size of 3.13 persons per family. On the other hand, single male/father families (6,470 | 7.4%) represent the smallest median family size with 2.83 persons per family.
| Family Type | # Families | Family Size |
| Married-Couple | 62,292 (71.7%) | 3.13 |
| Single Male/Father | 6,470 (7.4%) | 2.83 |
| Single Female/Mother | 18,079 (20.8%) | 3.02 |
| Total Families | 86,841 (100.0%) | 3.09 |
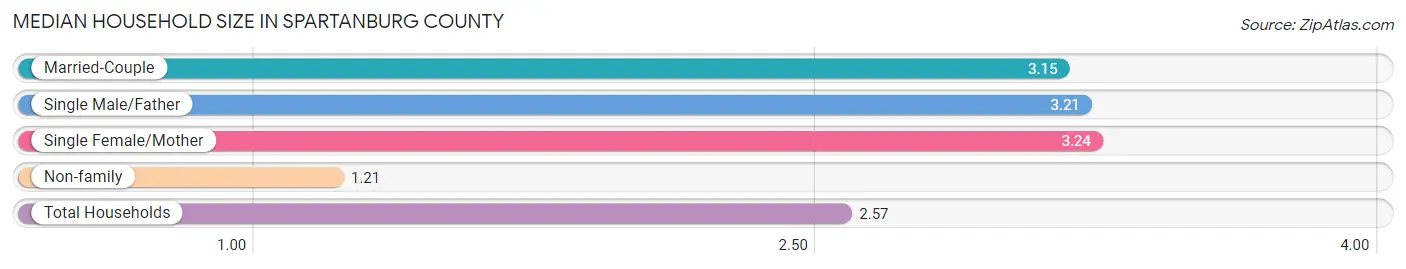
Median Household Size in Spartanburg County
The median household size in Spartanburg County is 2.57 persons per household, with single female/mother households (18,079 | 14.4%) accounting for the largest median household size of 3.24 persons per household. non-family households (38,553 | 30.7%) represent the smallest median household size with 1.21 persons per household.
| Household Type | # Households | Household Size |
| Married-Couple | 62,292 (49.7%) | 3.15 |
| Single Male/Father | 6,470 (5.2%) | 3.21 |
| Single Female/Mother | 18,079 (14.4%) | 3.24 |
| Non-family | 38,553 (30.7%) | 1.21 |
| Total Households | 125,394 (100.0%) | 2.57 |
Household Size by Marriage Status in Spartanburg County
Out of a total of 125,394 households in Spartanburg County, 86,841 (69.3%) are family households, while 38,553 (30.7%) are nonfamily households. The most numerous type of family households are 2-person households, comprising 39,073, and the most common type of nonfamily households are 1-person households, comprising 32,618.
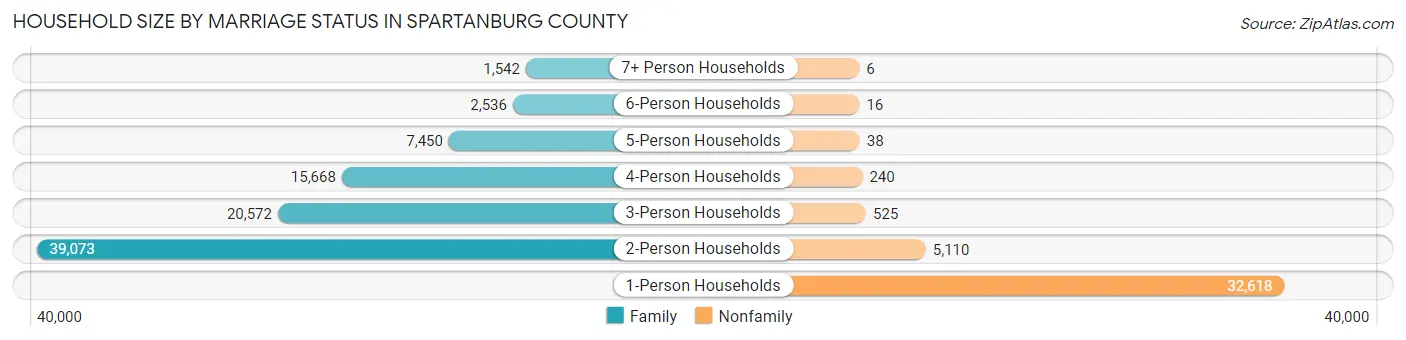
| Household Size | Family Households | Nonfamily Households |
| 1-Person Households | - | 32,618 (26.0%) |
| 2-Person Households | 39,073 (31.2%) | 5,110 (4.1%) |
| 3-Person Households | 20,572 (16.4%) | 525 (0.4%) |
| 4-Person Households | 15,668 (12.5%) | 240 (0.2%) |
| 5-Person Households | 7,450 (5.9%) | 38 (0.0%) |
| 6-Person Households | 2,536 (2.0%) | 16 (0.0%) |
| 7+ Person Households | 1,542 (1.2%) | 6 (0.0%) |
| Total | 86,841 (69.3%) | 38,553 (30.7%) |
Female Fertility in Spartanburg County
Fertility by Age in Spartanburg County
Average fertility rate in Spartanburg County is 54.0 births per 1,000 women. Women in the age bracket of 20 to 34 years have the highest fertility rate with 103.0 births per 1,000 women. Women in the age bracket of 20 to 34 years acount for 82.9% of all women with births.
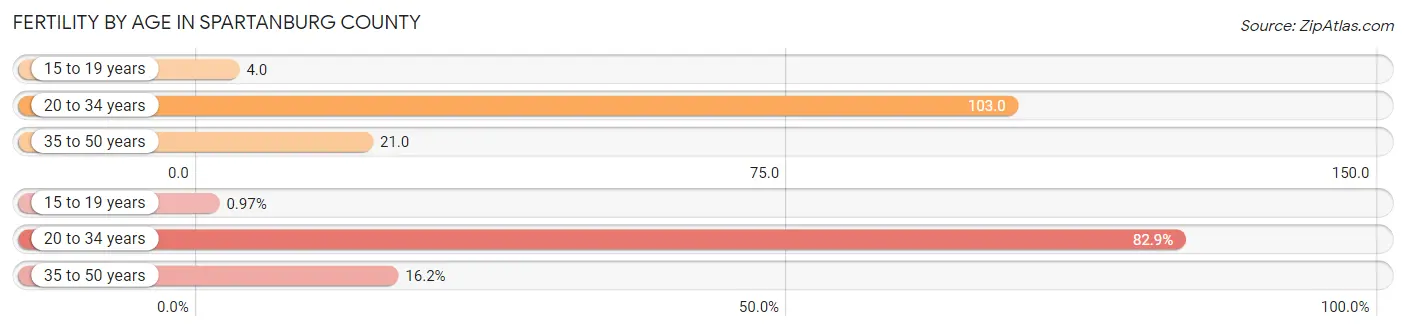
| Age Bracket | Women with Births | Births / 1,000 Women |
| 15 to 19 years | 41 (1.0%) | 4.0 |
| 20 to 34 years | 3,490 (82.9%) | 103.0 |
| 35 to 50 years | 680 (16.2%) | 21.0 |
| Total | 4,211 (100.0%) | 54.0 |
Fertility by Age by Marriage Status in Spartanburg County
60.7% of women with births (4,211) in Spartanburg County are married. The highest percentage of unmarried women with births falls into 15 to 19 years age bracket with 78.0% of them unmarried at the time of birth, while the lowest percentage of unmarried women with births belong to 35 to 50 years age bracket with 21.6% of them unmarried.
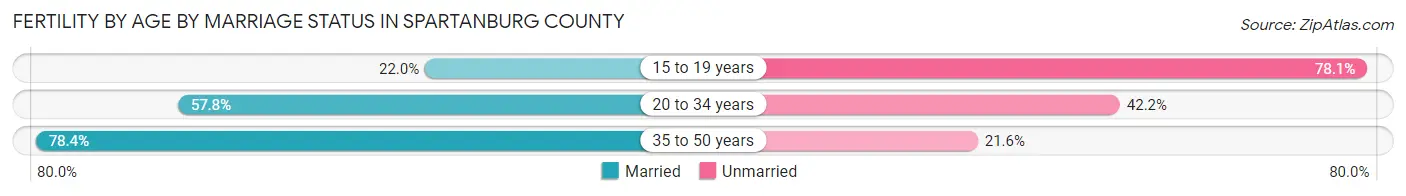
| Age Bracket | Married | Unmarried |
| 15 to 19 years | 9 (22.0%) | 32 (78.0%) |
| 20 to 34 years | 2,017 (57.8%) | 1,473 (42.2%) |
| 35 to 50 years | 533 (78.4%) | 147 (21.6%) |
| Total | 2,556 (60.7%) | 1,655 (39.3%) |
Fertility by Education in Spartanburg County
Average fertility rate in Spartanburg County is 54.0 births per 1,000 women. Women with the education attainment of bachelor's degree have the highest fertility rate of 74.0 births per 1,000 women, while women with the education attainment of less than high school have the lowest fertility at 34.0 births per 1,000 women. Women with the education attainment of college or associate's degree represent 33.5% of all women with births.
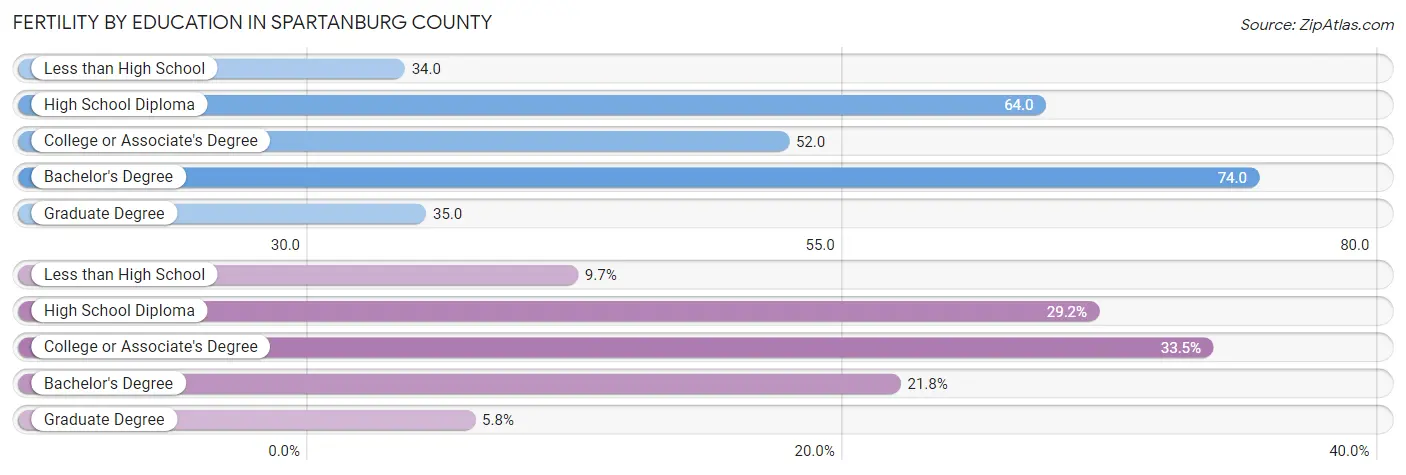
| Educational Attainment | Women with Births | Births / 1,000 Women |
| Less than High School | 408 (9.7%) | 34.0 |
| High School Diploma | 1,230 (29.2%) | 64.0 |
| College or Associate's Degree | 1,410 (33.5%) | 52.0 |
| Bachelor's Degree | 917 (21.8%) | 74.0 |
| Graduate Degree | 246 (5.8%) | 35.0 |
| Total | 4,211 (100.0%) | 54.0 |
Fertility by Education by Marriage Status in Spartanburg County
39.3% of women with births in Spartanburg County are unmarried. Women with the educational attainment of college or associate's degree are most likely to be married with 72.1% of them married at childbirth, while women with the educational attainment of high school diploma are least likely to be married with 56.0% of them unmarried at childbirth.
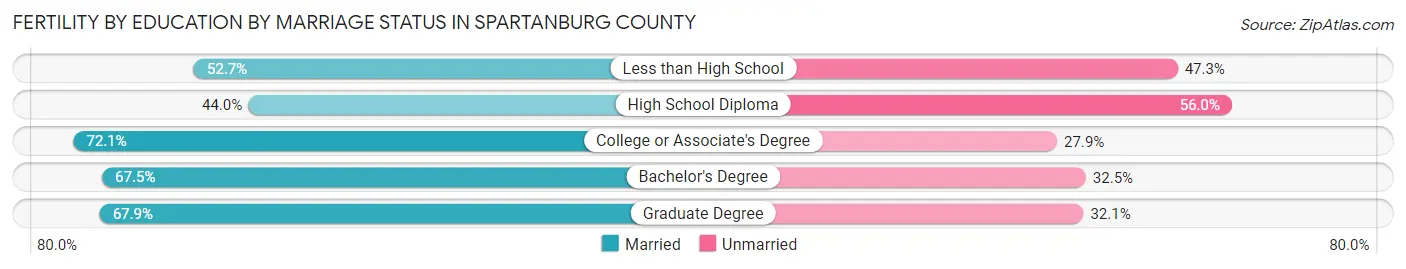
| Educational Attainment | Married | Unmarried |
| Less than High School | 215 (52.7%) | 193 (47.3%) |
| High School Diploma | 541 (44.0%) | 689 (56.0%) |
| College or Associate's Degree | 1,017 (72.1%) | 393 (27.9%) |
| Bachelor's Degree | 619 (67.5%) | 298 (32.5%) |
| Graduate Degree | 167 (67.9%) | 79 (32.1%) |
| Total | 2,556 (60.7%) | 1,655 (39.3%) |
Employment Characteristics in Spartanburg County
Employment by Class of Employer in Spartanburg County
Among the 151,753 employed individuals in Spartanburg County, private company employees (111,365 | 73.4%), not-for-profit organizations (9,260 | 6.1%), and local government employees (9,046 | 6.0%) make up the most common classes of employment.
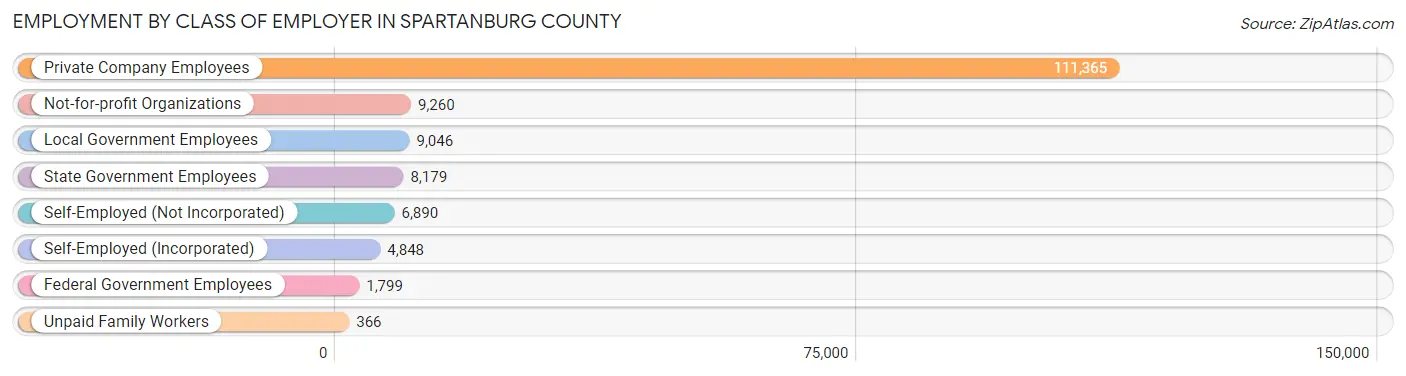
| Employer Class | # Employees | % Employees |
| Private Company Employees | 111,365 | 73.4% |
| Self-Employed (Incorporated) | 4,848 | 3.2% |
| Self-Employed (Not Incorporated) | 6,890 | 4.5% |
| Not-for-profit Organizations | 9,260 | 6.1% |
| Local Government Employees | 9,046 | 6.0% |
| State Government Employees | 8,179 | 5.4% |
| Federal Government Employees | 1,799 | 1.2% |
| Unpaid Family Workers | 366 | 0.2% |
| Total | 151,753 | 100.0% |
Employment Status by Age in Spartanburg County
According to the labor force statistics for Spartanburg County, out of the total population over 16 years of age (262,949), 61.8% or 162,502 individuals are in the labor force, with 4.7% or 7,638 of them unemployed. The age group with the highest labor force participation rate is 25 to 29 years, with 82.0% or 18,871 individuals in the labor force. Within the labor force, the 16 to 19 years age range has the highest percentage of unemployed individuals, with 14.3% or 1,166 of them being unemployed.
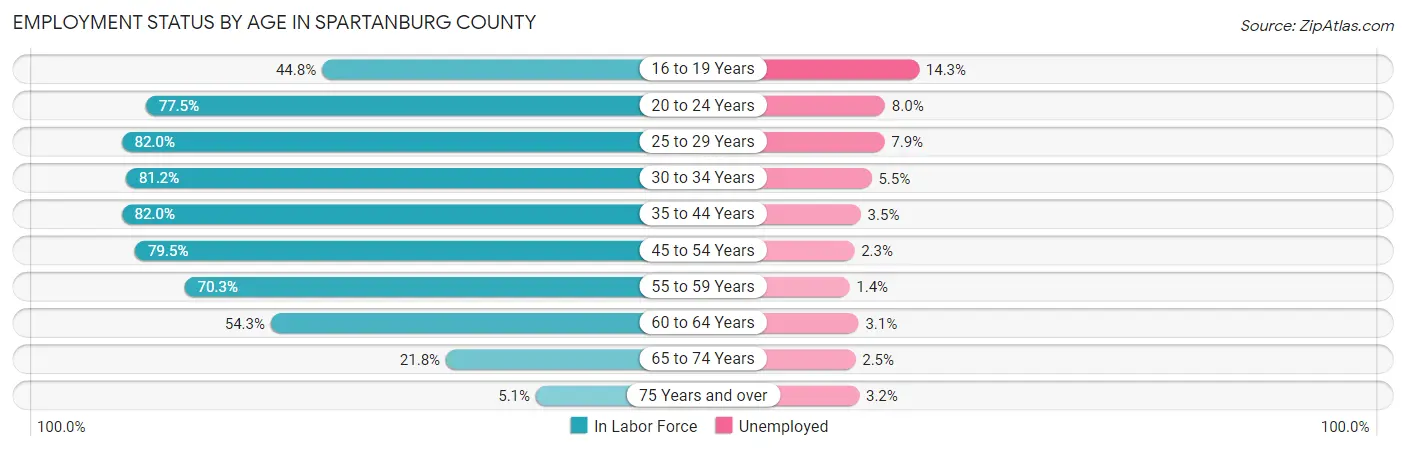
| Age Bracket | In Labor Force | Unemployed |
| 16 to 19 Years | 8,154 (44.8%) | 1,166 (14.3%) |
| 20 to 24 Years | 16,463 (77.5%) | 1,317 (8.0%) |
| 25 to 29 Years | 18,871 (82.0%) | 1,491 (7.9%) |
| 30 to 34 Years | 18,395 (81.2%) | 1,012 (5.5%) |
| 35 to 44 Years | 32,808 (82.0%) | 1,148 (3.5%) |
| 45 to 54 Years | 33,539 (79.5%) | 771 (2.3%) |
| 55 to 59 Years | 15,354 (70.3%) | 215 (1.4%) |
| 60 to 64 Years | 10,865 (54.3%) | 337 (3.1%) |
| 65 to 74 Years | 7,049 (21.8%) | 176 (2.5%) |
| 75 Years and over | 1,094 (5.1%) | 35 (3.2%) |
| Total | 162,502 (61.8%) | 7,638 (4.7%) |
Employment Status by Educational Attainment in Spartanburg County
According to labor force statistics for Spartanburg County, 76.5% of individuals (129,832) out of the total population between 25 and 64 years of age (169,715) are in the labor force, with 3.8% or 4,934 of them being unemployed. The group with the highest labor force participation rate are those with the educational attainment of bachelor's degree or higher, with 86.6% or 37,717 individuals in the labor force. Within the labor force, individuals with less than high school education have the highest percentage of unemployment, with 6.4% or 682 of them being unemployed.
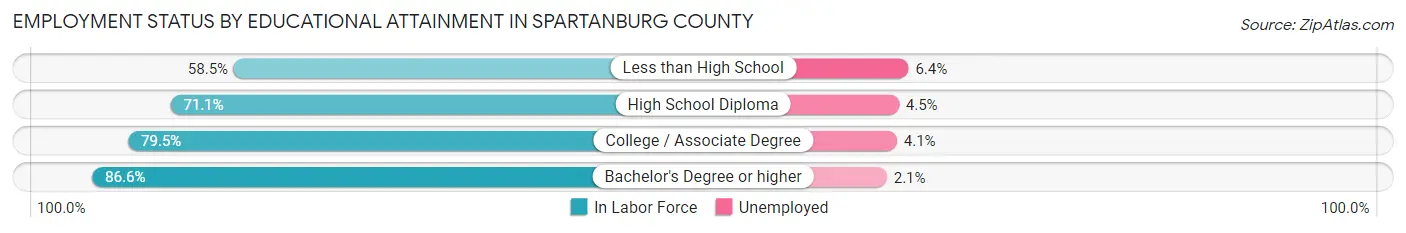
| Educational Attainment | In Labor Force | Unemployed |
| Less than High School | 10,655 (58.5%) | 1,166 (6.4%) |
| High School Diploma | 36,995 (71.1%) | 2,341 (4.5%) |
| College / Associate Degree | 44,454 (79.5%) | 2,293 (4.1%) |
| Bachelor's Degree or higher | 37,717 (86.6%) | 915 (2.1%) |
| Total | 129,832 (76.5%) | 6,449 (3.8%) |
Employment Occupations by Sex in Spartanburg County
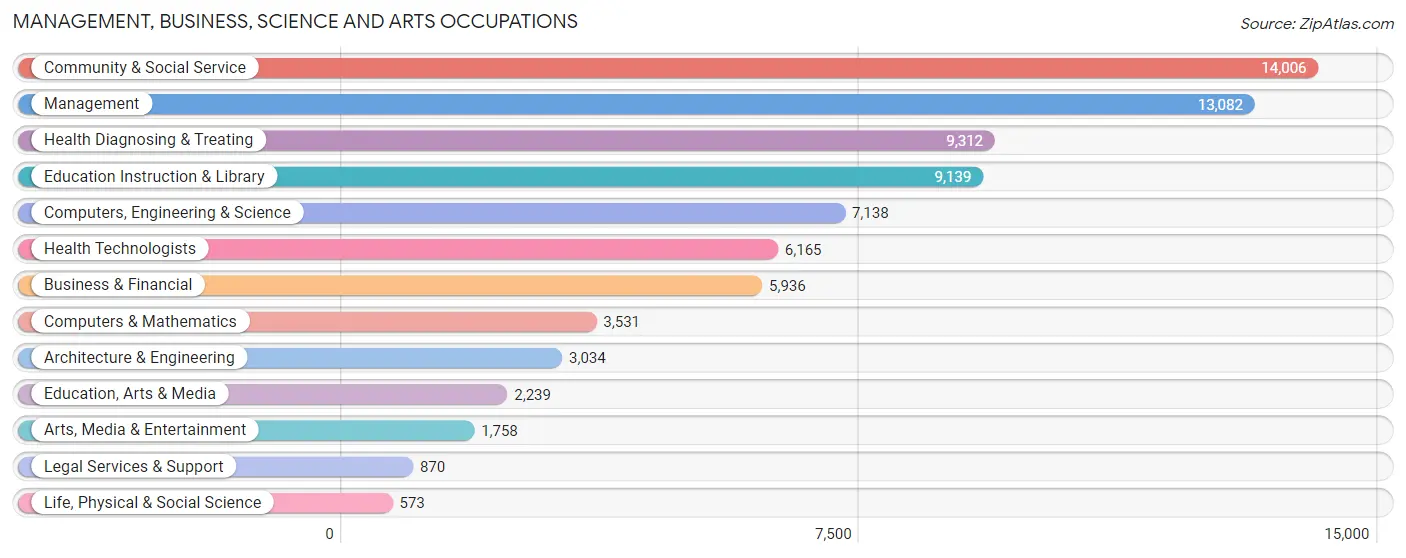
Management, Business, Science and Arts Occupations
The most common Management, Business, Science and Arts occupations in Spartanburg County are Community & Social Service (14,006 | 9.0%), Management (13,082 | 8.5%), Health Diagnosing & Treating (9,312 | 6.0%), Education Instruction & Library (9,139 | 5.9%), and Computers, Engineering & Science (7,138 | 4.6%).
Management, Business, Science and Arts Occupations by Sex
Within the Management, Business, Science and Arts occupations in Spartanburg County, the most male-oriented occupations are Architecture & Engineering (88.4%), Computers, Engineering & Science (80.6%), and Computers & Mathematics (78.6%), while the most female-oriented occupations are Health Diagnosing & Treating (79.8%), Education Instruction & Library (78.5%), and Health Technologists (75.5%).
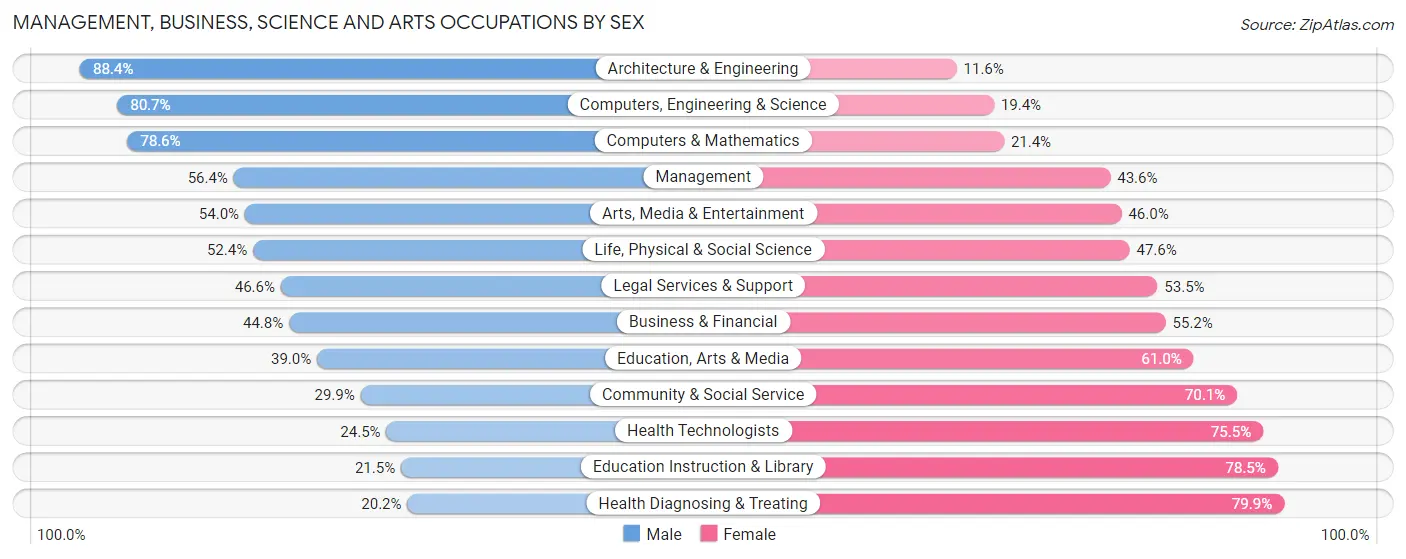
| Occupation | Male | Female |
| Management | 7,375 (56.4%) | 5,707 (43.6%) |
| Business & Financial | 2,661 (44.8%) | 3,275 (55.2%) |
| Computers, Engineering & Science | 5,757 (80.6%) | 1,381 (19.4%) |
| Computers & Mathematics | 2,774 (78.6%) | 757 (21.4%) |
| Architecture & Engineering | 2,683 (88.4%) | 351 (11.6%) |
| Life, Physical & Social Science | 300 (52.4%) | 273 (47.6%) |
| Community & Social Service | 4,191 (29.9%) | 9,815 (70.1%) |
| Education, Arts & Media | 873 (39.0%) | 1,366 (61.0%) |
| Legal Services & Support | 405 (46.6%) | 465 (53.4%) |
| Education Instruction & Library | 1,963 (21.5%) | 7,176 (78.5%) |
| Arts, Media & Entertainment | 950 (54.0%) | 808 (46.0%) |
| Health Diagnosing & Treating | 1,876 (20.2%) | 7,436 (79.8%) |
| Health Technologists | 1,512 (24.5%) | 4,653 (75.5%) |
| Total (Category) | 21,860 (44.2%) | 27,614 (55.8%) |
| Total (Overall) | 82,100 (53.1%) | 72,612 (46.9%) |
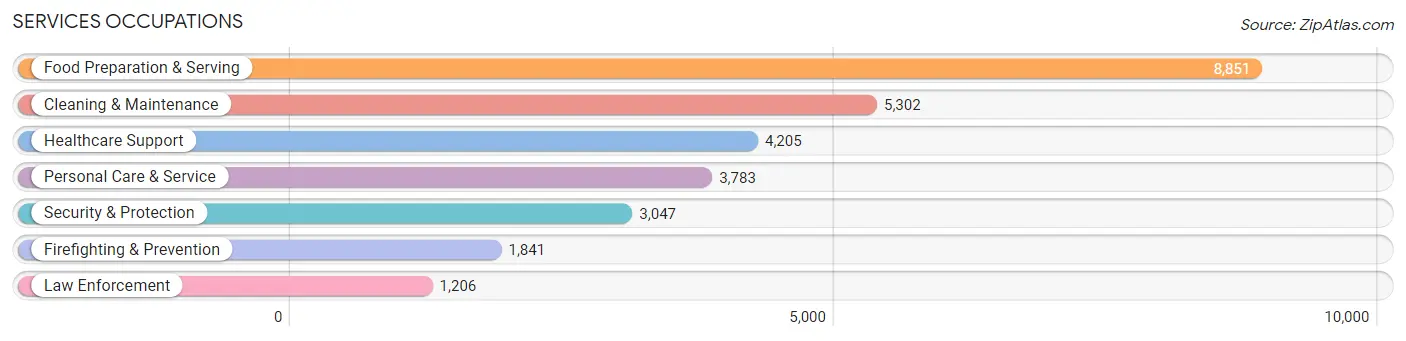
Services Occupations
The most common Services occupations in Spartanburg County are Food Preparation & Serving (8,851 | 5.7%), Cleaning & Maintenance (5,302 | 3.4%), Healthcare Support (4,205 | 2.7%), Personal Care & Service (3,783 | 2.5%), and Security & Protection (3,047 | 2.0%).
Services Occupations by Sex
Within the Services occupations in Spartanburg County, the most male-oriented occupations are Firefighting & Prevention (85.2%), Security & Protection (81.9%), and Law Enforcement (76.8%), while the most female-oriented occupations are Healthcare Support (91.9%), Personal Care & Service (81.3%), and Food Preparation & Serving (51.5%).
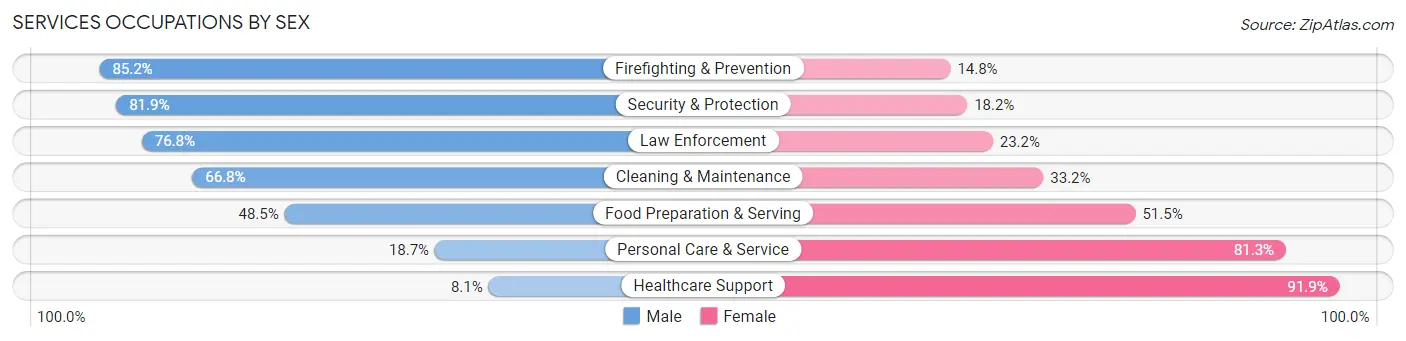
| Occupation | Male | Female |
| Healthcare Support | 342 (8.1%) | 3,863 (91.9%) |
| Security & Protection | 2,494 (81.9%) | 553 (18.1%) |
| Firefighting & Prevention | 1,568 (85.2%) | 273 (14.8%) |
| Law Enforcement | 926 (76.8%) | 280 (23.2%) |
| Food Preparation & Serving | 4,295 (48.5%) | 4,556 (51.5%) |
| Cleaning & Maintenance | 3,540 (66.8%) | 1,762 (33.2%) |
| Personal Care & Service | 709 (18.7%) | 3,074 (81.3%) |
| Total (Category) | 11,380 (45.2%) | 13,808 (54.8%) |
| Total (Overall) | 82,100 (53.1%) | 72,612 (46.9%) |
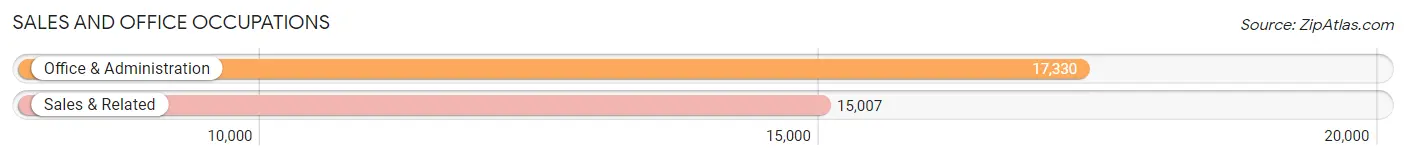
Sales and Office Occupations
The most common Sales and Office occupations in Spartanburg County are Office & Administration (17,330 | 11.2%), and Sales & Related (15,007 | 9.7%).
Sales and Office Occupations by Sex
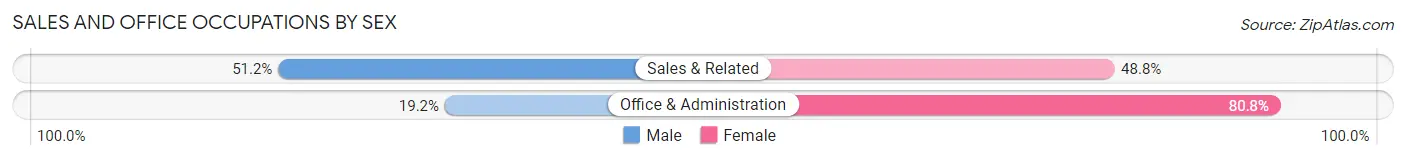
| Occupation | Male | Female |
| Sales & Related | 7,688 (51.2%) | 7,319 (48.8%) |
| Office & Administration | 3,324 (19.2%) | 14,006 (80.8%) |
| Total (Category) | 11,012 (34.1%) | 21,325 (65.9%) |
| Total (Overall) | 82,100 (53.1%) | 72,612 (46.9%) |
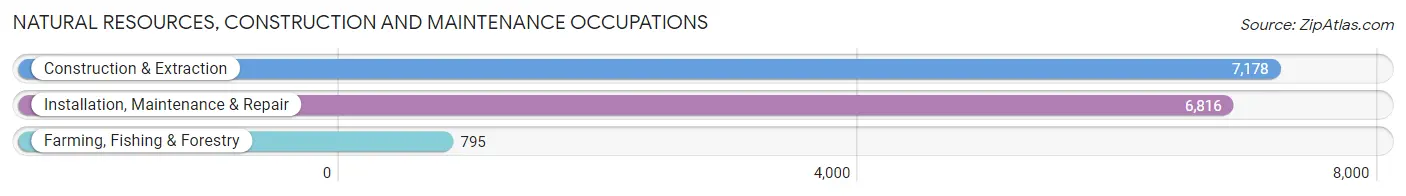
Natural Resources, Construction and Maintenance Occupations
The most common Natural Resources, Construction and Maintenance occupations in Spartanburg County are Construction & Extraction (7,178 | 4.6%), Installation, Maintenance & Repair (6,816 | 4.4%), and Farming, Fishing & Forestry (795 | 0.5%).
Natural Resources, Construction and Maintenance Occupations by Sex
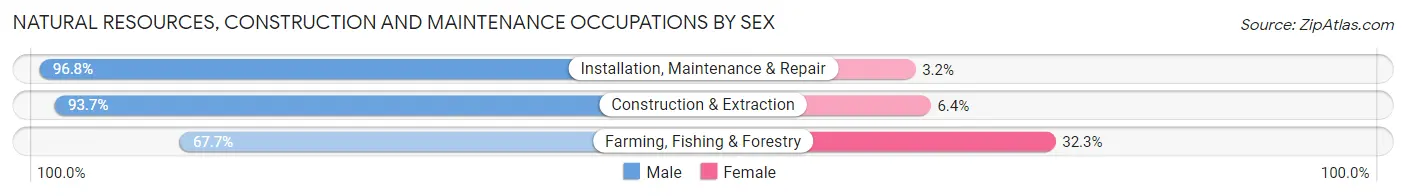
| Occupation | Male | Female |
| Farming, Fishing & Forestry | 538 (67.7%) | 257 (32.3%) |
| Construction & Extraction | 6,722 (93.6%) | 456 (6.4%) |
| Installation, Maintenance & Repair | 6,599 (96.8%) | 217 (3.2%) |
| Total (Category) | 13,859 (93.7%) | 930 (6.3%) |
| Total (Overall) | 82,100 (53.1%) | 72,612 (46.9%) |
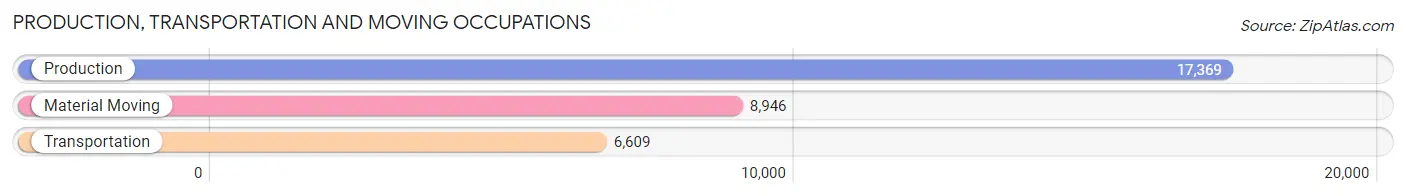
Production, Transportation and Moving Occupations
The most common Production, Transportation and Moving occupations in Spartanburg County are Production (17,369 | 11.2%), Material Moving (8,946 | 5.8%), and Transportation (6,609 | 4.3%).
Production, Transportation and Moving Occupations by Sex
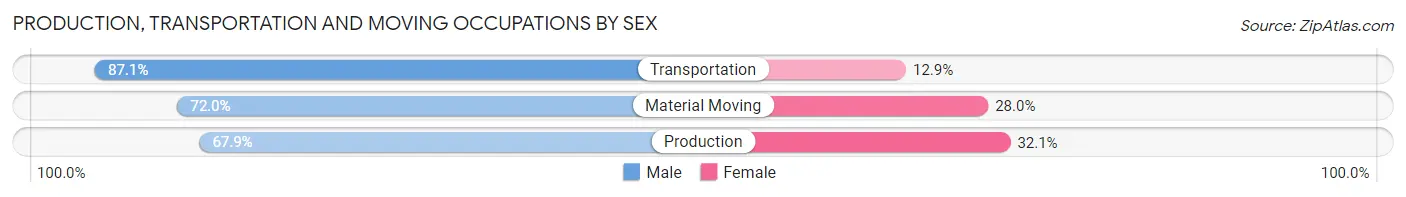
| Occupation | Male | Female |
| Production | 11,796 (67.9%) | 5,573 (32.1%) |
| Transportation | 5,754 (87.1%) | 855 (12.9%) |
| Material Moving | 6,439 (72.0%) | 2,507 (28.0%) |
| Total (Category) | 23,989 (72.9%) | 8,935 (27.1%) |
| Total (Overall) | 82,100 (53.1%) | 72,612 (46.9%) |
Employment Industries by Sex in Spartanburg County
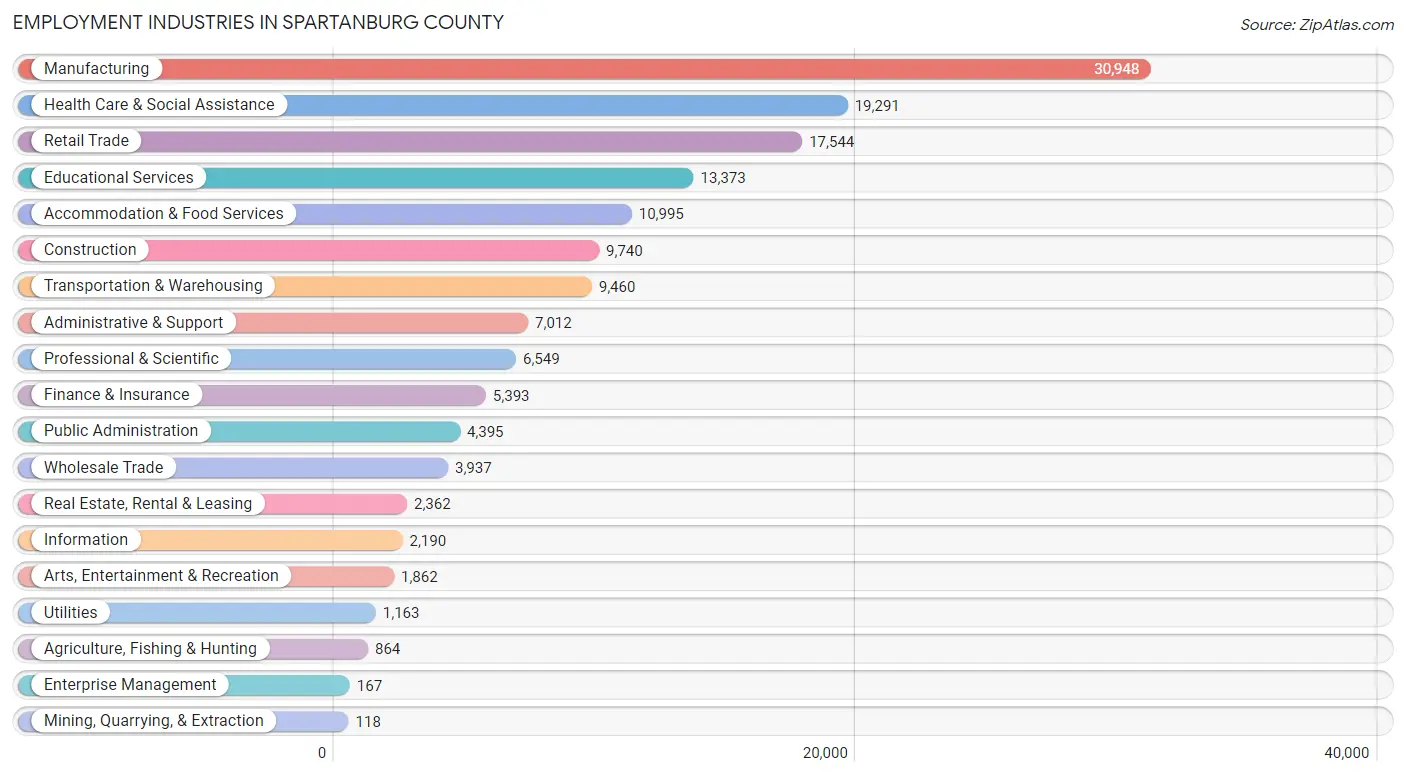
Employment Industries in Spartanburg County
The major employment industries in Spartanburg County include Manufacturing (30,948 | 20.0%), Health Care & Social Assistance (19,291 | 12.5%), Retail Trade (17,544 | 11.3%), Educational Services (13,373 | 8.6%), and Accommodation & Food Services (10,995 | 7.1%).
Employment Industries by Sex in Spartanburg County
The Spartanburg County industries that see more men than women are Construction (87.2%), Utilities (78.0%), and Transportation & Warehousing (72.4%), whereas the industries that tend to have a higher number of women are Health Care & Social Assistance (83.3%), Educational Services (72.2%), and Finance & Insurance (68.7%).
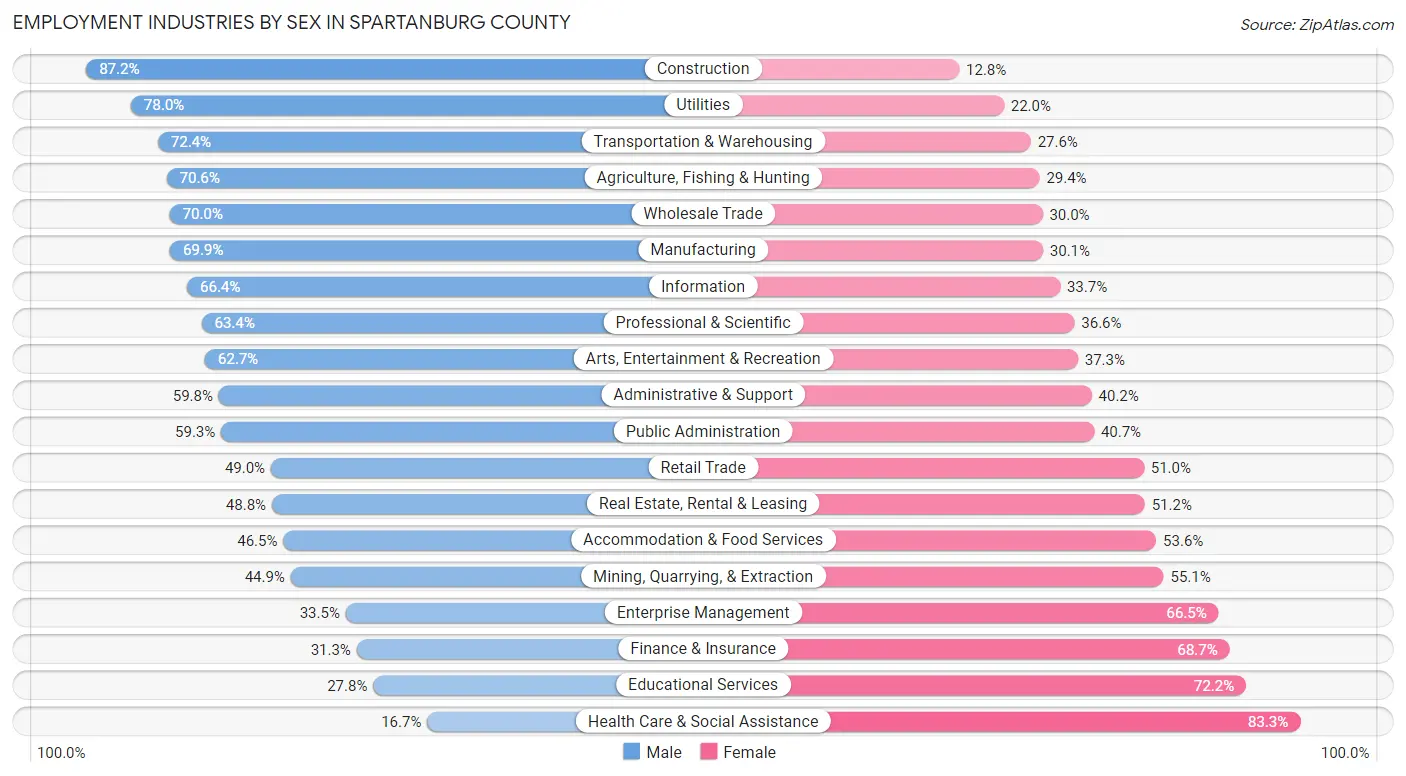
| Industry | Male | Female |
| Agriculture, Fishing & Hunting | 610 (70.6%) | 254 (29.4%) |
| Mining, Quarrying, & Extraction | 53 (44.9%) | 65 (55.1%) |
| Construction | 8,496 (87.2%) | 1,244 (12.8%) |
| Manufacturing | 21,633 (69.9%) | 9,315 (30.1%) |
| Wholesale Trade | 2,755 (70.0%) | 1,182 (30.0%) |
| Retail Trade | 8,598 (49.0%) | 8,946 (51.0%) |
| Transportation & Warehousing | 6,850 (72.4%) | 2,610 (27.6%) |
| Utilities | 907 (78.0%) | 256 (22.0%) |
| Information | 1,453 (66.3%) | 737 (33.7%) |
| Finance & Insurance | 1,686 (31.3%) | 3,707 (68.7%) |
| Real Estate, Rental & Leasing | 1,153 (48.8%) | 1,209 (51.2%) |
| Professional & Scientific | 4,151 (63.4%) | 2,398 (36.6%) |
| Enterprise Management | 56 (33.5%) | 111 (66.5%) |
| Administrative & Support | 4,193 (59.8%) | 2,819 (40.2%) |
| Educational Services | 3,723 (27.8%) | 9,650 (72.2%) |
| Health Care & Social Assistance | 3,214 (16.7%) | 16,077 (83.3%) |
| Arts, Entertainment & Recreation | 1,167 (62.7%) | 695 (37.3%) |
| Accommodation & Food Services | 5,107 (46.5%) | 5,888 (53.5%) |
| Public Administration | 2,607 (59.3%) | 1,788 (40.7%) |
| Total | 82,100 (53.1%) | 72,612 (46.9%) |
Education in Spartanburg County
School Enrollment in Spartanburg County
The most common levels of schooling among the 78,818 students in Spartanburg County are elementary school (17,366 | 22.0%), middle school (17,071 | 21.7%), and high school (17,048 | 21.6%).
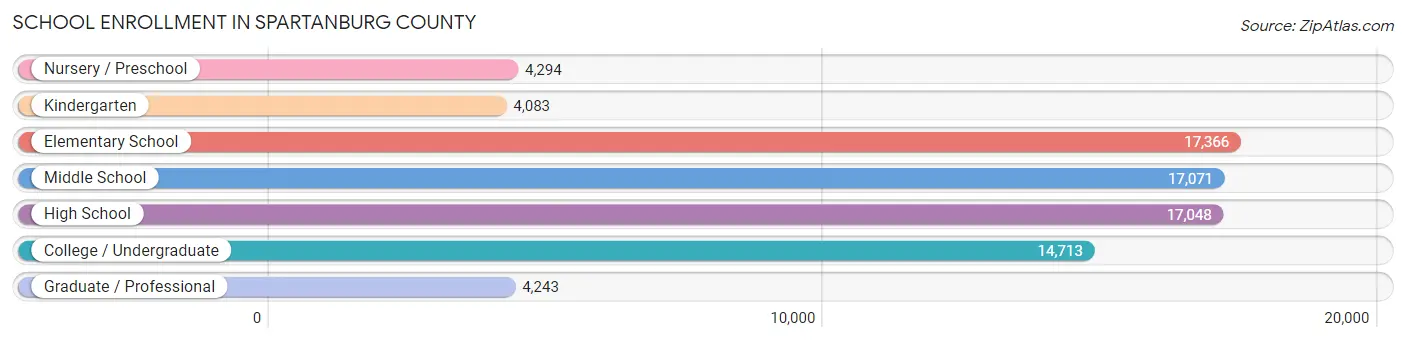
| School Level | # Students | % Students |
| Nursery / Preschool | 4,294 | 5.4% |
| Kindergarten | 4,083 | 5.2% |
| Elementary School | 17,366 | 22.0% |
| Middle School | 17,071 | 21.7% |
| High School | 17,048 | 21.6% |
| College / Undergraduate | 14,713 | 18.7% |
| Graduate / Professional | 4,243 | 5.4% |
| Total | 78,818 | 100.0% |
School Enrollment by Age by Funding Source in Spartanburg County
Out of a total of 78,818 students who are enrolled in schools in Spartanburg County, 13,636 (17.3%) attend a private institution, while the remaining 65,182 (82.7%) are enrolled in public schools. The age group of 3 to 4 year olds has the highest likelihood of being enrolled in private schools, with 1,716 (49.4% in the age bracket) enrolled. Conversely, the age group of 10 to 14 year olds has the lowest likelihood of being enrolled in a private school, with 19,297 (90.7% in the age bracket) attending a public institution.
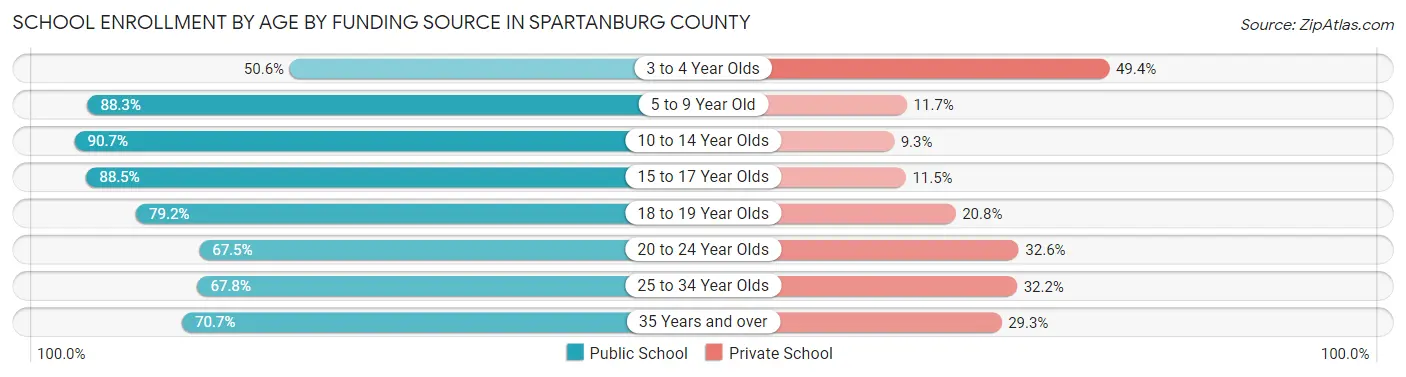
| Age Bracket | Public School | Private School |
| 3 to 4 Year Olds | 1,756 (50.6%) | 1,716 (49.4%) |
| 5 to 9 Year Old | 17,301 (88.3%) | 2,300 (11.7%) |
| 10 to 14 Year Olds | 19,297 (90.7%) | 1,984 (9.3%) |
| 15 to 17 Year Olds | 11,273 (88.5%) | 1,466 (11.5%) |
| 18 to 19 Year Olds | 5,001 (79.2%) | 1,312 (20.8%) |
| 20 to 24 Year Olds | 4,849 (67.4%) | 2,340 (32.6%) |
| 25 to 34 Year Olds | 2,843 (67.8%) | 1,352 (32.2%) |
| 35 Years and over | 2,846 (70.7%) | 1,182 (29.3%) |
| Total | 65,182 (82.7%) | 13,636 (17.3%) |
Educational Attainment by Field of Study in Spartanburg County
Business (12,414 | 20.7%), education (9,363 | 15.6%), science & technology (6,706 | 11.2%), engineering (4,445 | 7.4%), and arts & humanities (3,999 | 6.7%) are the most common fields of study among 60,084 individuals in Spartanburg County who have obtained a bachelor's degree or higher.
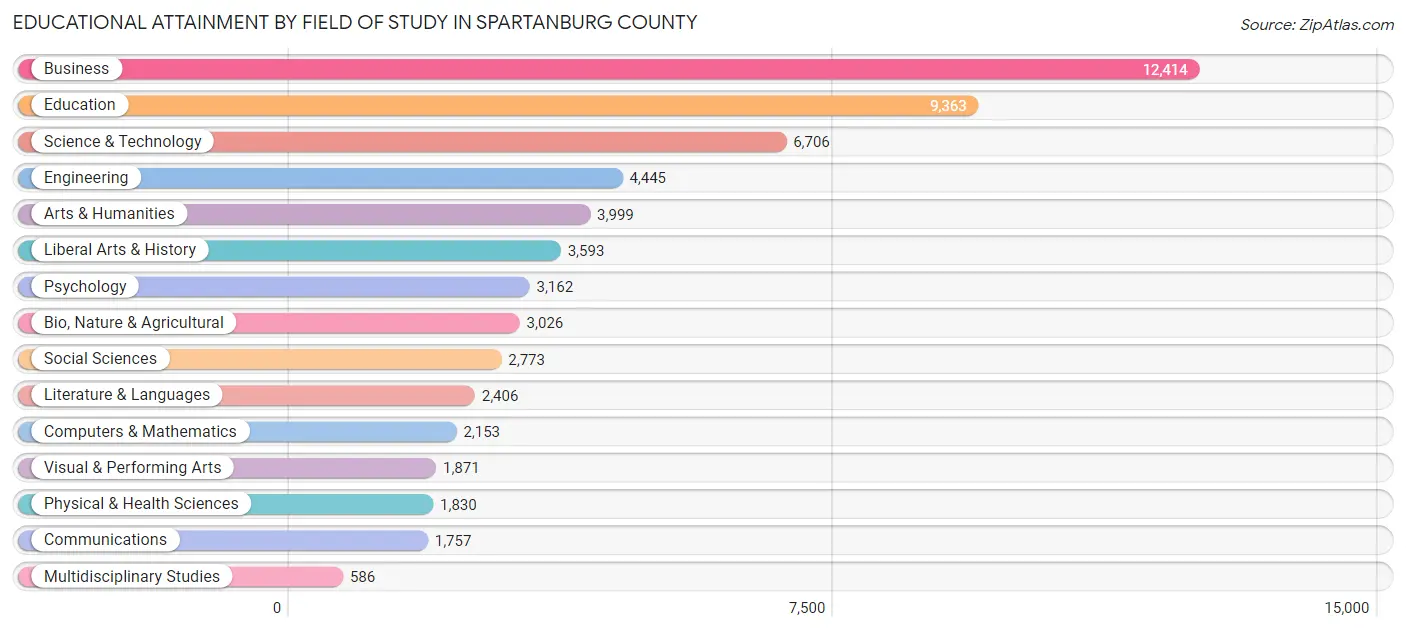
| Field of Study | # Graduates | % Graduates |
| Computers & Mathematics | 2,153 | 3.6% |
| Bio, Nature & Agricultural | 3,026 | 5.0% |
| Physical & Health Sciences | 1,830 | 3.0% |
| Psychology | 3,162 | 5.3% |
| Social Sciences | 2,773 | 4.6% |
| Engineering | 4,445 | 7.4% |
| Multidisciplinary Studies | 586 | 1.0% |
| Science & Technology | 6,706 | 11.2% |
| Business | 12,414 | 20.7% |
| Education | 9,363 | 15.6% |
| Literature & Languages | 2,406 | 4.0% |
| Liberal Arts & History | 3,593 | 6.0% |
| Visual & Performing Arts | 1,871 | 3.1% |
| Communications | 1,757 | 2.9% |
| Arts & Humanities | 3,999 | 6.7% |
| Total | 60,084 | 100.0% |
Transportation & Commute in Spartanburg County
Vehicle Availability by Sex in Spartanburg County
The most prevalent vehicle ownership categories in Spartanburg County are males with 2 vehicles (34,049, accounting for 42.6%) and females with 2 vehicles (27,781, making up 48.4%).
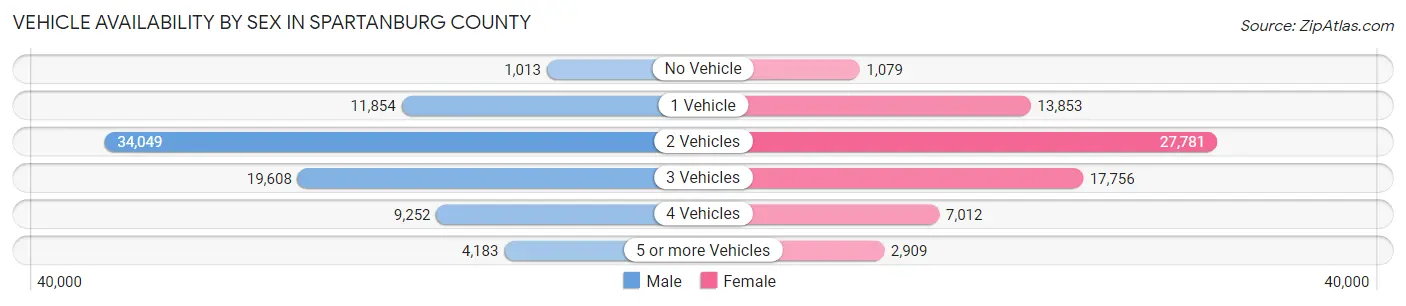
| Vehicles Available | Male | Female |
| No Vehicle | 1,013 (1.3%) | 1,079 (1.5%) |
| 1 Vehicle | 11,854 (14.8%) | 13,853 (19.7%) |
| 2 Vehicles | 34,049 (42.6%) | 27,781 (39.5%) |
| 3 Vehicles | 19,608 (24.5%) | 17,756 (25.2%) |
| 4 Vehicles | 9,252 (11.6%) | 7,012 (10.0%) |
| 5 or more Vehicles | 4,183 (5.2%) | 2,909 (4.1%) |
| Total | 79,959 (100.0%) | 70,390 (100.0%) |
Commute Time in Spartanburg County
The most frequently occuring commute durations in Spartanburg County are 20 to 24 minutes (25,563 commuters, 18.1%), 15 to 19 minutes (25,105 commuters, 17.8%), and 30 to 34 minutes (19,734 commuters, 14.0%).
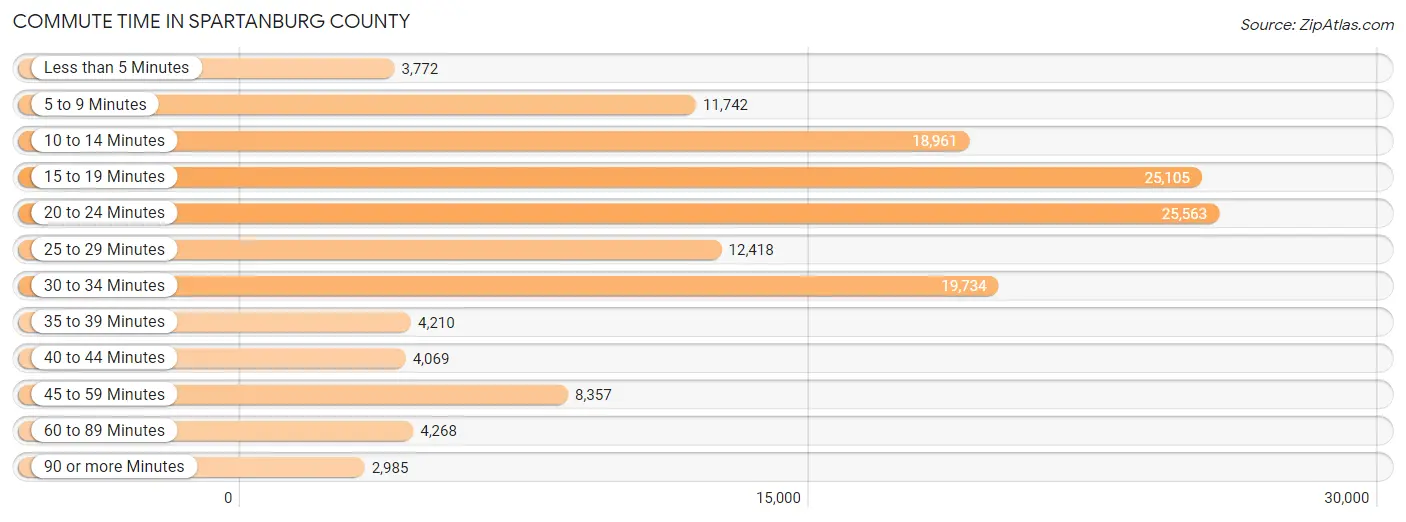
| Commute Time | # Commuters | % Commuters |
| Less than 5 Minutes | 3,772 | 2.7% |
| 5 to 9 Minutes | 11,742 | 8.3% |
| 10 to 14 Minutes | 18,961 | 13.4% |
| 15 to 19 Minutes | 25,105 | 17.8% |
| 20 to 24 Minutes | 25,563 | 18.1% |
| 25 to 29 Minutes | 12,418 | 8.8% |
| 30 to 34 Minutes | 19,734 | 14.0% |
| 35 to 39 Minutes | 4,210 | 3.0% |
| 40 to 44 Minutes | 4,069 | 2.9% |
| 45 to 59 Minutes | 8,357 | 5.9% |
| 60 to 89 Minutes | 4,268 | 3.0% |
| 90 or more Minutes | 2,985 | 2.1% |
Commute Time by Sex in Spartanburg County
The most common commute times in Spartanburg County are 20 to 24 minutes (13,700 commuters, 18.2%) for males and 15 to 19 minutes (11,898 commuters, 18.1%) for females.
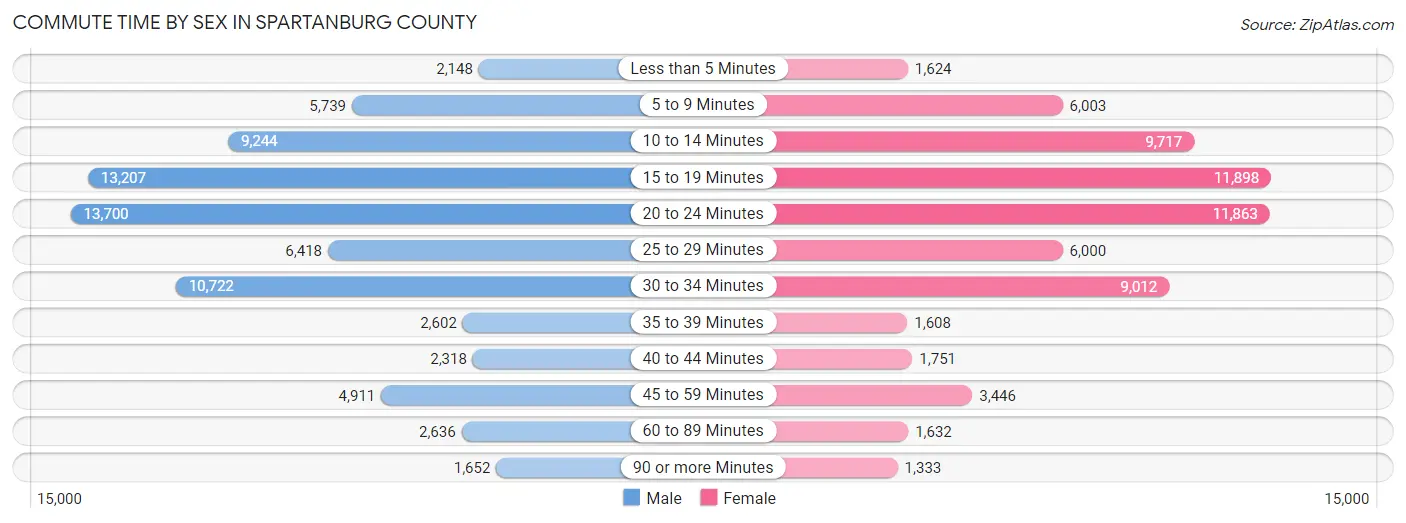
| Commute Time | Male | Female |
| Less than 5 Minutes | 2,148 (2.9%) | 1,624 (2.5%) |
| 5 to 9 Minutes | 5,739 (7.6%) | 6,003 (9.1%) |
| 10 to 14 Minutes | 9,244 (12.3%) | 9,717 (14.7%) |
| 15 to 19 Minutes | 13,207 (17.5%) | 11,898 (18.1%) |
| 20 to 24 Minutes | 13,700 (18.2%) | 11,863 (18.0%) |
| 25 to 29 Minutes | 6,418 (8.5%) | 6,000 (9.1%) |
| 30 to 34 Minutes | 10,722 (14.2%) | 9,012 (13.7%) |
| 35 to 39 Minutes | 2,602 (3.5%) | 1,608 (2.4%) |
| 40 to 44 Minutes | 2,318 (3.1%) | 1,751 (2.7%) |
| 45 to 59 Minutes | 4,911 (6.5%) | 3,446 (5.2%) |
| 60 to 89 Minutes | 2,636 (3.5%) | 1,632 (2.5%) |
| 90 or more Minutes | 1,652 (2.2%) | 1,333 (2.0%) |
Time of Departure to Work by Sex in Spartanburg County
The most frequent times of departure to work in Spartanburg County are 7:00 AM to 7:29 AM (10,902, 14.5%) for males and 7:00 AM to 7:29 AM (12,671, 19.2%) for females.
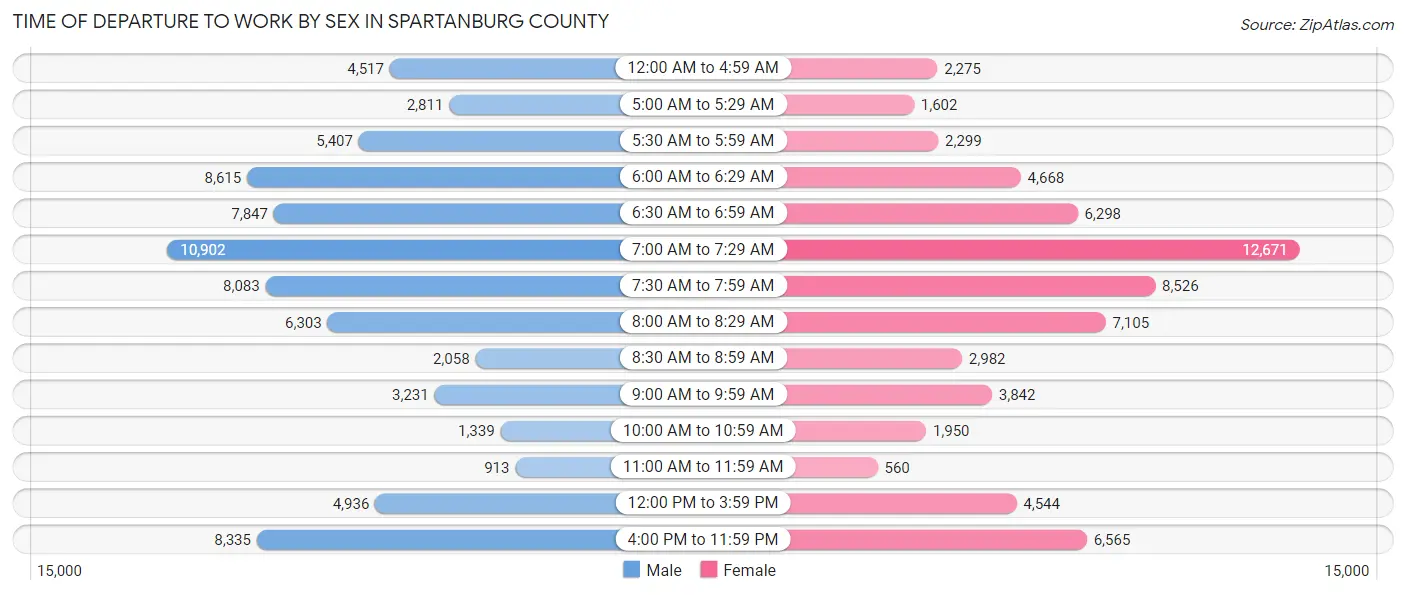
| Time of Departure | Male | Female |
| 12:00 AM to 4:59 AM | 4,517 (6.0%) | 2,275 (3.5%) |
| 5:00 AM to 5:29 AM | 2,811 (3.7%) | 1,602 (2.4%) |
| 5:30 AM to 5:59 AM | 5,407 (7.2%) | 2,299 (3.5%) |
| 6:00 AM to 6:29 AM | 8,615 (11.4%) | 4,668 (7.1%) |
| 6:30 AM to 6:59 AM | 7,847 (10.4%) | 6,298 (9.6%) |
| 7:00 AM to 7:29 AM | 10,902 (14.5%) | 12,671 (19.2%) |
| 7:30 AM to 7:59 AM | 8,083 (10.7%) | 8,526 (12.9%) |
| 8:00 AM to 8:29 AM | 6,303 (8.4%) | 7,105 (10.8%) |
| 8:30 AM to 8:59 AM | 2,058 (2.7%) | 2,982 (4.5%) |
| 9:00 AM to 9:59 AM | 3,231 (4.3%) | 3,842 (5.8%) |
| 10:00 AM to 10:59 AM | 1,339 (1.8%) | 1,950 (3.0%) |
| 11:00 AM to 11:59 AM | 913 (1.2%) | 560 (0.9%) |
| 12:00 PM to 3:59 PM | 4,936 (6.6%) | 4,544 (6.9%) |
| 4:00 PM to 11:59 PM | 8,335 (11.1%) | 6,565 (10.0%) |
| Total | 75,297 (100.0%) | 65,887 (100.0%) |
Housing Occupancy in Spartanburg County
Occupancy by Ownership in Spartanburg County
Of the total 125,394 dwellings in Spartanburg County, owner-occupied units account for 91,280 (72.8%), while renter-occupied units make up 34,114 (27.2%).
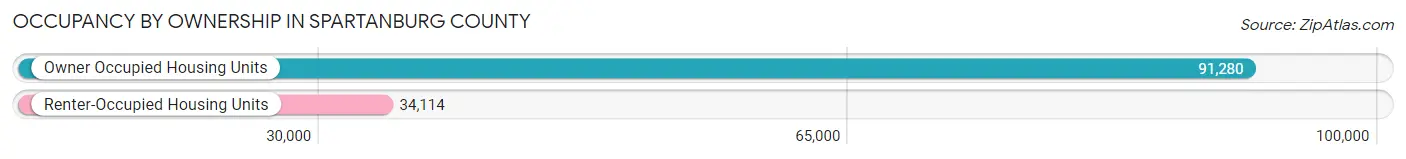
| Occupancy | # Housing Units | % Housing Units |
| Owner Occupied Housing Units | 91,280 | 72.8% |
| Renter-Occupied Housing Units | 34,114 | 27.2% |
| Total Occupied Housing Units | 125,394 | 100.0% |
Occupancy by Household Size in Spartanburg County
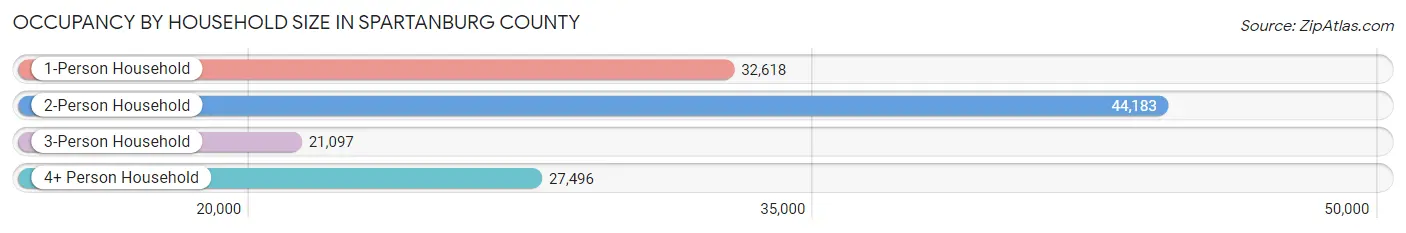
| Household Size | # Housing Units | % Housing Units |
| 1-Person Household | 32,618 | 26.0% |
| 2-Person Household | 44,183 | 35.2% |
| 3-Person Household | 21,097 | 16.8% |
| 4+ Person Household | 27,496 | 21.9% |
| Total Housing Units | 125,394 | 100.0% |
Occupancy by Ownership by Household Size in Spartanburg County
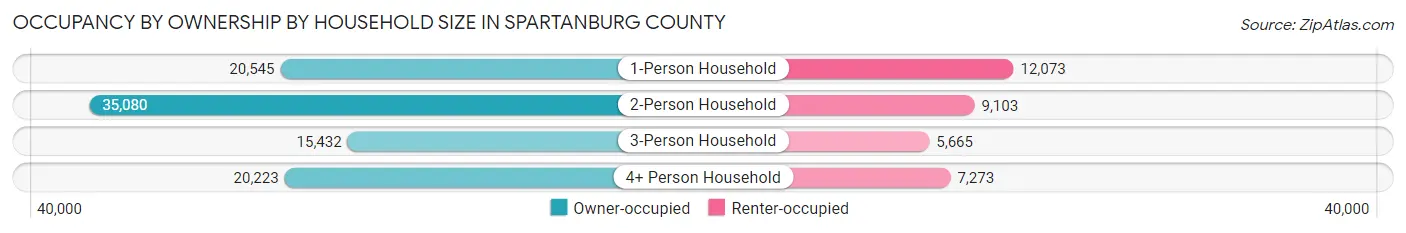
| Household Size | Owner-occupied | Renter-occupied |
| 1-Person Household | 20,545 (63.0%) | 12,073 (37.0%) |
| 2-Person Household | 35,080 (79.4%) | 9,103 (20.6%) |
| 3-Person Household | 15,432 (73.2%) | 5,665 (26.9%) |
| 4+ Person Household | 20,223 (73.6%) | 7,273 (26.5%) |
| Total Housing Units | 91,280 (72.8%) | 34,114 (27.2%) |
Occupancy by Educational Attainment in Spartanburg County
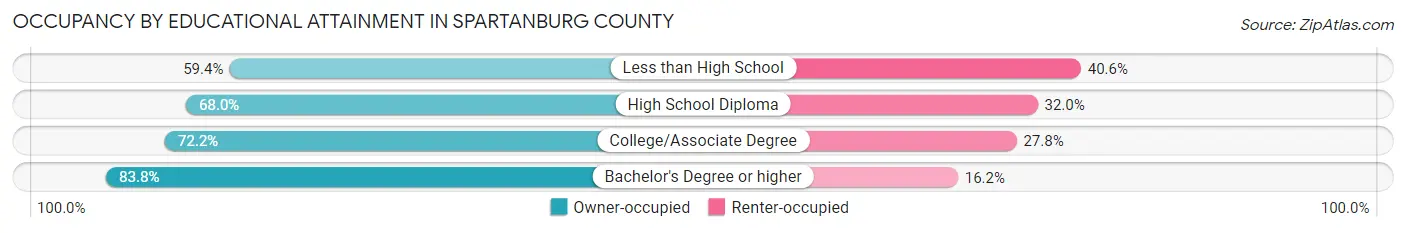
| Household Size | Owner-occupied | Renter-occupied |
| Less than High School | 7,983 (59.4%) | 5,449 (40.6%) |
| High School Diploma | 24,594 (68.0%) | 11,575 (32.0%) |
| College/Associate Degree | 29,940 (72.2%) | 11,537 (27.8%) |
| Bachelor's Degree or higher | 28,763 (83.8%) | 5,553 (16.2%) |
Occupancy by Age of Householder in Spartanburg County
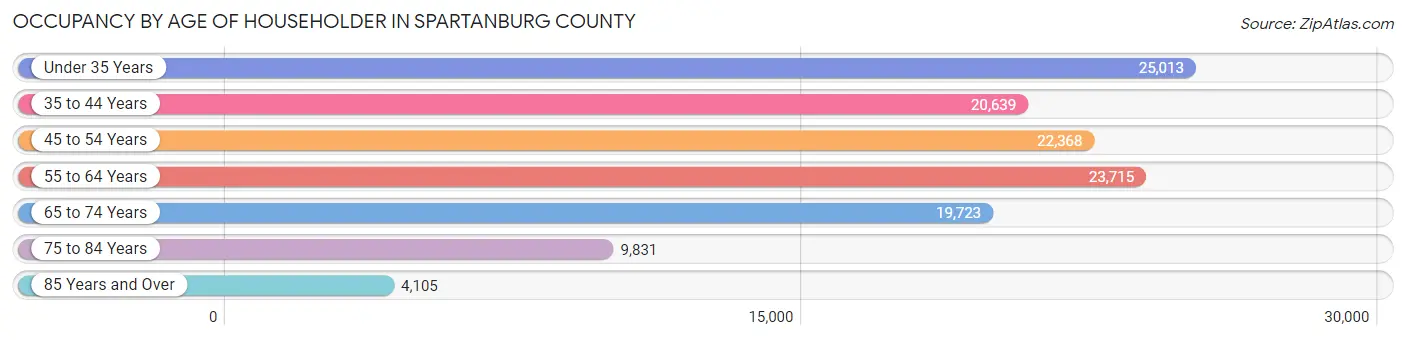
| Age Bracket | # Households | % Households |
| Under 35 Years | 25,013 | 20.0% |
| 35 to 44 Years | 20,639 | 16.5% |
| 45 to 54 Years | 22,368 | 17.8% |
| 55 to 64 Years | 23,715 | 18.9% |
| 65 to 74 Years | 19,723 | 15.7% |
| 75 to 84 Years | 9,831 | 7.8% |
| 85 Years and Over | 4,105 | 3.3% |
| Total | 125,394 | 100.0% |
Housing Finances in Spartanburg County
Median Income by Occupancy in Spartanburg County
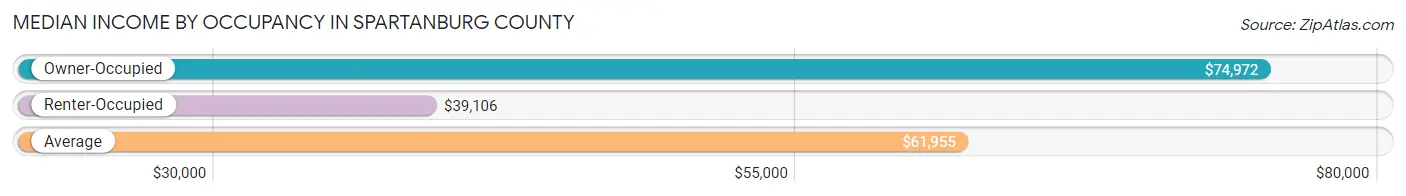
| Occupancy Type | # Households | Median Income |
| Owner-Occupied | 91,280 (72.8%) | $74,972 |
| Renter-Occupied | 34,114 (27.2%) | $39,106 |
| Average | 125,394 (100.0%) | $61,955 |
Occupancy by Householder Income Bracket in Spartanburg County
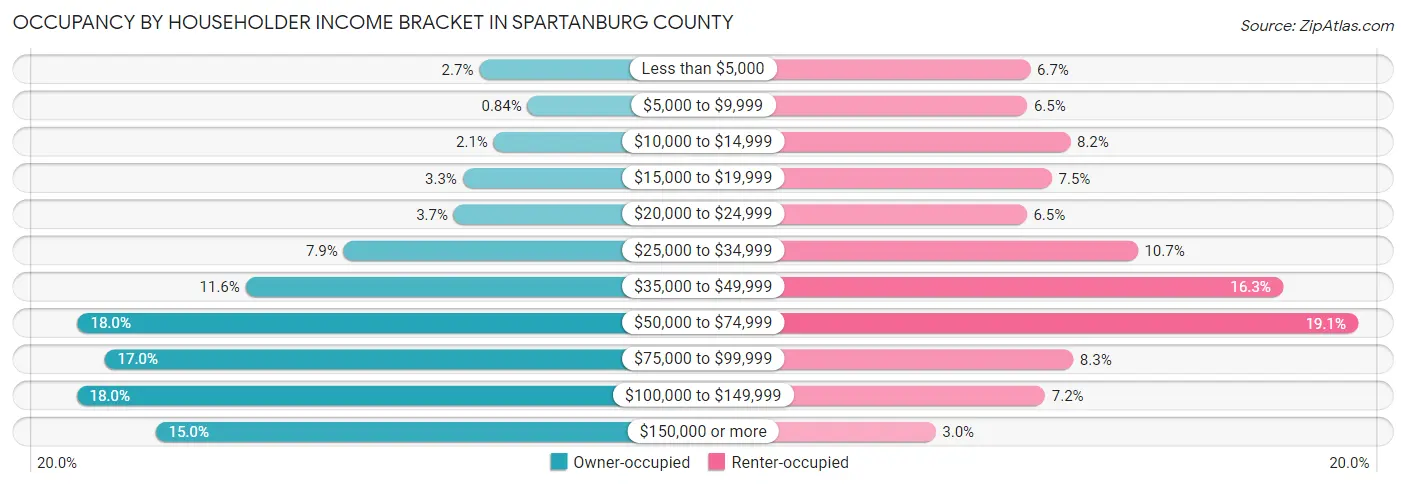
| Income Bracket | Owner-occupied | Renter-occupied |
| Less than $5,000 | 2,449 (2.7%) | 2,269 (6.7%) |
| $5,000 to $9,999 | 771 (0.8%) | 2,229 (6.5%) |
| $10,000 to $14,999 | 1,943 (2.1%) | 2,786 (8.2%) |
| $15,000 to $19,999 | 3,025 (3.3%) | 2,549 (7.5%) |
| $20,000 to $24,999 | 3,328 (3.6%) | 2,222 (6.5%) |
| $25,000 to $34,999 | 7,161 (7.9%) | 3,663 (10.7%) |
| $35,000 to $49,999 | 10,566 (11.6%) | 5,552 (16.3%) |
| $50,000 to $74,999 | 16,411 (18.0%) | 6,525 (19.1%) |
| $75,000 to $99,999 | 15,474 (17.0%) | 2,824 (8.3%) |
| $100,000 to $149,999 | 16,447 (18.0%) | 2,458 (7.2%) |
| $150,000 or more | 13,705 (15.0%) | 1,037 (3.0%) |
| Total | 91,280 (100.0%) | 34,114 (100.0%) |
Monthly Housing Cost Tiers in Spartanburg County
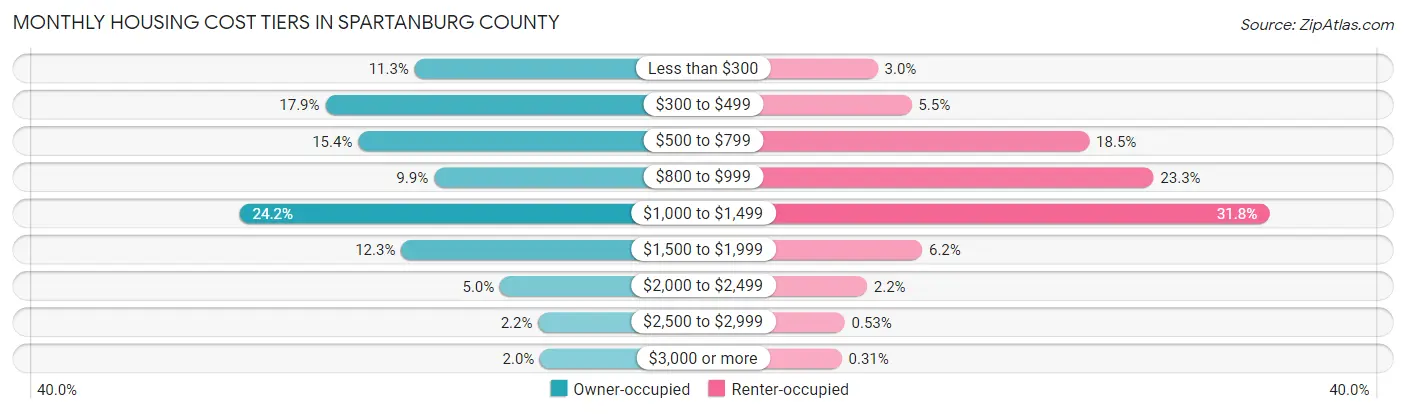
| Monthly Cost | Owner-occupied | Renter-occupied |
| Less than $300 | 10,291 (11.3%) | 1,009 (3.0%) |
| $300 to $499 | 16,298 (17.8%) | 1,860 (5.4%) |
| $500 to $799 | 14,083 (15.4%) | 6,326 (18.5%) |
| $800 to $999 | 8,991 (9.9%) | 7,939 (23.3%) |
| $1,000 to $1,499 | 22,049 (24.2%) | 10,843 (31.8%) |
| $1,500 to $1,999 | 11,190 (12.3%) | 2,125 (6.2%) |
| $2,000 to $2,499 | 4,545 (5.0%) | 740 (2.2%) |
| $2,500 to $2,999 | 1,981 (2.2%) | 181 (0.5%) |
| $3,000 or more | 1,852 (2.0%) | 105 (0.3%) |
| Total | 91,280 (100.0%) | 34,114 (100.0%) |
Physical Housing Characteristics in Spartanburg County
Housing Structures in Spartanburg County
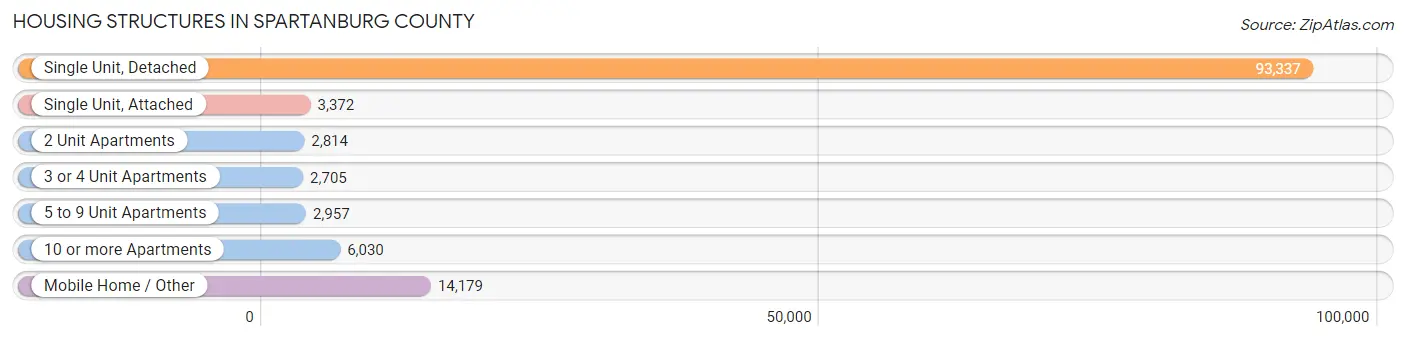
| Structure Type | # Housing Units | % Housing Units |
| Single Unit, Detached | 93,337 | 74.4% |
| Single Unit, Attached | 3,372 | 2.7% |
| 2 Unit Apartments | 2,814 | 2.2% |
| 3 or 4 Unit Apartments | 2,705 | 2.2% |
| 5 to 9 Unit Apartments | 2,957 | 2.4% |
| 10 or more Apartments | 6,030 | 4.8% |
| Mobile Home / Other | 14,179 | 11.3% |
| Total | 125,394 | 100.0% |
Housing Structures by Occupancy in Spartanburg County
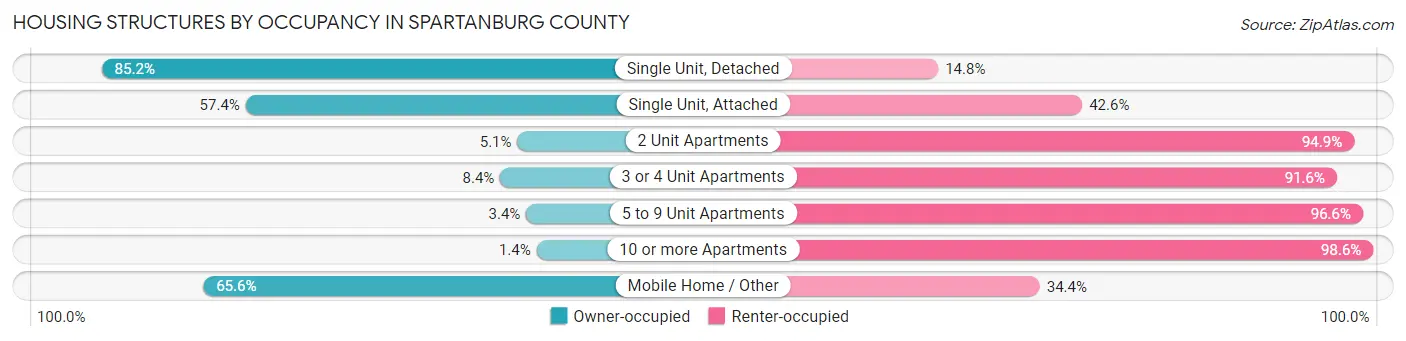
| Structure Type | Owner-occupied | Renter-occupied |
| Single Unit, Detached | 79,482 (85.2%) | 13,855 (14.8%) |
| Single Unit, Attached | 1,937 (57.4%) | 1,435 (42.6%) |
| 2 Unit Apartments | 144 (5.1%) | 2,670 (94.9%) |
| 3 or 4 Unit Apartments | 228 (8.4%) | 2,477 (91.6%) |
| 5 to 9 Unit Apartments | 101 (3.4%) | 2,856 (96.6%) |
| 10 or more Apartments | 86 (1.4%) | 5,944 (98.6%) |
| Mobile Home / Other | 9,302 (65.6%) | 4,877 (34.4%) |
| Total | 91,280 (72.8%) | 34,114 (27.2%) |
Housing Structures by Number of Rooms in Spartanburg County
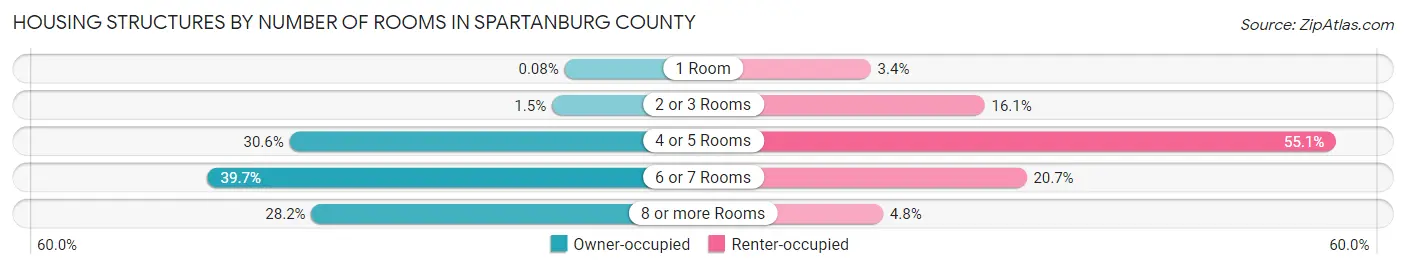
| Number of Rooms | Owner-occupied | Renter-occupied |
| 1 Room | 77 (0.1%) | 1,162 (3.4%) |
| 2 or 3 Rooms | 1,343 (1.5%) | 5,477 (16.1%) |
| 4 or 5 Rooms | 27,930 (30.6%) | 18,788 (55.1%) |
| 6 or 7 Rooms | 36,218 (39.7%) | 7,061 (20.7%) |
| 8 or more Rooms | 25,712 (28.2%) | 1,626 (4.8%) |
| Total | 91,280 (100.0%) | 34,114 (100.0%) |
Housing Structure by Heating Type in Spartanburg County
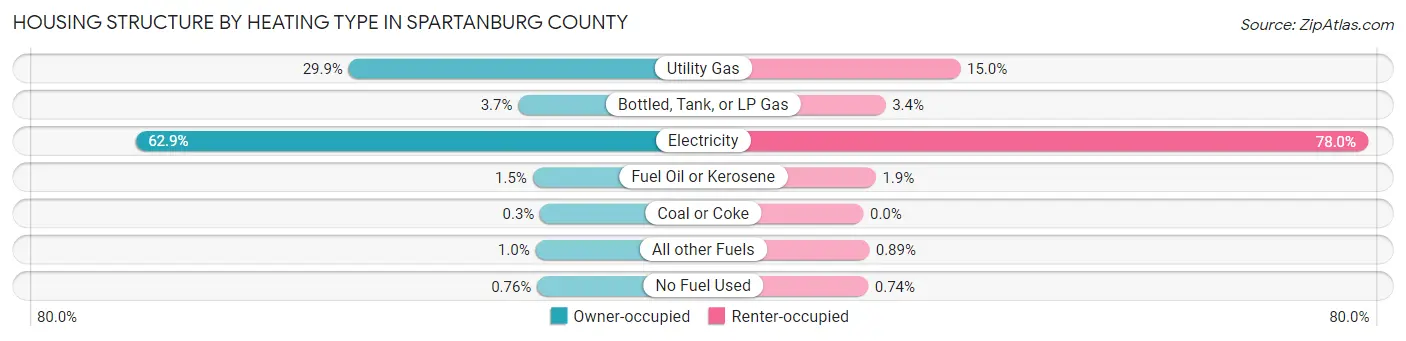
| Heating Type | Owner-occupied | Renter-occupied |
| Utility Gas | 27,292 (29.9%) | 5,115 (15.0%) |
| Bottled, Tank, or LP Gas | 3,355 (3.7%) | 1,169 (3.4%) |
| Electricity | 57,416 (62.9%) | 26,619 (78.0%) |
| Fuel Oil or Kerosene | 1,322 (1.5%) | 656 (1.9%) |
| Coal or Coke | 271 (0.3%) | 0 (0.0%) |
| All other Fuels | 931 (1.0%) | 303 (0.9%) |
| No Fuel Used | 693 (0.8%) | 252 (0.7%) |
| Total | 91,280 (100.0%) | 34,114 (100.0%) |
Household Vehicle Usage in Spartanburg County
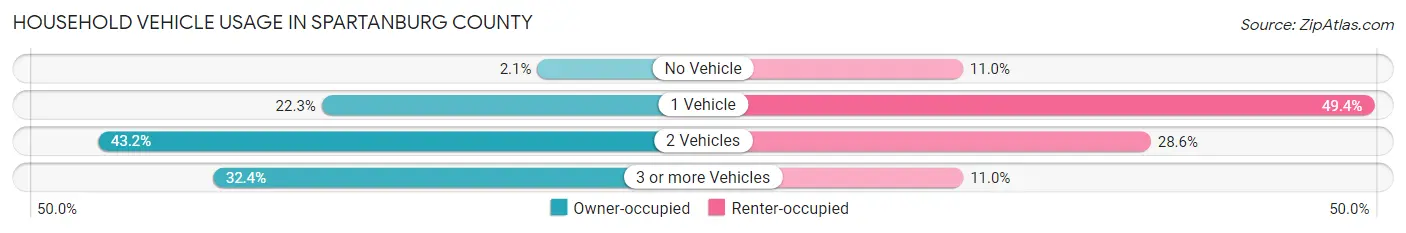
| Vehicles per Household | Owner-occupied | Renter-occupied |
| No Vehicle | 1,949 (2.1%) | 3,756 (11.0%) |
| 1 Vehicle | 20,330 (22.3%) | 16,854 (49.4%) |
| 2 Vehicles | 39,397 (43.2%) | 9,738 (28.5%) |
| 3 or more Vehicles | 29,604 (32.4%) | 3,766 (11.0%) |
| Total | 91,280 (100.0%) | 34,114 (100.0%) |
Real Estate & Mortgages in Spartanburg County
Real Estate and Mortgage Overview in Spartanburg County
| Characteristic | Without Mortgage | With Mortgage |
| Housing Units | 36,289 | 54,991 |
| Median Property Value | $159,400 | $213,500 |
| Median Household Income | $52,985 | $9,886 |
| Monthly Housing Costs | $387 | $1,713 |
| Real Estate Taxes | $883 | $1,141 |
Property Value by Mortgage Status in Spartanburg County
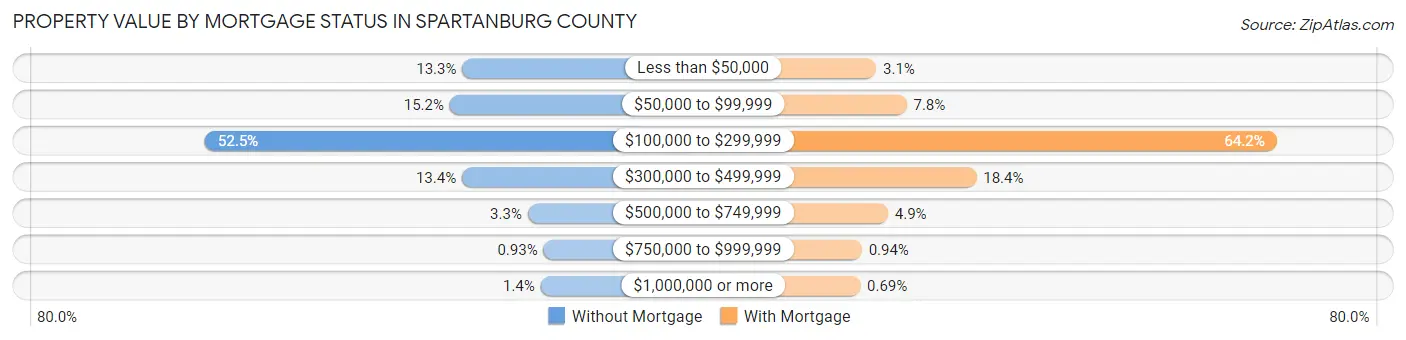
| Property Value | Without Mortgage | With Mortgage |
| Less than $50,000 | 4,826 (13.3%) | 1,719 (3.1%) |
| $50,000 to $99,999 | 5,520 (15.2%) | 4,275 (7.8%) |
| $100,000 to $299,999 | 19,058 (52.5%) | 35,283 (64.2%) |
| $300,000 to $499,999 | 4,844 (13.4%) | 10,116 (18.4%) |
| $500,000 to $749,999 | 1,209 (3.3%) | 2,704 (4.9%) |
| $750,000 to $999,999 | 336 (0.9%) | 516 (0.9%) |
| $1,000,000 or more | 496 (1.4%) | 378 (0.7%) |
| Total | 36,289 (100.0%) | 54,991 (100.0%) |
Household Income by Mortgage Status in Spartanburg County
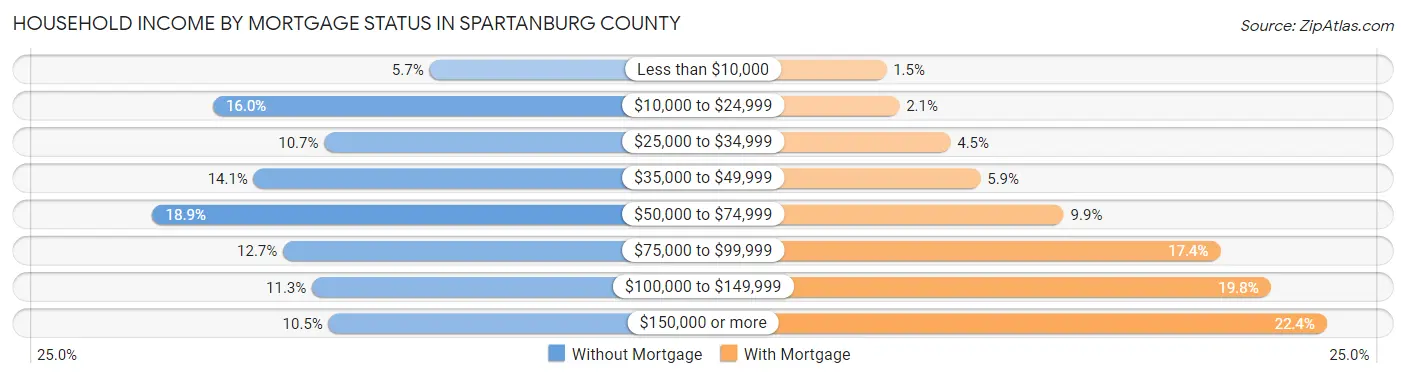
| Household Income | Without Mortgage | With Mortgage |
| Less than $10,000 | 2,077 (5.7%) | 804 (1.5%) |
| $10,000 to $24,999 | 5,817 (16.0%) | 1,143 (2.1%) |
| $25,000 to $34,999 | 3,892 (10.7%) | 2,479 (4.5%) |
| $35,000 to $49,999 | 5,114 (14.1%) | 3,269 (5.9%) |
| $50,000 to $74,999 | 6,858 (18.9%) | 5,452 (9.9%) |
| $75,000 to $99,999 | 4,606 (12.7%) | 9,553 (17.4%) |
| $100,000 to $149,999 | 4,106 (11.3%) | 10,868 (19.8%) |
| $150,000 or more | 3,819 (10.5%) | 12,341 (22.4%) |
| Total | 36,289 (100.0%) | 54,991 (100.0%) |
Property Value to Household Income Ratio in Spartanburg County
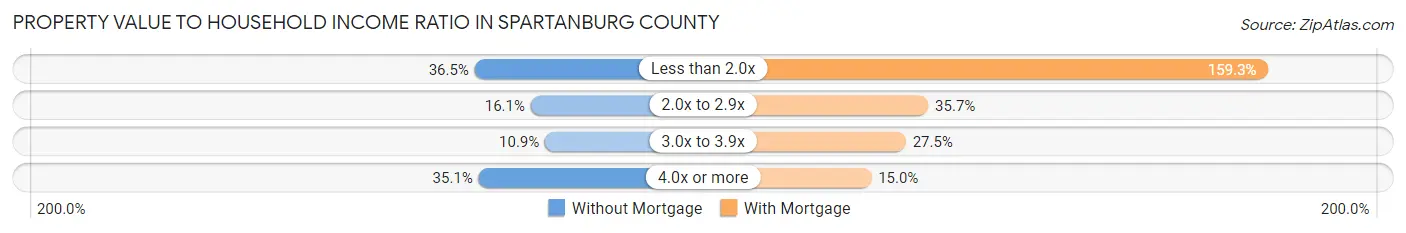
| Value-to-Income Ratio | Without Mortgage | With Mortgage |
| Less than 2.0x | 13,252 (36.5%) | 87,577 (159.3%) |
| 2.0x to 2.9x | 5,854 (16.1%) | 19,627 (35.7%) |
| 3.0x to 3.9x | 3,970 (10.9%) | 15,137 (27.5%) |
| 4.0x or more | 12,729 (35.1%) | 8,241 (15.0%) |
| Total | 36,289 (100.0%) | 54,991 (100.0%) |
Real Estate Taxes by Mortgage Status in Spartanburg County
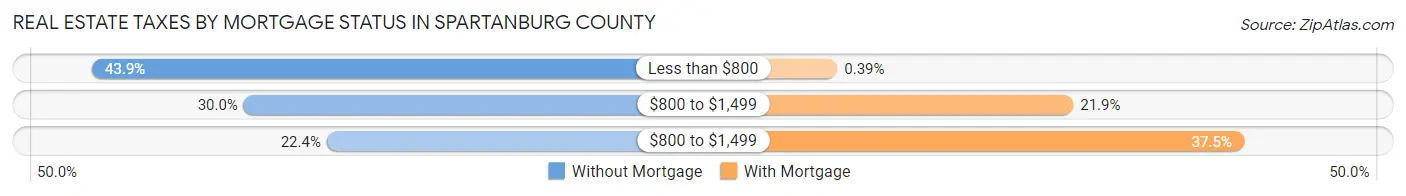
| Property Taxes | Without Mortgage | With Mortgage |
| Less than $800 | 15,913 (43.9%) | 217 (0.4%) |
| $800 to $1,499 | 10,882 (30.0%) | 12,065 (21.9%) |
| $800 to $1,499 | 8,132 (22.4%) | 20,627 (37.5%) |
| Total | 36,289 (100.0%) | 54,991 (100.0%) |
Health & Disability in Spartanburg County
Health Insurance Coverage by Age in Spartanburg County
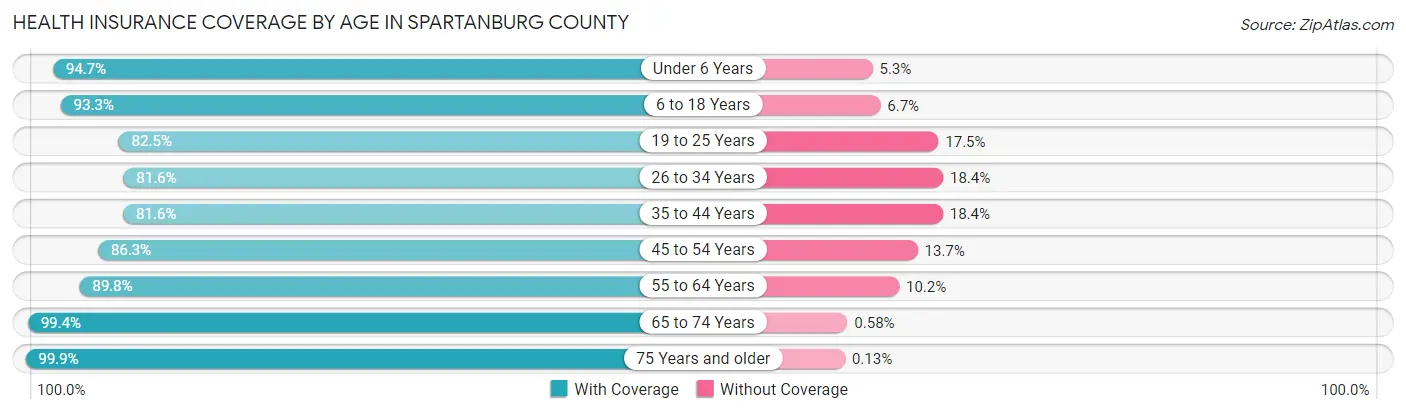
| Age Bracket | With Coverage | Without Coverage |
| Under 6 Years | 22,643 (94.7%) | 1,258 (5.3%) |
| 6 to 18 Years | 53,273 (93.3%) | 3,835 (6.7%) |
| 19 to 25 Years | 24,140 (82.5%) | 5,136 (17.5%) |
| 26 to 34 Years | 33,435 (81.6%) | 7,551 (18.4%) |
| 35 to 44 Years | 31,952 (81.6%) | 7,192 (18.4%) |
| 45 to 54 Years | 35,875 (86.3%) | 5,683 (13.7%) |
| 55 to 64 Years | 37,143 (89.8%) | 4,224 (10.2%) |
| 65 to 74 Years | 31,808 (99.4%) | 185 (0.6%) |
| 75 Years and older | 20,467 (99.9%) | 26 (0.1%) |
| Total | 290,736 (89.2%) | 35,090 (10.8%) |
Health Insurance Coverage by Citizenship Status in Spartanburg County
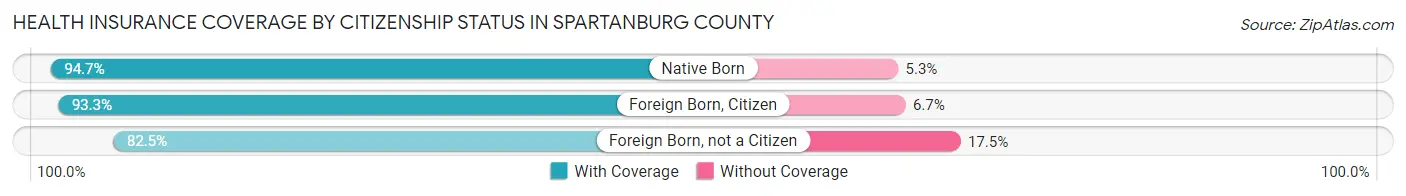
| Citizenship Status | With Coverage | Without Coverage |
| Native Born | 22,643 (94.7%) | 1,258 (5.3%) |
| Foreign Born, Citizen | 53,273 (93.3%) | 3,835 (6.7%) |
| Foreign Born, not a Citizen | 24,140 (82.5%) | 5,136 (17.5%) |
Health Insurance Coverage by Household Income in Spartanburg County
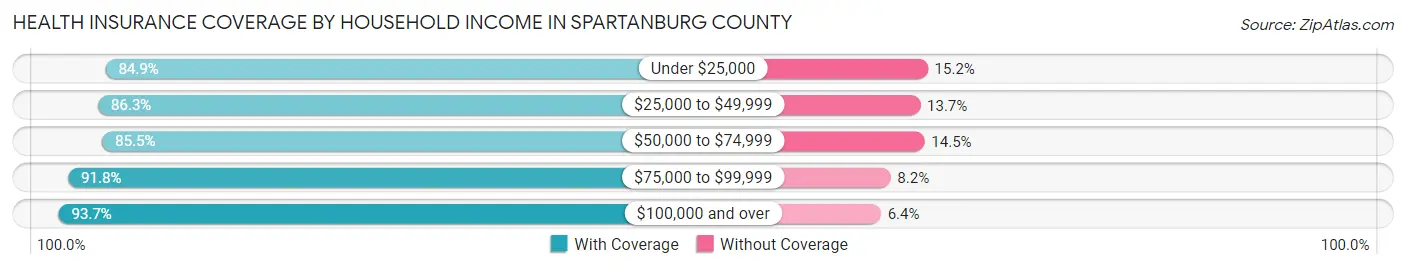
| Household Income | With Coverage | Without Coverage |
| Under $25,000 | 36,749 (84.9%) | 6,561 (15.1%) |
| $25,000 to $49,999 | 51,051 (86.3%) | 8,129 (13.7%) |
| $50,000 to $74,999 | 51,790 (85.5%) | 8,808 (14.5%) |
| $75,000 to $99,999 | 46,729 (91.8%) | 4,156 (8.2%) |
| $100,000 and over | 101,029 (93.6%) | 6,849 (6.4%) |
Public vs Private Health Insurance Coverage by Age in Spartanburg County
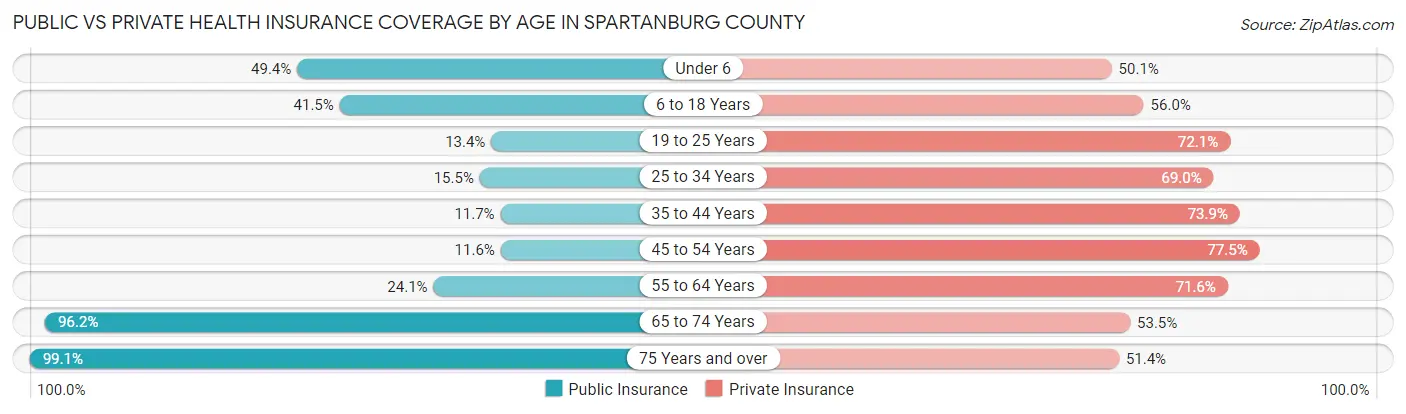
| Age Bracket | Public Insurance | Private Insurance |
| Under 6 | 11,812 (49.4%) | 11,973 (50.1%) |
| 6 to 18 Years | 23,719 (41.5%) | 31,997 (56.0%) |
| 19 to 25 Years | 3,919 (13.4%) | 21,095 (72.1%) |
| 25 to 34 Years | 6,361 (15.5%) | 28,282 (69.0%) |
| 35 to 44 Years | 4,571 (11.7%) | 28,912 (73.9%) |
| 45 to 54 Years | 4,839 (11.6%) | 32,226 (77.5%) |
| 55 to 64 Years | 9,979 (24.1%) | 29,628 (71.6%) |
| 65 to 74 Years | 30,782 (96.2%) | 17,123 (53.5%) |
| 75 Years and over | 20,299 (99.1%) | 10,542 (51.4%) |
| Total | 116,281 (35.7%) | 211,778 (65.0%) |
Disability Status by Sex by Age in Spartanburg County
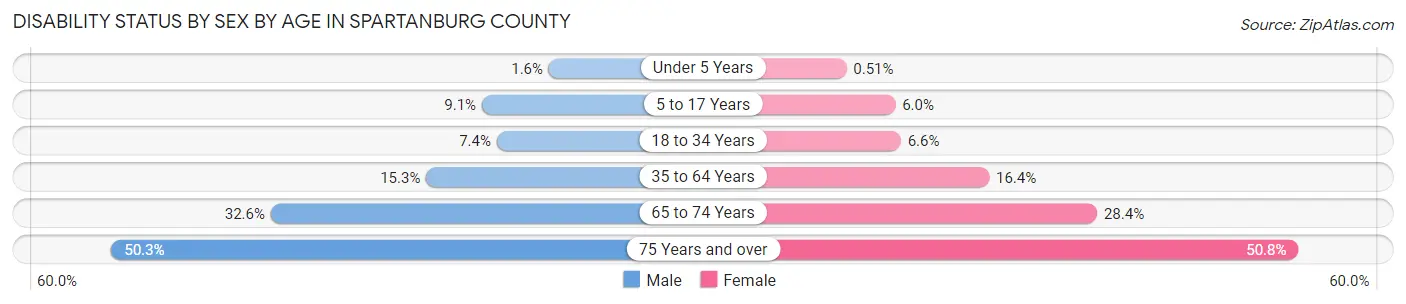
| Age Bracket | Male | Female |
| Under 5 Years | 162 (1.6%) | 50 (0.5%) |
| 5 to 17 Years | 2,595 (9.1%) | 1,647 (5.9%) |
| 18 to 34 Years | 2,723 (7.4%) | 2,518 (6.6%) |
| 35 to 64 Years | 9,087 (15.3%) | 10,260 (16.4%) |
| 65 to 74 Years | 4,848 (32.6%) | 4,864 (28.4%) |
| 75 Years and over | 4,245 (50.3%) | 6,131 (50.8%) |
Disability Class by Sex by Age in Spartanburg County
Disability Class: Hearing Difficulty
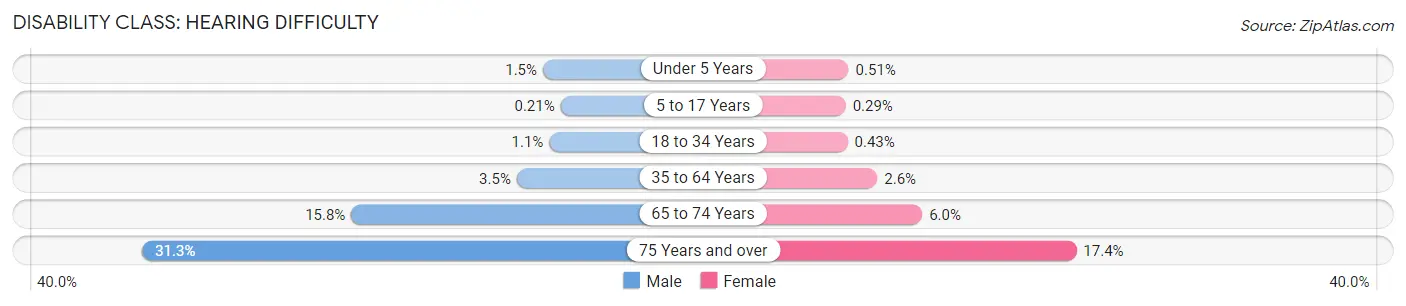
| Age Bracket | Male | Female |
| Under 5 Years | 153 (1.5%) | 50 (0.5%) |
| 5 to 17 Years | 60 (0.2%) | 79 (0.3%) |
| 18 to 34 Years | 386 (1.1%) | 167 (0.4%) |
| 35 to 64 Years | 2,059 (3.5%) | 1,649 (2.6%) |
| 65 to 74 Years | 2,344 (15.8%) | 1,021 (6.0%) |
| 75 Years and over | 2,638 (31.3%) | 2,101 (17.4%) |
Disability Class: Vision Difficulty
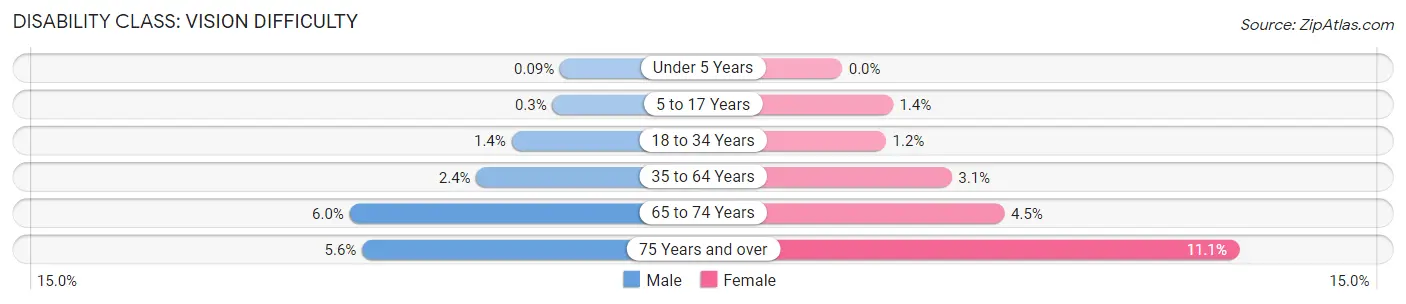
| Age Bracket | Male | Female |
| Under 5 Years | 9 (0.1%) | 0 (0.0%) |
| 5 to 17 Years | 85 (0.3%) | 391 (1.4%) |
| 18 to 34 Years | 530 (1.4%) | 467 (1.2%) |
| 35 to 64 Years | 1,438 (2.4%) | 1,910 (3.0%) |
| 65 to 74 Years | 886 (5.9%) | 774 (4.5%) |
| 75 Years and over | 472 (5.6%) | 1,333 (11.1%) |
Disability Class: Cognitive Difficulty
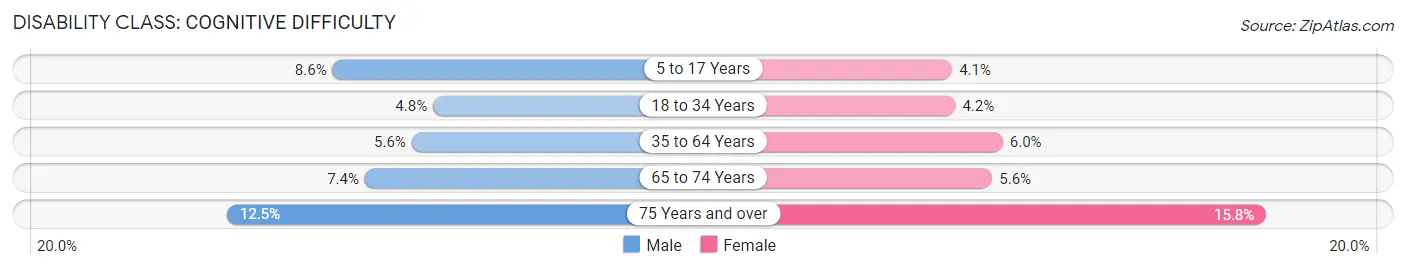
| Age Bracket | Male | Female |
| 5 to 17 Years | 2,453 (8.6%) | 1,136 (4.1%) |
| 18 to 34 Years | 1,780 (4.8%) | 1,621 (4.2%) |
| 35 to 64 Years | 3,352 (5.6%) | 3,742 (6.0%) |
| 65 to 74 Years | 1,097 (7.4%) | 957 (5.6%) |
| 75 Years and over | 1,053 (12.5%) | 1,900 (15.8%) |
Disability Class: Ambulatory Difficulty
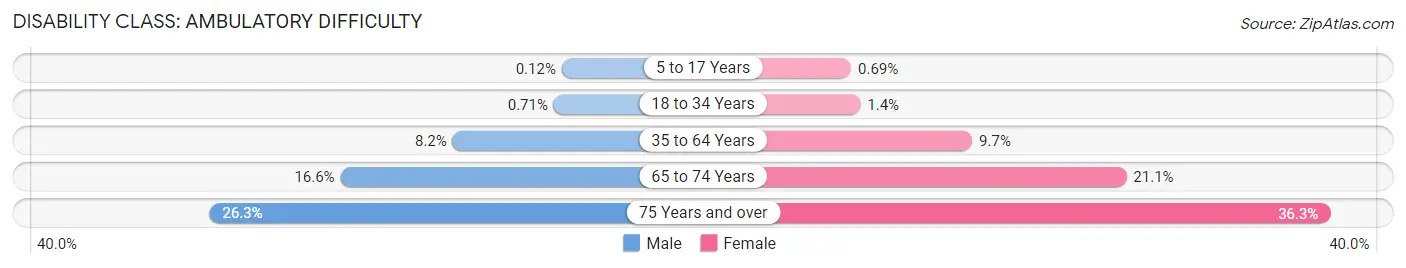
| Age Bracket | Male | Female |
| 5 to 17 Years | 33 (0.1%) | 192 (0.7%) |
| 18 to 34 Years | 262 (0.7%) | 531 (1.4%) |
| 35 to 64 Years | 4,889 (8.2%) | 6,058 (9.7%) |
| 65 to 74 Years | 2,463 (16.6%) | 3,616 (21.1%) |
| 75 Years and over | 2,216 (26.3%) | 4,373 (36.3%) |
Disability Class: Self-Care Difficulty
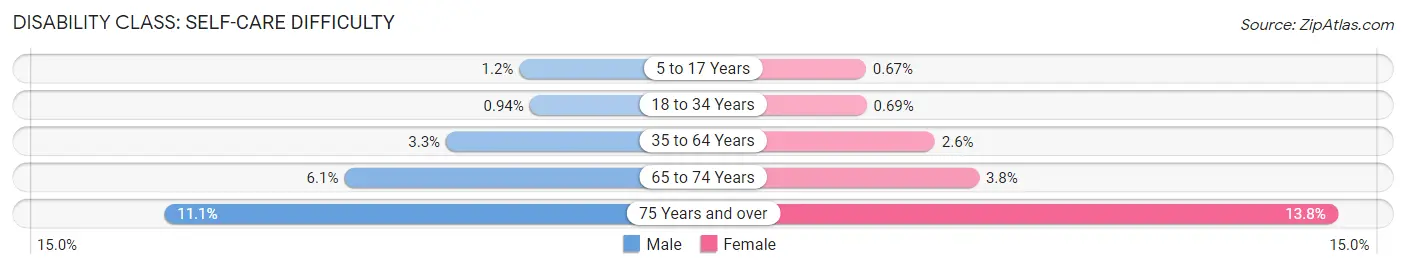
| Age Bracket | Male | Female |
| 5 to 17 Years | 351 (1.2%) | 185 (0.7%) |
| 18 to 34 Years | 344 (0.9%) | 266 (0.7%) |
| 35 to 64 Years | 1,943 (3.3%) | 1,621 (2.6%) |
| 65 to 74 Years | 908 (6.1%) | 654 (3.8%) |
| 75 Years and over | 937 (11.1%) | 1,664 (13.8%) |
Technology Access in Spartanburg County
Computing Device Access in Spartanburg County
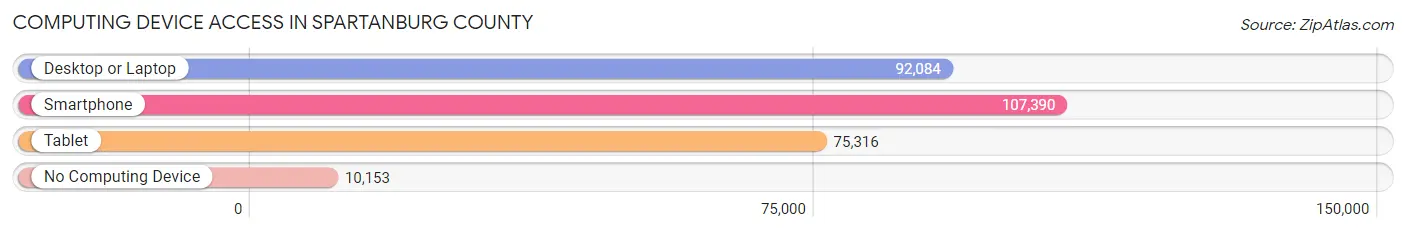
| Device Type | # Households | % Households |
| Desktop or Laptop | 92,084 | 73.4% |
| Smartphone | 107,390 | 85.6% |
| Tablet | 75,316 | 60.1% |
| No Computing Device | 10,153 | 8.1% |
| Total | 125,394 | 100.0% |
Internet Access in Spartanburg County
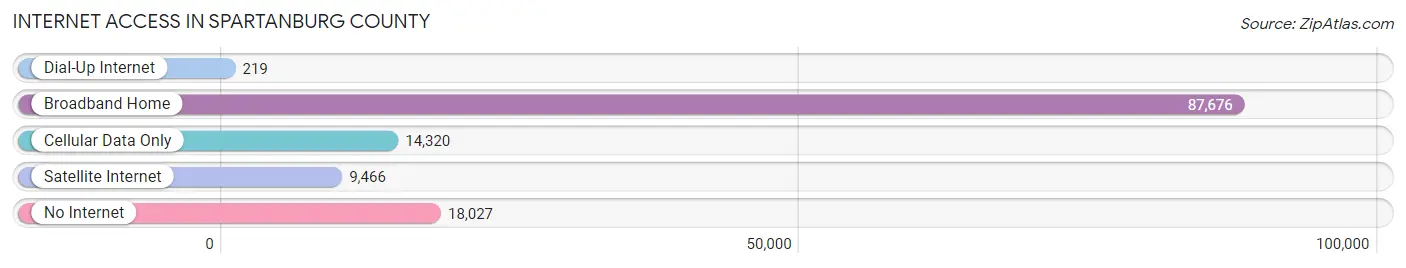
| Internet Type | # Households | % Households |
| Dial-Up Internet | 219 | 0.2% |
| Broadband Home | 87,676 | 69.9% |
| Cellular Data Only | 14,320 | 11.4% |
| Satellite Internet | 9,466 | 7.5% |
| No Internet | 18,027 | 14.4% |
| Total | 125,394 | 100.0% |
Spartanburg County Summary
Spartanburg County, South Carolina is located in the Upstate region of the state and is part of the Greenville-Spartanburg-Anderson Combined Statistical Area. It is bordered by Cherokee County to the north, Union County to the east, Laurens County to the south, and Greenville County to the west. The county seat is Spartanburg.
History
Spartanburg County was formed in 1785 from the western part of Union County. It was named after the Spartan Regiment, a local militia unit that fought in the American Revolutionary War. The county was originally part of Ninety-Six District, which was one of the original judicial districts of South Carolina. In 1798, Spartanburg County was divided into seven districts: Spartanburg, Union, Fairforest, Tyger, Enoree, Cross Anchor, and Pacolet.
The county was home to several prominent figures in South Carolina history, including John C. Calhoun, who served as a U.S. Senator and Vice President of the United States. Other notable figures include Thomas Green Clemson, who founded Clemson University, and Benjamin Tillman, who served as Governor of South Carolina and U.S. Senator.
Geography
Spartanburg County covers an area of 819 square miles and is located in the foothills of the Blue Ridge Mountains. The county is home to several rivers, including the Tyger, Enoree, Pacolet, and Broad Rivers. The county is also home to several lakes, including Lake Bowen, Lake Blalock, and Lake Cooley.
The county is divided into several townships, including Boiling Springs, Clifton, Cowpens, Duncan, Glendale, Inman, Landrum, Lyman, Pacolet, Roebuck, Spartanburg, and Wellford. The county seat is Spartanburg, which is located in the center of the county.
Economy
Spartanburg County has a diverse economy, with a mix of manufacturing, agriculture, and services. The county is home to several major employers, including BMW, Milliken & Company, and Spartanburg Regional Healthcare System.
The county is also home to several agricultural operations, including poultry, beef, and dairy farms. The county is also home to several wineries and vineyards, as well as several apple orchards.
Demographics
As of the 2010 census, Spartanburg County had a population of 284,307. The racial makeup of the county was 73.2% White, 19.9% African American, 0.3% Native American, 2.2% Asian, 0.1% Pacific Islander, 2.7% from other races, and 1.6% from two or more races. Hispanic or Latino of any race were 5.3% of the population.
The median household income in the county was $45,890, and the median family income was $54,817. The per capita income was $24,919. About 13.2% of the population was below the poverty line.
Spartanburg County is home to several colleges and universities, including Wofford College, Converse College, and the University of South Carolina Upstate. The county is also home to several museums, including the Spartanburg Regional History Museum and the Spartanburg Art Museum.
Common Questions
What is Per Capita Income in Spartanburg County?
Per Capita income in Spartanburg County is $32,039.
What is the Median Family Income in Spartanburg County?
Median Family Income in Spartanburg County is $75,197.
What is the Median Household income in Spartanburg County?
Median Household Income in Spartanburg County is $61,955.
What is Income or Wage Gap in Spartanburg County?
Income or Wage Gap in Spartanburg County is 27.8%.
Women in Spartanburg County earn 72.2 cents for every dollar earned by a man.
What is Family Income Deficit in Spartanburg County?
Family Income Deficit in Spartanburg County is $10,325.
Families that are below poverty line in Spartanburg County earn $10,325 less on average than the poverty threshold level.
What is Inequality or Gini Index in Spartanburg County?
Inequality or Gini Index in Spartanburg County is 0.45.
What is the Total Population of Spartanburg County?
Total Population of Spartanburg County is 330,119.
What is the Total Male Population of Spartanburg County?
Total Male Population of Spartanburg County is 161,252.
What is the Total Female Population of Spartanburg County?
Total Female Population of Spartanburg County is 168,867.
What is the Ratio of Males per 100 Females in Spartanburg County?
There are 95.49 Males per 100 Females in Spartanburg County.
What is the Ratio of Females per 100 Males in Spartanburg County?
There are 104.72 Females per 100 Males in Spartanburg County.
What is the Median Population Age in Spartanburg County?
Median Population Age in Spartanburg County is 38.0 Years.
What is the Average Family Size in Spartanburg County
Average Family Size in Spartanburg County is 3.1 People.
What is the Average Household Size in Spartanburg County
Average Household Size in Spartanburg County is 2.6 People.
How Large is the Labor Force in Spartanburg County?
There are 162,502 People in the Labor Forcein in Spartanburg County.
What is the Percentage of People in the Labor Force in Spartanburg County?
61.8% of People are in the Labor Force in Spartanburg County.
What is the Unemployment Rate in Spartanburg County?
Unemployment Rate in Spartanburg County is 4.7%.