Cities with the Highest Percentage of Immigrants from Philippines in the United States
RELATED REPORTS & OPTIONS
Philippines
United States
Compare Cities
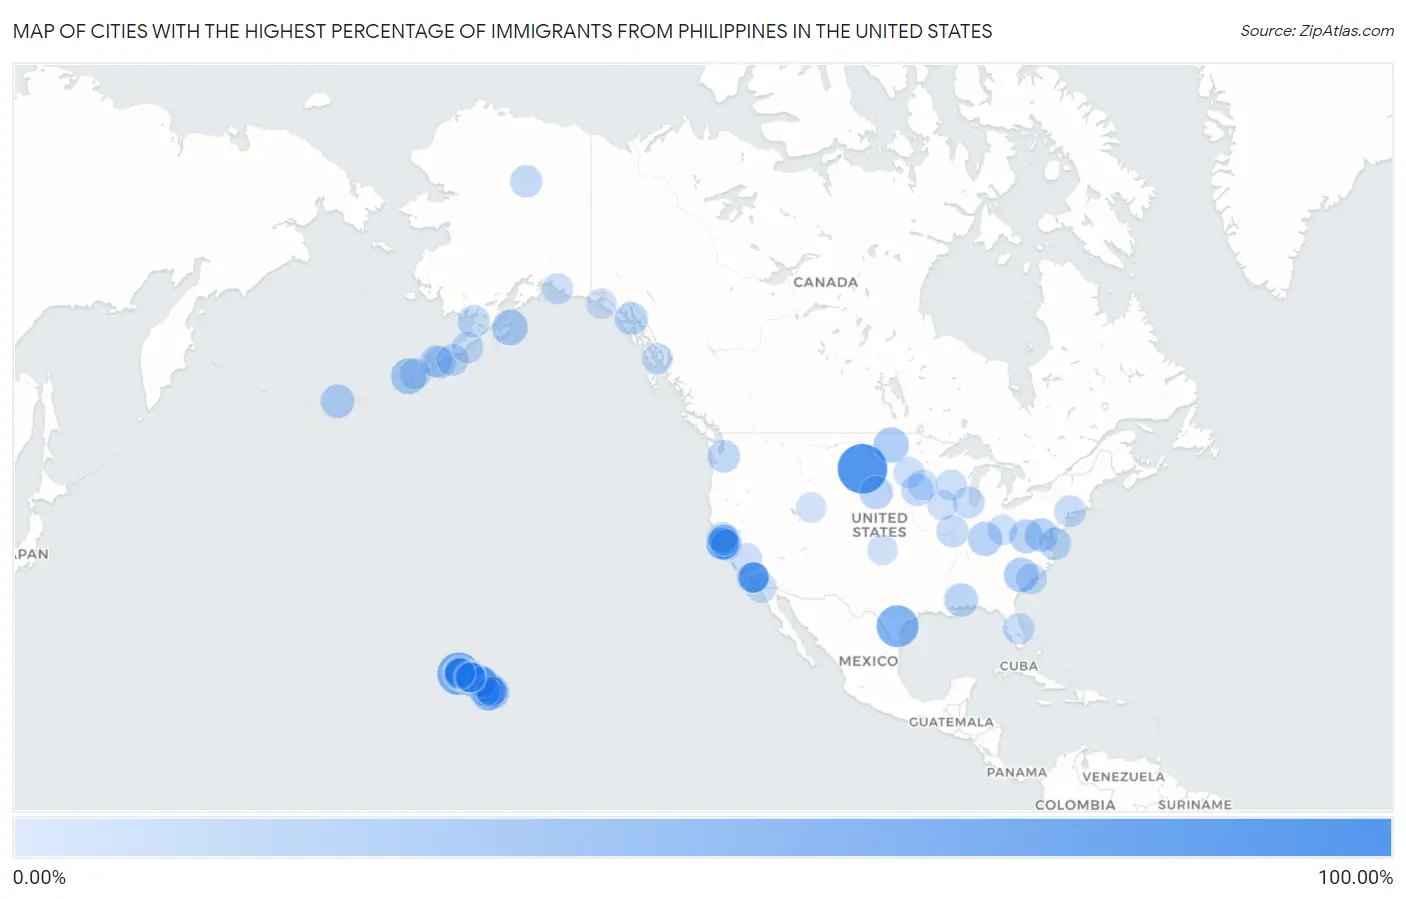
Map of Cities with the Highest Percentage of Immigrants from Philippines in the United States
0.00%
100.00%
Cities with the Highest Percentage of Immigrants from Philippines in the United States
| City | Philippines | vs State | vs National | |
| 1. | Prairie City | 100.00% | 0.19%(+99.8)#-1 | 0.60%(+99.4)#0 |
| 2. | Kaumakani | 66.69% | 7.97%(+58.7)#-1 | 0.60%(+66.1)#1 |
| 3. | Westdale | 63.10% | 0.35%(+62.7)#-1 | 0.60%(+62.5)#2 |
| 4. | Marley | 60.00% | 0.73%(+59.3)#-1 | 0.60%(+59.4)#3 |
| 5. | Unalaska | 34.06% | 2.61%(+31.5)#-1 | 0.60%(+33.5)#4 |
| 6. | Waipahu | 33.99% | 7.97%(+26.0)#0 | 0.60%(+33.4)#5 |
| 7. | Kodiak | 33.69% | 2.61%(+31.1)#0 | 0.60%(+33.1)#6 |
| 8. | Warwick | 31.63% | 0.32%(+31.3)#-1 | 0.60%(+31.0)#7 |
| 9. | Springfield | 29.98% | 0.93%(+29.1)#-1 | 0.60%(+29.4)#8 |
| 10. | Rembert | 29.41% | 0.21%(+29.2)#-1 | 0.60%(+28.8)#9 |
| 11. | Ewa Villages | 27.79% | 7.97%(+19.8)#1 | 0.60%(+27.2)#10 |
| 12. | Knights Ferry | 27.78% | 2.08%(+25.7)#-1 | 0.60%(+27.2)#11 |
| 13. | Pahoa | 27.55% | 7.97%(+19.6)#2 | 0.60%(+27.0)#12 |
| 14. | Ewa Beach | 27.25% | 7.97%(+19.3)#3 | 0.60%(+26.7)#13 |
| 15. | Keaau | 27.13% | 7.97%(+19.2)#4 | 0.60%(+26.5)#14 |
| 16. | Meadow Vale | 26.79% | 0.14%(+26.7)#-1 | 0.60%(+26.2)#15 |
| 17. | Adak | 25.40% | 2.61%(+22.8)#1 | 0.60%(+24.8)#16 |
| 18. | Bartow | 25.23% | 0.10%(+25.1)#-1 | 0.60%(+24.6)#17 |
| 19. | Connecticut Farms | 24.25% | 0.93%(+23.3)#0 | 0.60%(+23.7)#18 |
| 20. | Catlett | 24.21% | 0.61%(+23.6)#-1 | 0.60%(+23.6)#19 |
| 21. | Kahului | 24.18% | 7.97%(+16.2)#5 | 0.60%(+23.6)#20 |
| 22. | Beaumont | 24.04% | 0.11%(+23.9)#-1 | 0.60%(+23.4)#21 |
| 23. | Lanai City | 23.19% | 7.97%(+15.2)#6 | 0.60%(+22.6)#22 |
| 24. | St Francis | 23.00% | 0.19%(+22.8)#0 | 0.60%(+22.4)#23 |
| 25. | Puhi | 23.00% | 7.97%(+15.0)#7 | 0.60%(+22.4)#24 |
| 26. | Eleele | 22.22% | 7.97%(+14.2)#8 | 0.60%(+21.6)#25 |
| 27. | Royal Kunia | 21.99% | 7.97%(+14.0)#9 | 0.60%(+21.4)#26 |
| 28. | Whitmore Village | 21.82% | 7.97%(+13.8)#10 | 0.60%(+21.2)#27 |
| 29. | Excursion Inlet | 20.97% | 2.61%(+18.4)#2 | 0.60%(+20.4)#28 |
| 30. | West Loch Estate | 20.61% | 7.97%(+12.6)#11 | 0.60%(+20.0)#29 |
| 31. | Daly City | 20.26% | 2.08%(+18.2)#85 | 0.60%(+19.7)#475 |
| 32. | Alder | 19.35% | 0.93%(+18.4)#-1 | 0.60%(+18.8)#476 |
| 33. | Colma | 19.04% | 2.08%(+17.0)#86 | 0.60%(+18.4)#477 |
| 34. | Lahaina | 18.84% | 7.97%(+10.9)#12 | 0.60%(+18.2)#478 |
| 35. | Bobtown | 18.69% | 0.61%(+18.1)#0 | 0.60%(+18.1)#479 |
| 36. | Hanamaulu | 18.22% | 7.97%(+10.2)#13 | 0.60%(+17.6)#480 |
| 37. | Coldfoot | 18.15% | 2.61%(+15.5)#3 | 0.60%(+17.5)#481 |
| 38. | Egegik | 17.39% | 2.61%(+14.8)#4 | 0.60%(+16.8)#482 |
| 39. | Honokaa | 17.38% | 7.97%(+9.41)#14 | 0.60%(+16.8)#483 |
| 40. | Fidelity | 17.33% | 0.73%(+16.6)#0 | 0.60%(+16.7)#484 |
| 41. | King Cove | 17.33% | 2.61%(+14.7)#5 | 0.60%(+16.7)#485 |
| 42. | Orleans | 16.23% | 0.15%(+16.1)#-1 | 0.60%(+15.6)#486 |
| 43. | Cold Bay | 16.08% | 2.61%(+13.5)#6 | 0.60%(+15.5)#487 |
| 44. | Naalehu | 15.96% | 7.97%(+7.98)#15 | 0.60%(+15.4)#488 |
| 45. | Sand Point | 15.94% | 2.61%(+13.3)#7 | 0.60%(+15.3)#489 |
| 46. | Broadmoor | 15.91% | 2.08%(+13.8)#87 | 0.60%(+15.3)#490 |
| 47. | Ewa Gentry | 15.84% | 7.97%(+7.86)#16 | 0.60%(+15.2)#491 |
| 48. | Indian Creek | 15.66% | 0.73%(+14.9)#1 | 0.60%(+15.1)#492 |
| 49. | Pepeekeo | 15.25% | 7.97%(+7.28)#17 | 0.60%(+14.7)#493 |
| 50. | Bedford Hills | 15.06% | 0.46%(+14.6)#-1 | 0.60%(+14.5)#494 |
| 51. | Chignik | 14.81% | 2.61%(+12.2)#8 | 0.60%(+14.2)#495 |
| 52. | American Canyon | 14.78% | 2.08%(+12.7)#211 | 0.60%(+14.2)#1,098 |
| 53. | Carson | 14.22% | 2.08%(+12.1)#212 | 0.60%(+13.6)#1,099 |
| 54. | Wainaku | 13.88% | 7.97%(+5.91)#18 | 0.60%(+13.3)#1,100 |
| 55. | Kapaau | 13.84% | 7.97%(+5.87)#19 | 0.60%(+13.2)#1,101 |
| 56. | Akutan | 13.72% | 2.61%(+11.1)#9 | 0.60%(+13.1)#1,102 |
| 57. | Poplar Cotton Center | 13.71% | 2.08%(+11.6)#213 | 0.60%(+13.1)#1,103 |
| 58. | Wahiawa | 13.54% | 7.97%(+5.57)#20 | 0.60%(+12.9)#1,104 |
| 59. | Pahala | 13.49% | 7.97%(+5.52)#21 | 0.60%(+12.9)#1,105 |
| 60. | Yeehaw Junction | 13.43% | 0.39%(+13.0)#-1 | 0.60%(+12.8)#1,106 |
| 61. | Hanapepe | 13.43% | 7.97%(+5.45)#22 | 0.60%(+12.8)#1,107 |
| 62. | Waipio | 12.75% | 7.97%(+4.77)#23 | 0.60%(+12.1)#1,108 |
| 63. | Waialua | 12.71% | 7.97%(+4.73)#24 | 0.60%(+12.1)#1,109 |
| 64. | Bucksport | 12.63% | 0.21%(+12.4)#0 | 0.60%(+12.0)#1,110 |
| 65. | South San Francisco | 12.39% | 2.08%(+10.3)#214 | 0.60%(+11.8)#1,111 |
| 66. | Odessa | 12.37% | 0.17%(+12.2)#-1 | 0.60%(+11.8)#1,112 |
| 67. | Waihee Waiehu | 12.33% | 7.97%(+4.36)#25 | 0.60%(+11.7)#1,113 |
| 68. | Kenwood | 12.32% | 2.08%(+10.2)#215 | 0.60%(+11.7)#1,114 |
| 69. | Union City | 12.29% | 2.08%(+10.2)#216 | 0.60%(+11.7)#1,115 |
| 70. | Kapaa | 12.29% | 7.97%(+4.32)#26 | 0.60%(+11.7)#1,116 |
| 71. | Haleiwa | 12.19% | 7.97%(+4.22)#27 | 0.60%(+11.6)#1,117 |
| 72. | Cordova | 12.17% | 2.61%(+9.55)#10 | 0.60%(+11.6)#1,118 |
| 73. | Lihue | 12.15% | 7.97%(+4.18)#28 | 0.60%(+11.6)#1,119 |
| 74. | Bergenfield Borough | 12.10% | 0.93%(+11.2)#40 | 0.60%(+11.5)#1,120 |
| 75. | Kilauea | 12.05% | 7.97%(+4.07)#29 | 0.60%(+11.4)#1,121 |
| 76. | West Carson | 11.95% | 2.08%(+9.87)#217 | 0.60%(+11.4)#1,122 |
| 77. | National City | 11.92% | 2.08%(+9.84)#218 | 0.60%(+11.3)#1,123 |
| 78. | Haliimaile | 11.79% | 7.97%(+3.82)#30 | 0.60%(+11.2)#1,124 |
| 79. | Oakdale | 11.58% | 0.16%(+11.4)#-1 | 0.60%(+11.0)#1,125 |
| 80. | Vallejo | 11.55% | 2.08%(+9.47)#219 | 0.60%(+11.0)#1,126 |
| 81. | Artesia | 11.04% | 2.08%(+8.96)#220 | 0.60%(+10.4)#1,127 |
| 82. | Nanawale Estates | 10.68% | 7.97%(+2.71)#31 | 0.60%(+10.1)#1,128 |
| 83. | Ketchikan | 10.44% | 2.61%(+7.83)#11 | 0.60%(+9.84)#1,129 |
| 84. | La Palma | 10.40% | 2.08%(+8.33)#221 | 0.60%(+9.80)#1,130 |
| 85. | Paauilo | 10.40% | 7.97%(+2.43)#32 | 0.60%(+9.80)#1,131 |
| 86. | Yakutat | 10.28% | 2.61%(+7.67)#12 | 0.60%(+9.68)#1,132 |
| 87. | Kahaluu Keauhou | 10.27% | 7.97%(+2.30)#33 | 0.60%(+9.67)#1,133 |
| 88. | Lewisville | 10.26% | 0.17%(+10.1)#0 | 0.60%(+9.66)#1,134 |
| 89. | Waikele | 10.24% | 7.97%(+2.26)#34 | 0.60%(+9.64)#1,135 |
| 90. | Bourneville | 10.08% | 0.15%(+9.92)#-1 | 0.60%(+9.48)#1,136 |
| 91. | Shueyville | 9.72% | 0.15%(+9.57)#0 | 0.60%(+9.12)#1,137 |
| 92. | Waipio Acres | 9.70% | 7.97%(+1.72)#35 | 0.60%(+9.10)#1,138 |
| 93. | Koloa | 9.69% | 7.97%(+1.71)#36 | 0.60%(+9.09)#1,139 |
| 94. | Sunset Lake | 9.42% | 0.93%(+8.49)#41 | 0.60%(+8.82)#1,140 |
| 95. | Englewood | 9.41% | 0.19%(+9.22)#-1 | 0.60%(+8.81)#1,141 |
| 96. | Cerritos | 9.33% | 2.08%(+7.25)#222 | 0.60%(+8.73)#1,142 |
| 97. | Silver Lake Cdp Essex County | 9.24% | 0.93%(+8.31)#42 | 0.60%(+8.64)#1,143 |
| 98. | Kurtistown | 9.22% | 7.97%(+1.24)#37 | 0.60%(+8.62)#1,144 |
| 99. | Halawa | 9.15% | 7.97%(+1.17)#38 | 0.60%(+8.55)#1,145 |
| 100. | Granger | 9.14% | 0.12%(+9.01)#-1 | 0.60%(+8.54)#1,146 |
Common Questions
What are the Top 10 Cities with the Highest Percentage of Immigrants from Philippines in the United States?
Top 10 Cities with the Highest Percentage of Immigrants from Philippines in the United States are:
What city has the Highest Percentage of Immigrants from Philippines in the United States?
Prairie City has the Highest Percentage of Immigrants from Philippines in the United States with 100.00%.
What is the Percentage of Immigrants from Philippines in the United States?
Percentage of Immigrants from Philippines in the United States is 0.60%.