Cities with the Most Immigrants from St. Vincent and the Grenadines in the United States
RELATED REPORTS & OPTIONS
St. Vincent and the Grenadines
United States
Compare Cities
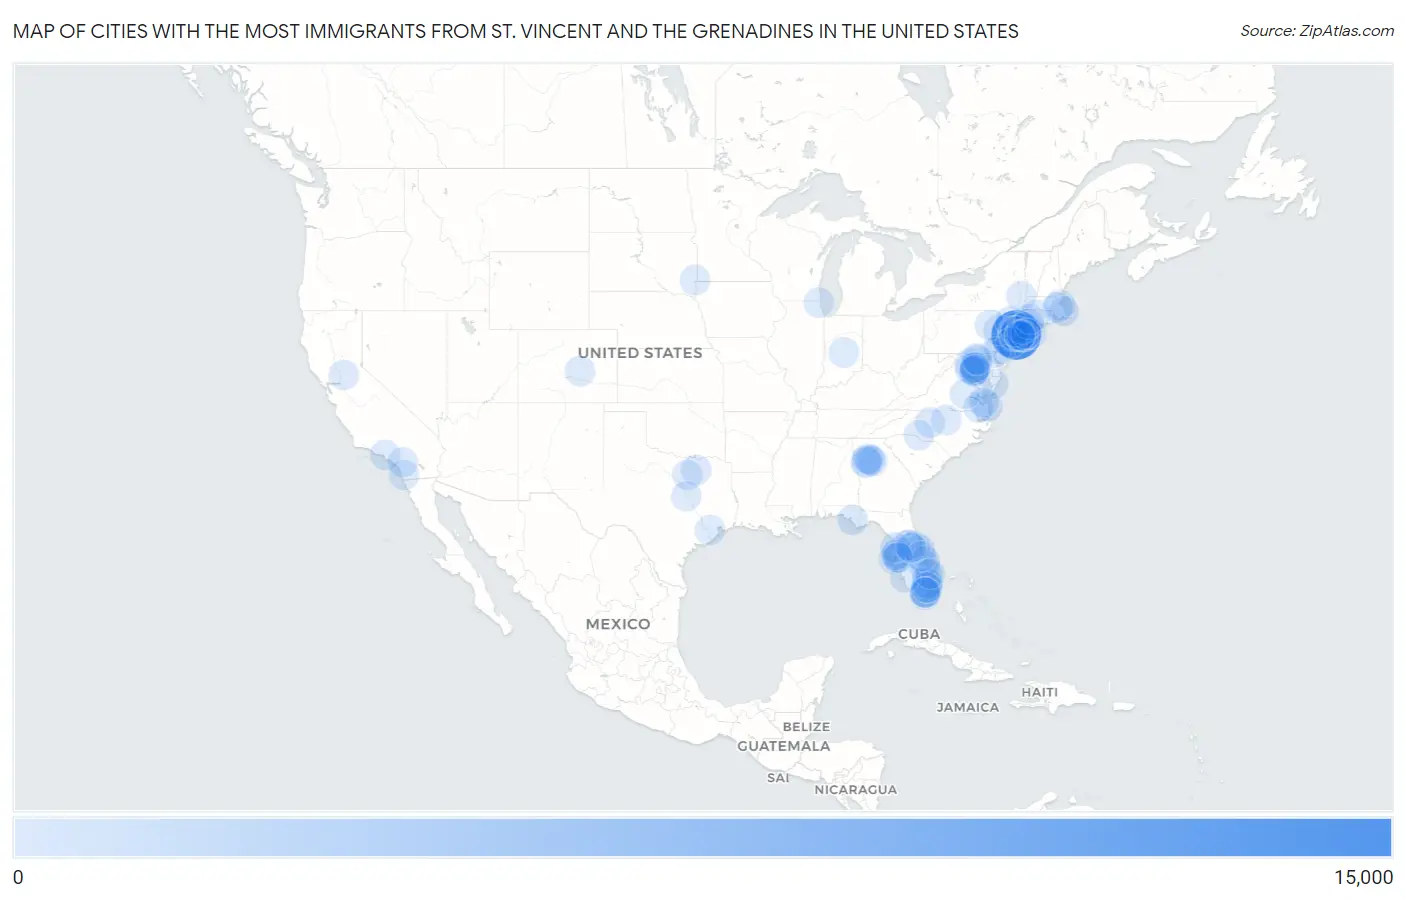
Map of Cities with the Most Immigrants from St. Vincent and the Grenadines in the United States
0
15,000
Cities with the Most Immigrants from St. Vincent and the Grenadines in the United States
| City | St. Vincent and the Grenadines | vs State | vs National | |
| 1. | New York | 12,527 | 13,674(91.61%)#1 | 22,120(56.63%)#1 |
| 2. | Coral Springs | 253 | 2,578(9.81%)#1 | 22,120(1.14%)#2 |
| 3. | Port St Lucie | 206 | 2,578(7.99%)#2 | 22,120(0.93%)#3 |
| 4. | Rockledge | 177 | 2,578(6.87%)#3 | 22,120(0.80%)#4 |
| 5. | Boston | 174 | 354(49.15%)#1 | 22,120(0.79%)#5 |
| 6. | Philadelphia | 162 | 687(23.58%)#1 | 22,120(0.73%)#6 |
| 7. | Mount Vernon | 155 | 13,674(1.13%)#2 | 22,120(0.70%)#7 |
| 8. | Virginia Beach | 138 | 377(36.60%)#1 | 22,120(0.62%)#8 |
| 9. | The Acreage | 134 | 2,578(5.20%)#4 | 22,120(0.61%)#9 |
| 10. | Pebble Creek | 132 | 2,578(5.12%)#5 | 22,120(0.60%)#10 |
| 11. | Newark | 127 | 1,158(10.97%)#1 | 22,120(0.57%)#11 |
| 12. | East Petersburg Borough | 125 | 687(18.20%)#2 | 22,120(0.57%)#12 |
| 13. | Callaway | 122 | 2,578(4.73%)#6 | 22,120(0.55%)#13 |
| 14. | Washington | 115 | 115(100.00%)#1 | 22,120(0.52%)#14 |
| 15. | Elmont | 105 | 13,674(0.77%)#3 | 22,120(0.47%)#15 |
| 16. | Naranja | 104 | 2,578(4.03%)#7 | 22,120(0.47%)#16 |
| 17. | Richmond Heights | 99 | 2,578(3.84%)#8 | 22,120(0.45%)#17 |
| 18. | Princeton | 97 | 385(25.19%)#1 | 22,120(0.44%)#18 |
| 19. | Clinton | 94 | 529(17.77%)#1 | 22,120(0.42%)#19 |
| 20. | Tamarac | 93 | 2,578(3.61%)#9 | 22,120(0.42%)#20 |
| 21. | Indianapolis | 91 | 91(100.00%)#1 | 22,120(0.41%)#21 |
| 22. | The Hammocks | 88 | 2,578(3.41%)#10 | 22,120(0.40%)#22 |
| 23. | Arlington Heights | 86 | 687(12.52%)#3 | 22,120(0.39%)#23 |
| 24. | Miramar | 83 | 2,578(3.22%)#11 | 22,120(0.38%)#24 |
| 25. | East Hartford | 81 | 257(31.52%)#1 | 22,120(0.37%)#25 |
| 26. | Randolph Town | 77 | 354(21.75%)#2 | 22,120(0.35%)#26 |
| 27. | Riverview | 76 | 2,578(2.95%)#12 | 22,120(0.34%)#27 |
| 28. | Los Angeles | 74 | 294(25.17%)#1 | 22,120(0.33%)#28 |
| 29. | South Fulton | 73 | 776(9.41%)#1 | 22,120(0.33%)#29 |
| 30. | Larksville Borough | 73 | 687(10.63%)#4 | 22,120(0.33%)#30 |
| 31. | North Plymouth | 69 | 354(19.49%)#3 | 22,120(0.31%)#31 |
| 32. | Bithlo | 67 | 2,578(2.60%)#13 | 22,120(0.30%)#32 |
| 33. | Durham | 64 | 169(37.87%)#1 | 22,120(0.29%)#33 |
| 34. | Pine Hills | 64 | 2,578(2.48%)#14 | 22,120(0.29%)#34 |
| 35. | Union City | 64 | 776(8.25%)#2 | 22,120(0.29%)#35 |
| 36. | Massapequa | 62 | 13,674(0.45%)#4 | 22,120(0.28%)#36 |
| 37. | Rancho Cordova | 61 | 294(20.75%)#2 | 22,120(0.28%)#37 |
| 38. | Brandon | 61 | 61(100.00%)#1 | 22,120(0.28%)#38 |
| 39. | Germantown | 59 | 529(11.15%)#2 | 22,120(0.27%)#39 |
| 40. | Owings Mills | 59 | 529(11.15%)#3 | 22,120(0.27%)#40 |
| 41. | East Orange | 58 | 1,158(5.01%)#2 | 22,120(0.26%)#41 |
| 42. | San Diego | 52 | 294(17.69%)#3 | 22,120(0.24%)#42 |
| 43. | Miami Gardens | 52 | 2,578(2.02%)#15 | 22,120(0.24%)#43 |
| 44. | Troy | 51 | 13,674(0.37%)#5 | 22,120(0.23%)#44 |
| 45. | Elizabeth | 49 | 1,158(4.23%)#3 | 22,120(0.22%)#45 |
| 46. | Greenbelt | 49 | 529(9.26%)#4 | 22,120(0.22%)#46 |
| 47. | Stonecrest | 48 | 776(6.19%)#3 | 22,120(0.22%)#47 |
| 48. | St Petersburg | 47 | 2,578(1.82%)#16 | 22,120(0.21%)#48 |
| 49. | Pocomoke City | 46 | 529(8.70%)#5 | 22,120(0.21%)#49 |
| 50. | Norwalk | 45 | 257(17.51%)#2 | 22,120(0.20%)#50 |
| 51. | Wilkes Barre | 45 | 687(6.55%)#5 | 22,120(0.20%)#51 |
| 52. | Jersey City | 44 | 1,158(3.80%)#4 | 22,120(0.20%)#52 |
| 53. | Oakton | 44 | 377(11.67%)#2 | 22,120(0.20%)#53 |
| 54. | Montverde | 44 | 2,578(1.71%)#17 | 22,120(0.20%)#54 |
| 55. | Freehold Borough | 43 | 1,158(3.71%)#5 | 22,120(0.19%)#55 |
| 56. | Stroudsburg Borough | 42 | 687(6.11%)#6 | 22,120(0.19%)#56 |
| 57. | Security Widefield | 41 | 62(66.13%)#1 | 22,120(0.19%)#57 |
| 58. | Spring Valley | 41 | 13,674(0.30%)#6 | 22,120(0.19%)#58 |
| 59. | Euless | 40 | 385(10.39%)#2 | 22,120(0.18%)#59 |
| 60. | Hackensack | 39 | 1,158(3.37%)#6 | 22,120(0.18%)#60 |
| 61. | Middletown | 39 | 13,674(0.29%)#7 | 22,120(0.18%)#61 |
| 62. | Vero Beach South | 39 | 2,578(1.51%)#18 | 22,120(0.18%)#62 |
| 63. | Clifton Heights Borough | 38 | 687(5.53%)#7 | 22,120(0.17%)#63 |
| 64. | Suffolk | 37 | 377(9.81%)#3 | 22,120(0.17%)#64 |
| 65. | Hampton | 36 | 377(9.55%)#4 | 22,120(0.16%)#65 |
| 66. | Englewood | 35 | 1,158(3.02%)#7 | 22,120(0.16%)#66 |
| 67. | Bon Air | 35 | 377(9.28%)#5 | 22,120(0.16%)#67 |
| 68. | Paterson | 34 | 1,158(2.94%)#8 | 22,120(0.15%)#68 |
| 69. | Fort Washington | 34 | 529(6.43%)#6 | 22,120(0.15%)#69 |
| 70. | Landover | 34 | 529(6.43%)#7 | 22,120(0.15%)#70 |
| 71. | Claymont | 34 | 101(33.66%)#1 | 22,120(0.15%)#71 |
| 72. | Spring Hill | 33 | 2,578(1.28%)#19 | 22,120(0.15%)#72 |
| 73. | Thomasville | 32 | 169(18.93%)#2 | 22,120(0.14%)#73 |
| 74. | Dix Hills | 32 | 13,674(0.23%)#8 | 22,120(0.14%)#74 |
| 75. | Fort Myers | 31 | 2,578(1.20%)#20 | 22,120(0.14%)#75 |
| 76. | Uniondale | 31 | 13,674(0.23%)#9 | 22,120(0.14%)#76 |
| 77. | Waco | 30 | 385(7.79%)#3 | 22,120(0.14%)#77 |
| 78. | Palm Bay | 30 | 2,578(1.16%)#21 | 22,120(0.14%)#78 |
| 79. | North Bellport | 30 | 13,674(0.22%)#10 | 22,120(0.14%)#79 |
| 80. | Yorketown | 30 | 1,158(2.59%)#9 | 22,120(0.14%)#80 |
| 81. | Andrews Afb | 30 | 529(5.67%)#8 | 22,120(0.14%)#81 |
| 82. | Atlanta | 29 | 776(3.74%)#4 | 22,120(0.13%)#82 |
| 83. | Murrieta | 29 | 294(9.86%)#4 | 22,120(0.13%)#83 |
| 84. | Milford Mill | 29 | 529(5.48%)#9 | 22,120(0.13%)#84 |
| 85. | Merrick | 29 | 13,674(0.21%)#11 | 22,120(0.13%)#85 |
| 86. | Belvedere Park | 29 | 776(3.74%)#5 | 22,120(0.13%)#86 |
| 87. | Missouri City | 28 | 385(7.27%)#4 | 22,120(0.13%)#87 |
| 88. | Baywood | 28 | 13,674(0.20%)#12 | 22,120(0.13%)#88 |
| 89. | Tampa | 27 | 2,578(1.05%)#22 | 22,120(0.12%)#89 |
| 90. | Stamford | 27 | 257(10.51%)#3 | 22,120(0.12%)#90 |
| 91. | Waterbury | 27 | 257(10.51%)#4 | 22,120(0.12%)#91 |
| 92. | Shelton | 27 | 257(10.51%)#5 | 22,120(0.12%)#92 |
| 93. | Valley Stream | 27 | 13,674(0.20%)#13 | 22,120(0.12%)#93 |
| 94. | Riviera Beach | 27 | 2,578(1.05%)#23 | 22,120(0.12%)#94 |
| 95. | North Valley Stream | 27 | 13,674(0.20%)#14 | 22,120(0.12%)#95 |
| 96. | Gibsonton | 26 | 2,578(1.01%)#24 | 22,120(0.12%)#96 |
| 97. | Beach Park | 26 | 72(36.11%)#1 | 22,120(0.12%)#97 |
| 98. | Country Walk | 25 | 2,578(0.97%)#25 | 22,120(0.11%)#98 |
| 99. | Charlotte | 24 | 169(14.20%)#3 | 22,120(0.11%)#99 |
| 100. | Orlando | 24 | 2,578(0.93%)#26 | 22,120(0.11%)#100 |
Common Questions
What are the Top 10 Cities with the Most Immigrants from St. Vincent and the Grenadines in the United States?
Top 10 Cities with the Most Immigrants from St. Vincent and the Grenadines in the United States are:
#1
12,527
#2
253
#3
206
#4
177
#5
174
#6
162
#7
155
#8
138
#9
134
#10
132
What city has the Most Immigrants from St. Vincent and the Grenadines in the United States?
New York has the Most Immigrants from St. Vincent and the Grenadines in the United States with 12,527.
What is the Total Immigrants from St. Vincent and the Grenadines in the United States?
Total Immigrants from St. Vincent and the Grenadines in the United States is 22,120.