Cities with the Highest Percentage of Immigrants from Bosnia and Herzegovina in the United States
RELATED REPORTS & OPTIONS
Bosnia and Herzegovina
United States
Compare Cities
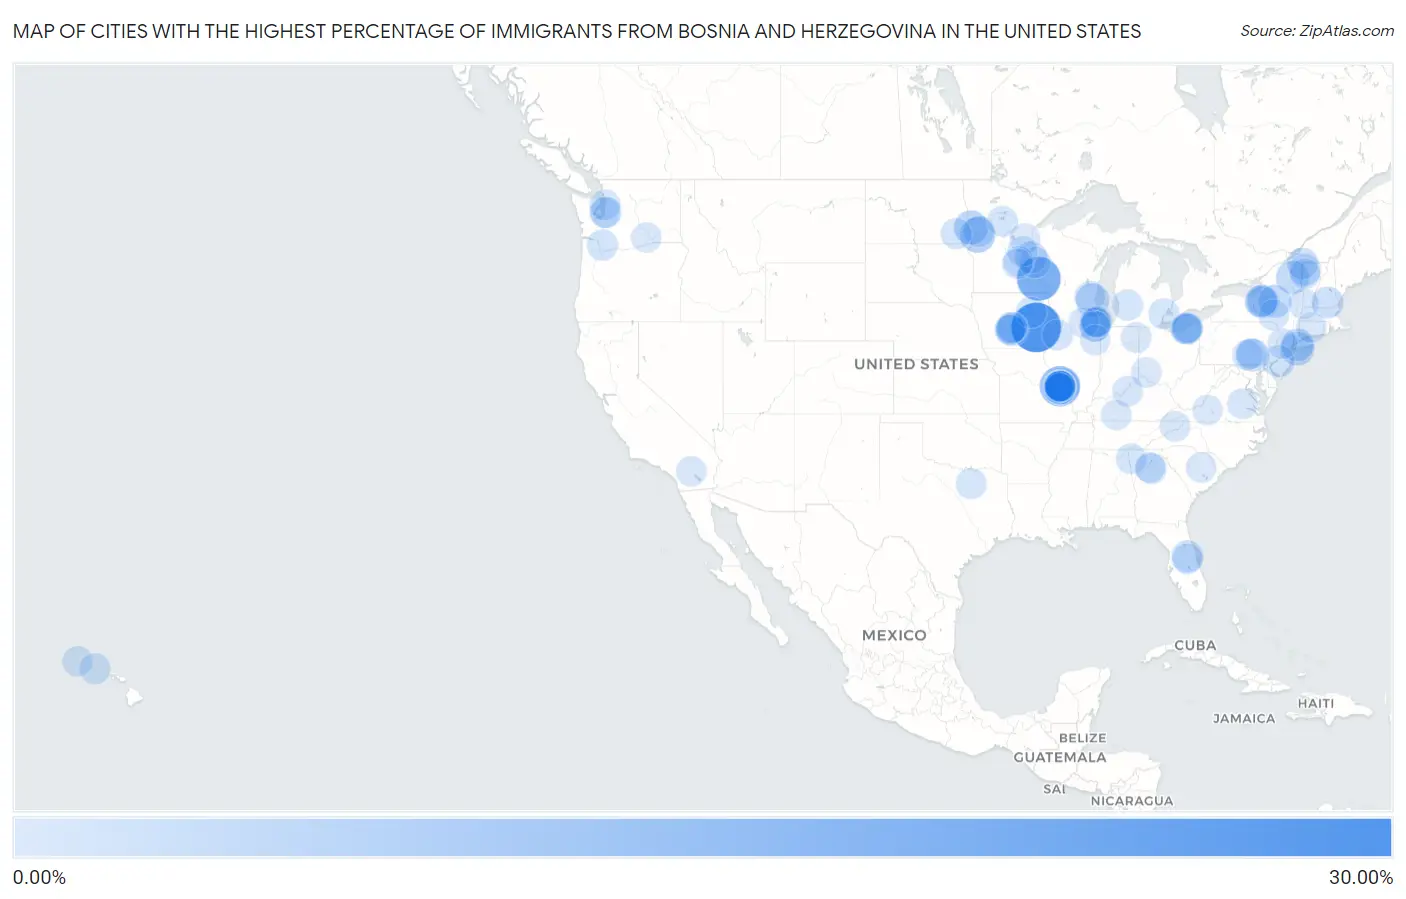
Map of Cities with the Highest Percentage of Immigrants from Bosnia and Herzegovina in the United States
0.00%
30.00%
Cities with the Highest Percentage of Immigrants from Bosnia and Herzegovina in the United States
| City | Bosnia and Herzegovina | vs State | vs National | |
| 1. | Conroy | 29.41% | 0.18%(+29.2)#1 | 0.032%(+29.4)#1 |
| 2. | Minneiska | 20.59% | 0.037%(+20.6)#1 | 0.032%(+20.6)#2 |
| 3. | St George | 15.36% | 0.13%(+15.2)#1 | 0.032%(+15.3)#3 |
| 4. | Bella Villa | 10.65% | 0.13%(+10.5)#2 | 0.032%(+10.6)#4 |
| 5. | Elizabeth | 8.09% | 0.037%(+8.05)#2 | 0.032%(+8.06)#5 |
| 6. | Baker | 6.38% | 0.037%(+6.35)#3 | 0.032%(+6.35)#6 |
| 7. | Mehlville | 6.24% | 0.13%(+6.11)#3 | 0.032%(+6.21)#7 |
| 8. | Lemay | 6.21% | 0.13%(+6.08)#4 | 0.032%(+6.18)#8 |
| 9. | Butler | 5.72% | 0.016%(+5.70)#1 | 0.032%(+5.69)#9 |
| 10. | Island Park | 5.70% | 0.047%(+5.65)#1 | 0.032%(+5.67)#10 |
| 11. | Lake Placid | 5.13% | 0.047%(+5.08)#2 | 0.032%(+5.10)#11 |
| 12. | East Syracuse | 5.06% | 0.047%(+5.01)#3 | 0.032%(+5.02)#12 |
| 13. | Bressler | 4.68% | 0.025%(+4.66)#1 | 0.032%(+4.65)#13 |
| 14. | Albertson | 4.47% | 0.047%(+4.43)#4 | 0.032%(+4.44)#14 |
| 15. | Utica | 4.45% | 0.047%(+4.40)#5 | 0.032%(+4.42)#15 |
| 16. | Affton | 4.28% | 0.13%(+4.14)#5 | 0.032%(+4.24)#16 |
| 17. | Galeville | 3.92% | 0.047%(+3.87)#6 | 0.032%(+3.89)#17 |
| 18. | Lakeshire | 3.59% | 0.13%(+3.45)#6 | 0.032%(+3.55)#18 |
| 19. | Amery | 3.28% | 0.016%(+3.26)#2 | 0.032%(+3.25)#19 |
| 20. | Ellisburg | 3.10% | 0.015%(+3.09)#1 | 0.032%(+3.07)#20 |
| 21. | Lakeline | 3.03% | 0.028%(+3.00)#1 | 0.032%(+3.00)#21 |
| 22. | Milton | 2.91% | 0.13%(+2.77)#1 | 0.032%(+2.88)#22 |
| 23. | Fern Park | 2.89% | 0.040%(+2.85)#1 | 0.032%(+2.86)#23 |
| 24. | Pinardville | 2.87% | 0.077%(+2.79)#1 | 0.032%(+2.83)#24 |
| 25. | Alburgh | 2.71% | 0.13%(+2.57)#2 | 0.032%(+2.68)#25 |
| 26. | Wilbur Park | 2.68% | 0.13%(+2.55)#7 | 0.032%(+2.65)#26 |
| 27. | Windsor Heights | 2.46% | 0.18%(+2.28)#2 | 0.032%(+2.43)#27 |
| 28. | Downing | 2.36% | 0.016%(+2.34)#3 | 0.032%(+2.33)#28 |
| 29. | Arnold | 2.35% | 0.13%(+2.22)#8 | 0.032%(+2.32)#29 |
| 30. | Green Park | 2.19% | 0.13%(+2.06)#9 | 0.032%(+2.16)#30 |
| 31. | Grimes | 2.19% | 0.18%(+2.01)#3 | 0.032%(+2.16)#31 |
| 32. | Pelican Rapids | 2.09% | 0.037%(+2.05)#4 | 0.032%(+2.05)#32 |
| 33. | Kentwood | 1.99% | 0.060%(+1.94)#1 | 0.032%(+1.96)#33 |
| 34. | Amboy | 1.96% | 0.050%(+1.91)#1 | 0.032%(+1.93)#34 |
| 35. | Lincolnwood | 1.94% | 0.084%(+1.85)#1 | 0.032%(+1.90)#35 |
| 36. | Waterloo | 1.90% | 0.18%(+1.72)#4 | 0.032%(+1.87)#36 |
| 37. | Makaha Valley | 1.90% | 0.0068%(+1.89)#1 | 0.032%(+1.87)#37 |
| 38. | Lisbon | 1.76% | 0.057%(+1.70)#1 | 0.032%(+1.73)#38 |
| 39. | Urbandale | 1.73% | 0.18%(+1.55)#5 | 0.032%(+1.70)#39 |
| 40. | Sachse | 1.71% | 0.015%(+1.69)#1 | 0.032%(+1.67)#40 |
| 41. | Tukwila | 1.66% | 0.050%(+1.61)#2 | 0.032%(+1.62)#41 |
| 42. | Oakville | 1.64% | 0.13%(+1.51)#10 | 0.032%(+1.61)#42 |
| 43. | Hamtramck | 1.63% | 0.060%(+1.57)#2 | 0.032%(+1.59)#43 |
| 44. | Rosemont | 1.60% | 0.084%(+1.52)#2 | 0.032%(+1.57)#44 |
| 45. | Carlisle Borough | 1.60% | 0.025%(+1.58)#2 | 0.032%(+1.57)#45 |
| 46. | Unadilla | 1.59% | 0.047%(+1.54)#7 | 0.032%(+1.56)#46 |
| 47. | Cedar Flat | 1.58% | 0.012%(+1.57)#1 | 0.032%(+1.55)#47 |
| 48. | Peaceful Village | 1.57% | 0.13%(+1.44)#11 | 0.032%(+1.54)#48 |
| 49. | Dillsburg Borough | 1.56% | 0.025%(+1.53)#3 | 0.032%(+1.53)#49 |
| 50. | Normandy Park | 1.55% | 0.050%(+1.50)#3 | 0.032%(+1.52)#50 |
| 51. | Roessleville | 1.54% | 0.047%(+1.49)#8 | 0.032%(+1.50)#51 |
| 52. | Esperance | 1.52% | 0.050%(+1.47)#4 | 0.032%(+1.49)#52 |
| 53. | Green Tree Borough | 1.50% | 0.025%(+1.47)#4 | 0.032%(+1.47)#53 |
| 54. | Countryside | 1.44% | 0.084%(+1.35)#3 | 0.032%(+1.41)#54 |
| 55. | Sherrard | 1.44% | 0.084%(+1.35)#4 | 0.032%(+1.40)#55 |
| 56. | Willoughby | 1.37% | 0.028%(+1.34)#2 | 0.032%(+1.34)#56 |
| 57. | Sappington | 1.36% | 0.13%(+1.23)#12 | 0.032%(+1.33)#57 |
| 58. | Whipholt | 1.35% | 0.037%(+1.31)#5 | 0.032%(+1.32)#58 |
| 59. | Lemoyne Borough | 1.35% | 0.025%(+1.33)#5 | 0.032%(+1.32)#59 |
| 60. | Loganville | 1.35% | 0.045%(+1.31)#1 | 0.032%(+1.32)#60 |
| 61. | Summerville | 1.35% | 0.045%(+1.30)#2 | 0.032%(+1.31)#61 |
| 62. | Mentor On The Lake | 1.34% | 0.028%(+1.31)#3 | 0.032%(+1.31)#62 |
| 63. | Niles | 1.32% | 0.084%(+1.24)#5 | 0.032%(+1.29)#63 |
| 64. | Indian Head Park | 1.27% | 0.084%(+1.18)#6 | 0.032%(+1.24)#64 |
| 65. | Johnston | 1.27% | 0.18%(+1.09)#6 | 0.032%(+1.23)#65 |
| 66. | Schlusser | 1.26% | 0.025%(+1.23)#6 | 0.032%(+1.23)#66 |
| 67. | Plantation | 1.24% | 0.069%(+1.17)#1 | 0.032%(+1.20)#67 |
| 68. | Dumbarton | 1.23% | 0.025%(+1.21)#1 | 0.032%(+1.20)#68 |
| 69. | Sycamore | 1.20% | 0.084%(+1.12)#7 | 0.032%(+1.17)#69 |
| 70. | North Bennington | 1.20% | 0.13%(+1.06)#3 | 0.032%(+1.17)#70 |
| 71. | Slinger | 1.19% | 0.016%(+1.17)#4 | 0.032%(+1.16)#71 |
| 72. | Askov | 1.17% | 0.037%(+1.13)#6 | 0.032%(+1.14)#72 |
| 73. | Sky Lake | 1.14% | 0.040%(+1.10)#2 | 0.032%(+1.11)#73 |
| 74. | Waukee | 1.13% | 0.18%(+0.950)#7 | 0.032%(+1.10)#74 |
| 75. | Cherryvale | 1.13% | 0.0080%(+1.12)#1 | 0.032%(+1.09)#75 |
| 76. | La Grange | 1.12% | 0.0010%(+1.12)#1 | 0.032%(+1.09)#76 |
| 77. | Wethersfield | 1.11% | 0.076%(+1.03)#1 | 0.032%(+1.07)#77 |
| 78. | Lyncourt | 1.10% | 0.047%(+1.05)#9 | 0.032%(+1.07)#78 |
| 79. | Sammons Point | 1.09% | 0.084%(+1.00)#8 | 0.032%(+1.05)#79 |
| 80. | Concord | 1.09% | 0.13%(+0.953)#13 | 0.032%(+1.05)#80 |
| 81. | Harris | 1.08% | 0.037%(+1.04)#7 | 0.032%(+1.05)#81 |
| 82. | Robbinsville Center | 1.08% | 0.015%(+1.07)#2 | 0.032%(+1.05)#82 |
| 83. | Mount Holly Springs Borough | 1.08% | 0.025%(+1.05)#7 | 0.032%(+1.04)#83 |
| 84. | Bowling Green | 1.06% | 0.069%(+0.991)#2 | 0.032%(+1.03)#84 |
| 85. | Lawrenceville | 1.03% | 0.045%(+0.983)#3 | 0.032%(+0.995)#85 |
| 86. | Norridge | 1.03% | 0.084%(+0.942)#9 | 0.032%(+0.995)#86 |
| 87. | Grabill | 1.03% | 0.019%(+1.01)#1 | 0.032%(+0.993)#87 |
| 88. | Puhi | 1.01% | 0.0068%(+1.00)#2 | 0.032%(+0.978)#88 |
| 89. | Gilmer Park | 1.00% | 0.019%(+0.981)#2 | 0.032%(+0.968)#89 |
| 90. | Eastlake | 0.99% | 0.028%(+0.959)#4 | 0.032%(+0.955)#90 |
| 91. | Essex Junction | 0.99% | 0.13%(+0.852)#4 | 0.032%(+0.954)#91 |
| 92. | Landen | 0.98% | 0.028%(+0.954)#5 | 0.032%(+0.950)#92 |
| 93. | Central | 0.98% | 0.017%(+0.961)#1 | 0.032%(+0.946)#93 |
| 94. | Cave Spring | 0.95% | 0.025%(+0.928)#2 | 0.032%(+0.921)#94 |
| 95. | Bermuda Dunes | 0.94% | 0.012%(+0.932)#2 | 0.032%(+0.912)#95 |
| 96. | Spring Lake Park | 0.93% | 0.037%(+0.896)#8 | 0.032%(+0.901)#96 |
| 97. | Enola | 0.92% | 0.025%(+0.894)#8 | 0.032%(+0.887)#97 |
| 98. | Budd Lake | 0.91% | 0.015%(+0.896)#3 | 0.032%(+0.879)#98 |
| 99. | Golden Valley | 0.91% | 0.037%(+0.870)#9 | 0.032%(+0.876)#99 |
| 100. | Benton City | 0.89% | 0.050%(+0.836)#5 | 0.032%(+0.854)#100 |
Common Questions
What are the Top 10 Cities with the Highest Percentage of Immigrants from Bosnia and Herzegovina in the United States?
Top 10 Cities with the Highest Percentage of Immigrants from Bosnia and Herzegovina in the United States are:
What city has the Highest Percentage of Immigrants from Bosnia and Herzegovina in the United States?
Conroy has the Highest Percentage of Immigrants from Bosnia and Herzegovina in the United States with 29.41%.
What is the Percentage of Immigrants from Bosnia and Herzegovina in the United States?
Percentage of Immigrants from Bosnia and Herzegovina in the United States is 0.032%.