Cities with the Most Immigrants from Canada in the United States
RELATED REPORTS & OPTIONS
Canada
United States
Compare Cities
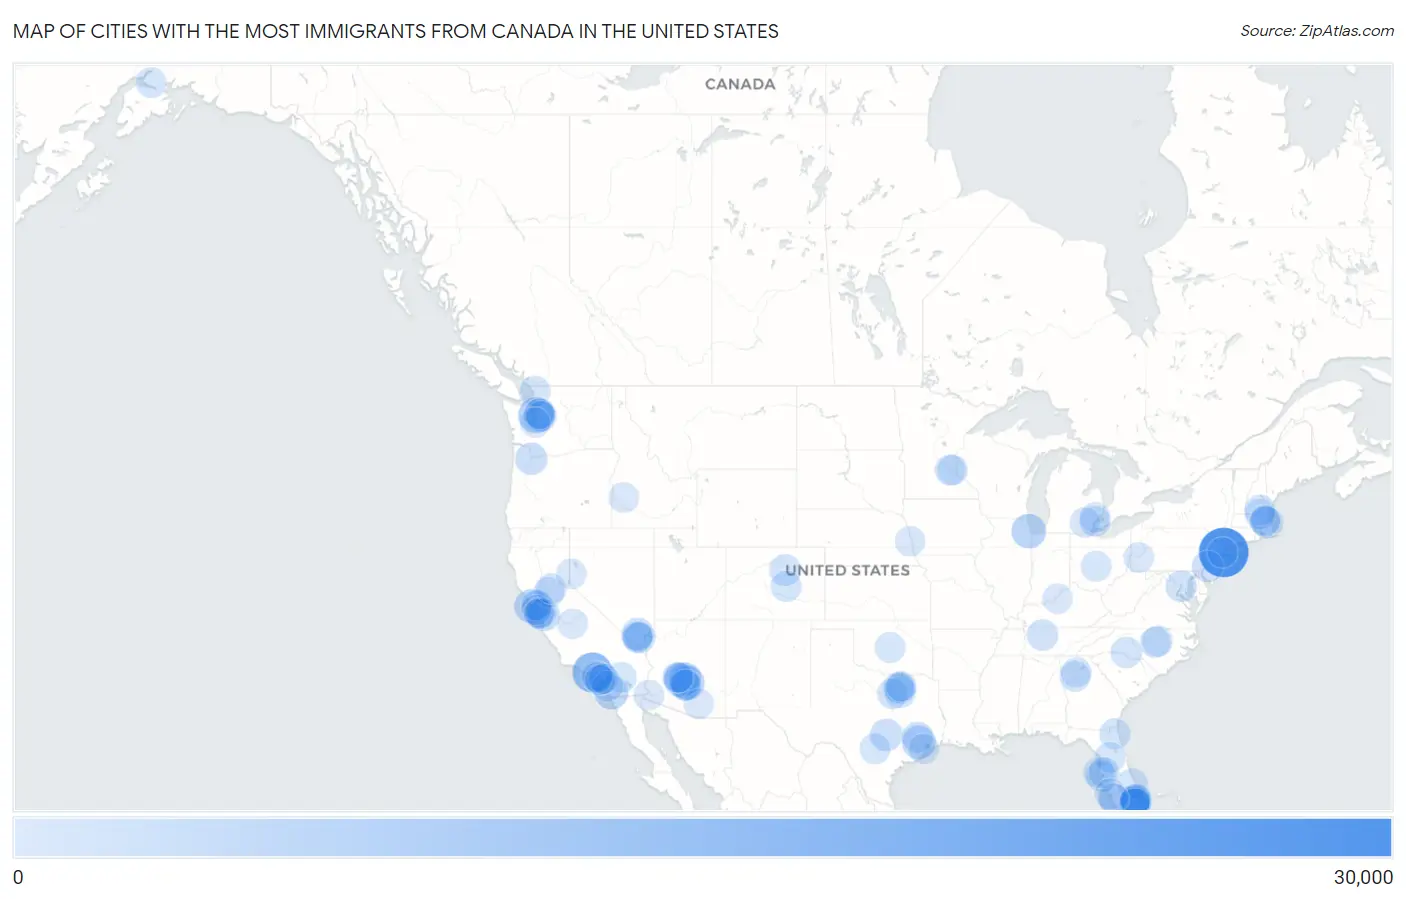
Map of Cities with the Most Immigrants from Canada in the United States
0
30,000
Cities with the Most Immigrants from Canada in the United States
| City | Canada | vs State | vs National | |
| 1. | New York | 26,201 | 59,107(44.33%)#1 | 821,792(3.19%)#1 |
| 2. | Los Angeles | 13,423 | 127,477(10.53%)#1 | 821,792(1.63%)#2 |
| 3. | Seattle | 8,050 | 47,238(17.04%)#1 | 821,792(0.98%)#3 |
| 4. | Chicago | 6,114 | 19,306(31.67%)#1 | 821,792(0.74%)#4 |
| 5. | Phoenix | 5,694 | 40,102(14.20%)#1 | 821,792(0.69%)#5 |
| 6. | Mesa | 5,628 | 40,102(14.03%)#2 | 821,792(0.68%)#6 |
| 7. | San Francisco | 5,354 | 127,477(4.20%)#2 | 821,792(0.65%)#7 |
| 8. | San Diego | 5,175 | 127,477(4.06%)#3 | 821,792(0.63%)#8 |
| 9. | Houston | 5,042 | 55,371(9.11%)#1 | 821,792(0.61%)#9 |
| 10. | Scottsdale | 3,749 | 40,102(9.35%)#3 | 821,792(0.46%)#10 |
| 11. | San Jose | 3,299 | 127,477(2.59%)#4 | 821,792(0.40%)#11 |
| 12. | Austin | 3,247 | 55,371(5.86%)#2 | 821,792(0.40%)#12 |
| 13. | Portland | 3,065 | 15,229(20.13%)#1 | 821,792(0.37%)#13 |
| 14. | Boston | 2,584 | 28,158(9.18%)#1 | 821,792(0.31%)#14 |
| 15. | Las Vegas | 2,552 | 11,407(22.37%)#1 | 821,792(0.31%)#15 |
| 16. | Philadelphia | 2,244 | 17,032(13.18%)#1 | 821,792(0.27%)#16 |
| 17. | Denver | 2,238 | 15,026(14.89%)#1 | 821,792(0.27%)#17 |
| 18. | Nashville | 2,099 | 10,295(20.39%)#1 | 821,792(0.26%)#18 |
| 19. | Washington | 2,077 | 2,077(100.00%)#1 | 821,792(0.25%)#19 |
| 20. | The Woodlands | 1,995 | 55,371(3.60%)#3 | 821,792(0.24%)#20 |
| 21. | Bellevue | 1,968 | 47,238(4.17%)#2 | 821,792(0.24%)#21 |
| 22. | Irvine | 1,949 | 127,477(1.53%)#5 | 821,792(0.24%)#22 |
| 23. | Charlotte | 1,937 | 18,105(10.70%)#1 | 821,792(0.24%)#23 |
| 24. | Dallas | 1,847 | 55,371(3.34%)#4 | 821,792(0.22%)#24 |
| 25. | Gilbert | 1,785 | 40,102(4.45%)#4 | 821,792(0.22%)#25 |
| 26. | Fort Lauderdale | 1,737 | 109,132(1.59%)#1 | 821,792(0.21%)#26 |
| 27. | St Petersburg | 1,689 | 109,132(1.55%)#2 | 821,792(0.21%)#27 |
| 28. | Chandler | 1,682 | 40,102(4.19%)#5 | 821,792(0.20%)#28 |
| 29. | Henderson | 1,680 | 11,407(14.73%)#2 | 821,792(0.20%)#29 |
| 30. | Colorado Springs | 1,625 | 15,026(10.81%)#2 | 821,792(0.20%)#30 |
| 31. | Jacksonville | 1,532 | 109,132(1.40%)#3 | 821,792(0.19%)#31 |
| 32. | Clearwater | 1,464 | 109,132(1.34%)#4 | 821,792(0.18%)#32 |
| 33. | Plano | 1,446 | 55,371(2.61%)#5 | 821,792(0.18%)#33 |
| 34. | Pompano Beach | 1,445 | 109,132(1.32%)#5 | 821,792(0.18%)#34 |
| 35. | Deerfield Beach | 1,425 | 109,132(1.31%)#6 | 821,792(0.17%)#35 |
| 36. | Oakland | 1,414 | 127,477(1.11%)#6 | 821,792(0.17%)#36 |
| 37. | Atlanta | 1,361 | 17,851(7.62%)#1 | 821,792(0.17%)#37 |
| 38. | The Villages | 1,358 | 109,132(1.24%)#7 | 821,792(0.17%)#38 |
| 39. | Frisco | 1,354 | 55,371(2.45%)#6 | 821,792(0.16%)#39 |
| 40. | Bellingham | 1,324 | 47,238(2.80%)#3 | 821,792(0.16%)#40 |
| 41. | Sunnyvale | 1,321 | 127,477(1.04%)#7 | 821,792(0.16%)#41 |
| 42. | Oklahoma City | 1,318 | 4,771(27.63%)#1 | 821,792(0.16%)#42 |
| 43. | Columbus | 1,311 | 14,988(8.75%)#1 | 821,792(0.16%)#43 |
| 44. | Anchorage | 1,308 | 2,924(44.73%)#1 | 821,792(0.16%)#44 |
| 45. | San Antonio | 1,301 | 55,371(2.35%)#7 | 821,792(0.16%)#45 |
| 46. | Palm Desert | 1,274 | 127,477(1.00%)#8 | 821,792(0.16%)#46 |
| 47. | Long Beach | 1,271 | 127,477(1.00%)#9 | 821,792(0.15%)#47 |
| 48. | Port St Lucie | 1,264 | 109,132(1.16%)#8 | 821,792(0.15%)#48 |
| 49. | Cary | 1,215 | 18,105(6.71%)#2 | 821,792(0.15%)#49 |
| 50. | Oceanside | 1,200 | 127,477(0.94%)#10 | 821,792(0.15%)#50 |
| 51. | Kirkland | 1,191 | 47,238(2.52%)#4 | 821,792(0.14%)#51 |
| 52. | Davie | 1,173 | 109,132(1.07%)#9 | 821,792(0.14%)#52 |
| 53. | Boca Raton | 1,170 | 109,132(1.07%)#10 | 821,792(0.14%)#53 |
| 54. | Hollywood | 1,168 | 109,132(1.07%)#11 | 821,792(0.14%)#54 |
| 55. | Minneapolis | 1,141 | 11,939(9.56%)#1 | 821,792(0.14%)#55 |
| 56. | Jersey City | 1,141 | 18,317(6.23%)#1 | 821,792(0.14%)#56 |
| 57. | Fort Worth | 1,134 | 55,371(2.05%)#8 | 821,792(0.14%)#57 |
| 58. | Tampa | 1,130 | 109,132(1.04%)#12 | 821,792(0.14%)#58 |
| 59. | Detroit | 1,126 | 35,052(3.21%)#1 | 821,792(0.14%)#59 |
| 60. | Redmond | 1,120 | 47,238(2.37%)#5 | 821,792(0.14%)#60 |
| 61. | Manchester | 1,096 | 7,618(14.39%)#1 | 821,792(0.13%)#61 |
| 62. | Raleigh | 1,086 | 18,105(6.00%)#3 | 821,792(0.13%)#62 |
| 63. | Boise City | 1,076 | 5,503(19.55%)#1 | 821,792(0.13%)#63 |
| 64. | Cape Coral | 1,061 | 109,132(0.97%)#13 | 821,792(0.13%)#64 |
| 65. | Huntington Beach | 1,048 | 127,477(0.82%)#11 | 821,792(0.13%)#65 |
| 66. | Surprise | 1,042 | 40,102(2.60%)#6 | 821,792(0.13%)#66 |
| 67. | Sammamish | 1,037 | 47,238(2.20%)#6 | 821,792(0.13%)#67 |
| 68. | Mckinney | 1,034 | 55,371(1.87%)#9 | 821,792(0.13%)#68 |
| 69. | League City | 1,023 | 55,371(1.85%)#10 | 821,792(0.12%)#69 |
| 70. | Berkeley | 1,022 | 127,477(0.80%)#12 | 821,792(0.12%)#70 |
| 71. | Pembroke Pines | 1,009 | 109,132(0.92%)#14 | 821,792(0.12%)#71 |
| 72. | Nashua | 1,005 | 7,618(13.19%)#2 | 821,792(0.12%)#72 |
| 73. | Spring Valley | 990 | 11,407(8.68%)#3 | 821,792(0.12%)#73 |
| 74. | Sacramento | 975 | 127,477(0.76%)#13 | 821,792(0.12%)#74 |
| 75. | Somerville | 958 | 28,158(3.40%)#2 | 821,792(0.12%)#75 |
| 76. | Enterprise | 957 | 11,407(8.39%)#4 | 821,792(0.12%)#76 |
| 77. | Newport Beach | 953 | 127,477(0.75%)#14 | 821,792(0.12%)#77 |
| 78. | Tucson | 939 | 40,102(2.34%)#7 | 821,792(0.11%)#78 |
| 79. | Sterling Heights | 927 | 35,052(2.64%)#2 | 821,792(0.11%)#79 |
| 80. | Cambridge | 920 | 28,158(3.27%)#3 | 821,792(0.11%)#80 |
| 81. | Mountain View | 920 | 127,477(0.72%)#15 | 821,792(0.11%)#81 |
| 82. | Reno | 918 | 11,407(8.05%)#5 | 821,792(0.11%)#82 |
| 83. | Peoria | 915 | 40,102(2.28%)#8 | 821,792(0.11%)#83 |
| 84. | Coral Springs | 912 | 109,132(0.84%)#15 | 821,792(0.11%)#84 |
| 85. | Pittsburgh | 909 | 17,032(5.34%)#2 | 821,792(0.11%)#85 |
| 86. | Louisville | 907 | 4,303(21.08%)#1 | 821,792(0.11%)#86 |
| 87. | Estero | 906 | 109,132(0.83%)#16 | 821,792(0.11%)#87 |
| 88. | Omaha | 894 | 1,995(44.81%)#1 | 821,792(0.11%)#88 |
| 89. | Tacoma | 889 | 47,238(1.88%)#7 | 821,792(0.11%)#89 |
| 90. | Ann Arbor | 888 | 35,052(2.53%)#3 | 821,792(0.11%)#90 |
| 91. | St Paul | 882 | 11,939(7.39%)#2 | 821,792(0.11%)#91 |
| 92. | Lauderdale Lakes | 851 | 109,132(0.78%)#17 | 821,792(0.10%)#92 |
| 93. | San Mateo | 833 | 127,477(0.65%)#16 | 821,792(0.10%)#93 |
| 94. | Palo Alto | 830 | 127,477(0.65%)#17 | 821,792(0.10%)#94 |
| 95. | Fresno | 828 | 127,477(0.65%)#18 | 821,792(0.10%)#95 |
| 96. | Roseville | 823 | 127,477(0.65%)#19 | 821,792(0.10%)#96 |
| 97. | Roswell | 823 | 17,851(4.61%)#2 | 821,792(0.10%)#97 |
| 98. | Bonita Springs | 818 | 109,132(0.75%)#18 | 821,792(0.10%)#98 |
| 99. | Rancho Santa Margarita | 817 | 127,477(0.64%)#20 | 821,792(0.10%)#99 |
| 100. | Fortuna Foothills | 814 | 40,102(2.03%)#9 | 821,792(0.10%)#100 |
Common Questions
What are the Top 10 Cities with the Most Immigrants from Canada in the United States?
Top 10 Cities with the Most Immigrants from Canada in the United States are:
What city has the Most Immigrants from Canada in the United States?
New York has the Most Immigrants from Canada in the United States with 26,201.
What is the Total Immigrants from Canada in the United States?
Total Immigrants from Canada in the United States is 821,792.