Horry County, SC Map & Demographics
Horry County Map
Horry County Overview
$34,147
PER CAPITA INCOME
$72,285
AVG FAMILY INCOME
$59,880
AVG HOUSEHOLD INCOME
19.8%
WAGE / INCOME GAP [ % ]
80.2¢/ $1
WAGE / INCOME GAP [ $ ]
$10,463
FAMILY INCOME DEFICIT
0.45
INEQUALITY / GINI INDEX
356,578
TOTAL POPULATION
173,106
MALE POPULATION
183,472
FEMALE POPULATION
94.35
MALES / 100 FEMALES
105.99
FEMALES / 100 MALES
47.6
MEDIAN AGE
3.0
AVG FAMILY SIZE
2.5
AVG HOUSEHOLD SIZE
164,084
LABOR FORCE [ PEOPLE ]
54.3%
PERCENT IN LABOR FORCE
5.6%
UNEMPLOYMENT RATE
Horry County Area Codes
Income in Horry County
Income Overview in Horry County
Per Capita Income in Horry County is $34,147, while median incomes of families and households are $72,285 and $59,880 respectively.
| Characteristic | Number | Measure |
| Per Capita Income | 356,578 | $34,147 |
| Median Family Income | 91,596 | $72,285 |
| Mean Family Income | 91,596 | $92,930 |
| Median Household Income | 142,383 | $59,880 |
| Mean Household Income | 142,383 | $80,054 |
| Income Deficit | 91,596 | $10,463 |
| Wage / Income Gap (%) | 356,578 | 19.79% |
| Wage / Income Gap ($) | 356,578 | 80.21¢ per $1 |
| Gini / Inequality Index | 356,578 | 0.45 |
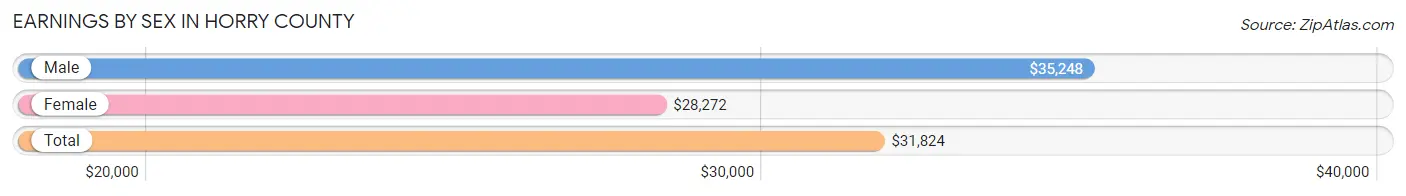
Earnings by Sex in Horry County
Average Earnings in Horry County are $31,824, $35,248 for men and $28,272 for women, a difference of 19.8%.
| Sex | Number | Average Earnings |
| Male | 88,289 (51.2%) | $35,248 |
| Female | 84,158 (48.8%) | $28,272 |
| Total | 172,447 (100.0%) | $31,824 |
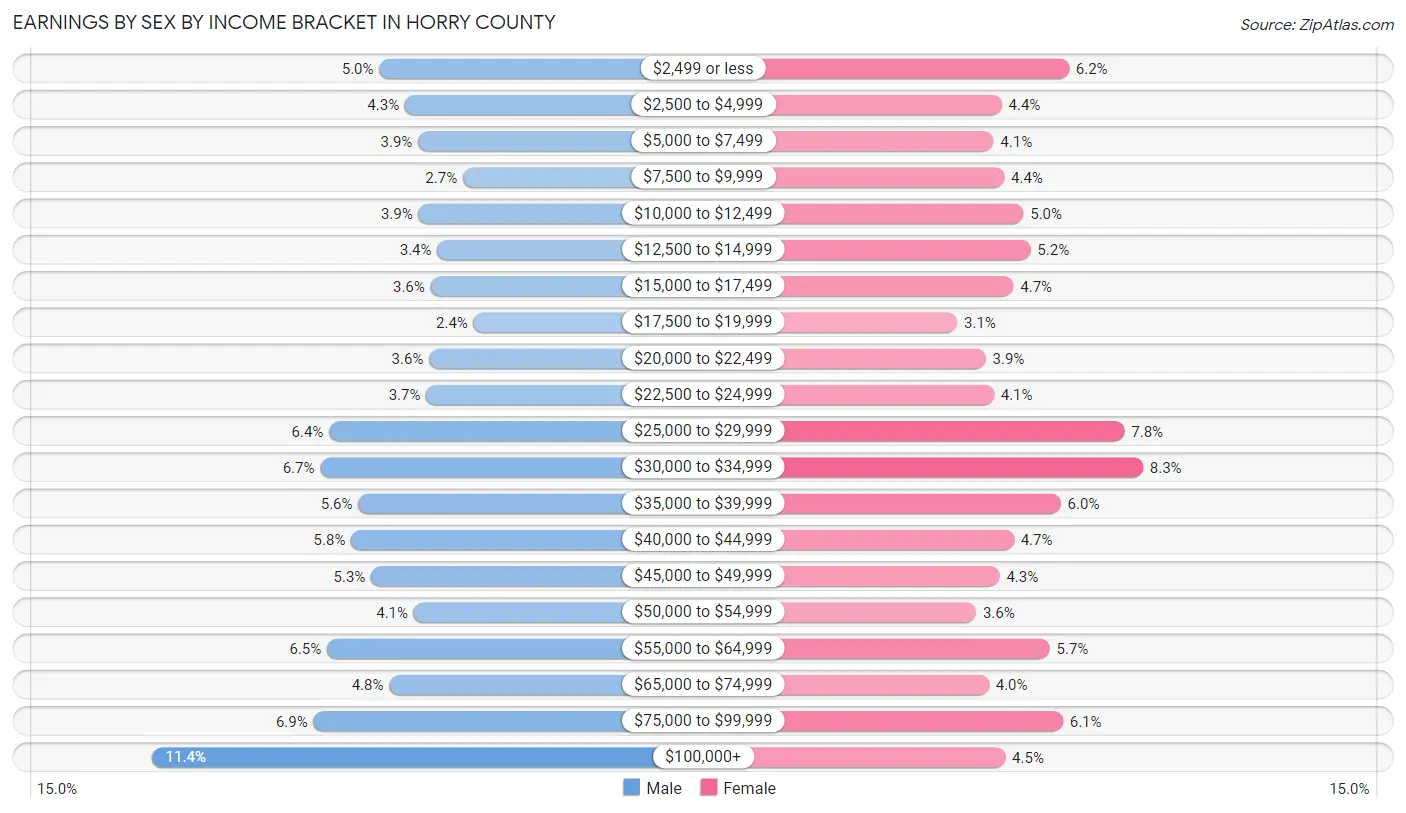
Earnings by Sex by Income Bracket in Horry County
The most common earnings brackets in Horry County are $100,000+ for men (10,064 | 11.4%) and $30,000 to $34,999 for women (7,005 | 8.3%).
| Income | Male | Female |
| $2,499 or less | 4,439 (5.0%) | 5,251 (6.2%) |
| $2,500 to $4,999 | 3,803 (4.3%) | 3,659 (4.3%) |
| $5,000 to $7,499 | 3,481 (3.9%) | 3,468 (4.1%) |
| $7,500 to $9,999 | 2,363 (2.7%) | 3,723 (4.4%) |
| $10,000 to $12,499 | 3,470 (3.9%) | 4,173 (5.0%) |
| $12,500 to $14,999 | 3,003 (3.4%) | 4,339 (5.2%) |
| $15,000 to $17,499 | 3,167 (3.6%) | 3,937 (4.7%) |
| $17,500 to $19,999 | 2,099 (2.4%) | 2,612 (3.1%) |
| $20,000 to $22,499 | 3,205 (3.6%) | 3,278 (3.9%) |
| $22,500 to $24,999 | 3,276 (3.7%) | 3,477 (4.1%) |
| $25,000 to $29,999 | 5,684 (6.4%) | 6,567 (7.8%) |
| $30,000 to $34,999 | 5,904 (6.7%) | 7,005 (8.3%) |
| $35,000 to $39,999 | 4,959 (5.6%) | 5,058 (6.0%) |
| $40,000 to $44,999 | 5,139 (5.8%) | 3,943 (4.7%) |
| $45,000 to $49,999 | 4,643 (5.3%) | 3,611 (4.3%) |
| $50,000 to $54,999 | 3,587 (4.1%) | 3,051 (3.6%) |
| $55,000 to $64,999 | 5,736 (6.5%) | 4,794 (5.7%) |
| $65,000 to $74,999 | 4,196 (4.8%) | 3,360 (4.0%) |
| $75,000 to $99,999 | 6,071 (6.9%) | 5,108 (6.1%) |
| $100,000+ | 10,064 (11.4%) | 3,744 (4.4%) |
| Total | 88,289 (100.0%) | 84,158 (100.0%) |
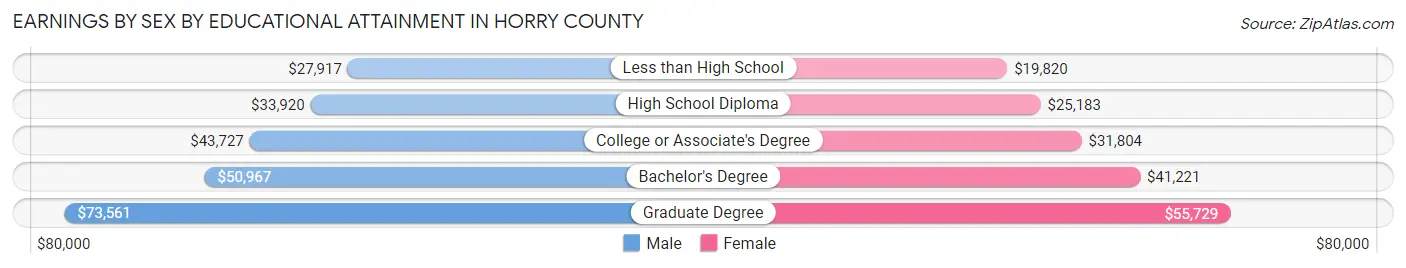
Earnings by Sex by Educational Attainment in Horry County
Average earnings in Horry County are $40,649 for men and $32,084 for women, a difference of 21.1%. Men with an educational attainment of graduate degree enjoy the highest average annual earnings of $73,561, while those with less than high school education earn the least with $27,917. Women with an educational attainment of graduate degree earn the most with the average annual earnings of $55,729, while those with less than high school education have the smallest earnings of $19,820.
| Educational Attainment | Male Income | Female Income |
| Less than High School | $27,917 | $19,820 |
| High School Diploma | $33,920 | $25,183 |
| College or Associate's Degree | $43,727 | $31,804 |
| Bachelor's Degree | $50,967 | $41,221 |
| Graduate Degree | $73,561 | $55,729 |
| Total | $40,649 | $32,084 |
Family Income in Horry County
Family Income Brackets in Horry County
According to the Horry County family income data, there are 18,136 families falling into the $50,000 to $74,999 income range, which is the most common income bracket and makes up 19.8% of all families. Conversely, the $10,000 to $14,999 income bracket is the least frequent group with only 1,924 families (2.1%) belonging to this category.
| Income Bracket | # Families | % Families |
| Less than $10,000 | 2,931 | 3.2% |
| $10,000 to $14,999 | 1,924 | 2.1% |
| $15,000 to $24,999 | 5,038 | 5.5% |
| $25,000 to $34,999 | 7,511 | 8.2% |
| $35,000 to $49,999 | 12,274 | 13.4% |
| $50,000 to $74,999 | 18,136 | 19.8% |
| $75,000 to $99,999 | 14,839 | 16.2% |
| $100,000 to $149,999 | 16,487 | 18.0% |
| $150,000 to $199,999 | 6,229 | 6.8% |
| $200,000+ | 6,320 | 6.9% |
Family Income by Famaliy Size in Horry County
7+ person families (469 | 0.5%) account for the highest median family income in Horry County with $159,539 per family, while 2-person families (55,343 | 60.4%) have the highest median income of $33,735 per family member.
| Income Bracket | # Families | Median Income |
| 2-Person Families | 55,343 (60.4%) | $67,470 |
| 3-Person Families | 17,428 (19.0%) | $78,835 |
| 4-Person Families | 12,512 (13.7%) | $80,215 |
| 5-Person Families | 4,771 (5.2%) | $91,691 |
| 6-Person Families | 1,073 (1.2%) | $82,344 |
| 7+ Person Families | 469 (0.5%) | $159,539 |
| Total | 91,596 (100.0%) | $72,285 |
Family Income by Number of Earners in Horry County
The median family income in Horry County is $72,285, with families comprising 3+ earners (7,338) having the highest median family income of $116,871, while families with 1 earner (30,521) have the lowest median family income of $55,144, accounting for 8.0% and 33.3% of families, respectively.
| Number of Earners | # Families | Median Income |
| No Earners | 24,891 (27.2%) | $56,902 |
| 1 Earner | 30,521 (33.3%) | $55,144 |
| 2 Earners | 28,846 (31.5%) | $92,405 |
| 3+ Earners | 7,338 (8.0%) | $116,871 |
| Total | 91,596 (100.0%) | $72,285 |
Household Income in Horry County
Household Income Brackets in Horry County
With 28,477 households falling in the category, the $50,000 to $74,999 income range is the most frequent in Horry County, accounting for 20.0% of all households. In contrast, only 5,268 households (3.7%) fall into the $10,000 to $14,999 income bracket, making it the least populous group.
| Income Bracket | # Households | % Households |
| Less than $10,000 | 7,404 | 5.2% |
| $10,000 to $14,999 | 5,268 | 3.7% |
| $15,000 to $24,999 | 11,675 | 8.2% |
| $25,000 to $34,999 | 14,381 | 10.1% |
| $35,000 to $49,999 | 20,361 | 14.3% |
| $50,000 to $74,999 | 28,477 | 20.0% |
| $75,000 to $99,999 | 19,506 | 13.7% |
| $100,000 to $149,999 | 20,503 | 14.4% |
| $150,000 to $199,999 | 7,546 | 5.3% |
| $200,000+ | 7,546 | 5.3% |
Household Income by Householder Age in Horry County
The median household income in Horry County is $59,880, with the highest median household income of $65,169 found in the 25 to 44 years age bracket for the primary householder. A total of 33,176 households (23.3%) fall into this category. Meanwhile, the 15 to 24 years age bracket for the primary householder has the lowest median household income of $44,651, with 2,612 households (1.8%) in this group.
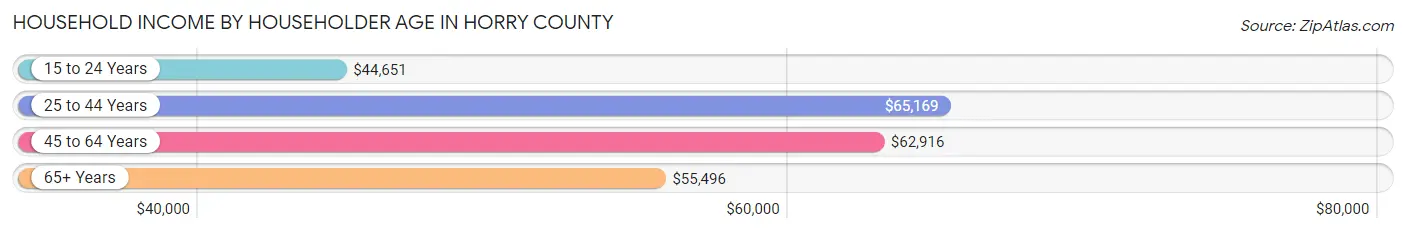
| Income Bracket | # Households | Median Income |
| 15 to 24 Years | 2,612 (1.8%) | $44,651 |
| 25 to 44 Years | 33,176 (23.3%) | $65,169 |
| 45 to 64 Years | 52,911 (37.2%) | $62,916 |
| 65+ Years | 53,684 (37.7%) | $55,496 |
| Total | 142,383 (100.0%) | $59,880 |
Poverty in Horry County
Income Below Poverty by Sex and Age in Horry County
With 11.8% poverty level for males and 14.3% for females among the residents of Horry County, 6 to 11 year old males and 12 to 14 year old females are the most vulnerable to poverty, with 2,802 males (26.3%) and 1,296 females (24.2%) in their respective age groups living below the poverty level.
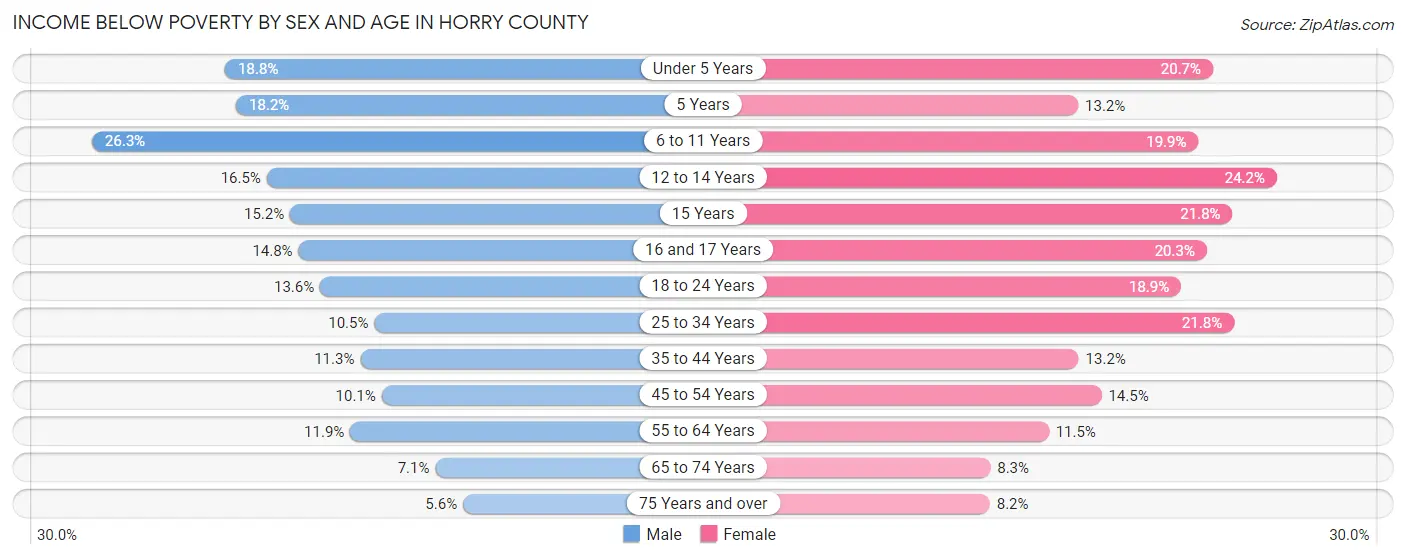
| Age Bracket | Male | Female |
| Under 5 Years | 1,453 (18.8%) | 1,504 (20.7%) |
| 5 Years | 247 (18.2%) | 213 (13.2%) |
| 6 to 11 Years | 2,802 (26.3%) | 1,985 (19.9%) |
| 12 to 14 Years | 914 (16.5%) | 1,296 (24.2%) |
| 15 Years | 308 (15.2%) | 392 (21.7%) |
| 16 and 17 Years | 549 (14.7%) | 715 (20.3%) |
| 18 to 24 Years | 1,660 (13.6%) | 2,310 (18.9%) |
| 25 to 34 Years | 2,006 (10.5%) | 4,319 (21.8%) |
| 35 to 44 Years | 2,118 (11.3%) | 2,571 (13.2%) |
| 45 to 54 Years | 2,092 (10.1%) | 3,182 (14.5%) |
| 55 to 64 Years | 3,090 (11.9%) | 3,493 (11.5%) |
| 65 to 74 Years | 2,007 (7.1%) | 2,530 (8.3%) |
| 75 Years and over | 782 (5.6%) | 1,344 (8.2%) |
| Total | 20,028 (11.8%) | 25,854 (14.3%) |
Income Above Poverty by Sex and Age in Horry County
According to the poverty statistics in Horry County, males aged 75 years and over and females aged 75 years and over are the age groups that are most secure financially, with 94.4% of males and 91.8% of females in these age groups living above the poverty line.
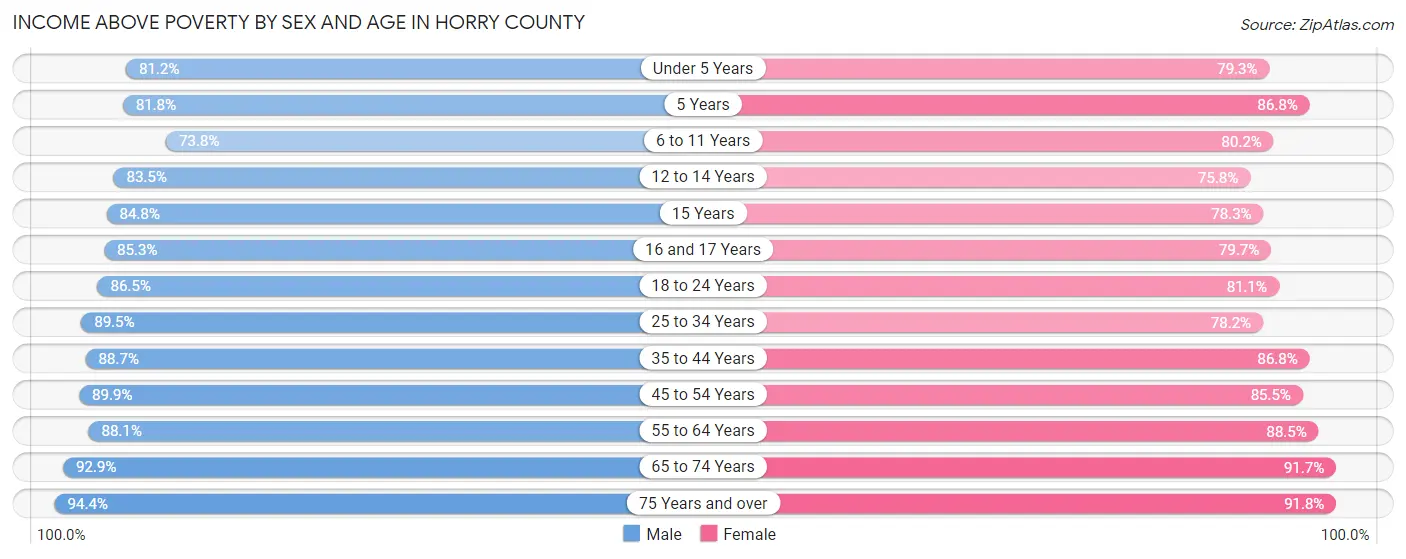
| Age Bracket | Male | Female |
| Under 5 Years | 6,261 (81.2%) | 5,775 (79.3%) |
| 5 Years | 1,108 (81.8%) | 1,405 (86.8%) |
| 6 to 11 Years | 7,872 (73.8%) | 8,015 (80.1%) |
| 12 to 14 Years | 4,618 (83.5%) | 4,054 (75.8%) |
| 15 Years | 1,716 (84.8%) | 1,410 (78.2%) |
| 16 and 17 Years | 3,172 (85.3%) | 2,803 (79.7%) |
| 18 to 24 Years | 10,590 (86.5%) | 9,917 (81.1%) |
| 25 to 34 Years | 17,052 (89.5%) | 15,456 (78.2%) |
| 35 to 44 Years | 16,608 (88.7%) | 16,927 (86.8%) |
| 45 to 54 Years | 18,575 (89.9%) | 18,816 (85.5%) |
| 55 to 64 Years | 22,947 (88.1%) | 26,836 (88.5%) |
| 65 to 74 Years | 26,142 (92.9%) | 28,066 (91.7%) |
| 75 Years and over | 13,212 (94.4%) | 14,963 (91.8%) |
| Total | 149,873 (88.2%) | 154,443 (85.7%) |
Income Below Poverty Among Married-Couple Families in Horry County
The poverty statistics for married-couple families in Horry County show that 4.4% or 3,026 of the total 69,350 families live below the poverty line. Families with 3 or 4 children have the highest poverty rate of 11.8%, comprising of 310 families. On the other hand, families with 5 or more children have the lowest poverty rate of 3.4%, which includes 6 families.
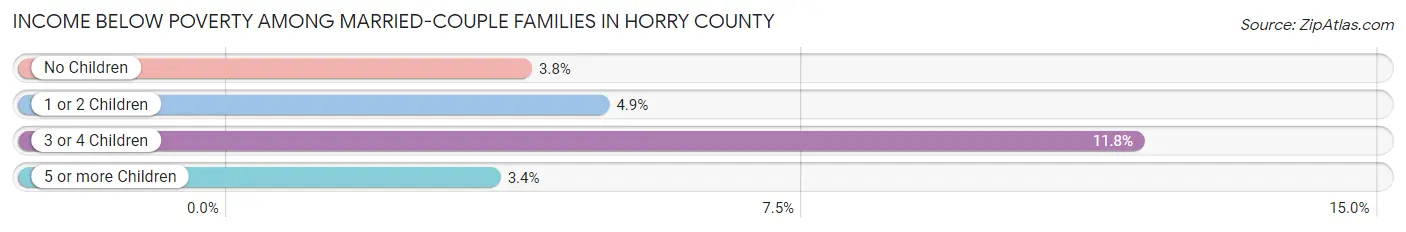
| Children | Above Poverty | Below Poverty |
| No Children | 49,221 (96.2%) | 1,965 (3.8%) |
| 1 or 2 Children | 14,626 (95.2%) | 745 (4.9%) |
| 3 or 4 Children | 2,308 (88.2%) | 310 (11.8%) |
| 5 or more Children | 169 (96.6%) | 6 (3.4%) |
| Total | 66,324 (95.6%) | 3,026 (4.4%) |
Income Below Poverty Among Single-Parent Households in Horry County
According to the poverty data in Horry County, 10.7% or 599 single-father households and 26.1% or 4,355 single-mother households are living below the poverty line. Among single-father households, those with 1 or 2 children have the highest poverty rate, with 281 households (11.1%) experiencing poverty. Likewise, among single-mother households, those with 3 or 4 children have the highest poverty rate, with 1,198 households (59.5%) falling below the poverty line.
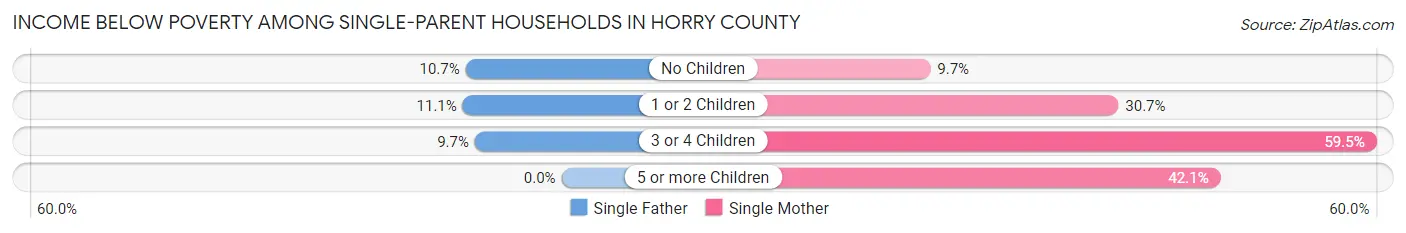
| Children | Single Father | Single Mother |
| No Children | 258 (10.7%) | 622 (9.7%) |
| 1 or 2 Children | 281 (11.1%) | 2,511 (30.7%) |
| 3 or 4 Children | 60 (9.7%) | 1,198 (59.5%) |
| 5 or more Children | 0 (0.0%) | 24 (42.1%) |
| Total | 599 (10.7%) | 4,355 (26.1%) |
Income Below Poverty Among Married-Couple vs Single-Parent Households in Horry County
The poverty data for Horry County shows that 3,026 of the married-couple family households (4.4%) and 4,954 of the single-parent households (22.3%) are living below the poverty level. Within the married-couple family households, those with 3 or 4 children have the highest poverty rate, with 310 households (11.8%) falling below the poverty line. Among the single-parent households, those with 3 or 4 children have the highest poverty rate, with 1,258 household (47.8%) living below poverty.
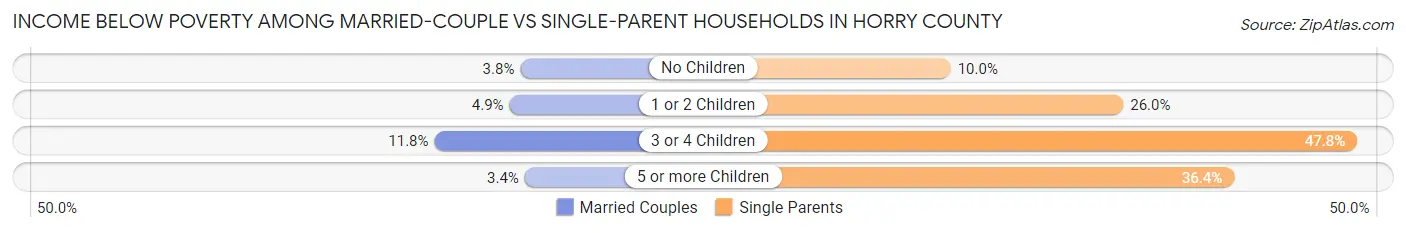
| Children | Married-Couple Families | Single-Parent Households |
| No Children | 1,965 (3.8%) | 880 (10.0%) |
| 1 or 2 Children | 745 (4.9%) | 2,792 (26.0%) |
| 3 or 4 Children | 310 (11.8%) | 1,258 (47.8%) |
| 5 or more Children | 6 (3.4%) | 24 (36.4%) |
| Total | 3,026 (4.4%) | 4,954 (22.3%) |
Race in Horry County
The most populous races in Horry County are White / Caucasian (282,022 | 79.1%), Black / African American (44,046 | 12.3%), and Hispanic or Latino (22,350 | 6.3%).
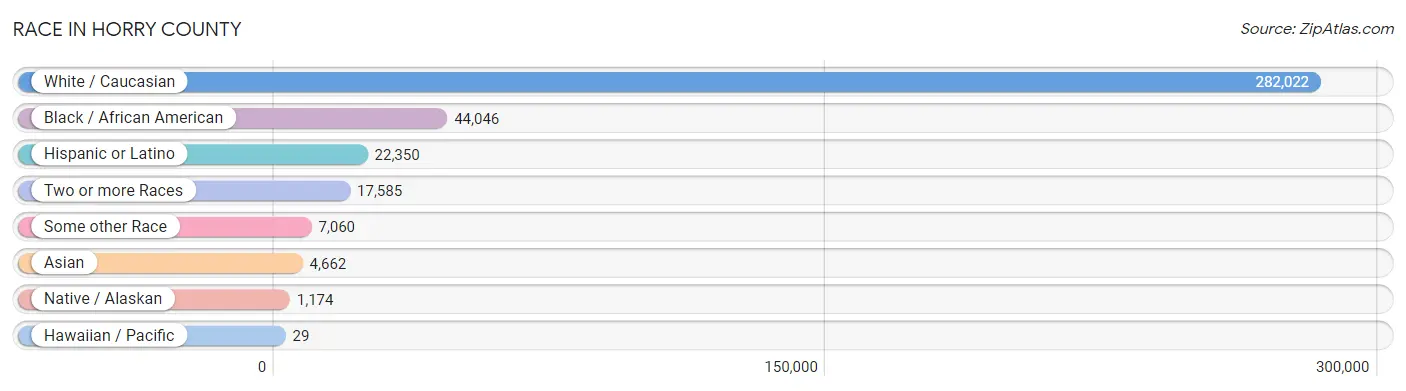
| Race | # Population | % Population |
| Asian | 4,662 | 1.3% |
| Black / African American | 44,046 | 12.3% |
| Hawaiian / Pacific | 29 | 0.0% |
| Hispanic or Latino | 22,350 | 6.3% |
| Native / Alaskan | 1,174 | 0.3% |
| White / Caucasian | 282,022 | 79.1% |
| Two or more Races | 17,585 | 4.9% |
| Some other Race | 7,060 | 2.0% |
| Total | 356,578 | 100.0% |
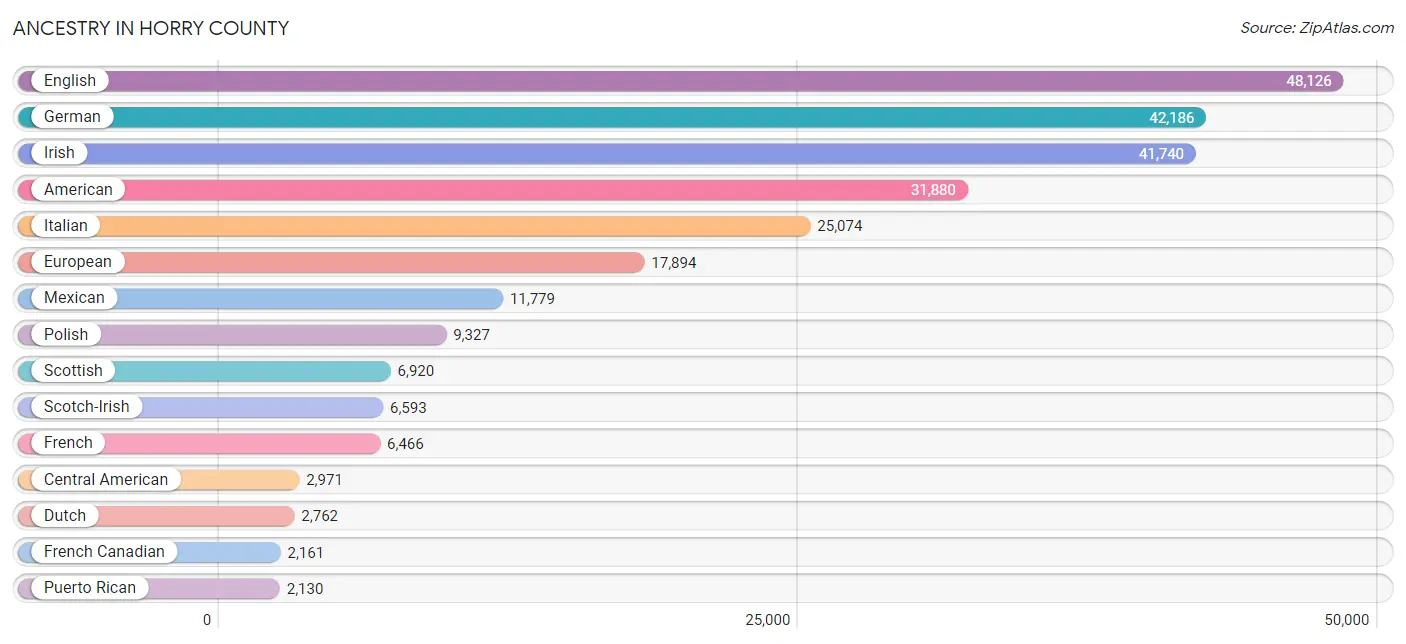
Ancestry in Horry County
The most populous ancestries reported in Horry County are English (48,126 | 13.5%), German (42,186 | 11.8%), Irish (41,740 | 11.7%), American (31,880 | 8.9%), and Italian (25,074 | 7.0%), together accounting for 53.0% of all Horry County residents.
| Ancestry | # Population | % Population |
| Afghan | 19 | 0.0% |
| African | 1,036 | 0.3% |
| Alaska Native | 9 | 0.0% |
| Albanian | 743 | 0.2% |
| Alsatian | 12 | 0.0% |
| American | 31,880 | 8.9% |
| Apache | 12 | 0.0% |
| Arab | 1,807 | 0.5% |
| Argentinean | 49 | 0.0% |
| Armenian | 348 | 0.1% |
| Australian | 26 | 0.0% |
| Austrian | 748 | 0.2% |
| Bahamian | 28 | 0.0% |
| Basque | 10 | 0.0% |
| Belgian | 223 | 0.1% |
| Bhutanese | 469 | 0.1% |
| Blackfeet | 189 | 0.1% |
| Bolivian | 6 | 0.0% |
| Brazilian | 1,256 | 0.4% |
| British | 1,547 | 0.4% |
| British West Indian | 52 | 0.0% |
| Bulgarian | 193 | 0.1% |
| Burmese | 769 | 0.2% |
| Cajun | 31 | 0.0% |
| Canadian | 674 | 0.2% |
| Celtic | 19 | 0.0% |
| Central American | 2,971 | 0.8% |
| Central American Indian | 26 | 0.0% |
| Cherokee | 1,037 | 0.3% |
| Chickasaw | 5 | 0.0% |
| Chilean | 114 | 0.0% |
| Chippewa | 14 | 0.0% |
| Choctaw | 36 | 0.0% |
| Colombian | 598 | 0.2% |
| Costa Rican | 321 | 0.1% |
| Creek | 11 | 0.0% |
| Croatian | 278 | 0.1% |
| Cuban | 446 | 0.1% |
| Czech | 570 | 0.2% |
| Czechoslovakian | 315 | 0.1% |
| Danish | 660 | 0.2% |
| Dominican | 494 | 0.1% |
| Dutch | 2,762 | 0.8% |
| Eastern European | 905 | 0.3% |
| Ecuadorian | 500 | 0.1% |
| Egyptian | 169 | 0.1% |
| English | 48,126 | 13.5% |
| Ethiopian | 22 | 0.0% |
| European | 17,894 | 5.0% |
| Filipino | 16 | 0.0% |
| Finnish | 387 | 0.1% |
| French | 6,466 | 1.8% |
| French Canadian | 2,161 | 0.6% |
| German | 42,186 | 11.8% |
| German Russian | 3 | 0.0% |
| Greek | 1,475 | 0.4% |
| Guamanian / Chamorro | 59 | 0.0% |
| Guatemalan | 1,205 | 0.3% |
| Haitian | 70 | 0.0% |
| Honduran | 1,010 | 0.3% |
| Hungarian | 1,645 | 0.5% |
| Icelander | 41 | 0.0% |
| Indian (Asian) | 1,046 | 0.3% |
| Inupiat | 1 | 0.0% |
| Iranian | 56 | 0.0% |
| Iraqi | 20 | 0.0% |
| Irish | 41,740 | 11.7% |
| Iroquois | 109 | 0.0% |
| Israeli | 389 | 0.1% |
| Italian | 25,074 | 7.0% |
| Jamaican | 1,425 | 0.4% |
| Japanese | 115 | 0.0% |
| Jordanian | 14 | 0.0% |
| Kiowa | 11 | 0.0% |
| Korean | 1,180 | 0.3% |
| Laotian | 32 | 0.0% |
| Lebanese | 261 | 0.1% |
| Lithuanian | 668 | 0.2% |
| Lumbee | 437 | 0.1% |
| Macedonian | 32 | 0.0% |
| Malaysian | 37 | 0.0% |
| Mexican | 11,779 | 3.3% |
| Mexican American Indian | 25 | 0.0% |
| Moroccan | 106 | 0.0% |
| Native Hawaiian | 38 | 0.0% |
| New Zealander | 13 | 0.0% |
| Nicaraguan | 33 | 0.0% |
| Nigerian | 88 | 0.0% |
| Northern European | 298 | 0.1% |
| Norwegian | 1,791 | 0.5% |
| Pakistani | 492 | 0.1% |
| Palestinian | 8 | 0.0% |
| Panamanian | 131 | 0.0% |
| Pennsylvania German | 262 | 0.1% |
| Peruvian | 49 | 0.0% |
| Polish | 9,327 | 2.6% |
| Portuguese | 1,452 | 0.4% |
| Puerto Rican | 2,130 | 0.6% |
| Romanian | 387 | 0.1% |
| Russian | 1,944 | 0.5% |
| Salvadoran | 271 | 0.1% |
| Samoan | 16 | 0.0% |
| Scandinavian | 853 | 0.2% |
| Scotch-Irish | 6,593 | 1.8% |
| Scottish | 6,920 | 1.9% |
| Seminole | 38 | 0.0% |
| Serbian | 215 | 0.1% |
| Sioux | 34 | 0.0% |
| Slavic | 303 | 0.1% |
| Slovak | 857 | 0.2% |
| Slovene | 51 | 0.0% |
| South African | 127 | 0.0% |
| South American | 1,509 | 0.4% |
| Spaniard | 485 | 0.1% |
| Spanish | 799 | 0.2% |
| Spanish American | 25 | 0.0% |
| Sri Lankan | 1,649 | 0.5% |
| Subsaharan African | 1,404 | 0.4% |
| Swedish | 1,723 | 0.5% |
| Swiss | 359 | 0.1% |
| Syrian | 253 | 0.1% |
| Thai | 820 | 0.2% |
| Trinidadian and Tobagonian | 35 | 0.0% |
| Turkish | 190 | 0.1% |
| Ukrainian | 1,539 | 0.4% |
| Venezuelan | 193 | 0.1% |
| Welsh | 2,001 | 0.6% |
| West Indian | 84 | 0.0% |
| Yugoslavian | 90 | 0.0% | View All 129 Rows |
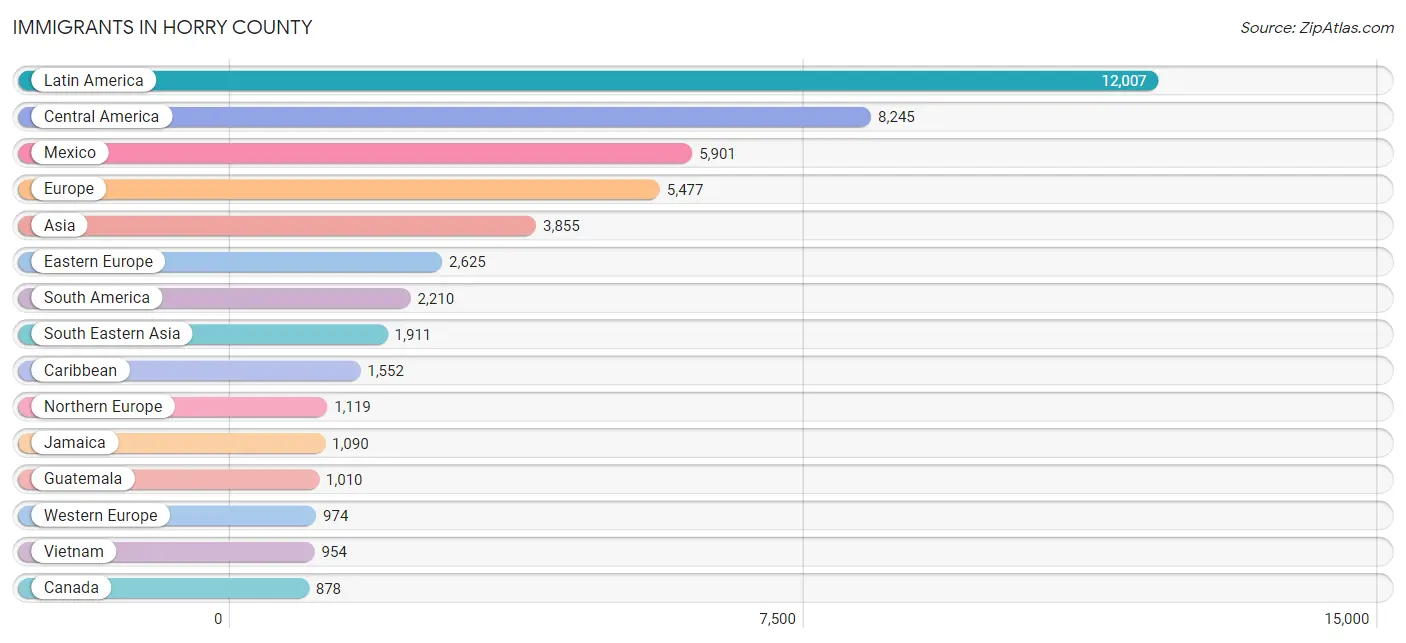
Immigrants in Horry County
The most numerous immigrant groups reported in Horry County came from Latin America (12,007 | 3.4%), Central America (8,245 | 2.3%), Mexico (5,901 | 1.7%), Europe (5,477 | 1.5%), and Asia (3,855 | 1.1%), together accounting for 10.0% of all Horry County residents.
| Immigration Origin | # Population | % Population |
| Afghanistan | 19 | 0.0% |
| Africa | 686 | 0.2% |
| Albania | 405 | 0.1% |
| Argentina | 57 | 0.0% |
| Armenia | 31 | 0.0% |
| Asia | 3,855 | 1.1% |
| Australia | 87 | 0.0% |
| Austria | 53 | 0.0% |
| Bahamas | 35 | 0.0% |
| Belarus | 12 | 0.0% |
| Belgium | 67 | 0.0% |
| Bosnia and Herzegovina | 26 | 0.0% |
| Brazil | 868 | 0.2% |
| Bulgaria | 123 | 0.0% |
| Canada | 878 | 0.3% |
| Caribbean | 1,552 | 0.4% |
| Central America | 8,245 | 2.3% |
| Chile | 76 | 0.0% |
| China | 436 | 0.1% |
| Colombia | 439 | 0.1% |
| Costa Rica | 284 | 0.1% |
| Cuba | 160 | 0.0% |
| Czechoslovakia | 95 | 0.0% |
| Denmark | 33 | 0.0% |
| Dominican Republic | 187 | 0.1% |
| Eastern Africa | 46 | 0.0% |
| Eastern Asia | 700 | 0.2% |
| Eastern Europe | 2,625 | 0.7% |
| Ecuador | 470 | 0.1% |
| Egypt | 149 | 0.0% |
| El Salvador | 201 | 0.1% |
| England | 382 | 0.1% |
| Ethiopia | 22 | 0.0% |
| Europe | 5,477 | 1.5% |
| Fiji | 8 | 0.0% |
| France | 82 | 0.0% |
| Germany | 668 | 0.2% |
| Ghana | 38 | 0.0% |
| Greece | 176 | 0.1% |
| Grenada | 20 | 0.0% |
| Guatemala | 1,010 | 0.3% |
| Guyana | 26 | 0.0% |
| Haiti | 21 | 0.0% |
| Honduras | 807 | 0.2% |
| Hong Kong | 14 | 0.0% |
| Hungary | 223 | 0.1% |
| India | 426 | 0.1% |
| Indonesia | 32 | 0.0% |
| Iran | 51 | 0.0% |
| Iraq | 7 | 0.0% |
| Ireland | 135 | 0.0% |
| Israel | 250 | 0.1% |
| Italy | 294 | 0.1% |
| Jamaica | 1,090 | 0.3% |
| Japan | 98 | 0.0% |
| Jordan | 14 | 0.0% |
| Kazakhstan | 32 | 0.0% |
| Korea | 166 | 0.1% |
| Laos | 28 | 0.0% |
| Latin America | 12,007 | 3.4% |
| Lithuania | 4 | 0.0% |
| Mexico | 5,901 | 1.7% |
| Moldova | 245 | 0.1% |
| Morocco | 154 | 0.0% |
| Nepal | 26 | 0.0% |
| Netherlands | 86 | 0.0% |
| Nicaragua | 15 | 0.0% |
| Nigeria | 7 | 0.0% |
| North Macedonia | 54 | 0.0% |
| Northern Africa | 319 | 0.1% |
| Northern Europe | 1,119 | 0.3% |
| Norway | 34 | 0.0% |
| Oceania | 104 | 0.0% |
| Pakistan | 73 | 0.0% |
| Panama | 27 | 0.0% |
| Peru | 49 | 0.0% |
| Philippines | 593 | 0.2% |
| Poland | 219 | 0.1% |
| Portugal | 172 | 0.1% |
| Romania | 214 | 0.1% |
| Russia | 246 | 0.1% |
| Scotland | 85 | 0.0% |
| Serbia | 45 | 0.0% |
| Singapore | 29 | 0.0% |
| South Africa | 193 | 0.1% |
| South America | 2,210 | 0.6% |
| South Central Asia | 777 | 0.2% |
| South Eastern Asia | 1,911 | 0.5% |
| Southern Europe | 759 | 0.2% |
| Spain | 117 | 0.0% |
| Switzerland | 18 | 0.0% |
| Syria | 8 | 0.0% |
| Taiwan | 67 | 0.0% |
| Thailand | 275 | 0.1% |
| Trinidad and Tobago | 39 | 0.0% |
| Turkey | 112 | 0.0% |
| Ukraine | 682 | 0.2% |
| Uzbekistan | 128 | 0.0% |
| Venezuela | 225 | 0.1% |
| Vietnam | 954 | 0.3% |
| Western Africa | 45 | 0.0% |
| Western Asia | 434 | 0.1% |
| Western Europe | 974 | 0.3% |
| Zimbabwe | 11 | 0.0% | View All 104 Rows |
Sex and Age in Horry County
Sex and Age in Horry County
The most populous age groups in Horry County are 65 to 69 Years (14,262 | 8.2%) for men and 60 to 64 Years (16,660 | 9.1%) for women.
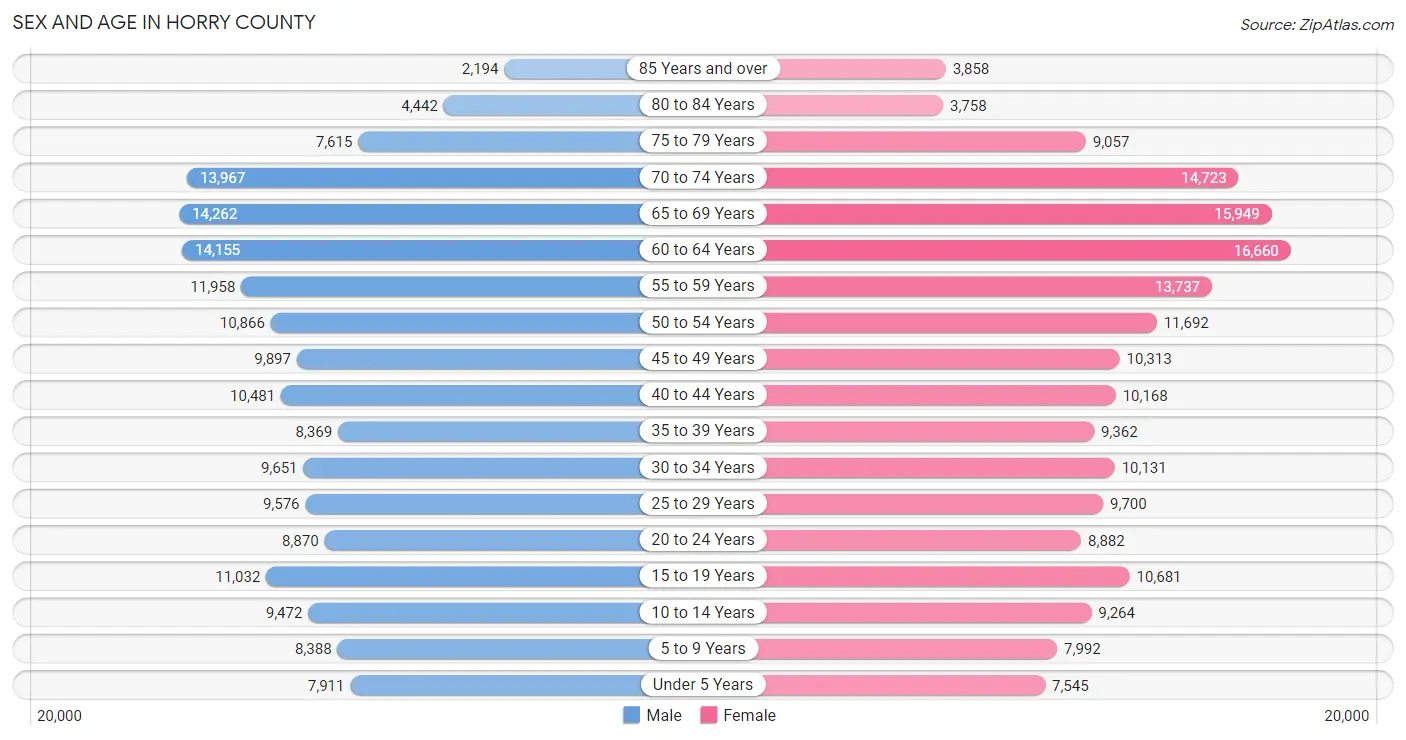
| Age Bracket | Male | Female |
| Under 5 Years | 7,911 (4.6%) | 7,545 (4.1%) |
| 5 to 9 Years | 8,388 (4.9%) | 7,992 (4.4%) |
| 10 to 14 Years | 9,472 (5.5%) | 9,264 (5.1%) |
| 15 to 19 Years | 11,032 (6.4%) | 10,681 (5.8%) |
| 20 to 24 Years | 8,870 (5.1%) | 8,882 (4.8%) |
| 25 to 29 Years | 9,576 (5.5%) | 9,700 (5.3%) |
| 30 to 34 Years | 9,651 (5.6%) | 10,131 (5.5%) |
| 35 to 39 Years | 8,369 (4.8%) | 9,362 (5.1%) |
| 40 to 44 Years | 10,481 (6.0%) | 10,168 (5.5%) |
| 45 to 49 Years | 9,897 (5.7%) | 10,313 (5.6%) |
| 50 to 54 Years | 10,866 (6.3%) | 11,692 (6.4%) |
| 55 to 59 Years | 11,958 (6.9%) | 13,737 (7.5%) |
| 60 to 64 Years | 14,155 (8.2%) | 16,660 (9.1%) |
| 65 to 69 Years | 14,262 (8.2%) | 15,949 (8.7%) |
| 70 to 74 Years | 13,967 (8.1%) | 14,723 (8.0%) |
| 75 to 79 Years | 7,615 (4.4%) | 9,057 (4.9%) |
| 80 to 84 Years | 4,442 (2.6%) | 3,758 (2.1%) |
| 85 Years and over | 2,194 (1.3%) | 3,858 (2.1%) |
| Total | 173,106 (100.0%) | 183,472 (100.0%) |
Families and Households in Horry County
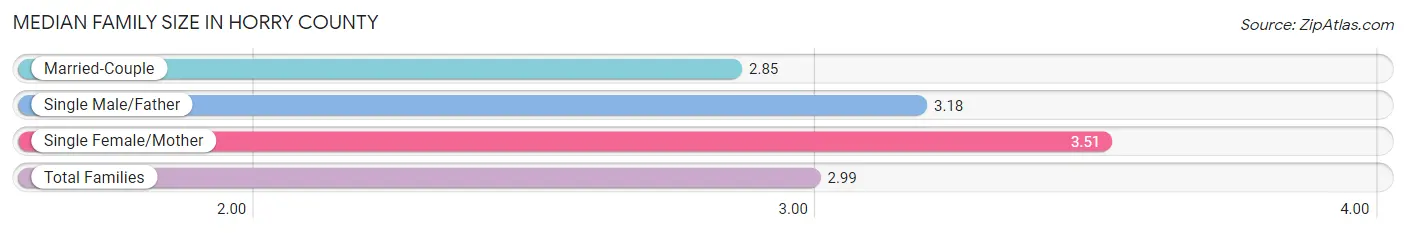
Median Family Size in Horry County
The median family size in Horry County is 2.99 persons per family, with single female/mother families (16,667 | 18.2%) accounting for the largest median family size of 3.51 persons per family. On the other hand, married-couple families (69,350 | 75.7%) represent the smallest median family size with 2.85 persons per family.
| Family Type | # Families | Family Size |
| Married-Couple | 69,350 (75.7%) | 2.85 |
| Single Male/Father | 5,579 (6.1%) | 3.18 |
| Single Female/Mother | 16,667 (18.2%) | 3.51 |
| Total Families | 91,596 (100.0%) | 2.99 |
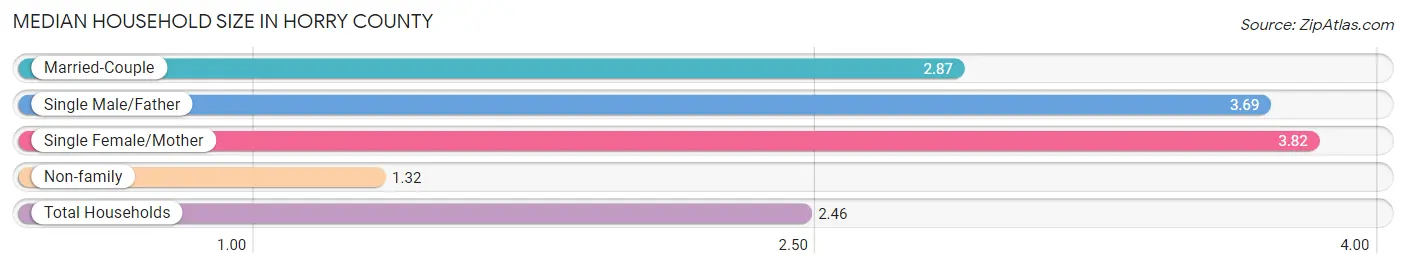
Median Household Size in Horry County
The median household size in Horry County is 2.46 persons per household, with single female/mother households (16,667 | 11.7%) accounting for the largest median household size of 3.82 persons per household. non-family households (50,787 | 35.7%) represent the smallest median household size with 1.32 persons per household.
| Household Type | # Households | Household Size |
| Married-Couple | 69,350 (48.7%) | 2.87 |
| Single Male/Father | 5,579 (3.9%) | 3.69 |
| Single Female/Mother | 16,667 (11.7%) | 3.82 |
| Non-family | 50,787 (35.7%) | 1.32 |
| Total Households | 142,383 (100.0%) | 2.46 |
Household Size by Marriage Status in Horry County
Out of a total of 142,383 households in Horry County, 91,596 (64.3%) are family households, while 50,787 (35.7%) are nonfamily households. The most numerous type of family households are 2-person households, comprising 52,512, and the most common type of nonfamily households are 1-person households, comprising 41,035.
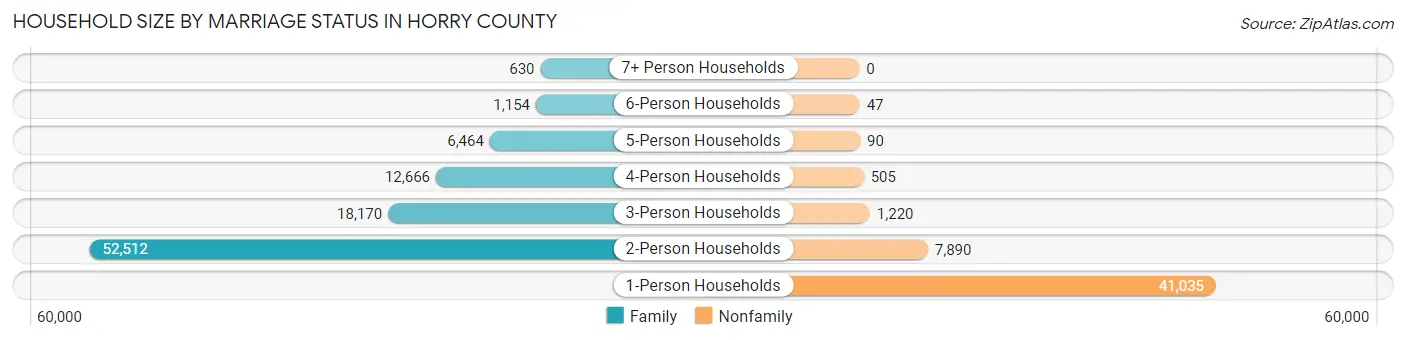
| Household Size | Family Households | Nonfamily Households |
| 1-Person Households | - | 41,035 (28.8%) |
| 2-Person Households | 52,512 (36.9%) | 7,890 (5.5%) |
| 3-Person Households | 18,170 (12.8%) | 1,220 (0.9%) |
| 4-Person Households | 12,666 (8.9%) | 505 (0.4%) |
| 5-Person Households | 6,464 (4.5%) | 90 (0.1%) |
| 6-Person Households | 1,154 (0.8%) | 47 (0.0%) |
| 7+ Person Households | 630 (0.4%) | 0 (0.0%) |
| Total | 91,596 (64.3%) | 50,787 (35.7%) |
Female Fertility in Horry County
Fertility by Age in Horry County
Average fertility rate in Horry County is 34.0 births per 1,000 women. Women in the age bracket of 20 to 34 years have the highest fertility rate with 65.0 births per 1,000 women. Women in the age bracket of 20 to 34 years acount for 74.4% of all women with births.
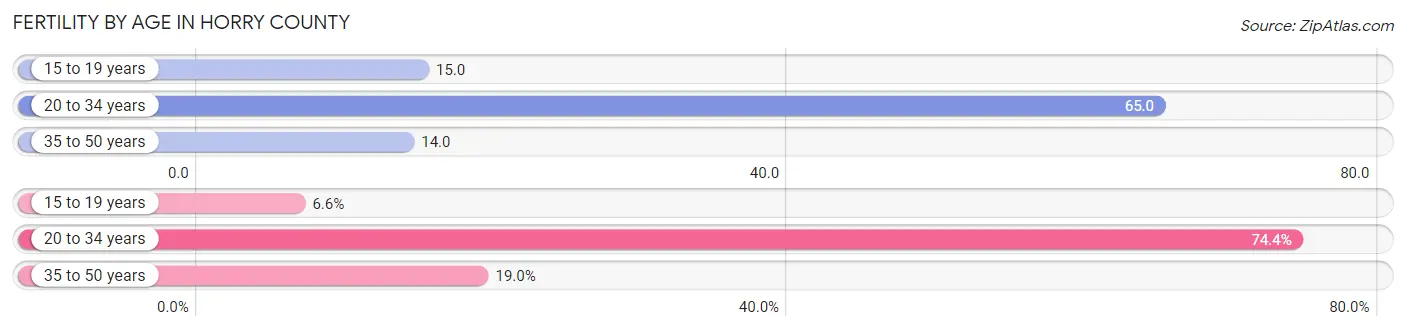
| Age Bracket | Women with Births | Births / 1,000 Women |
| 15 to 19 years | 165 (6.6%) | 15.0 |
| 20 to 34 years | 1,855 (74.4%) | 65.0 |
| 35 to 50 years | 475 (19.0%) | 14.0 |
| Total | 2,495 (100.0%) | 34.0 |
Fertility by Age by Marriage Status in Horry County
58.4% of women with births (2,495) in Horry County are married. The highest percentage of unmarried women with births falls into 15 to 19 years age bracket with 100.0% of them unmarried at the time of birth, while the lowest percentage of unmarried women with births belong to 35 to 50 years age bracket with 21.3% of them unmarried.
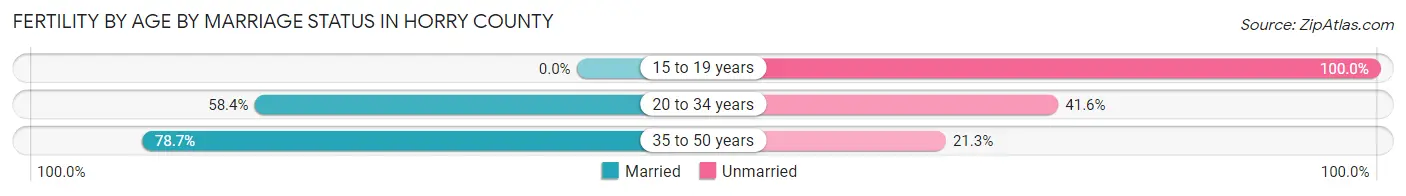
| Age Bracket | Married | Unmarried |
| 15 to 19 years | 0 (0.0%) | 165 (100.0%) |
| 20 to 34 years | 1,083 (58.4%) | 772 (41.6%) |
| 35 to 50 years | 374 (78.7%) | 101 (21.3%) |
| Total | 1,457 (58.4%) | 1,038 (41.6%) |
Fertility by Education in Horry County
Average fertility rate in Horry County is 34.0 births per 1,000 women. Women with the education attainment of graduate degree have the highest fertility rate of 46.0 births per 1,000 women, while women with the education attainment of high school diploma have the lowest fertility at 27.0 births per 1,000 women. Women with the education attainment of college or associate's degree represent 32.7% of all women with births.
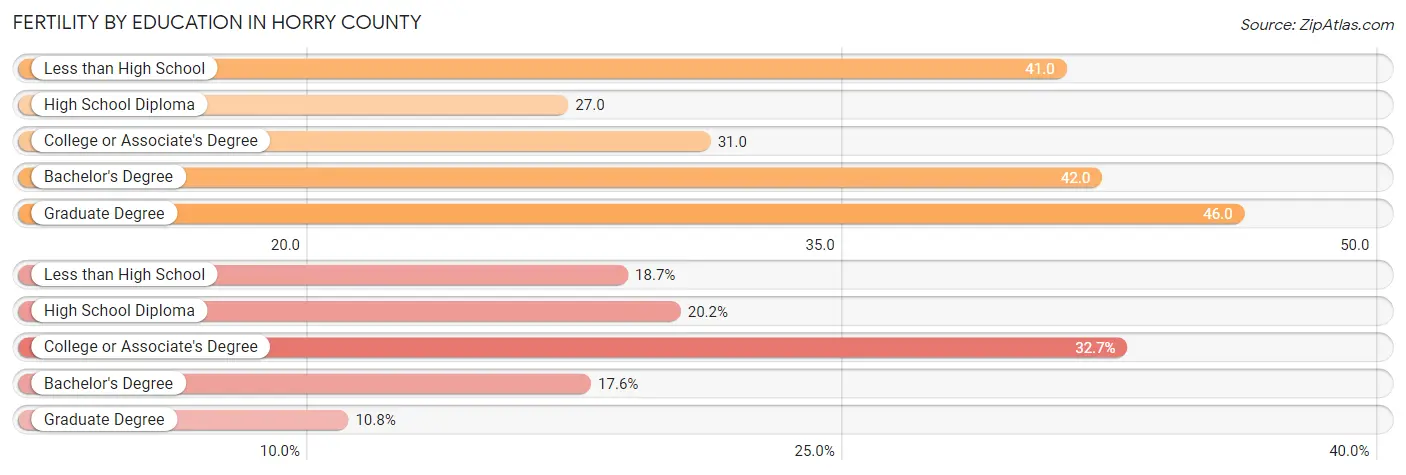
| Educational Attainment | Women with Births | Births / 1,000 Women |
| Less than High School | 466 (18.7%) | 41.0 |
| High School Diploma | 503 (20.2%) | 27.0 |
| College or Associate's Degree | 816 (32.7%) | 31.0 |
| Bachelor's Degree | 440 (17.6%) | 42.0 |
| Graduate Degree | 270 (10.8%) | 46.0 |
| Total | 2,495 (100.0%) | 34.0 |
Fertility by Education by Marriage Status in Horry County
41.6% of women with births in Horry County are unmarried. Women with the educational attainment of graduate degree are most likely to be married with 100.0% of them married at childbirth, while women with the educational attainment of less than high school are least likely to be married with 79.8% of them unmarried at childbirth.
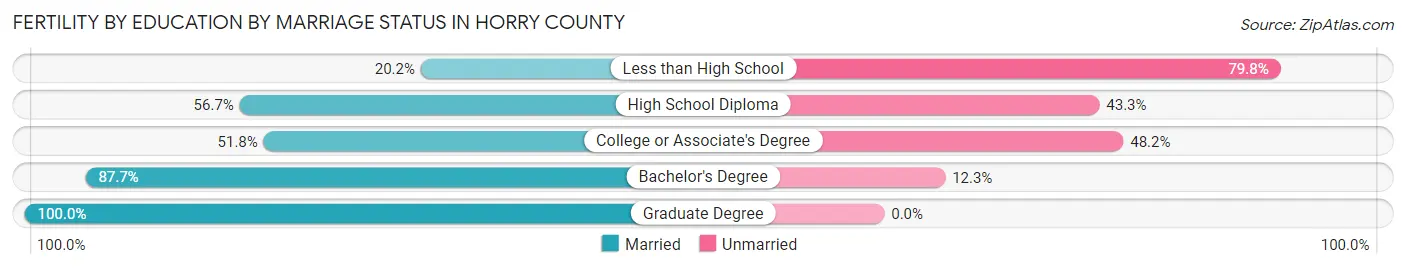
| Educational Attainment | Married | Unmarried |
| Less than High School | 94 (20.2%) | 372 (79.8%) |
| High School Diploma | 285 (56.7%) | 218 (43.3%) |
| College or Associate's Degree | 423 (51.8%) | 393 (48.2%) |
| Bachelor's Degree | 386 (87.7%) | 54 (12.3%) |
| Graduate Degree | 270 (100.0%) | 0 (0.0%) |
| Total | 1,457 (58.4%) | 1,038 (41.6%) |
Employment Characteristics in Horry County
Employment by Class of Employer in Horry County
Among the 152,128 employed individuals in Horry County, private company employees (108,208 | 71.1%), self-employed (not incorporated) (12,194 | 8.0%), and local government employees (9,026 | 5.9%) make up the most common classes of employment.
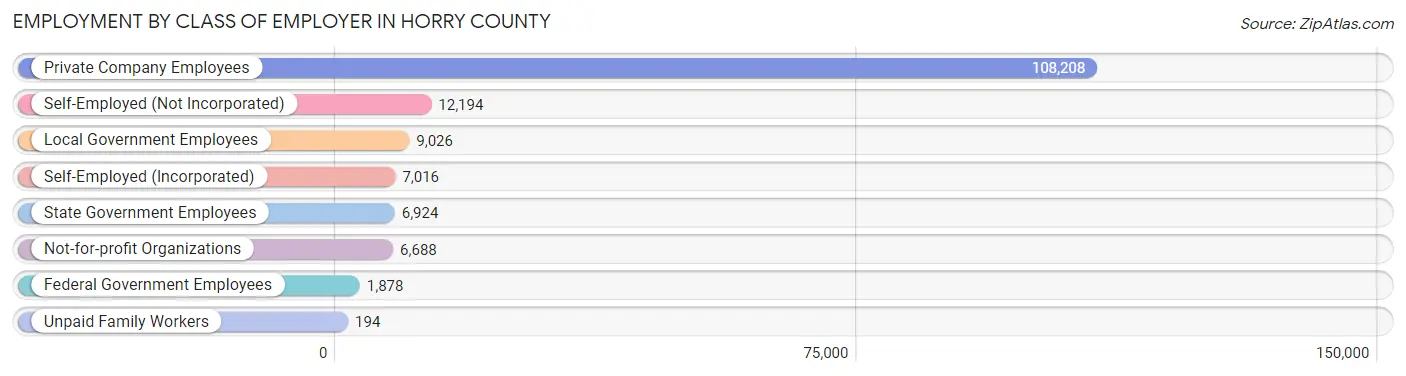
| Employer Class | # Employees | % Employees |
| Private Company Employees | 108,208 | 71.1% |
| Self-Employed (Incorporated) | 7,016 | 4.6% |
| Self-Employed (Not Incorporated) | 12,194 | 8.0% |
| Not-for-profit Organizations | 6,688 | 4.4% |
| Local Government Employees | 9,026 | 5.9% |
| State Government Employees | 6,924 | 4.5% |
| Federal Government Employees | 1,878 | 1.2% |
| Unpaid Family Workers | 194 | 0.1% |
| Total | 152,128 | 100.0% |
Employment Status by Age in Horry County
According to the labor force statistics for Horry County, out of the total population over 16 years of age (302,180), 54.3% or 164,084 individuals are in the labor force, with 5.6% or 9,189 of them unemployed. The age group with the highest labor force participation rate is 35 to 44 years, with 84.5% or 32,431 individuals in the labor force. Within the labor force, the 16 to 19 years age range has the highest percentage of unemployed individuals, with 13.4% or 1,004 of them being unemployed.
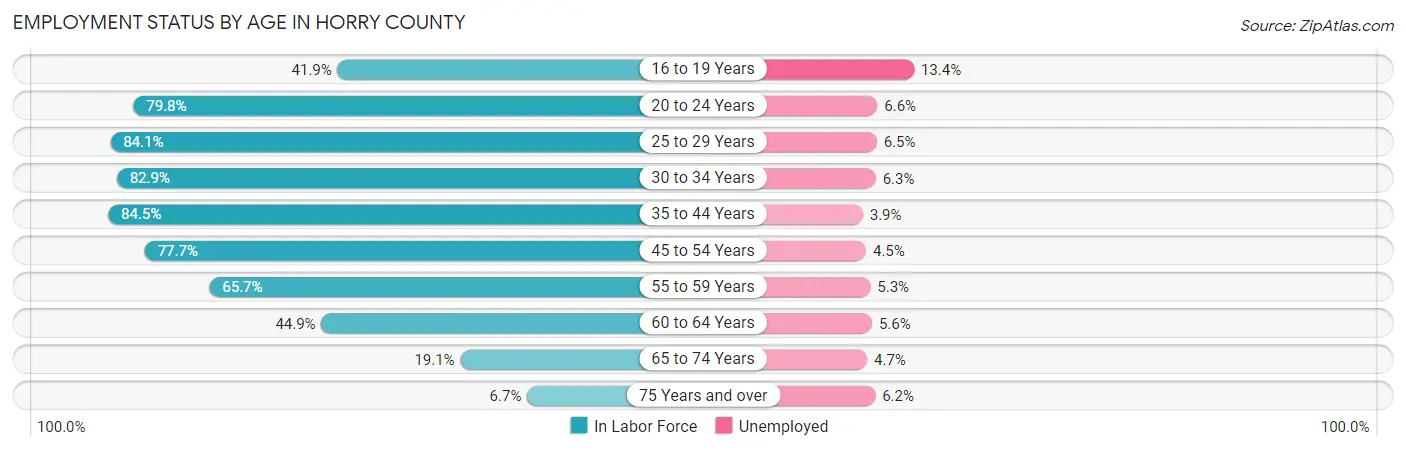
| Age Bracket | In Labor Force | Unemployed |
| 16 to 19 Years | 7,495 (41.9%) | 1,004 (13.4%) |
| 20 to 24 Years | 14,166 (79.8%) | 935 (6.6%) |
| 25 to 29 Years | 16,211 (84.1%) | 1,054 (6.5%) |
| 30 to 34 Years | 16,399 (82.9%) | 1,033 (6.3%) |
| 35 to 44 Years | 32,431 (84.5%) | 1,265 (3.9%) |
| 45 to 54 Years | 33,231 (77.7%) | 1,495 (4.5%) |
| 55 to 59 Years | 16,882 (65.7%) | 895 (5.3%) |
| 60 to 64 Years | 13,836 (44.9%) | 775 (5.6%) |
| 65 to 74 Years | 11,250 (19.1%) | 529 (4.7%) |
| 75 Years and over | 2,072 (6.7%) | 128 (6.2%) |
| Total | 164,084 (54.3%) | 9,189 (5.6%) |
Employment Status by Educational Attainment in Horry County
According to labor force statistics for Horry County, 73.0% of individuals (129,003) out of the total population between 25 and 64 years of age (176,716) are in the labor force, with 5.1% or 6,579 of them being unemployed. The group with the highest labor force participation rate are those with the educational attainment of bachelor's degree or higher, with 78.7% or 35,365 individuals in the labor force. Within the labor force, individuals with college / associate degree education have the highest percentage of unemployment, with 6.3% or 2,793 of them being unemployed.
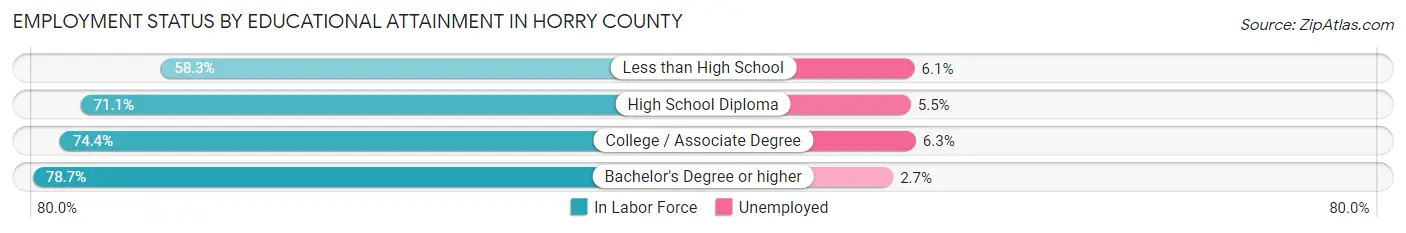
| Educational Attainment | In Labor Force | Unemployed |
| Less than High School | 9,127 (58.3%) | 955 (6.1%) |
| High School Diploma | 40,197 (71.1%) | 3,109 (5.5%) |
| College / Associate Degree | 44,334 (74.4%) | 3,754 (6.3%) |
| Bachelor's Degree or higher | 35,365 (78.7%) | 1,213 (2.7%) |
| Total | 129,003 (73.0%) | 9,013 (5.1%) |
Employment Occupations by Sex in Horry County
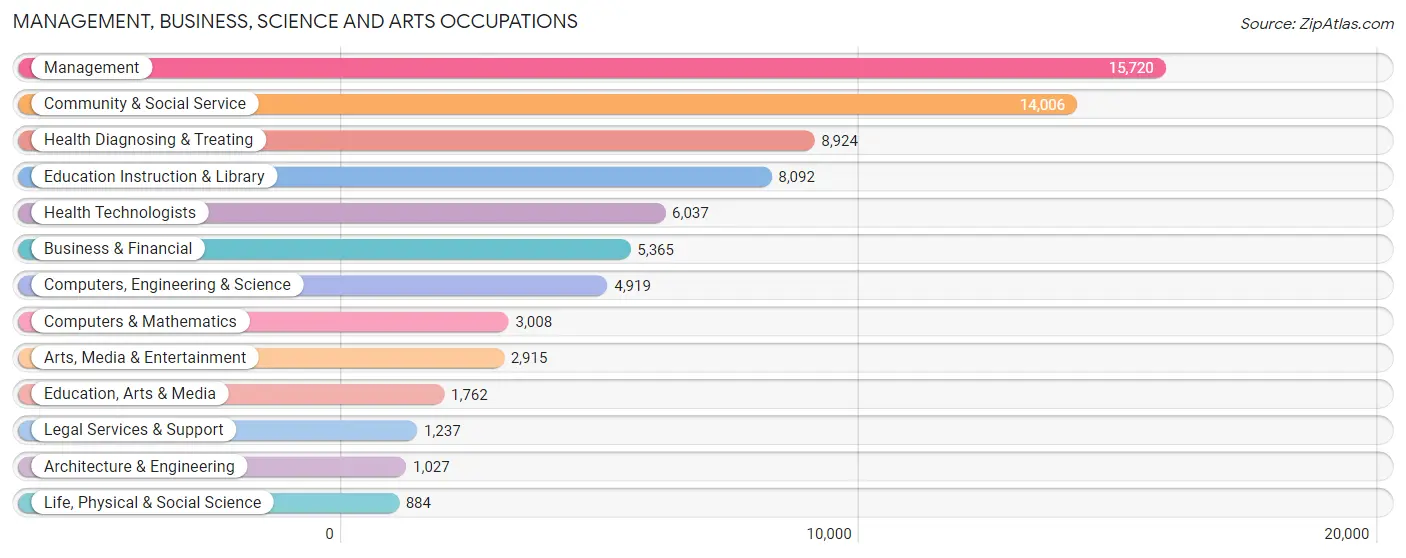
Management, Business, Science and Arts Occupations
The most common Management, Business, Science and Arts occupations in Horry County are Management (15,720 | 10.2%), Community & Social Service (14,006 | 9.0%), Health Diagnosing & Treating (8,924 | 5.8%), Education Instruction & Library (8,092 | 5.2%), and Health Technologists (6,037 | 3.9%).
Management, Business, Science and Arts Occupations by Sex
Within the Management, Business, Science and Arts occupations in Horry County, the most male-oriented occupations are Architecture & Engineering (83.3%), Computers, Engineering & Science (73.9%), and Computers & Mathematics (73.0%), while the most female-oriented occupations are Health Diagnosing & Treating (78.3%), Health Technologists (76.4%), and Education Instruction & Library (75.0%).
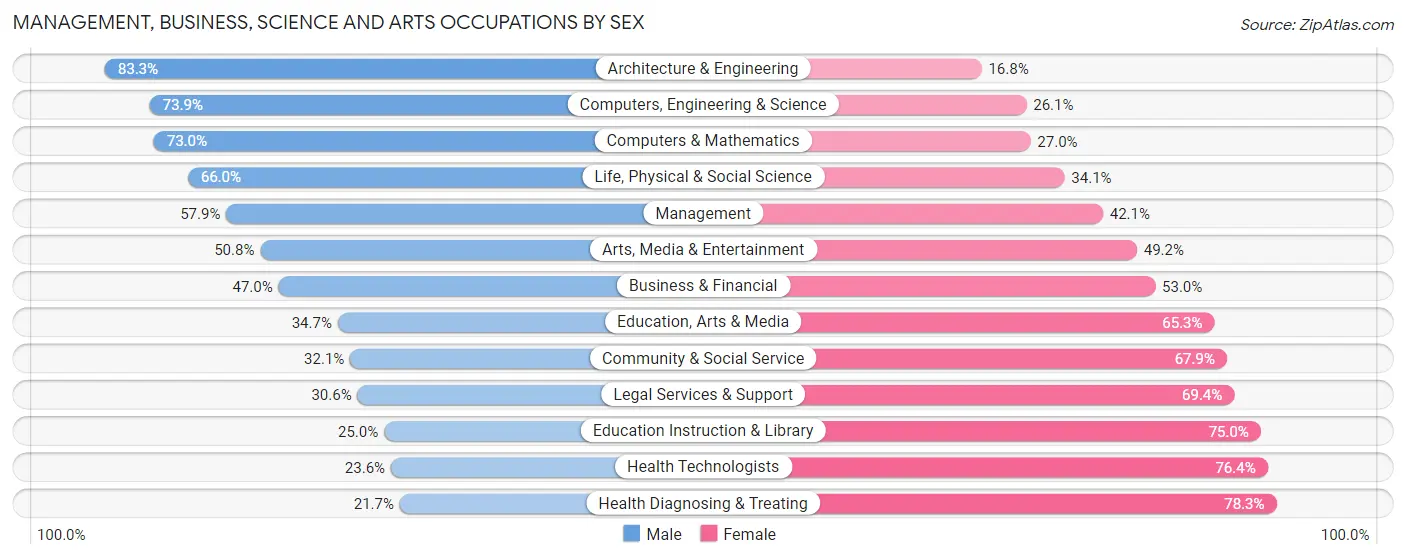
| Occupation | Male | Female |
| Management | 9,108 (57.9%) | 6,612 (42.1%) |
| Business & Financial | 2,523 (47.0%) | 2,842 (53.0%) |
| Computers, Engineering & Science | 3,635 (73.9%) | 1,284 (26.1%) |
| Computers & Mathematics | 2,197 (73.0%) | 811 (27.0%) |
| Architecture & Engineering | 855 (83.3%) | 172 (16.8%) |
| Life, Physical & Social Science | 583 (65.9%) | 301 (34.1%) |
| Community & Social Service | 4,495 (32.1%) | 9,511 (67.9%) |
| Education, Arts & Media | 611 (34.7%) | 1,151 (65.3%) |
| Legal Services & Support | 378 (30.6%) | 859 (69.4%) |
| Education Instruction & Library | 2,024 (25.0%) | 6,068 (75.0%) |
| Arts, Media & Entertainment | 1,482 (50.8%) | 1,433 (49.2%) |
| Health Diagnosing & Treating | 1,940 (21.7%) | 6,984 (78.3%) |
| Health Technologists | 1,424 (23.6%) | 4,613 (76.4%) |
| Total (Category) | 21,701 (44.4%) | 27,233 (55.6%) |
| Total (Overall) | 79,215 (51.2%) | 75,513 (48.8%) |
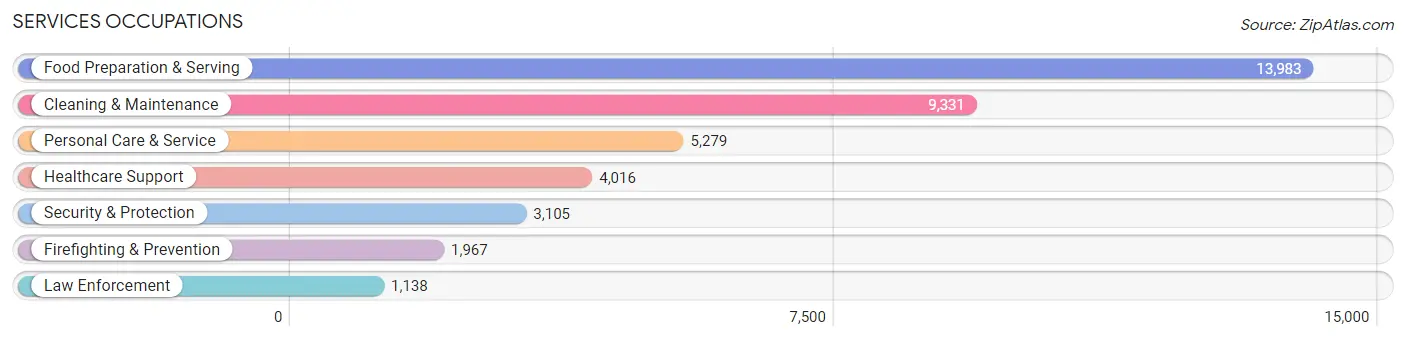
Services Occupations
The most common Services occupations in Horry County are Food Preparation & Serving (13,983 | 9.0%), Cleaning & Maintenance (9,331 | 6.0%), Personal Care & Service (5,279 | 3.4%), Healthcare Support (4,016 | 2.6%), and Security & Protection (3,105 | 2.0%).
Services Occupations by Sex
Within the Services occupations in Horry County, the most male-oriented occupations are Law Enforcement (91.6%), Security & Protection (87.6%), and Firefighting & Prevention (85.4%), while the most female-oriented occupations are Healthcare Support (94.1%), Personal Care & Service (73.4%), and Food Preparation & Serving (49.0%).
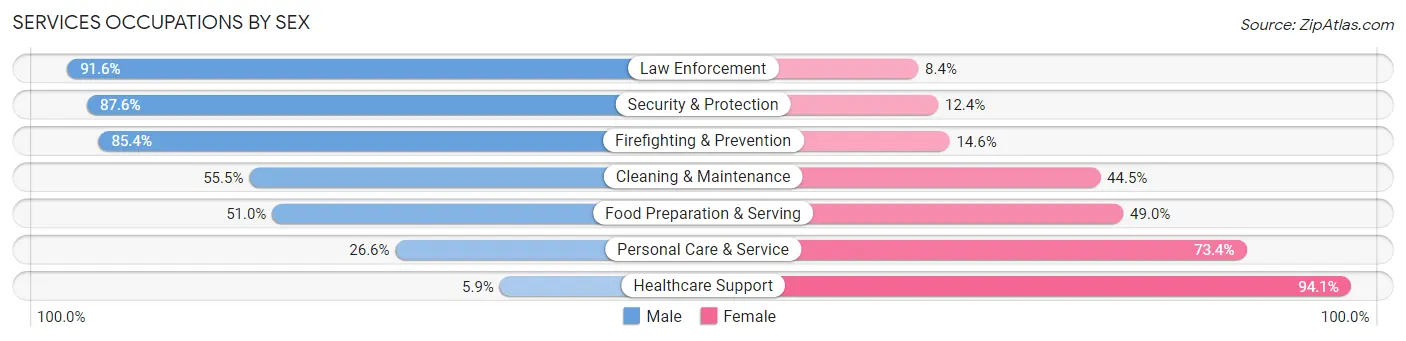
| Occupation | Male | Female |
| Healthcare Support | 238 (5.9%) | 3,778 (94.1%) |
| Security & Protection | 2,721 (87.6%) | 384 (12.4%) |
| Firefighting & Prevention | 1,679 (85.4%) | 288 (14.6%) |
| Law Enforcement | 1,042 (91.6%) | 96 (8.4%) |
| Food Preparation & Serving | 7,127 (51.0%) | 6,856 (49.0%) |
| Cleaning & Maintenance | 5,181 (55.5%) | 4,150 (44.5%) |
| Personal Care & Service | 1,403 (26.6%) | 3,876 (73.4%) |
| Total (Category) | 16,670 (46.7%) | 19,044 (53.3%) |
| Total (Overall) | 79,215 (51.2%) | 75,513 (48.8%) |
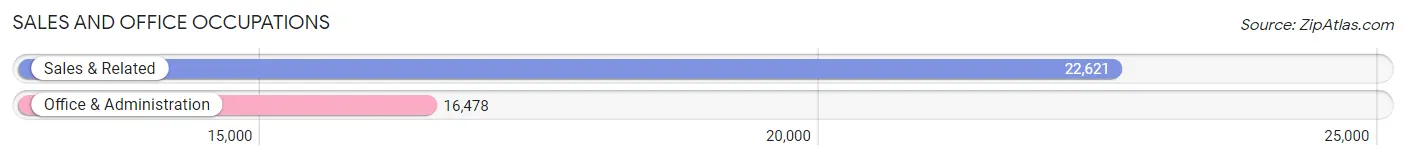
Sales and Office Occupations
The most common Sales and Office occupations in Horry County are Sales & Related (22,621 | 14.6%), and Office & Administration (16,478 | 10.6%).
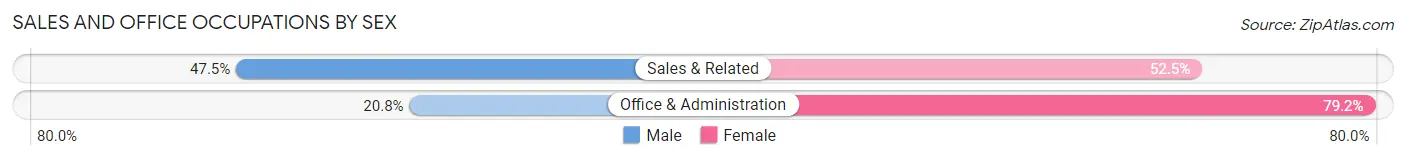
Sales and Office Occupations by Sex
| Occupation | Male | Female |
| Sales & Related | 10,737 (47.5%) | 11,884 (52.5%) |
| Office & Administration | 3,428 (20.8%) | 13,050 (79.2%) |
| Total (Category) | 14,165 (36.2%) | 24,934 (63.8%) |
| Total (Overall) | 79,215 (51.2%) | 75,513 (48.8%) |
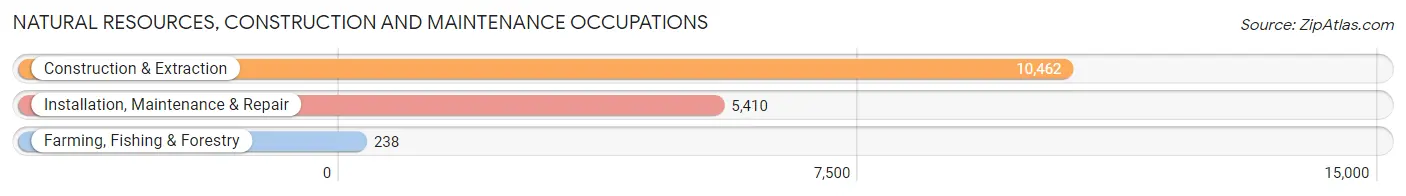
Natural Resources, Construction and Maintenance Occupations
The most common Natural Resources, Construction and Maintenance occupations in Horry County are Construction & Extraction (10,462 | 6.8%), Installation, Maintenance & Repair (5,410 | 3.5%), and Farming, Fishing & Forestry (238 | 0.2%).
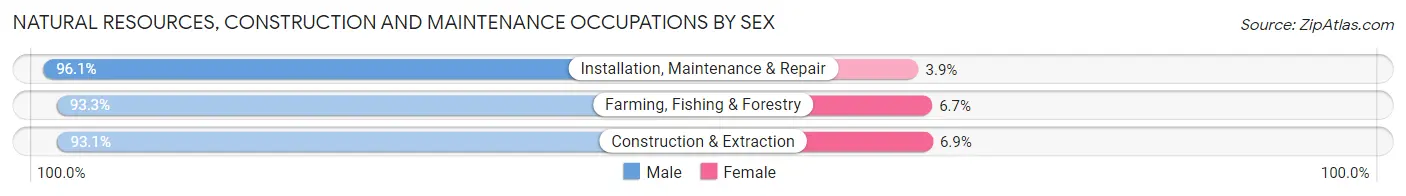
Natural Resources, Construction and Maintenance Occupations by Sex
| Occupation | Male | Female |
| Farming, Fishing & Forestry | 222 (93.3%) | 16 (6.7%) |
| Construction & Extraction | 9,743 (93.1%) | 719 (6.9%) |
| Installation, Maintenance & Repair | 5,200 (96.1%) | 210 (3.9%) |
| Total (Category) | 15,165 (94.1%) | 945 (5.9%) |
| Total (Overall) | 79,215 (51.2%) | 75,513 (48.8%) |
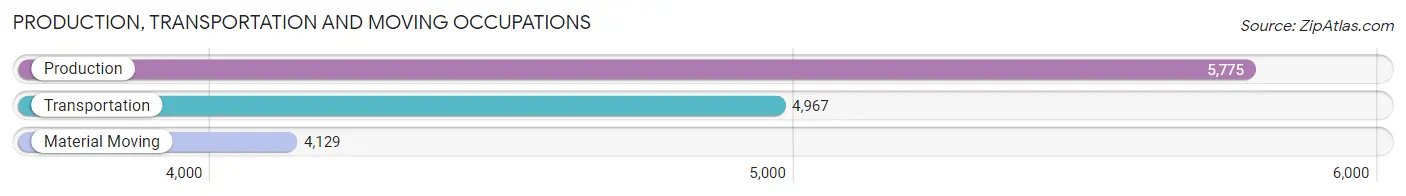
Production, Transportation and Moving Occupations
The most common Production, Transportation and Moving occupations in Horry County are Production (5,775 | 3.7%), Transportation (4,967 | 3.2%), and Material Moving (4,129 | 2.7%).
Production, Transportation and Moving Occupations by Sex
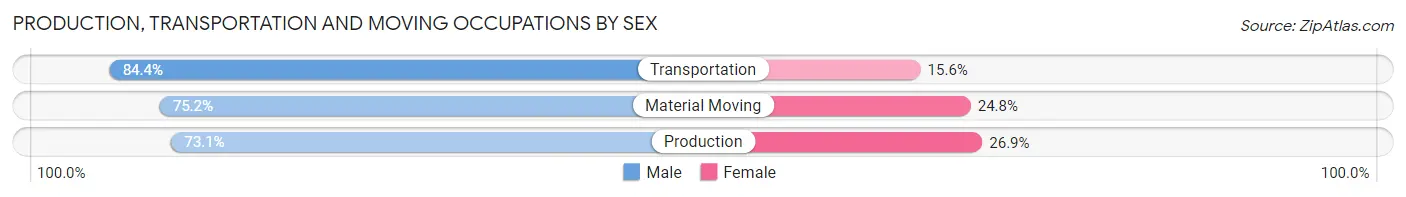
| Occupation | Male | Female |
| Production | 4,219 (73.1%) | 1,556 (26.9%) |
| Transportation | 4,191 (84.4%) | 776 (15.6%) |
| Material Moving | 3,104 (75.2%) | 1,025 (24.8%) |
| Total (Category) | 11,514 (77.4%) | 3,357 (22.6%) |
| Total (Overall) | 79,215 (51.2%) | 75,513 (48.8%) |
Employment Industries by Sex in Horry County
Employment Industries in Horry County
The major employment industries in Horry County include Accommodation & Food Services (23,319 | 15.1%), Retail Trade (22,762 | 14.7%), Health Care & Social Assistance (17,331 | 11.2%), Construction (14,389 | 9.3%), and Educational Services (11,906 | 7.7%).
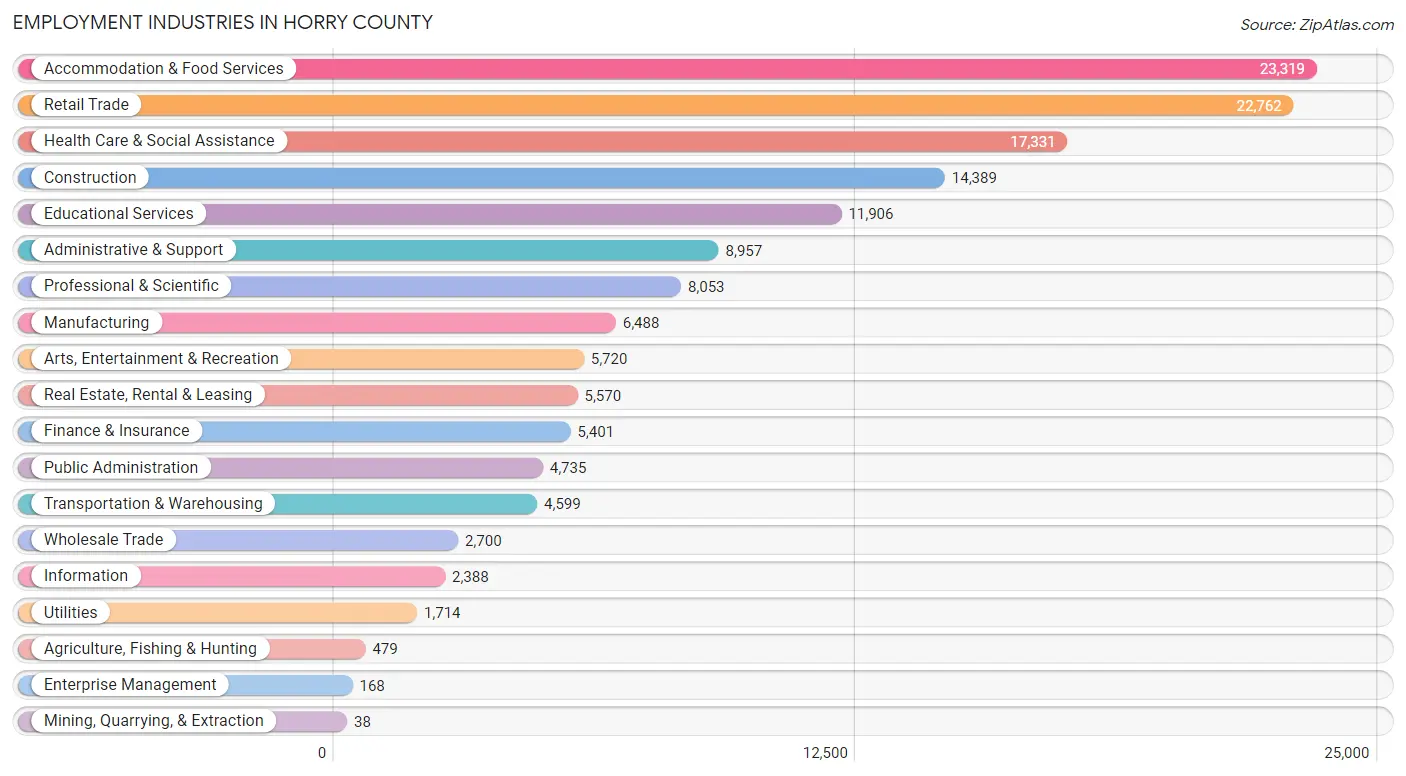
Employment Industries by Sex in Horry County
The Horry County industries that see more men than women are Mining, Quarrying, & Extraction (100.0%), Agriculture, Fishing & Hunting (88.3%), and Construction (87.6%), whereas the industries that tend to have a higher number of women are Health Care & Social Assistance (82.0%), Educational Services (72.7%), and Enterprise Management (66.7%).
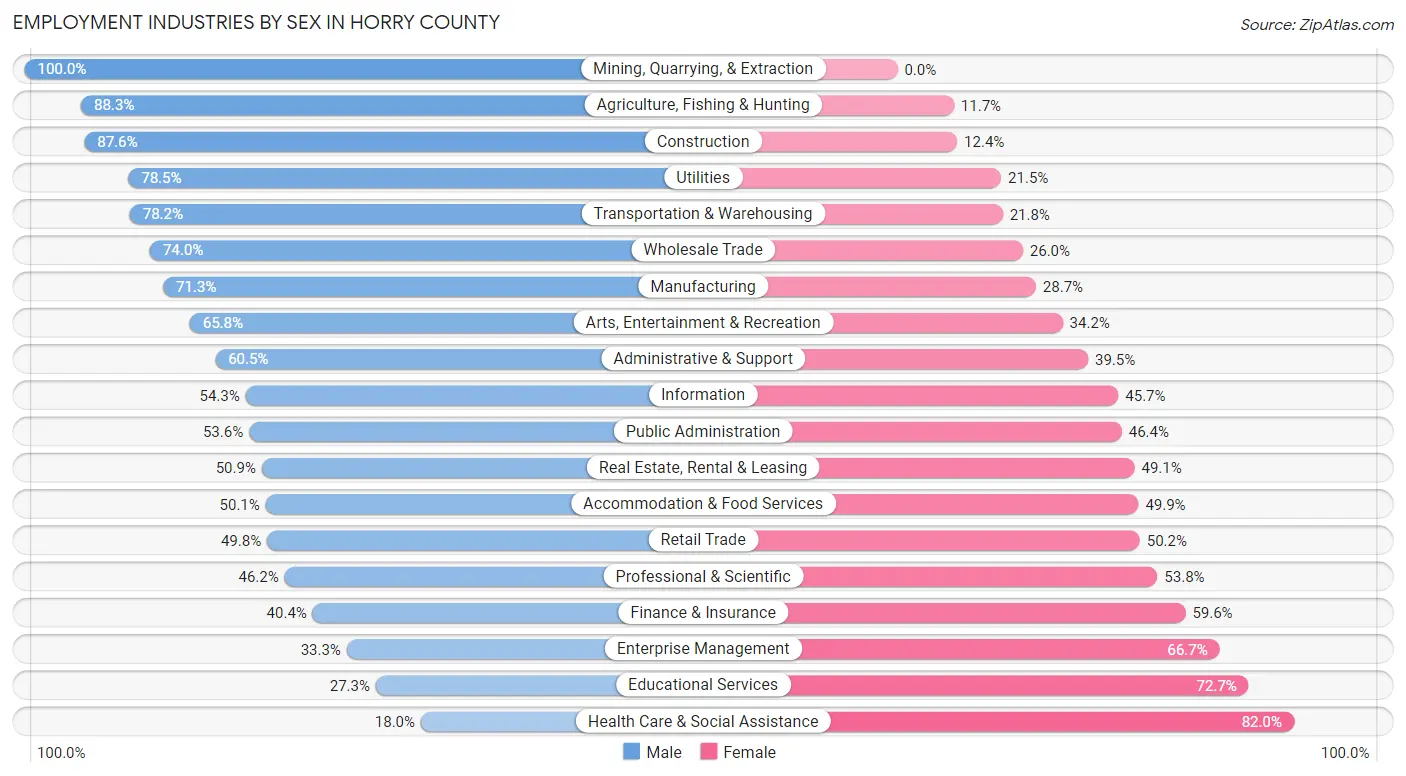
| Industry | Male | Female |
| Agriculture, Fishing & Hunting | 423 (88.3%) | 56 (11.7%) |
| Mining, Quarrying, & Extraction | 38 (100.0%) | 0 (0.0%) |
| Construction | 12,609 (87.6%) | 1,780 (12.4%) |
| Manufacturing | 4,628 (71.3%) | 1,860 (28.7%) |
| Wholesale Trade | 1,999 (74.0%) | 701 (26.0%) |
| Retail Trade | 11,343 (49.8%) | 11,419 (50.2%) |
| Transportation & Warehousing | 3,597 (78.2%) | 1,002 (21.8%) |
| Utilities | 1,346 (78.5%) | 368 (21.5%) |
| Information | 1,296 (54.3%) | 1,092 (45.7%) |
| Finance & Insurance | 2,181 (40.4%) | 3,220 (59.6%) |
| Real Estate, Rental & Leasing | 2,836 (50.9%) | 2,734 (49.1%) |
| Professional & Scientific | 3,720 (46.2%) | 4,333 (53.8%) |
| Enterprise Management | 56 (33.3%) | 112 (66.7%) |
| Administrative & Support | 5,423 (60.5%) | 3,534 (39.5%) |
| Educational Services | 3,251 (27.3%) | 8,655 (72.7%) |
| Health Care & Social Assistance | 3,116 (18.0%) | 14,215 (82.0%) |
| Arts, Entertainment & Recreation | 3,764 (65.8%) | 1,956 (34.2%) |
| Accommodation & Food Services | 11,685 (50.1%) | 11,634 (49.9%) |
| Public Administration | 2,536 (53.6%) | 2,199 (46.4%) |
| Total | 79,215 (51.2%) | 75,513 (48.8%) |
Education in Horry County
School Enrollment in Horry County
The most common levels of schooling among the 67,983 students in Horry County are college / undergraduate (15,960 | 23.5%), high school (15,545 | 22.9%), and middle school (15,150 | 22.3%).
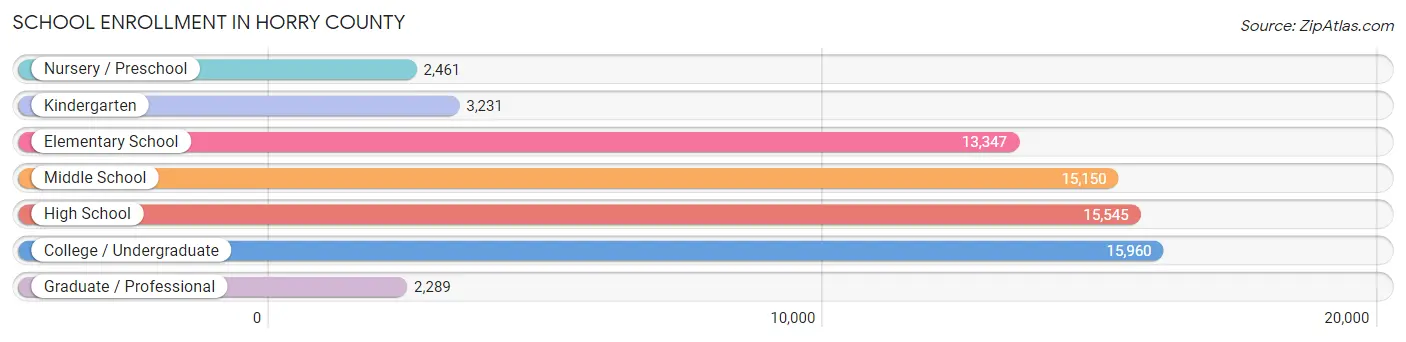
| School Level | # Students | % Students |
| Nursery / Preschool | 2,461 | 3.6% |
| Kindergarten | 3,231 | 4.8% |
| Elementary School | 13,347 | 19.6% |
| Middle School | 15,150 | 22.3% |
| High School | 15,545 | 22.9% |
| College / Undergraduate | 15,960 | 23.5% |
| Graduate / Professional | 2,289 | 3.4% |
| Total | 67,983 | 100.0% |
School Enrollment by Age by Funding Source in Horry County
Out of a total of 67,983 students who are enrolled in schools in Horry County, 7,546 (11.1%) attend a private institution, while the remaining 60,437 (88.9%) are enrolled in public schools. The age group of 3 to 4 year olds has the highest likelihood of being enrolled in private schools, with 807 (32.2% in the age bracket) enrolled. Conversely, the age group of 18 to 19 year olds has the lowest likelihood of being enrolled in a private school, with 7,293 (94.2% in the age bracket) attending a public institution.
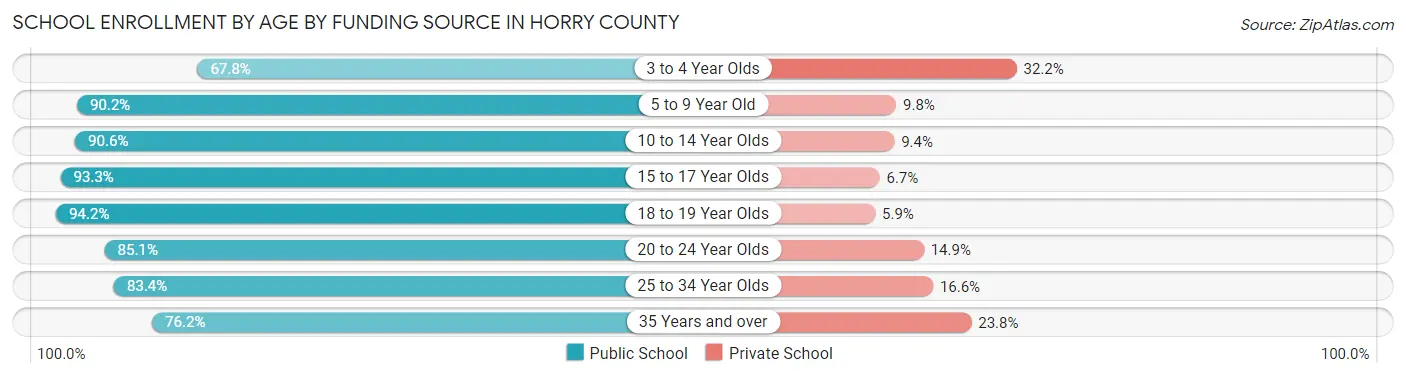
| Age Bracket | Public School | Private School |
| 3 to 4 Year Olds | 1,699 (67.8%) | 807 (32.2%) |
| 5 to 9 Year Old | 13,806 (90.2%) | 1,494 (9.8%) |
| 10 to 14 Year Olds | 16,385 (90.6%) | 1,704 (9.4%) |
| 15 to 17 Year Olds | 9,944 (93.3%) | 712 (6.7%) |
| 18 to 19 Year Olds | 7,293 (94.2%) | 453 (5.9%) |
| 20 to 24 Year Olds | 5,782 (85.1%) | 1,013 (14.9%) |
| 25 to 34 Year Olds | 2,932 (83.4%) | 585 (16.6%) |
| 35 Years and over | 2,572 (76.2%) | 802 (23.8%) |
| Total | 60,437 (88.9%) | 7,546 (11.1%) |
Educational Attainment by Field of Study in Horry County
Business (17,139 | 23.5%), education (11,322 | 15.5%), science & technology (7,495 | 10.3%), social sciences (5,358 | 7.3%), and arts & humanities (4,633 | 6.4%) are the most common fields of study among 72,984 individuals in Horry County who have obtained a bachelor's degree or higher.
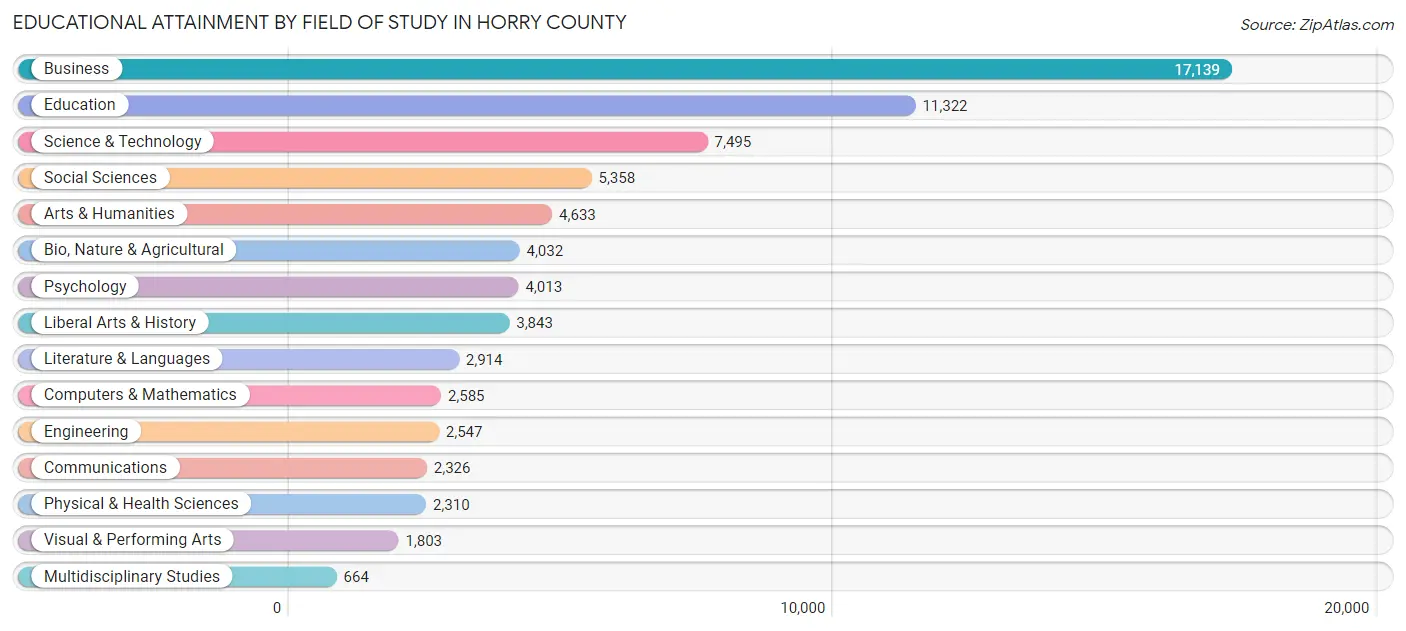
| Field of Study | # Graduates | % Graduates |
| Computers & Mathematics | 2,585 | 3.5% |
| Bio, Nature & Agricultural | 4,032 | 5.5% |
| Physical & Health Sciences | 2,310 | 3.2% |
| Psychology | 4,013 | 5.5% |
| Social Sciences | 5,358 | 7.3% |
| Engineering | 2,547 | 3.5% |
| Multidisciplinary Studies | 664 | 0.9% |
| Science & Technology | 7,495 | 10.3% |
| Business | 17,139 | 23.5% |
| Education | 11,322 | 15.5% |
| Literature & Languages | 2,914 | 4.0% |
| Liberal Arts & History | 3,843 | 5.3% |
| Visual & Performing Arts | 1,803 | 2.5% |
| Communications | 2,326 | 3.2% |
| Arts & Humanities | 4,633 | 6.4% |
| Total | 72,984 | 100.0% |
Transportation & Commute in Horry County
Vehicle Availability by Sex in Horry County
The most prevalent vehicle ownership categories in Horry County are males with 2 vehicles (36,006, accounting for 46.4%) and females with 2 vehicles (31,555, making up 49.0%).
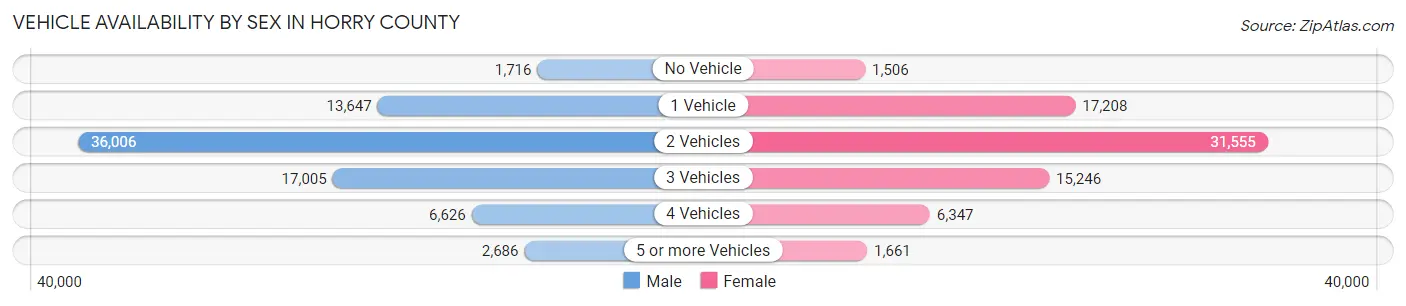
| Vehicles Available | Male | Female |
| No Vehicle | 1,716 (2.2%) | 1,506 (2.1%) |
| 1 Vehicle | 13,647 (17.6%) | 17,208 (23.4%) |
| 2 Vehicles | 36,006 (46.4%) | 31,555 (42.9%) |
| 3 Vehicles | 17,005 (21.9%) | 15,246 (20.7%) |
| 4 Vehicles | 6,626 (8.5%) | 6,347 (8.6%) |
| 5 or more Vehicles | 2,686 (3.5%) | 1,661 (2.3%) |
| Total | 77,686 (100.0%) | 73,523 (100.0%) |
Commute Time in Horry County
The most frequently occuring commute durations in Horry County are 15 to 19 minutes (27,531 commuters, 19.8%), 20 to 24 minutes (26,603 commuters, 19.2%), and 10 to 14 minutes (20,476 commuters, 14.7%).
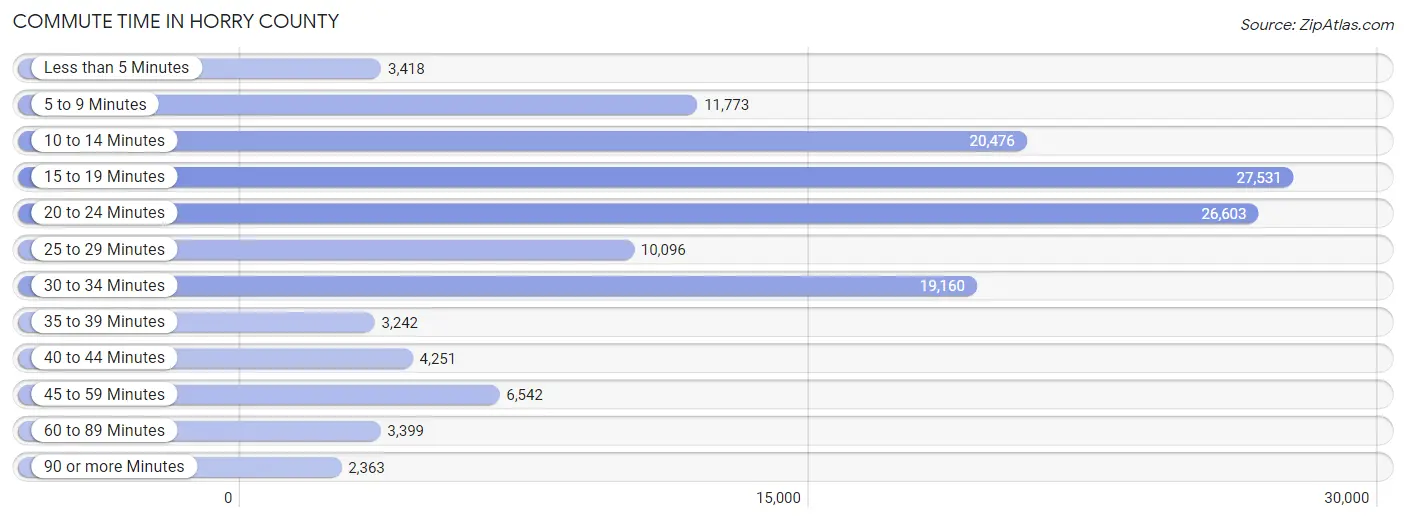
| Commute Time | # Commuters | % Commuters |
| Less than 5 Minutes | 3,418 | 2.5% |
| 5 to 9 Minutes | 11,773 | 8.5% |
| 10 to 14 Minutes | 20,476 | 14.7% |
| 15 to 19 Minutes | 27,531 | 19.8% |
| 20 to 24 Minutes | 26,603 | 19.2% |
| 25 to 29 Minutes | 10,096 | 7.3% |
| 30 to 34 Minutes | 19,160 | 13.8% |
| 35 to 39 Minutes | 3,242 | 2.3% |
| 40 to 44 Minutes | 4,251 | 3.1% |
| 45 to 59 Minutes | 6,542 | 4.7% |
| 60 to 89 Minutes | 3,399 | 2.5% |
| 90 or more Minutes | 2,363 | 1.7% |
Commute Time by Sex in Horry County
The most common commute times in Horry County are 20 to 24 minutes (14,023 commuters, 19.6%) for males and 15 to 19 minutes (13,673 commuters, 20.3%) for females.
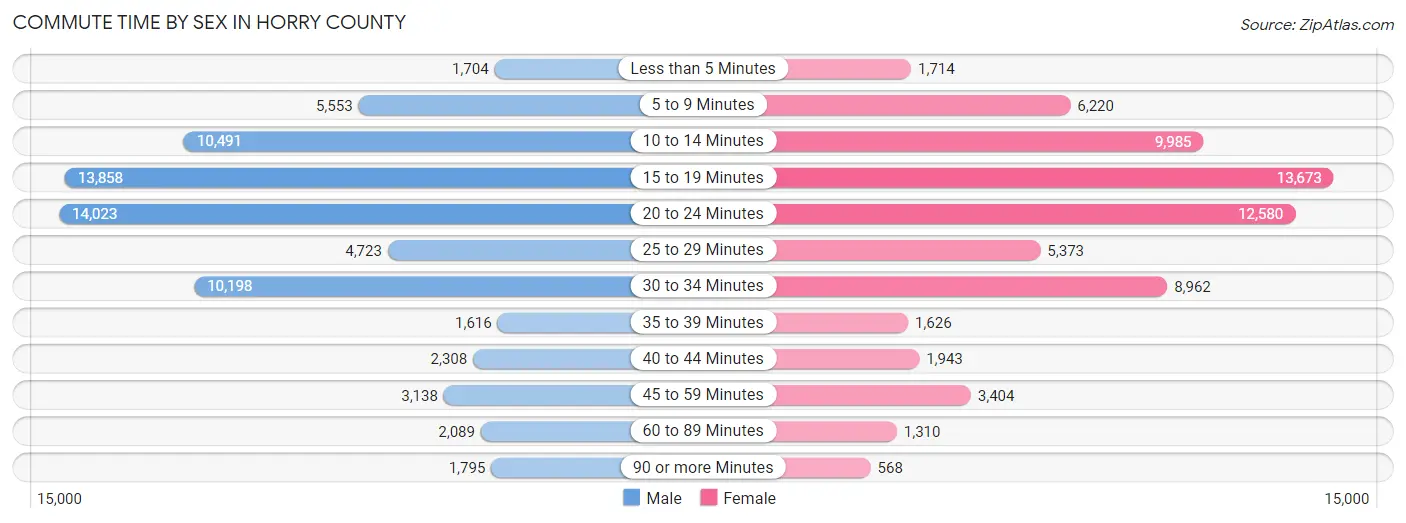
| Commute Time | Male | Female |
| Less than 5 Minutes | 1,704 (2.4%) | 1,714 (2.5%) |
| 5 to 9 Minutes | 5,553 (7.8%) | 6,220 (9.2%) |
| 10 to 14 Minutes | 10,491 (14.7%) | 9,985 (14.8%) |
| 15 to 19 Minutes | 13,858 (19.4%) | 13,673 (20.3%) |
| 20 to 24 Minutes | 14,023 (19.6%) | 12,580 (18.7%) |
| 25 to 29 Minutes | 4,723 (6.6%) | 5,373 (8.0%) |
| 30 to 34 Minutes | 10,198 (14.3%) | 8,962 (13.3%) |
| 35 to 39 Minutes | 1,616 (2.3%) | 1,626 (2.4%) |
| 40 to 44 Minutes | 2,308 (3.2%) | 1,943 (2.9%) |
| 45 to 59 Minutes | 3,138 (4.4%) | 3,404 (5.1%) |
| 60 to 89 Minutes | 2,089 (2.9%) | 1,310 (1.9%) |
| 90 or more Minutes | 1,795 (2.5%) | 568 (0.8%) |
Time of Departure to Work by Sex in Horry County
The most frequent times of departure to work in Horry County are 8:00 AM to 8:29 AM (11,002, 15.4%) for males and 7:00 AM to 7:29 AM (9,946, 14.8%) for females.
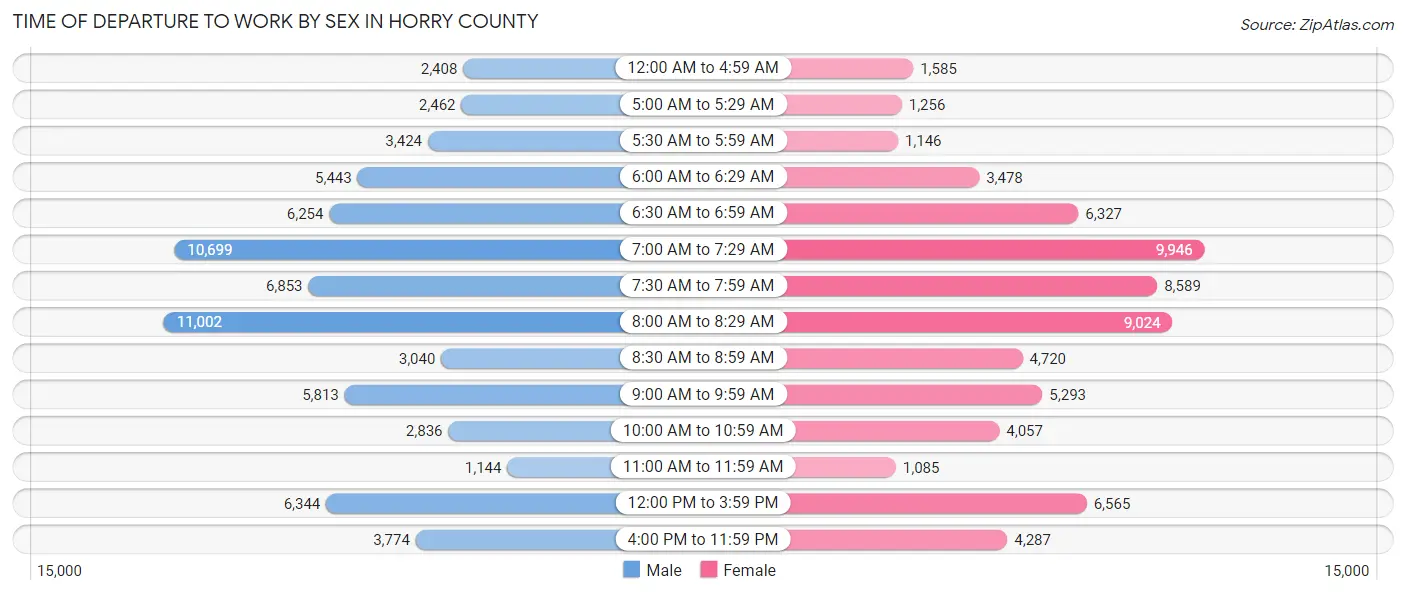
| Time of Departure | Male | Female |
| 12:00 AM to 4:59 AM | 2,408 (3.4%) | 1,585 (2.4%) |
| 5:00 AM to 5:29 AM | 2,462 (3.4%) | 1,256 (1.9%) |
| 5:30 AM to 5:59 AM | 3,424 (4.8%) | 1,146 (1.7%) |
| 6:00 AM to 6:29 AM | 5,443 (7.6%) | 3,478 (5.2%) |
| 6:30 AM to 6:59 AM | 6,254 (8.7%) | 6,327 (9.4%) |
| 7:00 AM to 7:29 AM | 10,699 (15.0%) | 9,946 (14.8%) |
| 7:30 AM to 7:59 AM | 6,853 (9.6%) | 8,589 (12.8%) |
| 8:00 AM to 8:29 AM | 11,002 (15.4%) | 9,024 (13.4%) |
| 8:30 AM to 8:59 AM | 3,040 (4.3%) | 4,720 (7.0%) |
| 9:00 AM to 9:59 AM | 5,813 (8.1%) | 5,293 (7.9%) |
| 10:00 AM to 10:59 AM | 2,836 (4.0%) | 4,057 (6.0%) |
| 11:00 AM to 11:59 AM | 1,144 (1.6%) | 1,085 (1.6%) |
| 12:00 PM to 3:59 PM | 6,344 (8.9%) | 6,565 (9.8%) |
| 4:00 PM to 11:59 PM | 3,774 (5.3%) | 4,287 (6.4%) |
| Total | 71,496 (100.0%) | 67,358 (100.0%) |
Housing Occupancy in Horry County
Occupancy by Ownership in Horry County
Of the total 142,383 dwellings in Horry County, owner-occupied units account for 107,070 (75.2%), while renter-occupied units make up 35,313 (24.8%).
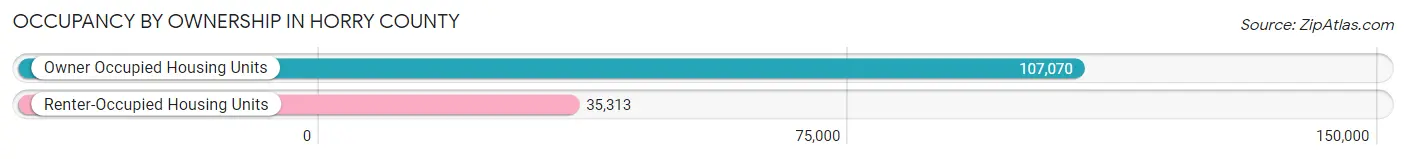
| Occupancy | # Housing Units | % Housing Units |
| Owner Occupied Housing Units | 107,070 | 75.2% |
| Renter-Occupied Housing Units | 35,313 | 24.8% |
| Total Occupied Housing Units | 142,383 | 100.0% |
Occupancy by Household Size in Horry County
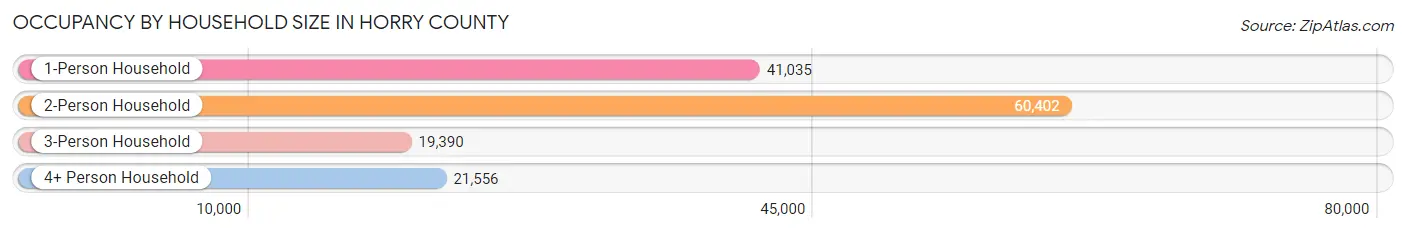
| Household Size | # Housing Units | % Housing Units |
| 1-Person Household | 41,035 | 28.8% |
| 2-Person Household | 60,402 | 42.4% |
| 3-Person Household | 19,390 | 13.6% |
| 4+ Person Household | 21,556 | 15.1% |
| Total Housing Units | 142,383 | 100.0% |
Occupancy by Ownership by Household Size in Horry County
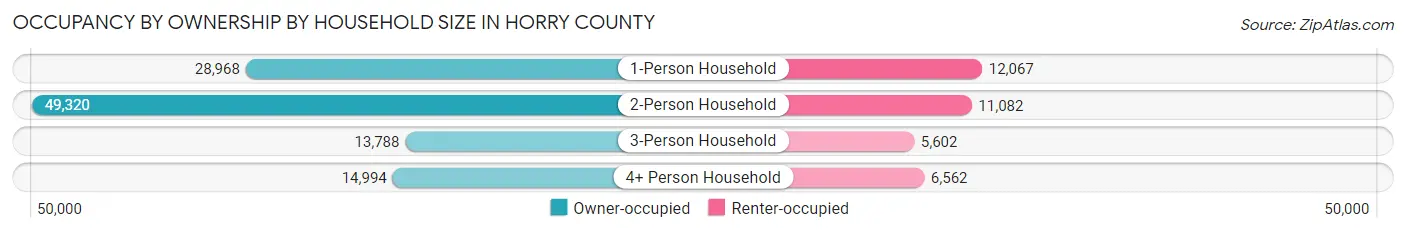
| Household Size | Owner-occupied | Renter-occupied |
| 1-Person Household | 28,968 (70.6%) | 12,067 (29.4%) |
| 2-Person Household | 49,320 (81.7%) | 11,082 (18.3%) |
| 3-Person Household | 13,788 (71.1%) | 5,602 (28.9%) |
| 4+ Person Household | 14,994 (69.6%) | 6,562 (30.4%) |
| Total Housing Units | 107,070 (75.2%) | 35,313 (24.8%) |
Occupancy by Educational Attainment in Horry County
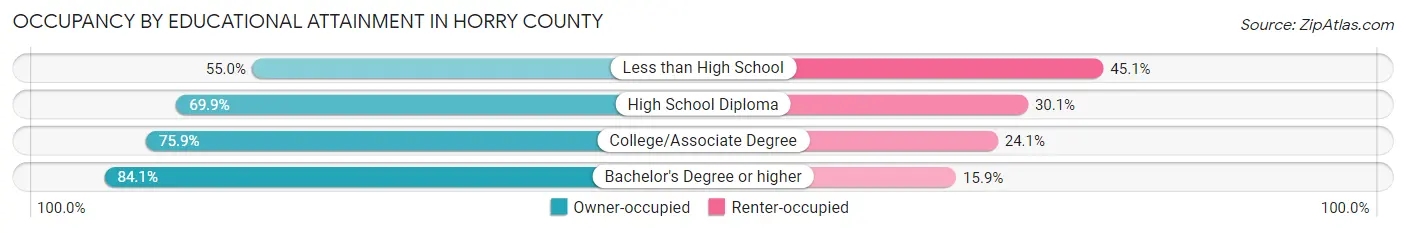
| Household Size | Owner-occupied | Renter-occupied |
| Less than High School | 5,188 (54.9%) | 4,254 (45.1%) |
| High School Diploma | 27,985 (69.9%) | 12,044 (30.1%) |
| College/Associate Degree | 39,370 (75.9%) | 12,508 (24.1%) |
| Bachelor's Degree or higher | 34,527 (84.1%) | 6,507 (15.9%) |
Occupancy by Age of Householder in Horry County
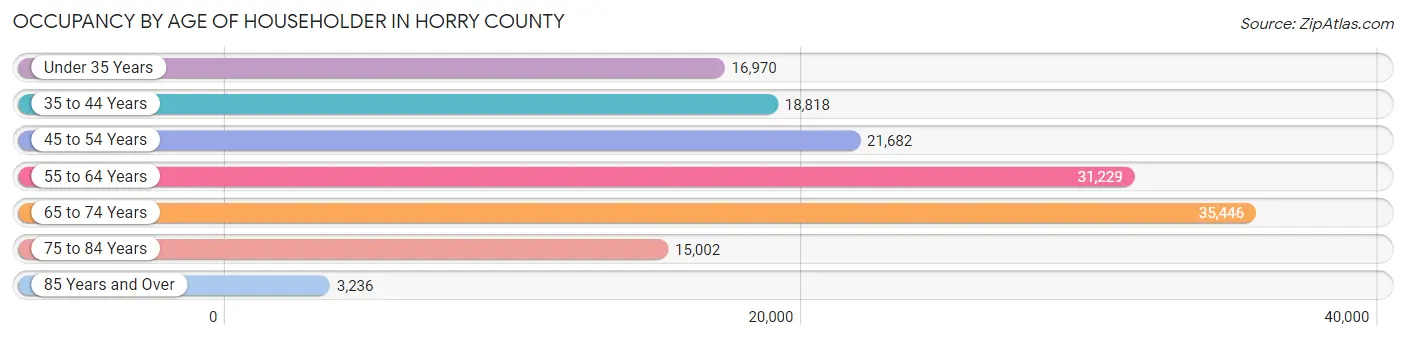
| Age Bracket | # Households | % Households |
| Under 35 Years | 16,970 | 11.9% |
| 35 to 44 Years | 18,818 | 13.2% |
| 45 to 54 Years | 21,682 | 15.2% |
| 55 to 64 Years | 31,229 | 21.9% |
| 65 to 74 Years | 35,446 | 24.9% |
| 75 to 84 Years | 15,002 | 10.5% |
| 85 Years and Over | 3,236 | 2.3% |
| Total | 142,383 | 100.0% |
Housing Finances in Horry County
Median Income by Occupancy in Horry County
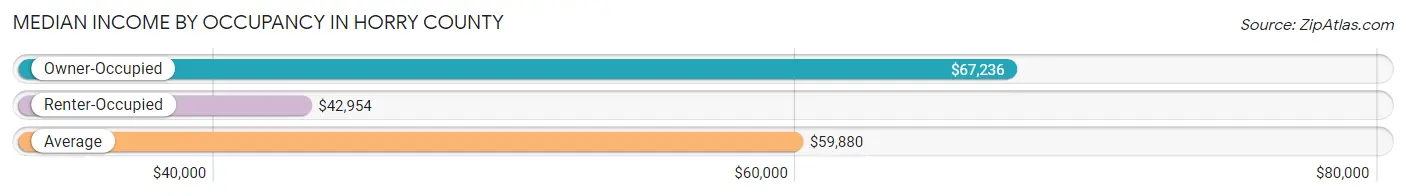
| Occupancy Type | # Households | Median Income |
| Owner-Occupied | 107,070 (75.2%) | $67,236 |
| Renter-Occupied | 35,313 (24.8%) | $42,954 |
| Average | 142,383 (100.0%) | $59,880 |
Occupancy by Householder Income Bracket in Horry County
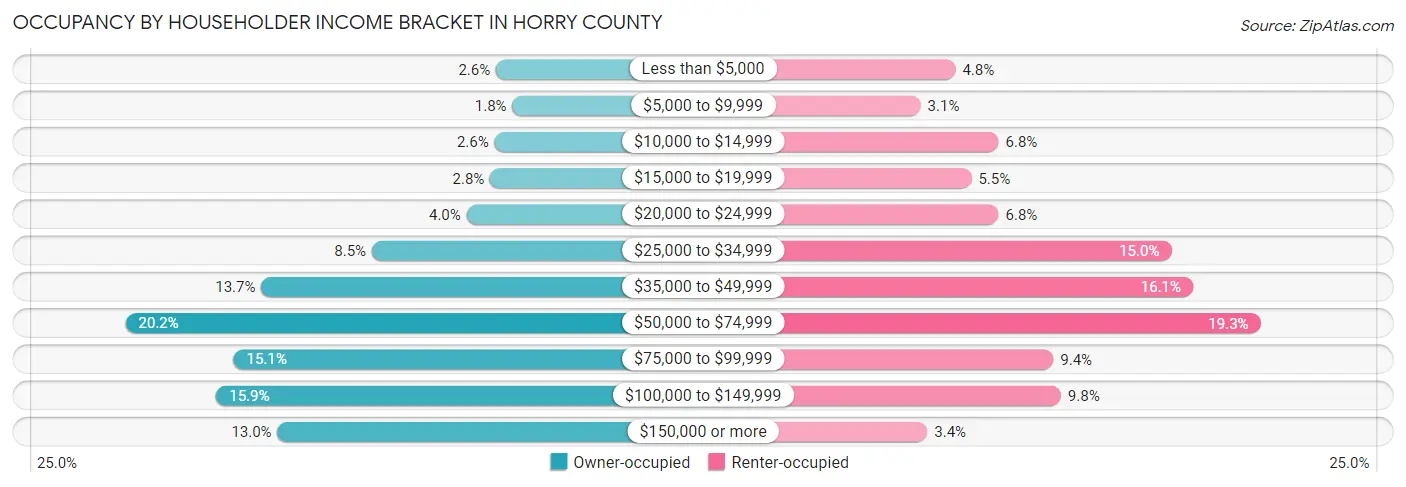
| Income Bracket | Owner-occupied | Renter-occupied |
| Less than $5,000 | 2,729 (2.5%) | 1,682 (4.8%) |
| $5,000 to $9,999 | 1,890 (1.8%) | 1,094 (3.1%) |
| $10,000 to $14,999 | 2,804 (2.6%) | 2,406 (6.8%) |
| $15,000 to $19,999 | 3,034 (2.8%) | 1,950 (5.5%) |
| $20,000 to $24,999 | 4,233 (4.0%) | 2,405 (6.8%) |
| $25,000 to $34,999 | 9,058 (8.5%) | 5,306 (15.0%) |
| $35,000 to $49,999 | 14,704 (13.7%) | 5,671 (16.1%) |
| $50,000 to $74,999 | 21,632 (20.2%) | 6,809 (19.3%) |
| $75,000 to $99,999 | 16,111 (15.0%) | 3,327 (9.4%) |
| $100,000 to $149,999 | 16,996 (15.9%) | 3,454 (9.8%) |
| $150,000 or more | 13,879 (13.0%) | 1,209 (3.4%) |
| Total | 107,070 (100.0%) | 35,313 (100.0%) |
Monthly Housing Cost Tiers in Horry County
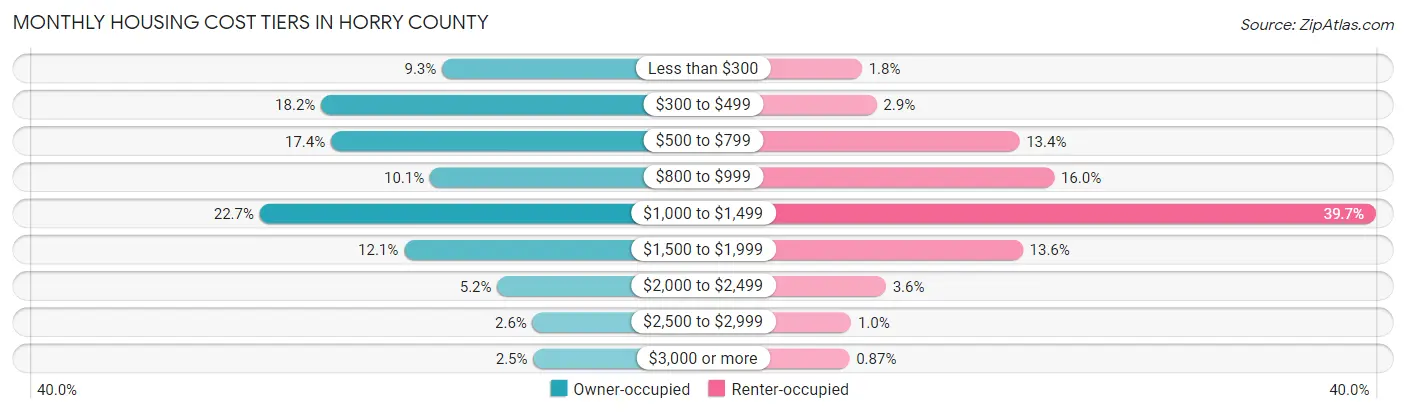
| Monthly Cost | Owner-occupied | Renter-occupied |
| Less than $300 | 9,909 (9.2%) | 633 (1.8%) |
| $300 to $499 | 19,442 (18.2%) | 1,013 (2.9%) |
| $500 to $799 | 18,666 (17.4%) | 4,730 (13.4%) |
| $800 to $999 | 10,858 (10.1%) | 5,634 (16.0%) |
| $1,000 to $1,499 | 24,281 (22.7%) | 14,000 (39.7%) |
| $1,500 to $1,999 | 12,898 (12.0%) | 4,816 (13.6%) |
| $2,000 to $2,499 | 5,550 (5.2%) | 1,258 (3.6%) |
| $2,500 to $2,999 | 2,759 (2.6%) | 353 (1.0%) |
| $3,000 or more | 2,707 (2.5%) | 308 (0.9%) |
| Total | 107,070 (100.0%) | 35,313 (100.0%) |
Physical Housing Characteristics in Horry County
Housing Structures in Horry County
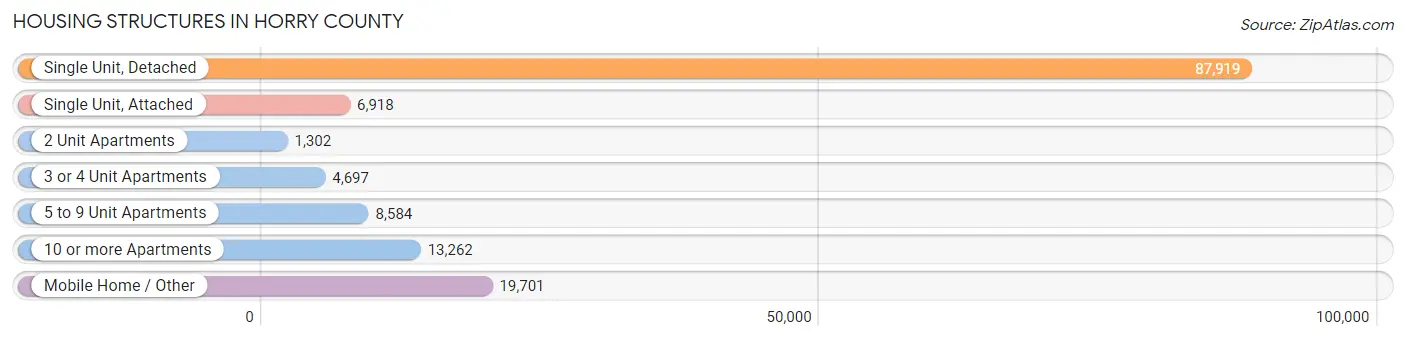
| Structure Type | # Housing Units | % Housing Units |
| Single Unit, Detached | 87,919 | 61.8% |
| Single Unit, Attached | 6,918 | 4.9% |
| 2 Unit Apartments | 1,302 | 0.9% |
| 3 or 4 Unit Apartments | 4,697 | 3.3% |
| 5 to 9 Unit Apartments | 8,584 | 6.0% |
| 10 or more Apartments | 13,262 | 9.3% |
| Mobile Home / Other | 19,701 | 13.8% |
| Total | 142,383 | 100.0% |
Housing Structures by Occupancy in Horry County
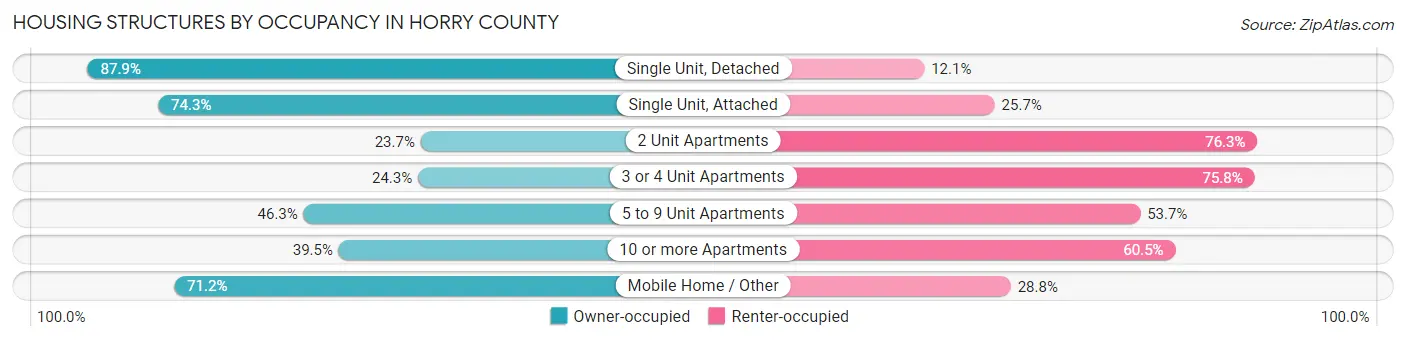
| Structure Type | Owner-occupied | Renter-occupied |
| Single Unit, Detached | 77,242 (87.9%) | 10,677 (12.1%) |
| Single Unit, Attached | 5,140 (74.3%) | 1,778 (25.7%) |
| 2 Unit Apartments | 309 (23.7%) | 993 (76.3%) |
| 3 or 4 Unit Apartments | 1,139 (24.2%) | 3,558 (75.7%) |
| 5 to 9 Unit Apartments | 3,973 (46.3%) | 4,611 (53.7%) |
| 10 or more Apartments | 5,239 (39.5%) | 8,023 (60.5%) |
| Mobile Home / Other | 14,028 (71.2%) | 5,673 (28.8%) |
| Total | 107,070 (75.2%) | 35,313 (24.8%) |
Housing Structures by Number of Rooms in Horry County
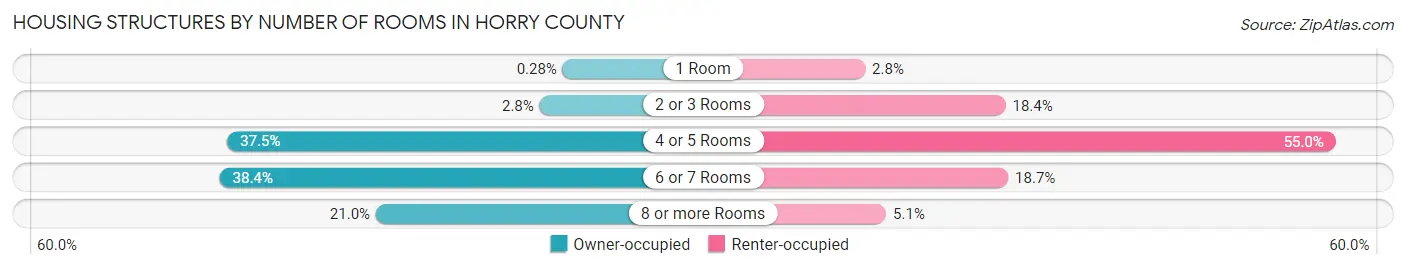
| Number of Rooms | Owner-occupied | Renter-occupied |
| 1 Room | 296 (0.3%) | 988 (2.8%) |
| 2 or 3 Rooms | 3,038 (2.8%) | 6,490 (18.4%) |
| 4 or 5 Rooms | 40,175 (37.5%) | 19,428 (55.0%) |
| 6 or 7 Rooms | 41,065 (38.4%) | 6,594 (18.7%) |
| 8 or more Rooms | 22,496 (21.0%) | 1,813 (5.1%) |
| Total | 107,070 (100.0%) | 35,313 (100.0%) |
Housing Structure by Heating Type in Horry County
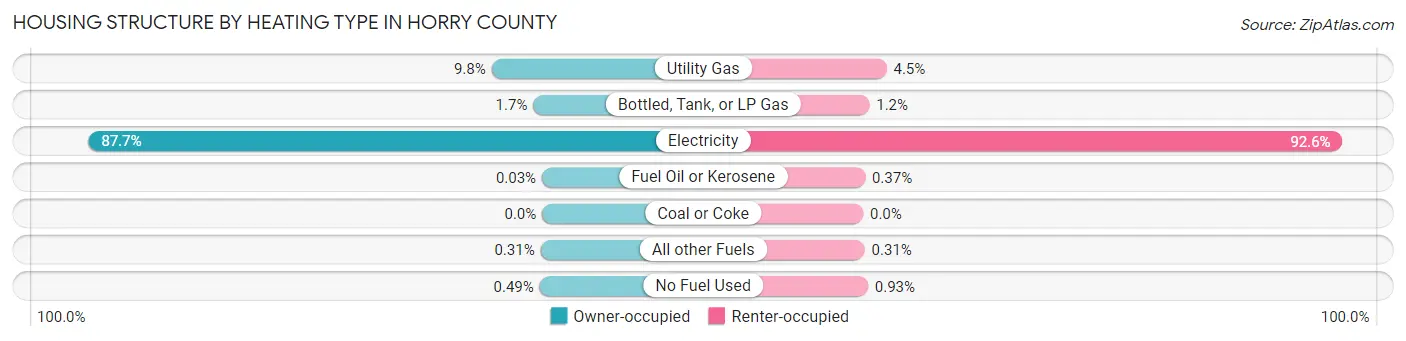
| Heating Type | Owner-occupied | Renter-occupied |
| Utility Gas | 10,454 (9.8%) | 1,603 (4.5%) |
| Bottled, Tank, or LP Gas | 1,829 (1.7%) | 429 (1.2%) |
| Electricity | 93,891 (87.7%) | 32,711 (92.6%) |
| Fuel Oil or Kerosene | 35 (0.0%) | 129 (0.4%) |
| Coal or Coke | 0 (0.0%) | 0 (0.0%) |
| All other Fuels | 336 (0.3%) | 111 (0.3%) |
| No Fuel Used | 525 (0.5%) | 330 (0.9%) |
| Total | 107,070 (100.0%) | 35,313 (100.0%) |
Household Vehicle Usage in Horry County
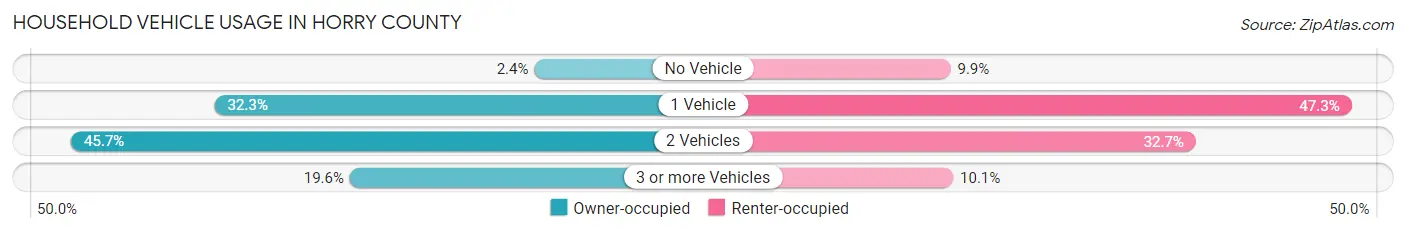
| Vehicles per Household | Owner-occupied | Renter-occupied |
| No Vehicle | 2,594 (2.4%) | 3,481 (9.9%) |
| 1 Vehicle | 34,548 (32.3%) | 16,701 (47.3%) |
| 2 Vehicles | 48,895 (45.7%) | 11,563 (32.7%) |
| 3 or more Vehicles | 21,033 (19.6%) | 3,568 (10.1%) |
| Total | 107,070 (100.0%) | 35,313 (100.0%) |
Real Estate & Mortgages in Horry County
Real Estate and Mortgage Overview in Horry County
| Characteristic | Without Mortgage | With Mortgage |
| Housing Units | 47,853 | 59,217 |
| Median Property Value | $212,300 | $248,300 |
| Median Household Income | $54,844 | $9,665 |
| Monthly Housing Costs | $450 | $2,600 |
| Real Estate Taxes | $703 | $1,361 |
Property Value by Mortgage Status in Horry County
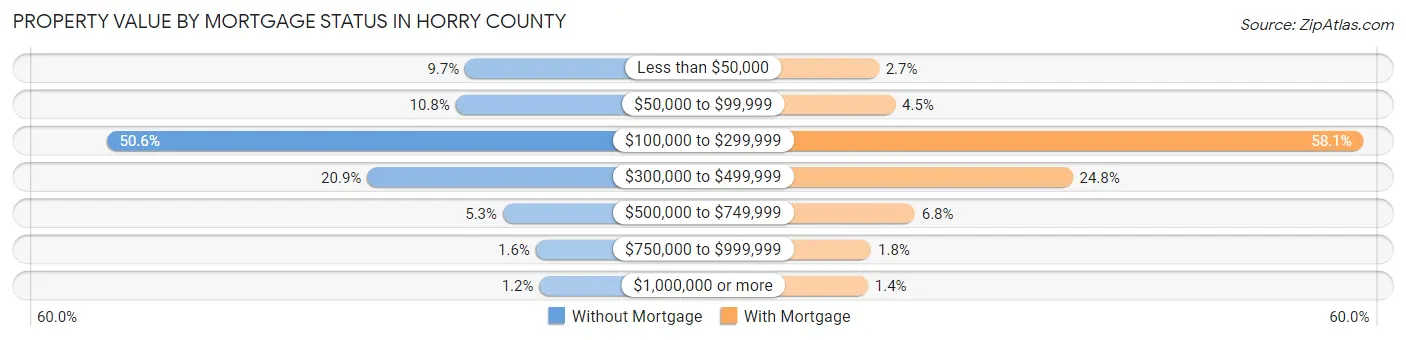
| Property Value | Without Mortgage | With Mortgage |
| Less than $50,000 | 4,623 (9.7%) | 1,571 (2.6%) |
| $50,000 to $99,999 | 5,142 (10.7%) | 2,677 (4.5%) |
| $100,000 to $299,999 | 24,233 (50.6%) | 34,383 (58.1%) |
| $300,000 to $499,999 | 9,976 (20.8%) | 14,686 (24.8%) |
| $500,000 to $749,999 | 2,556 (5.3%) | 4,008 (6.8%) |
| $750,000 to $999,999 | 759 (1.6%) | 1,056 (1.8%) |
| $1,000,000 or more | 564 (1.2%) | 836 (1.4%) |
| Total | 47,853 (100.0%) | 59,217 (100.0%) |
Household Income by Mortgage Status in Horry County
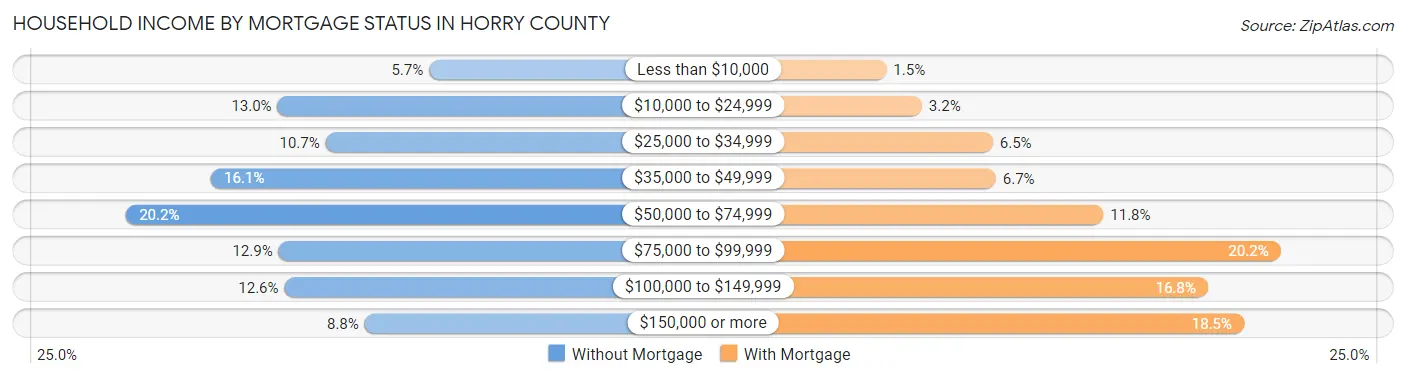
| Household Income | Without Mortgage | With Mortgage |
| Less than $10,000 | 2,748 (5.7%) | 871 (1.5%) |
| $10,000 to $24,999 | 6,200 (13.0%) | 1,871 (3.2%) |
| $25,000 to $34,999 | 5,105 (10.7%) | 3,871 (6.5%) |
| $35,000 to $49,999 | 7,716 (16.1%) | 3,953 (6.7%) |
| $50,000 to $74,999 | 9,648 (20.2%) | 6,988 (11.8%) |
| $75,000 to $99,999 | 6,178 (12.9%) | 11,984 (20.2%) |
| $100,000 to $149,999 | 6,044 (12.6%) | 9,933 (16.8%) |
| $150,000 or more | 4,214 (8.8%) | 10,952 (18.5%) |
| Total | 47,853 (100.0%) | 59,217 (100.0%) |
Property Value to Household Income Ratio in Horry County
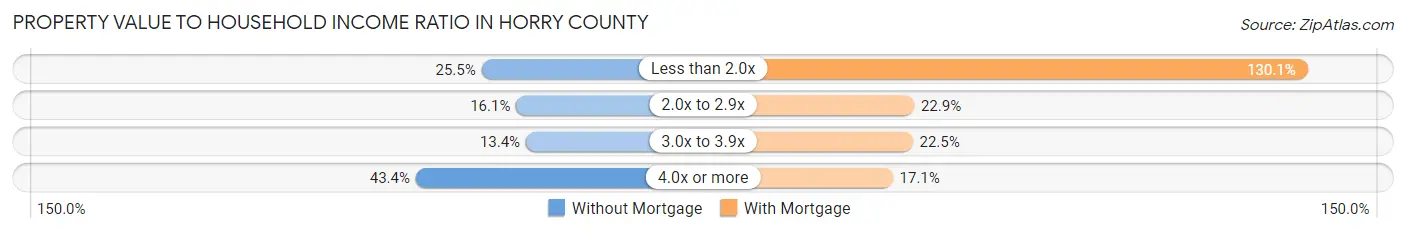
| Value-to-Income Ratio | Without Mortgage | With Mortgage |
| Less than 2.0x | 12,212 (25.5%) | 77,057 (130.1%) |
| 2.0x to 2.9x | 7,689 (16.1%) | 13,563 (22.9%) |
| 3.0x to 3.9x | 6,422 (13.4%) | 13,331 (22.5%) |
| 4.0x or more | 20,787 (43.4%) | 10,109 (17.1%) |
| Total | 47,853 (100.0%) | 59,217 (100.0%) |
Real Estate Taxes by Mortgage Status in Horry County
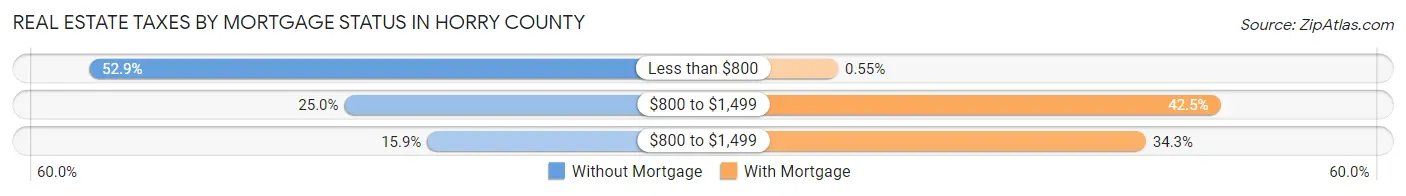
| Property Taxes | Without Mortgage | With Mortgage |
| Less than $800 | 25,326 (52.9%) | 323 (0.5%) |
| $800 to $1,499 | 11,942 (25.0%) | 25,136 (42.4%) |
| $800 to $1,499 | 7,599 (15.9%) | 20,299 (34.3%) |
| Total | 47,853 (100.0%) | 59,217 (100.0%) |
Health & Disability in Horry County
Health Insurance Coverage by Age in Horry County
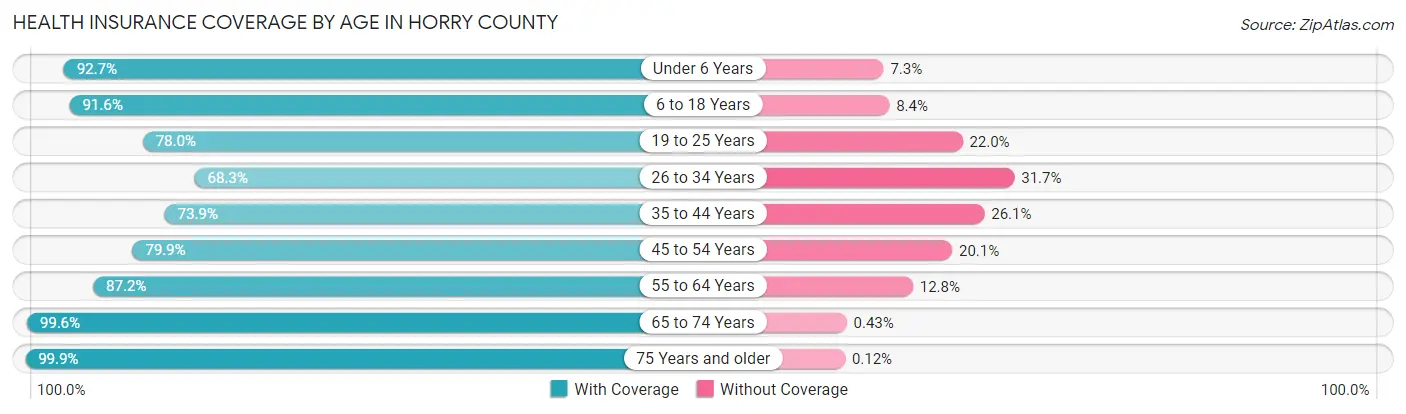
| Age Bracket | With Coverage | Without Coverage |
| Under 6 Years | 17,112 (92.7%) | 1,348 (7.3%) |
| 6 to 18 Years | 44,824 (91.6%) | 4,100 (8.4%) |
| 19 to 25 Years | 21,226 (78.0%) | 5,999 (22.0%) |
| 26 to 34 Years | 23,297 (68.3%) | 10,811 (31.7%) |
| 35 to 44 Years | 28,195 (73.9%) | 9,959 (26.1%) |
| 45 to 54 Years | 34,090 (79.9%) | 8,575 (20.1%) |
| 55 to 64 Years | 49,165 (87.2%) | 7,201 (12.8%) |
| 65 to 74 Years | 58,491 (99.6%) | 254 (0.4%) |
| 75 Years and older | 30,264 (99.9%) | 37 (0.1%) |
| Total | 306,664 (86.4%) | 48,284 (13.6%) |
Health Insurance Coverage by Citizenship Status in Horry County
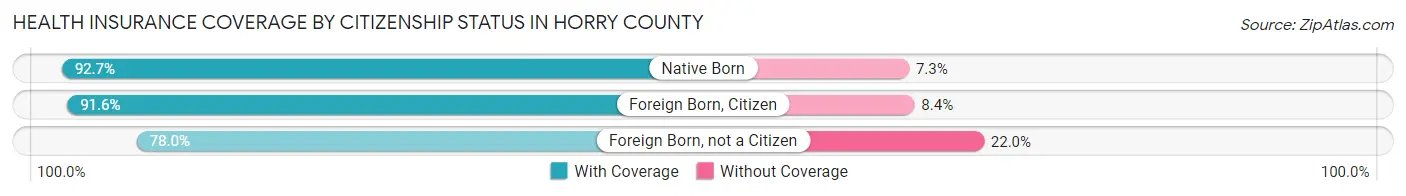
| Citizenship Status | With Coverage | Without Coverage |
| Native Born | 17,112 (92.7%) | 1,348 (7.3%) |
| Foreign Born, Citizen | 44,824 (91.6%) | 4,100 (8.4%) |
| Foreign Born, not a Citizen | 21,226 (78.0%) | 5,999 (22.0%) |
Health Insurance Coverage by Household Income in Horry County
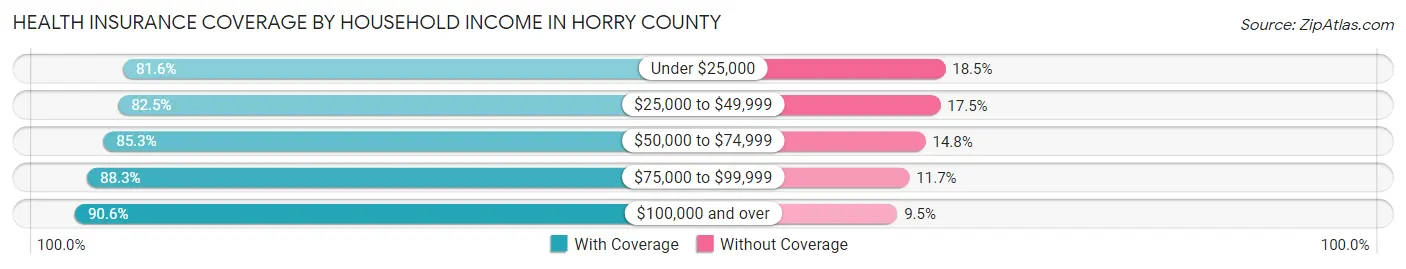
| Household Income | With Coverage | Without Coverage |
| Under $25,000 | 35,102 (81.6%) | 7,941 (18.4%) |
| $25,000 to $49,999 | 61,113 (82.5%) | 12,998 (17.5%) |
| $50,000 to $74,999 | 59,922 (85.3%) | 10,366 (14.7%) |
| $75,000 to $99,999 | 47,330 (88.3%) | 6,287 (11.7%) |
| $100,000 and over | 99,347 (90.5%) | 10,363 (9.5%) |
Public vs Private Health Insurance Coverage by Age in Horry County
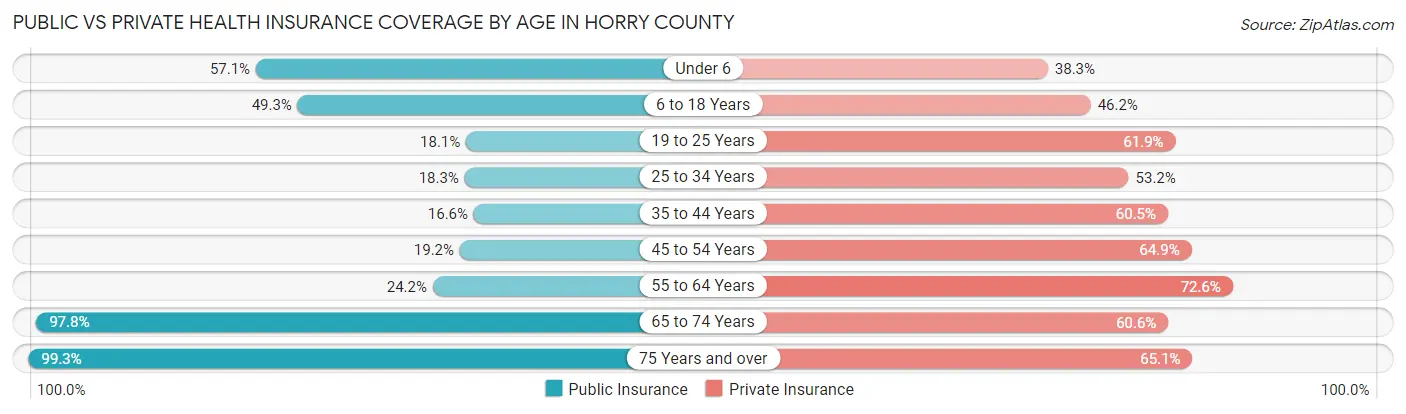
| Age Bracket | Public Insurance | Private Insurance |
| Under 6 | 10,533 (57.1%) | 7,061 (38.3%) |
| 6 to 18 Years | 24,124 (49.3%) | 22,604 (46.2%) |
| 19 to 25 Years | 4,915 (18.0%) | 16,858 (61.9%) |
| 25 to 34 Years | 6,244 (18.3%) | 18,159 (53.2%) |
| 35 to 44 Years | 6,338 (16.6%) | 23,092 (60.5%) |
| 45 to 54 Years | 8,195 (19.2%) | 27,692 (64.9%) |
| 55 to 64 Years | 13,658 (24.2%) | 40,891 (72.6%) |
| 65 to 74 Years | 57,468 (97.8%) | 35,586 (60.6%) |
| 75 Years and over | 30,089 (99.3%) | 19,717 (65.1%) |
| Total | 161,564 (45.5%) | 211,660 (59.6%) |
Disability Status by Sex by Age in Horry County
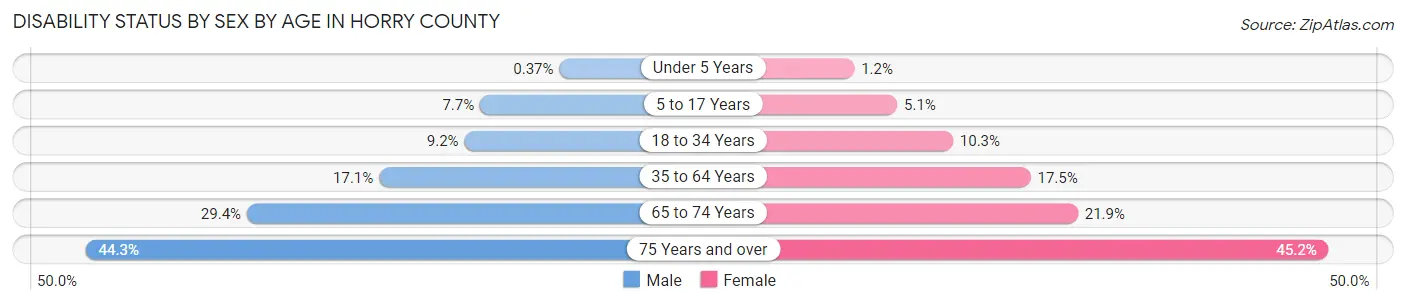
| Age Bracket | Male | Female |
| Under 5 Years | 29 (0.4%) | 87 (1.1%) |
| 5 to 17 Years | 1,827 (7.7%) | 1,159 (5.1%) |
| 18 to 34 Years | 3,035 (9.2%) | 3,506 (10.3%) |
| 35 to 64 Years | 11,175 (17.1%) | 12,582 (17.5%) |
| 65 to 74 Years | 8,268 (29.4%) | 6,699 (21.9%) |
| 75 Years and over | 6,204 (44.3%) | 7,368 (45.2%) |
Disability Class by Sex by Age in Horry County
Disability Class: Hearing Difficulty
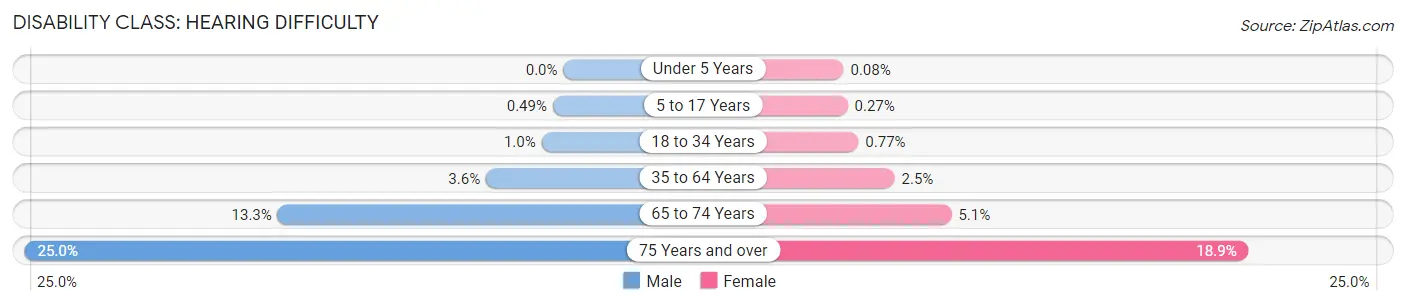
| Age Bracket | Male | Female |
| Under 5 Years | 0 (0.0%) | 6 (0.1%) |
| 5 to 17 Years | 115 (0.5%) | 60 (0.3%) |
| 18 to 34 Years | 334 (1.0%) | 262 (0.8%) |
| 35 to 64 Years | 2,349 (3.6%) | 1,759 (2.5%) |
| 65 to 74 Years | 3,732 (13.3%) | 1,558 (5.1%) |
| 75 Years and over | 3,498 (25.0%) | 3,077 (18.9%) |
Disability Class: Vision Difficulty
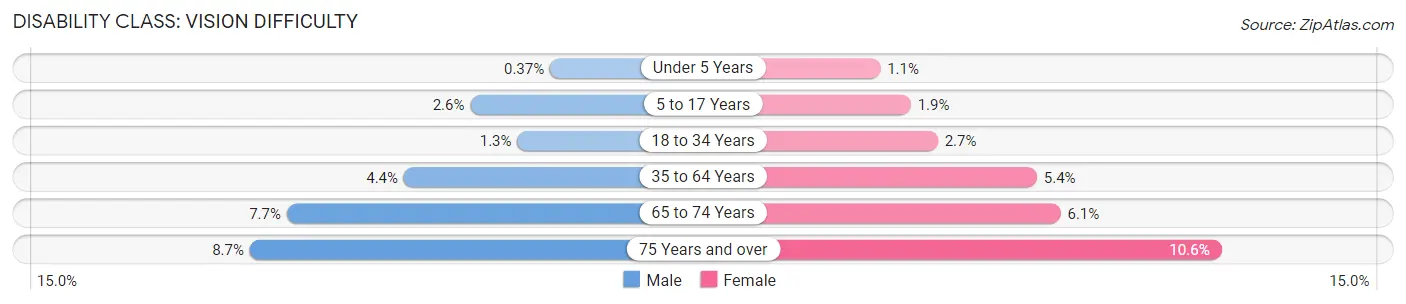
| Age Bracket | Male | Female |
| Under 5 Years | 29 (0.4%) | 81 (1.1%) |
| 5 to 17 Years | 613 (2.6%) | 434 (1.9%) |
| 18 to 34 Years | 422 (1.3%) | 907 (2.7%) |
| 35 to 64 Years | 2,902 (4.4%) | 3,900 (5.4%) |
| 65 to 74 Years | 2,167 (7.7%) | 1,863 (6.1%) |
| 75 Years and over | 1,221 (8.7%) | 1,724 (10.6%) |
Disability Class: Cognitive Difficulty
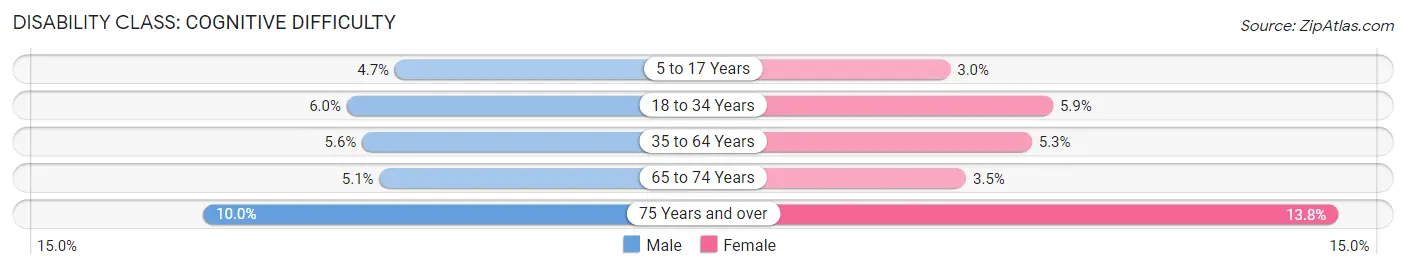
| Age Bracket | Male | Female |
| 5 to 17 Years | 1,108 (4.7%) | 682 (3.0%) |
| 18 to 34 Years | 1,992 (6.0%) | 2,000 (5.9%) |
| 35 to 64 Years | 3,663 (5.6%) | 3,803 (5.3%) |
| 65 to 74 Years | 1,442 (5.1%) | 1,060 (3.5%) |
| 75 Years and over | 1,403 (10.0%) | 2,253 (13.8%) |
Disability Class: Ambulatory Difficulty
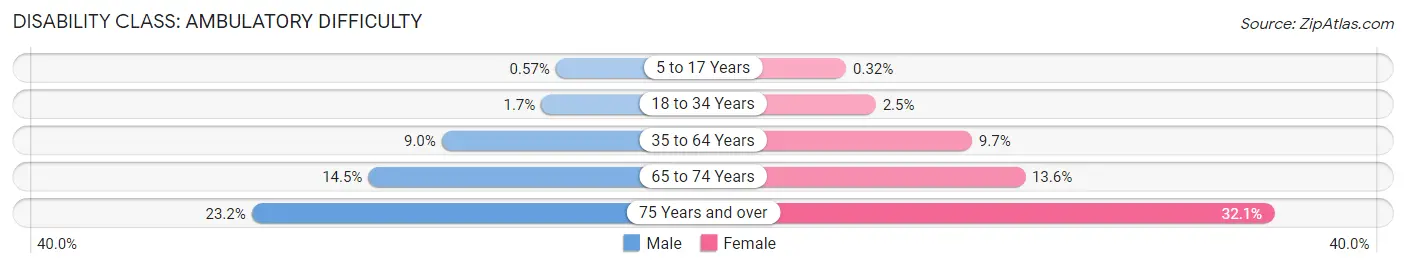
| Age Bracket | Male | Female |
| 5 to 17 Years | 135 (0.6%) | 72 (0.3%) |
| 18 to 34 Years | 546 (1.7%) | 856 (2.5%) |
| 35 to 64 Years | 5,909 (9.0%) | 6,935 (9.7%) |
| 65 to 74 Years | 4,079 (14.5%) | 4,161 (13.6%) |
| 75 Years and over | 3,239 (23.2%) | 5,231 (32.1%) |
Disability Class: Self-Care Difficulty
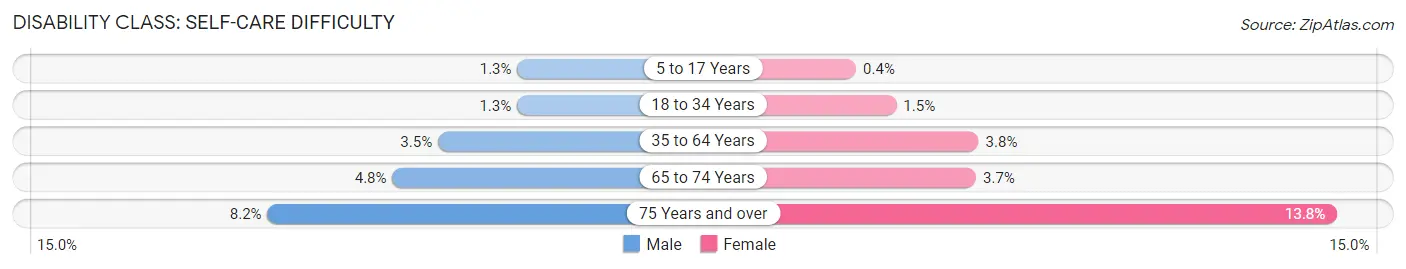
| Age Bracket | Male | Female |
| 5 to 17 Years | 302 (1.3%) | 90 (0.4%) |
| 18 to 34 Years | 425 (1.3%) | 517 (1.5%) |
| 35 to 64 Years | 2,280 (3.5%) | 2,740 (3.8%) |
| 65 to 74 Years | 1,339 (4.8%) | 1,144 (3.7%) |
| 75 Years and over | 1,153 (8.2%) | 2,249 (13.8%) |
Technology Access in Horry County
Computing Device Access in Horry County
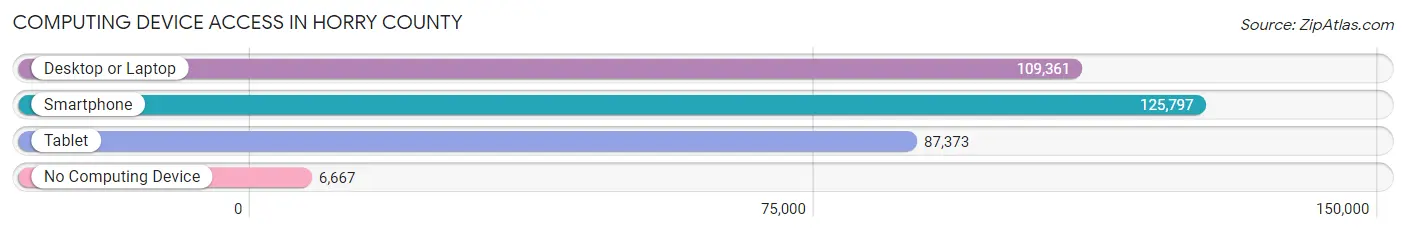
| Device Type | # Households | % Households |
| Desktop or Laptop | 109,361 | 76.8% |
| Smartphone | 125,797 | 88.3% |
| Tablet | 87,373 | 61.4% |
| No Computing Device | 6,667 | 4.7% |
| Total | 142,383 | 100.0% |
Internet Access in Horry County
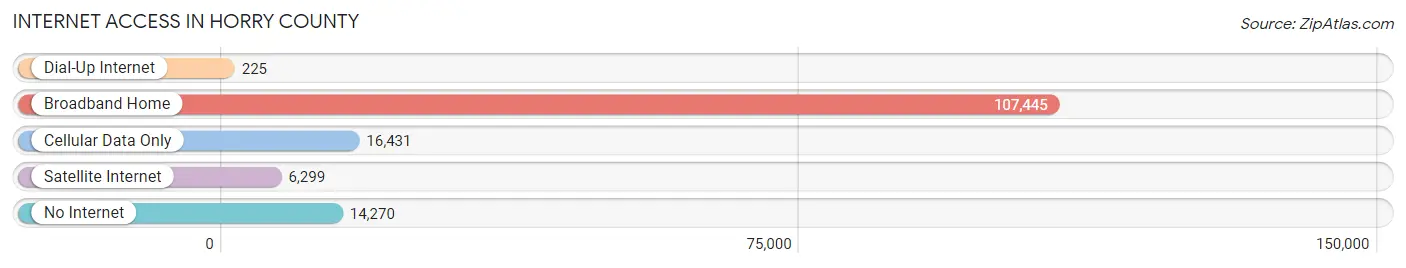
| Internet Type | # Households | % Households |
| Dial-Up Internet | 225 | 0.2% |
| Broadband Home | 107,445 | 75.5% |
| Cellular Data Only | 16,431 | 11.5% |
| Satellite Internet | 6,299 | 4.4% |
| No Internet | 14,270 | 10.0% |
| Total | 142,383 | 100.0% |
Horry County Summary
Horry County, South Carolina is located in the northeastern corner of the state and is the largest county in South Carolina by land area. It is bordered by North Carolina to the north, the Atlantic Ocean to the east, Georgetown County to the south, and Marion and Florence counties to the west. The county seat is Conway, and the largest city is Myrtle Beach.
History
Horry County was formed in 1801 from parts of Georgetown and Marion counties. It was named for Revolutionary War hero Peter Horry, who was a major general in the South Carolina militia. The county was originally part of the Waccamaw Neck, a strip of land that extended from the Waccamaw River to the Atlantic Ocean. The area was first settled by Europeans in the early 1700s, and the county was officially established in 1801.
The county was largely rural until the 1950s, when the area began to experience a population boom due to the development of Myrtle Beach as a tourist destination. The county has since become a popular vacation spot, and the population has grown steadily over the years.
Geography
Horry County covers an area of 1,255 square miles, making it the largest county in South Carolina by land area. The county is located in the northeastern corner of the state, and is bordered by North Carolina to the north, the Atlantic Ocean to the east, Georgetown County to the south, and Marion and Florence counties to the west.
The county is divided into two distinct regions: the coastal plain and the Pee Dee region. The coastal plain is located along the Atlantic Ocean and is characterized by flat, sandy terrain. The Pee Dee region is located inland and is characterized by rolling hills and forests.
The county is home to several rivers, including the Waccamaw, Little Pee Dee, and Lumber rivers. The Waccamaw River forms the northern border of the county, and the Little Pee Dee and Lumber rivers flow through the county.
Economy
Horry County has a diverse economy, with a mix of agriculture, manufacturing, tourism, and services. Agriculture is the largest sector of the economy, with crops such as tobacco, soybeans, corn, and cotton being grown in the county. Manufacturing is also an important part of the economy, with companies such as International Paper, Sonoco Products, and Horry Telephone Cooperative having a presence in the county.
Tourism is a major driver of the economy, with Myrtle Beach being the most popular destination. The county is home to several popular attractions, including the Myrtle Beach Boardwalk, Broadway at the Beach, and the Myrtle Beach SkyWheel.
Demographics
As of the 2010 census, Horry County had a population of 289,650. The population is racially diverse, with the largest racial group being white (77.3%), followed by African American (15.2%), Hispanic or Latino (4.2%), and Asian (2.2%).
The median household income in the county is $45,890, and the median home value is $179,400. The unemployment rate is 5.2%, and the poverty rate is 13.2%.
Horry County is home to several colleges and universities, including Coastal Carolina University, Horry-Georgetown Technical College, and the University of South Carolina-Conway. The county is also home to several military bases, including the Marine Corps Recruit Depot Parris Island and the Air Force Base at Shaw Air Force Base.
Common Questions
What is Per Capita Income in Horry County?
Per Capita income in Horry County is $34,147.
What is the Median Family Income in Horry County?
Median Family Income in Horry County is $72,285.
What is the Median Household income in Horry County?
Median Household Income in Horry County is $59,880.
What is Income or Wage Gap in Horry County?
Income or Wage Gap in Horry County is 19.8%.
Women in Horry County earn 80.2 cents for every dollar earned by a man.
What is Family Income Deficit in Horry County?
Family Income Deficit in Horry County is $10,463.
Families that are below poverty line in Horry County earn $10,463 less on average than the poverty threshold level.
What is Inequality or Gini Index in Horry County?
Inequality or Gini Index in Horry County is 0.45.
What is the Total Population of Horry County?
Total Population of Horry County is 356,578.
What is the Total Male Population of Horry County?
Total Male Population of Horry County is 173,106.
What is the Total Female Population of Horry County?
Total Female Population of Horry County is 183,472.
What is the Ratio of Males per 100 Females in Horry County?
There are 94.35 Males per 100 Females in Horry County.
What is the Ratio of Females per 100 Males in Horry County?
There are 105.99 Females per 100 Males in Horry County.
What is the Median Population Age in Horry County?
Median Population Age in Horry County is 47.6 Years.
What is the Average Family Size in Horry County
Average Family Size in Horry County is 3.0 People.
What is the Average Household Size in Horry County
Average Household Size in Horry County is 2.5 People.
How Large is the Labor Force in Horry County?
There are 164,084 People in the Labor Forcein in Horry County.
What is the Percentage of People in the Labor Force in Horry County?
54.3% of People are in the Labor Force in Horry County.
What is the Unemployment Rate in Horry County?
Unemployment Rate in Horry County is 5.6%.