Georgetown County, SC Map & Demographics
Georgetown County Overview
$39,403
PER CAPITA INCOME
$71,440
AVG FAMILY INCOME
$59,782
AVG HOUSEHOLD INCOME
36.0%
WAGE / INCOME GAP [ % ]
64.0¢/ $1
WAGE / INCOME GAP [ $ ]
$9,056
FAMILY INCOME DEFICIT
0.49
INEQUALITY / GINI INDEX
63,594
TOTAL POPULATION
30,536
MALE POPULATION
33,058
FEMALE POPULATION
92.37
MALES / 100 FEMALES
108.26
FEMALES / 100 MALES
51.0
MEDIAN AGE
3.0
AVG FAMILY SIZE
2.4
AVG HOUSEHOLD SIZE
27,446
LABOR FORCE [ PEOPLE ]
51.1%
PERCENT IN LABOR FORCE
5.0%
UNEMPLOYMENT RATE
Georgetown County Area Codes
Income in Georgetown County
Income Overview in Georgetown County
Per Capita Income in Georgetown County is $39,403, while median incomes of families and households are $71,440 and $59,782 respectively.
| Characteristic | Number | Measure |
| Per Capita Income | 63,594 | $39,403 |
| Median Family Income | 17,942 | $71,440 |
| Mean Family Income | 17,942 | $105,116 |
| Median Household Income | 26,029 | $59,782 |
| Mean Household Income | 26,029 | $88,858 |
| Income Deficit | 17,942 | $9,056 |
| Wage / Income Gap (%) | 63,594 | 36.02% |
| Wage / Income Gap ($) | 63,594 | 63.98¢ per $1 |
| Gini / Inequality Index | 63,594 | 0.49 |
Earnings by Sex in Georgetown County
Average Earnings in Georgetown County are $31,562, $38,693 for men and $24,755 for women, a difference of 36.0%.
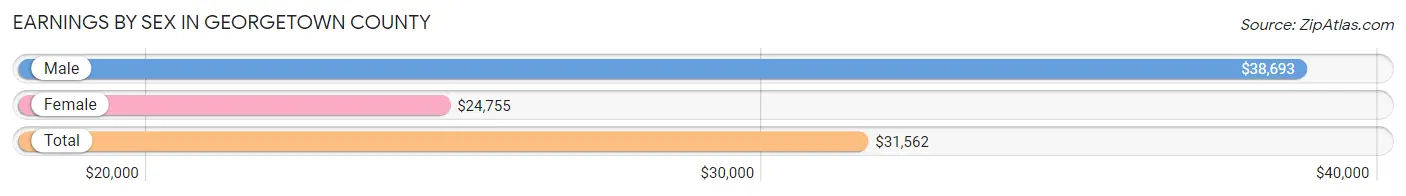
| Sex | Number | Average Earnings |
| Male | 14,279 (49.4%) | $38,693 |
| Female | 14,625 (50.6%) | $24,755 |
| Total | 28,904 (100.0%) | $31,562 |
Earnings by Sex by Income Bracket in Georgetown County
The most common earnings brackets in Georgetown County are $100,000+ for men (2,537 | 17.8%) and $10,000 to $12,499 for women (1,111 | 7.6%).
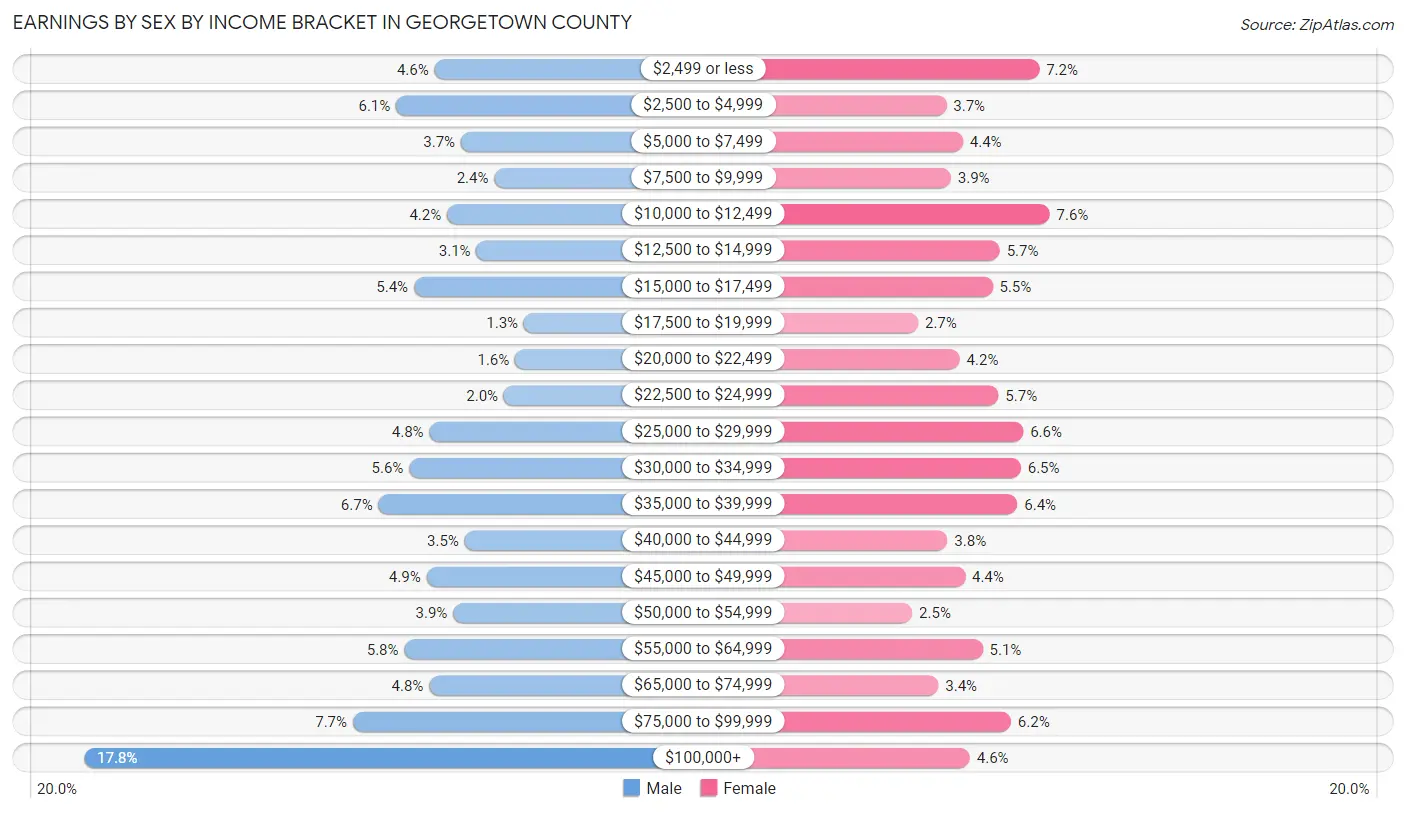
| Income | Male | Female |
| $2,499 or less | 662 (4.6%) | 1,055 (7.2%) |
| $2,500 to $4,999 | 868 (6.1%) | 546 (3.7%) |
| $5,000 to $7,499 | 521 (3.6%) | 636 (4.3%) |
| $7,500 to $9,999 | 343 (2.4%) | 571 (3.9%) |
| $10,000 to $12,499 | 595 (4.2%) | 1,111 (7.6%) |
| $12,500 to $14,999 | 438 (3.1%) | 838 (5.7%) |
| $15,000 to $17,499 | 773 (5.4%) | 798 (5.5%) |
| $17,500 to $19,999 | 184 (1.3%) | 390 (2.7%) |
| $20,000 to $22,499 | 232 (1.6%) | 619 (4.2%) |
| $22,500 to $24,999 | 292 (2.0%) | 830 (5.7%) |
| $25,000 to $29,999 | 690 (4.8%) | 967 (6.6%) |
| $30,000 to $34,999 | 798 (5.6%) | 953 (6.5%) |
| $35,000 to $39,999 | 962 (6.7%) | 934 (6.4%) |
| $40,000 to $44,999 | 501 (3.5%) | 552 (3.8%) |
| $45,000 to $49,999 | 706 (4.9%) | 648 (4.4%) |
| $50,000 to $54,999 | 562 (3.9%) | 358 (2.5%) |
| $55,000 to $64,999 | 824 (5.8%) | 745 (5.1%) |
| $65,000 to $74,999 | 691 (4.8%) | 501 (3.4%) |
| $75,000 to $99,999 | 1,100 (7.7%) | 899 (6.1%) |
| $100,000+ | 2,537 (17.8%) | 674 (4.6%) |
| Total | 14,279 (100.0%) | 14,625 (100.0%) |
Earnings by Sex by Educational Attainment in Georgetown County
Average earnings in Georgetown County are $46,056 for men and $28,479 for women, a difference of 38.2%. Men with an educational attainment of graduate degree enjoy the highest average annual earnings of $107,500, while those with less than high school education earn the least with $22,121. Women with an educational attainment of graduate degree earn the most with the average annual earnings of $54,393, while those with less than high school education have the smallest earnings of $12,545.
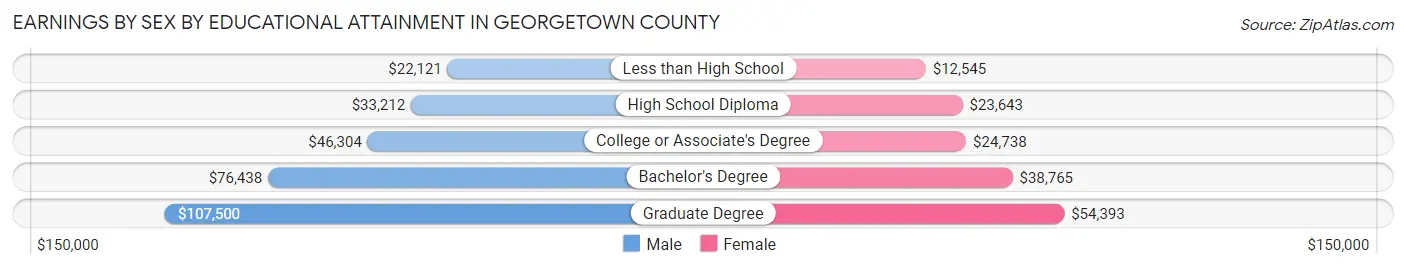
| Educational Attainment | Male Income | Female Income |
| Less than High School | $22,121 | $12,545 |
| High School Diploma | $33,212 | $23,643 |
| College or Associate's Degree | $46,304 | $24,738 |
| Bachelor's Degree | $76,438 | $38,765 |
| Graduate Degree | $107,500 | $54,393 |
| Total | $46,056 | $28,479 |
Family Income in Georgetown County
Family Income Brackets in Georgetown County
According to the Georgetown County family income data, there are 3,481 families falling into the $50,000 to $74,999 income range, which is the most common income bracket and makes up 19.4% of all families. Conversely, the $10,000 to $14,999 income bracket is the least frequent group with only 466 families (2.6%) belonging to this category.
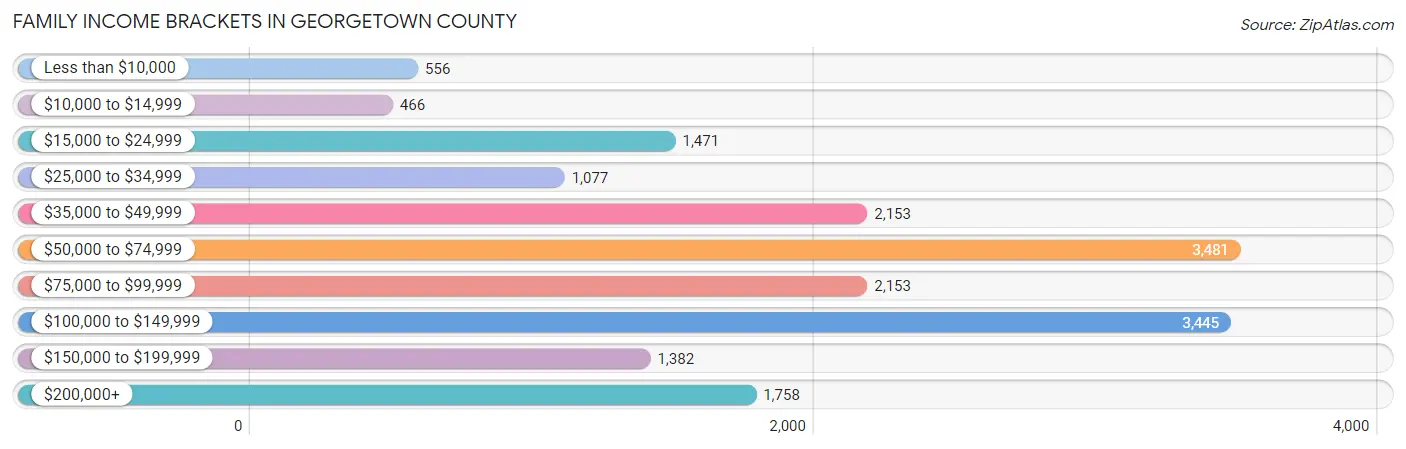
| Income Bracket | # Families | % Families |
| Less than $10,000 | 556 | 3.1% |
| $10,000 to $14,999 | 466 | 2.6% |
| $15,000 to $24,999 | 1,471 | 8.2% |
| $25,000 to $34,999 | 1,077 | 6.0% |
| $35,000 to $49,999 | 2,153 | 12.0% |
| $50,000 to $74,999 | 3,481 | 19.4% |
| $75,000 to $99,999 | 2,153 | 12.0% |
| $100,000 to $149,999 | 3,445 | 19.2% |
| $150,000 to $199,999 | 1,382 | 7.7% |
| $200,000+ | 1,758 | 9.8% |
Family Income by Famaliy Size in Georgetown County
7+ person families (102 | 0.6%) account for the highest median family income in Georgetown County with $110,714 per family, while 2-person families (10,848 | 60.5%) have the highest median income of $35,232 per family member.
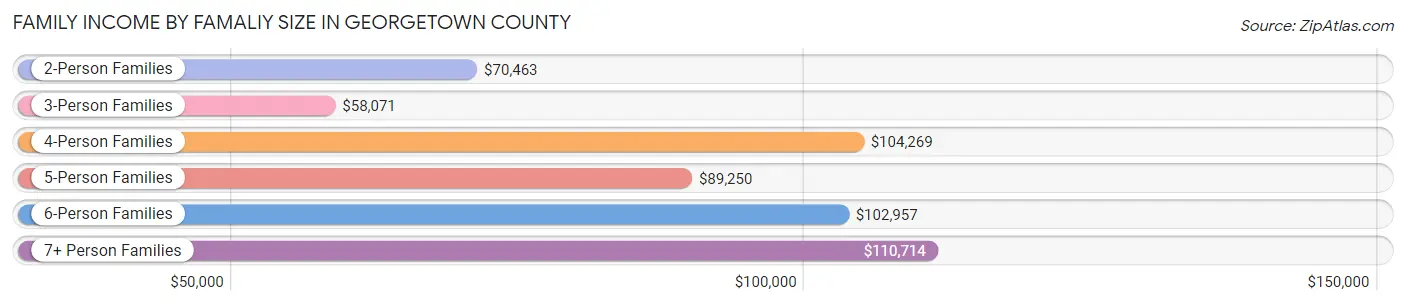
| Income Bracket | # Families | Median Income |
| 2-Person Families | 10,848 (60.5%) | $70,463 |
| 3-Person Families | 3,573 (19.9%) | $58,071 |
| 4-Person Families | 2,408 (13.4%) | $104,269 |
| 5-Person Families | 798 (4.4%) | $89,250 |
| 6-Person Families | 213 (1.2%) | $102,957 |
| 7+ Person Families | 102 (0.6%) | $110,714 |
| Total | 17,942 (100.0%) | $71,440 |
Family Income by Number of Earners in Georgetown County
The median family income in Georgetown County is $71,440, with families comprising 3+ earners (1,483) having the highest median family income of $131,010, while families with 1 earner (6,827) have the lowest median family income of $53,154, accounting for 8.3% and 38.1% of families, respectively.
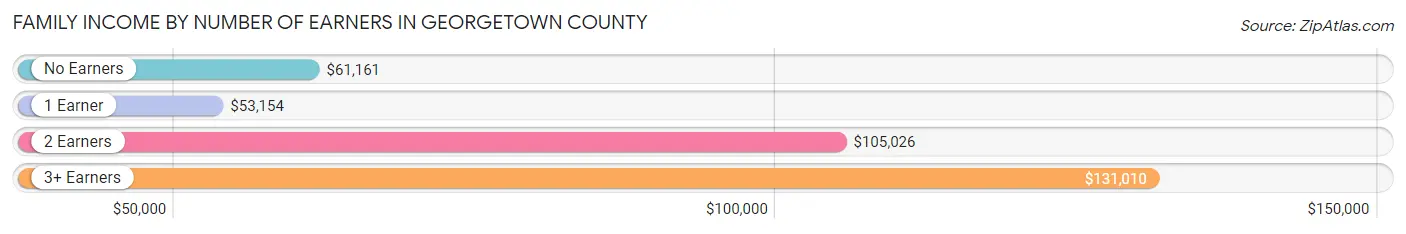
| Number of Earners | # Families | Median Income |
| No Earners | 4,758 (26.5%) | $61,161 |
| 1 Earner | 6,827 (38.1%) | $53,154 |
| 2 Earners | 4,874 (27.2%) | $105,026 |
| 3+ Earners | 1,483 (8.3%) | $131,010 |
| Total | 17,942 (100.0%) | $71,440 |
Household Income in Georgetown County
Household Income Brackets in Georgetown County
With 5,154 households falling in the category, the $50,000 to $74,999 income range is the most frequent in Georgetown County, accounting for 19.8% of all households. In contrast, only 1,223 households (4.7%) fall into the $10,000 to $14,999 income bracket, making it the least populous group.
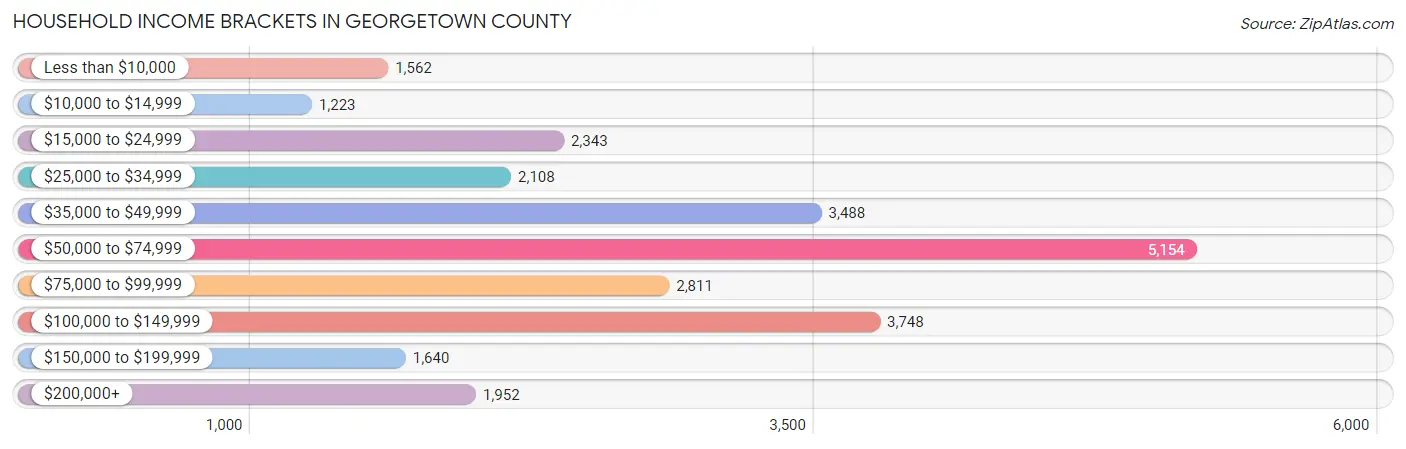
| Income Bracket | # Households | % Households |
| Less than $10,000 | 1,562 | 6.0% |
| $10,000 to $14,999 | 1,223 | 4.7% |
| $15,000 to $24,999 | 2,343 | 9.0% |
| $25,000 to $34,999 | 2,108 | 8.1% |
| $35,000 to $49,999 | 3,488 | 13.4% |
| $50,000 to $74,999 | 5,154 | 19.8% |
| $75,000 to $99,999 | 2,811 | 10.8% |
| $100,000 to $149,999 | 3,748 | 14.4% |
| $150,000 to $199,999 | 1,640 | 6.3% |
| $200,000+ | 1,952 | 7.5% |
Household Income by Householder Age in Georgetown County
The median household income in Georgetown County is $59,782, with the highest median household income of $62,720 found in the 45 to 64 years age bracket for the primary householder. A total of 9,182 households (35.3%) fall into this category. Meanwhile, the 15 to 24 years age bracket for the primary householder has the lowest median household income of $39,250, with 336 households (1.3%) in this group.
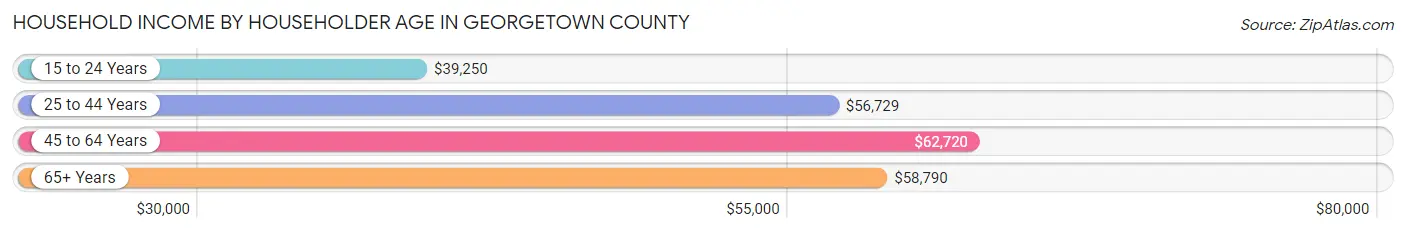
| Income Bracket | # Households | Median Income |
| 15 to 24 Years | 336 (1.3%) | $39,250 |
| 25 to 44 Years | 4,831 (18.6%) | $56,729 |
| 45 to 64 Years | 9,182 (35.3%) | $62,720 |
| 65+ Years | 11,680 (44.9%) | $58,790 |
| Total | 26,029 (100.0%) | $59,782 |
Poverty in Georgetown County
Income Below Poverty by Sex and Age in Georgetown County
With 15.4% poverty level for males and 16.5% for females among the residents of Georgetown County, under 5 year old males and under 5 year old females are the most vulnerable to poverty, with 666 males (46.8%) and 514 females (41.5%) in their respective age groups living below the poverty level.
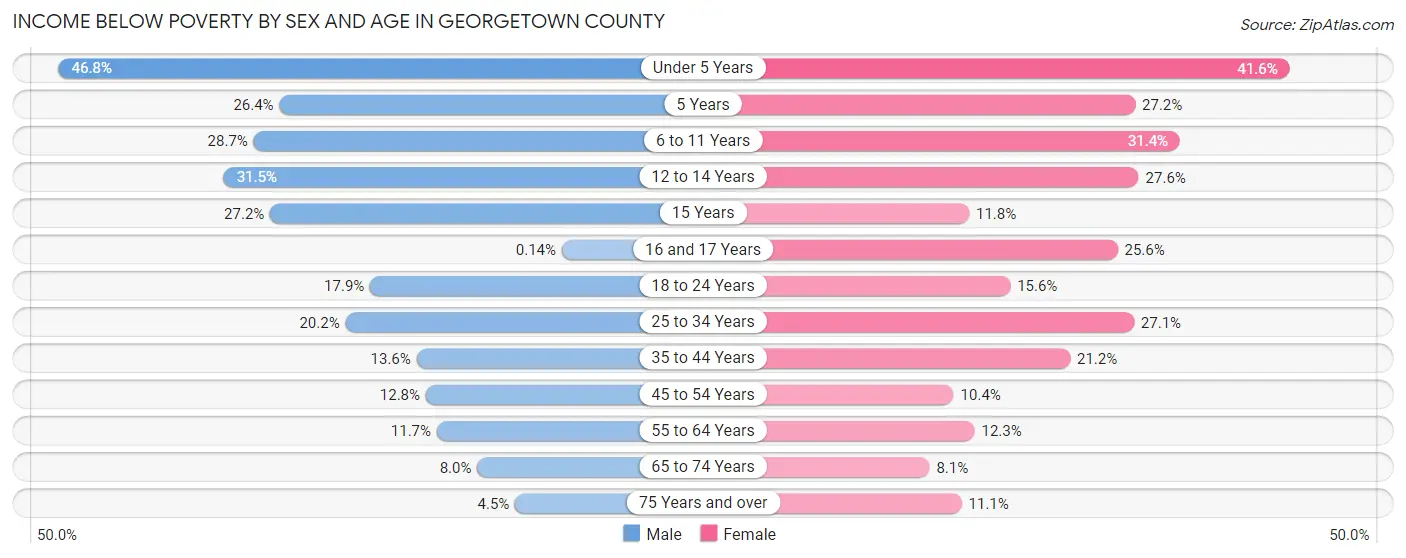
| Age Bracket | Male | Female |
| Under 5 Years | 666 (46.8%) | 514 (41.5%) |
| 5 Years | 44 (26.4%) | 92 (27.2%) |
| 6 to 11 Years | 553 (28.7%) | 526 (31.4%) |
| 12 to 14 Years | 342 (31.5%) | 284 (27.6%) |
| 15 Years | 148 (27.2%) | 47 (11.8%) |
| 16 and 17 Years | 1 (0.1%) | 120 (25.6%) |
| 18 to 24 Years | 415 (17.9%) | 318 (15.6%) |
| 25 to 34 Years | 577 (20.2%) | 839 (27.1%) |
| 35 to 44 Years | 387 (13.6%) | 680 (21.2%) |
| 45 to 54 Years | 421 (12.8%) | 402 (10.4%) |
| 55 to 64 Years | 546 (11.7%) | 677 (12.3%) |
| 65 to 74 Years | 413 (8.0%) | 499 (8.1%) |
| 75 Years and over | 141 (4.5%) | 426 (11.1%) |
| Total | 4,654 (15.4%) | 5,424 (16.5%) |
Income Above Poverty by Sex and Age in Georgetown County
According to the poverty statistics in Georgetown County, males aged 16 and 17 years and females aged 65 to 74 years are the age groups that are most secure financially, with 99.9% of males and 91.9% of females in these age groups living above the poverty line.
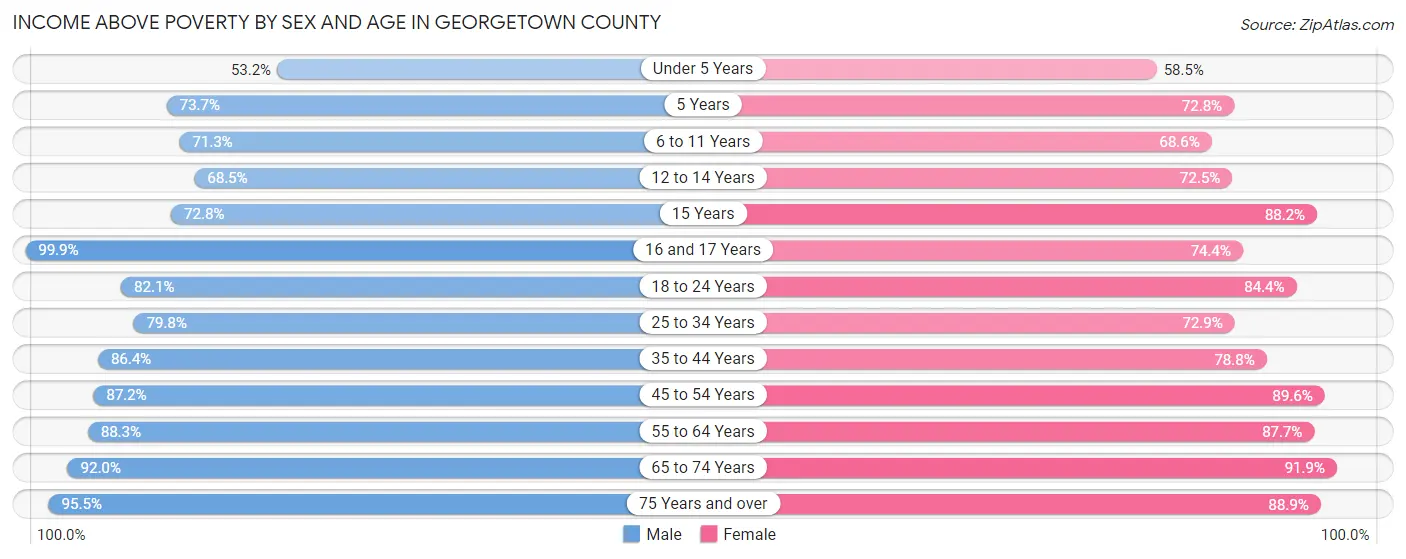
| Age Bracket | Male | Female |
| Under 5 Years | 756 (53.2%) | 723 (58.5%) |
| 5 Years | 123 (73.7%) | 246 (72.8%) |
| 6 to 11 Years | 1,371 (71.3%) | 1,150 (68.6%) |
| 12 to 14 Years | 743 (68.5%) | 747 (72.5%) |
| 15 Years | 396 (72.8%) | 351 (88.2%) |
| 16 and 17 Years | 732 (99.9%) | 349 (74.4%) |
| 18 to 24 Years | 1,899 (82.1%) | 1,717 (84.4%) |
| 25 to 34 Years | 2,277 (79.8%) | 2,256 (72.9%) |
| 35 to 44 Years | 2,454 (86.4%) | 2,530 (78.8%) |
| 45 to 54 Years | 2,879 (87.2%) | 3,471 (89.6%) |
| 55 to 64 Years | 4,104 (88.3%) | 4,820 (87.7%) |
| 65 to 74 Years | 4,756 (92.0%) | 5,629 (91.9%) |
| 75 Years and over | 3,014 (95.5%) | 3,404 (88.9%) |
| Total | 25,504 (84.6%) | 27,393 (83.5%) |
Income Below Poverty Among Married-Couple Families in Georgetown County
The poverty statistics for married-couple families in Georgetown County show that 3.1% or 402 of the total 13,012 families live below the poverty line. Families with 3 or 4 children have the highest poverty rate of 16.1%, comprising of 52 families. On the other hand, families with 5 or more children have the lowest poverty rate of 0.0%, which includes 0 families.
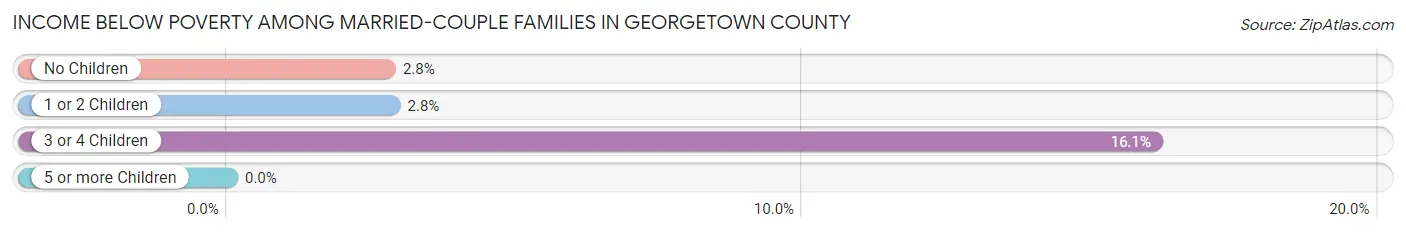
| Children | Above Poverty | Below Poverty |
| No Children | 9,869 (97.3%) | 279 (2.8%) |
| 1 or 2 Children | 2,438 (97.2%) | 71 (2.8%) |
| 3 or 4 Children | 271 (83.9%) | 52 (16.1%) |
| 5 or more Children | 32 (100.0%) | 0 (0.0%) |
| Total | 12,610 (96.9%) | 402 (3.1%) |
Income Below Poverty Among Single-Parent Households in Georgetown County
According to the poverty data in Georgetown County, 33.9% or 467 single-father households and 35.2% or 1,251 single-mother households are living below the poverty line. Among single-father households, those with 3 or 4 children have the highest poverty rate, with 236 households (67.2%) experiencing poverty. Likewise, among single-mother households, those with 3 or 4 children have the highest poverty rate, with 162 households (61.6%) falling below the poverty line.
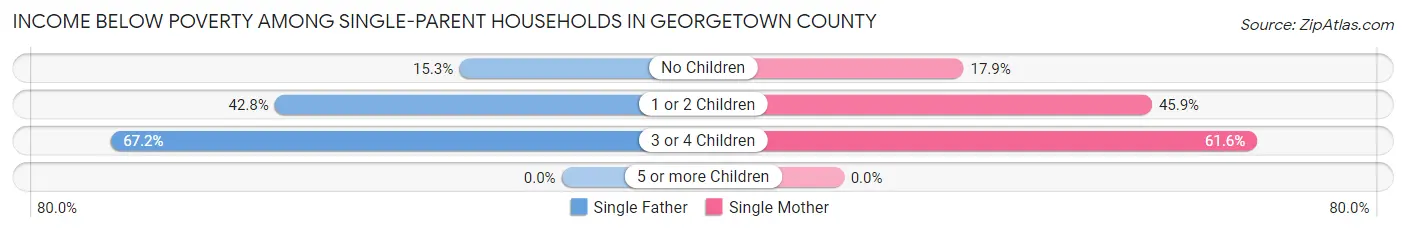
| Children | Single Father | Single Mother |
| No Children | 110 (15.3%) | 269 (17.9%) |
| 1 or 2 Children | 121 (42.8%) | 820 (45.9%) |
| 3 or 4 Children | 236 (67.2%) | 162 (61.6%) |
| 5 or more Children | 0 (0.0%) | 0 (0.0%) |
| Total | 467 (33.9%) | 1,251 (35.2%) |
Income Below Poverty Among Married-Couple vs Single-Parent Households in Georgetown County
The poverty data for Georgetown County shows that 402 of the married-couple family households (3.1%) and 1,718 of the single-parent households (34.8%) are living below the poverty level. Within the married-couple family households, those with 3 or 4 children have the highest poverty rate, with 52 households (16.1%) falling below the poverty line. Among the single-parent households, those with 3 or 4 children have the highest poverty rate, with 398 household (64.8%) living below poverty.
| Children | Married-Couple Families | Single-Parent Households |
| No Children | 279 (2.8%) | 379 (17.0%) |
| 1 or 2 Children | 71 (2.8%) | 941 (45.5%) |
| 3 or 4 Children | 52 (16.1%) | 398 (64.8%) |
| 5 or more Children | 0 (0.0%) | 0 (0.0%) |
| Total | 402 (3.1%) | 1,718 (34.8%) |
Race in Georgetown County
The most populous races in Georgetown County are White / Caucasian (41,926 | 65.9%), Black / African American (18,795 | 29.5%), and Hispanic or Latino (2,058 | 3.2%).
| Race | # Population | % Population |
| Asian | 293 | 0.5% |
| Black / African American | 18,795 | 29.5% |
| Hawaiian / Pacific | 0 | 0.0% |
| Hispanic or Latino | 2,058 | 3.2% |
| Native / Alaskan | 99 | 0.2% |
| White / Caucasian | 41,926 | 65.9% |
| Two or more Races | 1,340 | 2.1% |
| Some other Race | 1,141 | 1.8% |
| Total | 63,594 | 100.0% |
Ancestry in Georgetown County
The most populous ancestries reported in Georgetown County are American (8,233 | 13.0%), English (7,176 | 11.3%), German (6,556 | 10.3%), Irish (6,476 | 10.2%), and Italian (2,021 | 3.2%), together accounting for 47.9% of all Georgetown County residents.
| Ancestry | # Population | % Population |
| African | 395 | 0.6% |
| American | 8,233 | 13.0% |
| Arab | 107 | 0.2% |
| Armenian | 14 | 0.0% |
| Austrian | 22 | 0.0% |
| Bahamian | 8 | 0.0% |
| Belgian | 97 | 0.2% |
| Belizean | 31 | 0.1% |
| Blackfeet | 11 | 0.0% |
| British | 618 | 1.0% |
| Burmese | 68 | 0.1% |
| Cajun | 29 | 0.1% |
| Canadian | 54 | 0.1% |
| Central American | 137 | 0.2% |
| Cherokee | 169 | 0.3% |
| Chippewa | 12 | 0.0% |
| Colombian | 21 | 0.0% |
| Comanche | 17 | 0.0% |
| Costa Rican | 15 | 0.0% |
| Croatian | 10 | 0.0% |
| Cuban | 215 | 0.3% |
| Czech | 46 | 0.1% |
| Czechoslovakian | 32 | 0.1% |
| Danish | 79 | 0.1% |
| Delaware | 10 | 0.0% |
| Dominican | 13 | 0.0% |
| Dutch | 692 | 1.1% |
| Eastern European | 90 | 0.1% |
| Egyptian | 16 | 0.0% |
| English | 7,176 | 11.3% |
| European | 1,410 | 2.2% |
| Finnish | 63 | 0.1% |
| French | 1,278 | 2.0% |
| French Canadian | 166 | 0.3% |
| German | 6,556 | 10.3% |
| Ghanaian | 23 | 0.0% |
| Greek | 800 | 1.3% |
| Haitian | 22 | 0.0% |
| Hungarian | 149 | 0.2% |
| Indian (Asian) | 142 | 0.2% |
| Irish | 6,476 | 10.2% |
| Iroquois | 29 | 0.1% |
| Italian | 2,021 | 3.2% |
| Jamaican | 18 | 0.0% |
| Korean | 161 | 0.3% |
| Lebanese | 86 | 0.1% |
| Lithuanian | 51 | 0.1% |
| Lumbee | 60 | 0.1% |
| Mexican | 979 | 1.5% |
| Northern European | 85 | 0.1% |
| Norwegian | 70 | 0.1% |
| Ottawa | 23 | 0.0% |
| Pakistani | 29 | 0.1% |
| Pennsylvania German | 141 | 0.2% |
| Polish | 943 | 1.5% |
| Portuguese | 179 | 0.3% |
| Puerto Rican | 421 | 0.7% |
| Romanian | 33 | 0.1% |
| Russian | 161 | 0.3% |
| Salvadoran | 122 | 0.2% |
| Scandinavian | 169 | 0.3% |
| Scotch-Irish | 810 | 1.3% |
| Scottish | 1,616 | 2.5% |
| Seminole | 11 | 0.0% |
| Serbian | 10 | 0.0% |
| Slovak | 149 | 0.2% |
| Slovene | 38 | 0.1% |
| South American | 54 | 0.1% |
| Spaniard | 74 | 0.1% |
| Spanish | 133 | 0.2% |
| Sri Lankan | 40 | 0.1% |
| Subsaharan African | 558 | 0.9% |
| Swedish | 235 | 0.4% |
| Swiss | 153 | 0.2% |
| Thai | 40 | 0.1% |
| Ukrainian | 313 | 0.5% |
| Venezuelan | 33 | 0.1% |
| Welsh | 269 | 0.4% |
| West Indian | 7 | 0.0% | View All 79 Rows |
Immigrants in Georgetown County
The most numerous immigrant groups reported in Georgetown County came from Latin America (773 | 1.2%), Europe (650 | 1.0%), Central America (498 | 0.8%), Mexico (429 | 0.7%), and Asia (306 | 0.5%), together accounting for 4.2% of all Georgetown County residents.
| Immigration Origin | # Population | % Population |
| Africa | 157 | 0.3% |
| Asia | 306 | 0.5% |
| Belgium | 9 | 0.0% |
| Belize | 54 | 0.1% |
| Cameroon | 140 | 0.2% |
| Canada | 64 | 0.1% |
| Caribbean | 240 | 0.4% |
| Central America | 498 | 0.8% |
| China | 101 | 0.2% |
| Colombia | 9 | 0.0% |
| Costa Rica | 15 | 0.0% |
| Cuba | 199 | 0.3% |
| Denmark | 14 | 0.0% |
| Dominican Republic | 6 | 0.0% |
| Eastern Asia | 159 | 0.3% |
| Eastern Europe | 73 | 0.1% |
| Egypt | 16 | 0.0% |
| England | 162 | 0.3% |
| Europe | 650 | 1.0% |
| France | 42 | 0.1% |
| Germany | 189 | 0.3% |
| Greece | 73 | 0.1% |
| India | 40 | 0.1% |
| Ireland | 8 | 0.0% |
| Italy | 24 | 0.0% |
| Jamaica | 14 | 0.0% |
| Korea | 58 | 0.1% |
| Latin America | 773 | 1.2% |
| Lebanon | 13 | 0.0% |
| Liberia | 1 | 0.0% |
| Lithuania | 27 | 0.0% |
| Mexico | 429 | 0.7% |
| Middle Africa | 140 | 0.2% |
| Northern Africa | 16 | 0.0% |
| Northern Europe | 240 | 0.4% |
| Philippines | 42 | 0.1% |
| Poland | 16 | 0.0% |
| Scotland | 38 | 0.1% |
| South America | 35 | 0.1% |
| South Central Asia | 40 | 0.1% |
| South Eastern Asia | 94 | 0.2% |
| Southern Europe | 97 | 0.2% |
| Thailand | 29 | 0.1% |
| Trinidad and Tobago | 21 | 0.0% |
| Ukraine | 30 | 0.1% |
| Venezuela | 26 | 0.0% |
| Vietnam | 23 | 0.0% |
| Western Africa | 1 | 0.0% |
| Western Asia | 13 | 0.0% |
| Western Europe | 240 | 0.4% | View All 50 Rows |
Sex and Age in Georgetown County
Sex and Age in Georgetown County
The most populous age groups in Georgetown County are 60 to 64 Years (2,886 | 9.5%) for men and 65 to 69 Years (3,407 | 10.3%) for women.
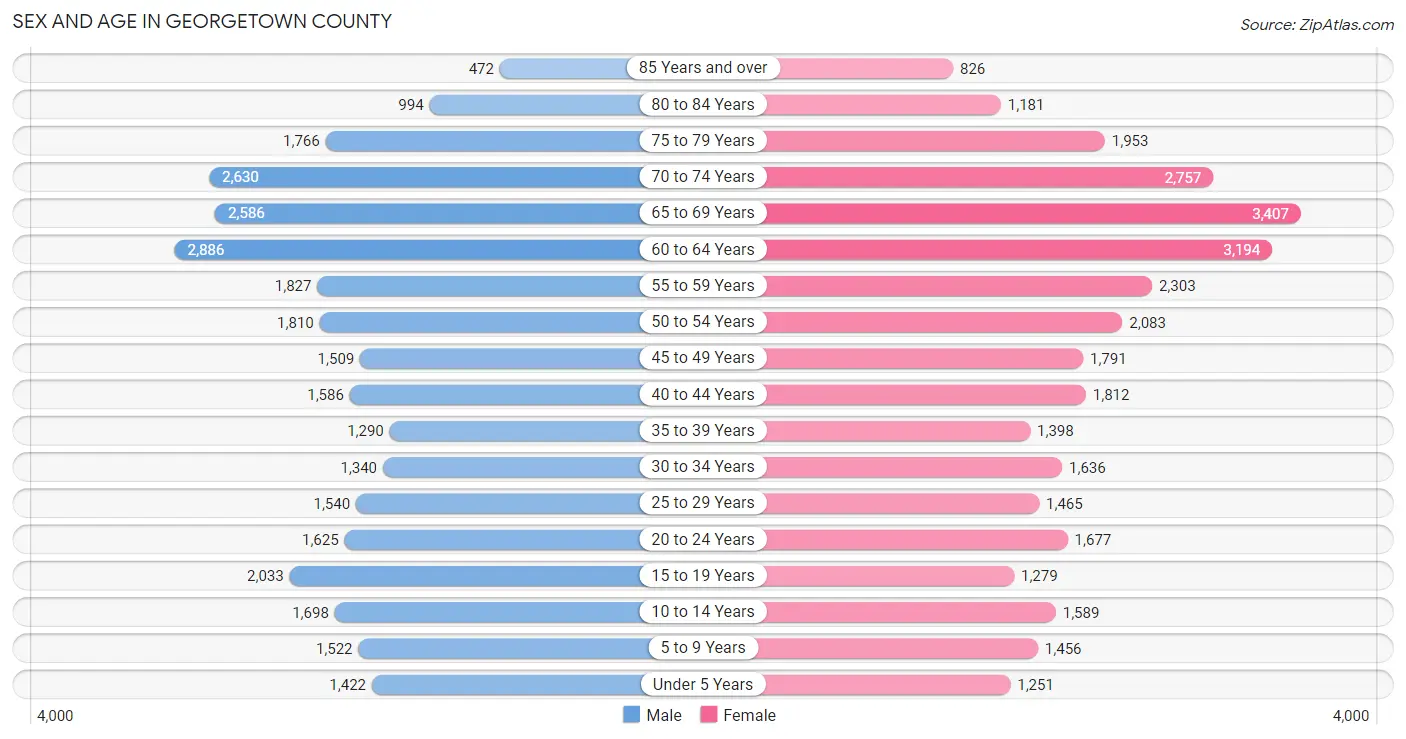
| Age Bracket | Male | Female |
| Under 5 Years | 1,422 (4.7%) | 1,251 (3.8%) |
| 5 to 9 Years | 1,522 (5.0%) | 1,456 (4.4%) |
| 10 to 14 Years | 1,698 (5.6%) | 1,589 (4.8%) |
| 15 to 19 Years | 2,033 (6.7%) | 1,279 (3.9%) |
| 20 to 24 Years | 1,625 (5.3%) | 1,677 (5.1%) |
| 25 to 29 Years | 1,540 (5.0%) | 1,465 (4.4%) |
| 30 to 34 Years | 1,340 (4.4%) | 1,636 (5.0%) |
| 35 to 39 Years | 1,290 (4.2%) | 1,398 (4.2%) |
| 40 to 44 Years | 1,586 (5.2%) | 1,812 (5.5%) |
| 45 to 49 Years | 1,509 (4.9%) | 1,791 (5.4%) |
| 50 to 54 Years | 1,810 (5.9%) | 2,083 (6.3%) |
| 55 to 59 Years | 1,827 (6.0%) | 2,303 (7.0%) |
| 60 to 64 Years | 2,886 (9.5%) | 3,194 (9.7%) |
| 65 to 69 Years | 2,586 (8.5%) | 3,407 (10.3%) |
| 70 to 74 Years | 2,630 (8.6%) | 2,757 (8.3%) |
| 75 to 79 Years | 1,766 (5.8%) | 1,953 (5.9%) |
| 80 to 84 Years | 994 (3.3%) | 1,181 (3.6%) |
| 85 Years and over | 472 (1.5%) | 826 (2.5%) |
| Total | 30,536 (100.0%) | 33,058 (100.0%) |
Families and Households in Georgetown County
Median Family Size in Georgetown County
The median family size in Georgetown County is 2.95 persons per family, with single female/mother families (3,554 | 19.8%) accounting for the largest median family size of 3.55 persons per family. On the other hand, married-couple families (13,012 | 72.5%) represent the smallest median family size with 2.75 persons per family.
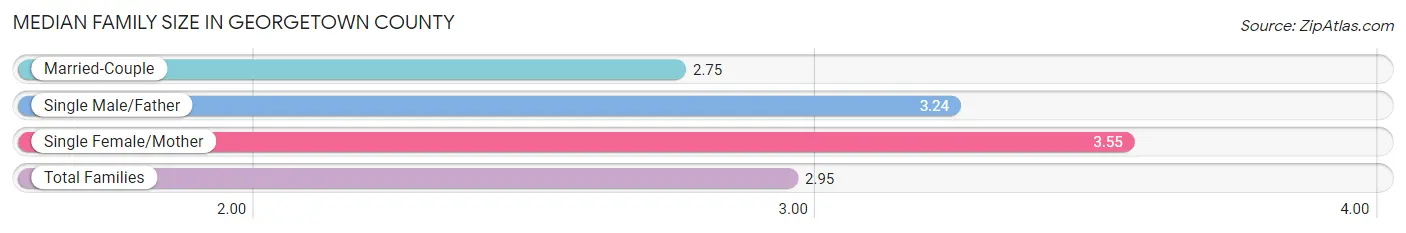
| Family Type | # Families | Family Size |
| Married-Couple | 13,012 (72.5%) | 2.75 |
| Single Male/Father | 1,376 (7.7%) | 3.24 |
| Single Female/Mother | 3,554 (19.8%) | 3.55 |
| Total Families | 17,942 (100.0%) | 2.95 |
Median Household Size in Georgetown County
The median household size in Georgetown County is 2.42 persons per household, with single female/mother households (3,554 | 13.7%) accounting for the largest median household size of 3.67 persons per household. non-family households (8,087 | 31.1%) represent the smallest median household size with 1.12 persons per household.
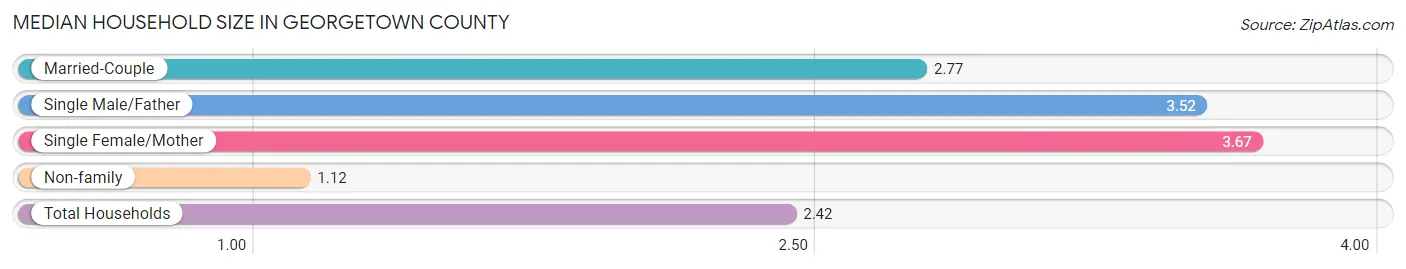
| Household Type | # Households | Household Size |
| Married-Couple | 13,012 (50.0%) | 2.77 |
| Single Male/Father | 1,376 (5.3%) | 3.52 |
| Single Female/Mother | 3,554 (13.7%) | 3.67 |
| Non-family | 8,087 (31.1%) | 1.12 |
| Total Households | 26,029 (100.0%) | 2.42 |
Household Size by Marriage Status in Georgetown County
Out of a total of 26,029 households in Georgetown County, 17,942 (68.9%) are family households, while 8,087 (31.1%) are nonfamily households. The most numerous type of family households are 2-person households, comprising 10,354, and the most common type of nonfamily households are 1-person households, comprising 7,326.
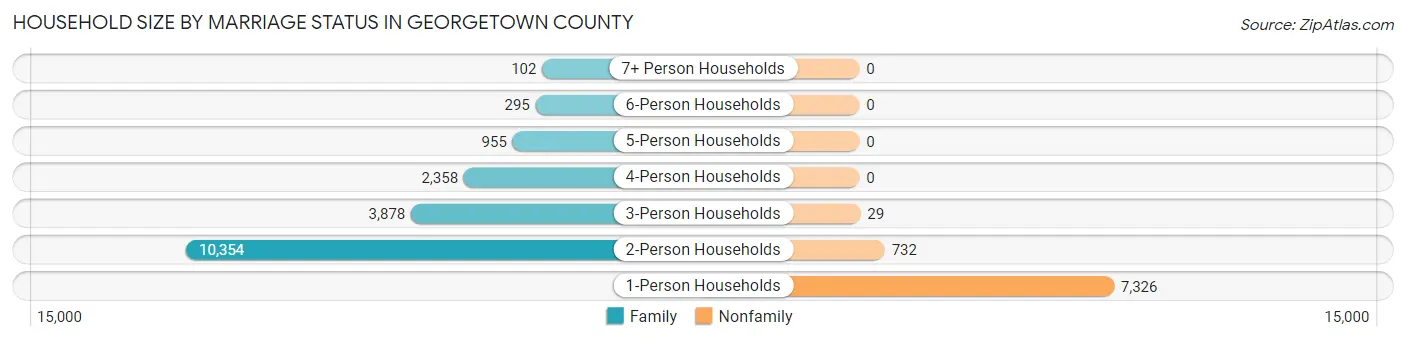
| Household Size | Family Households | Nonfamily Households |
| 1-Person Households | - | 7,326 (28.1%) |
| 2-Person Households | 10,354 (39.8%) | 732 (2.8%) |
| 3-Person Households | 3,878 (14.9%) | 29 (0.1%) |
| 4-Person Households | 2,358 (9.1%) | 0 (0.0%) |
| 5-Person Households | 955 (3.7%) | 0 (0.0%) |
| 6-Person Households | 295 (1.1%) | 0 (0.0%) |
| 7+ Person Households | 102 (0.4%) | 0 (0.0%) |
| Total | 17,942 (68.9%) | 8,087 (31.1%) |
Female Fertility in Georgetown County
Fertility by Age in Georgetown County
Average fertility rate in Georgetown County is 51.0 births per 1,000 women. Women in the age bracket of 20 to 34 years have the highest fertility rate with 107.0 births per 1,000 women. Women in the age bracket of 20 to 34 years acount for 85.9% of all women with births.
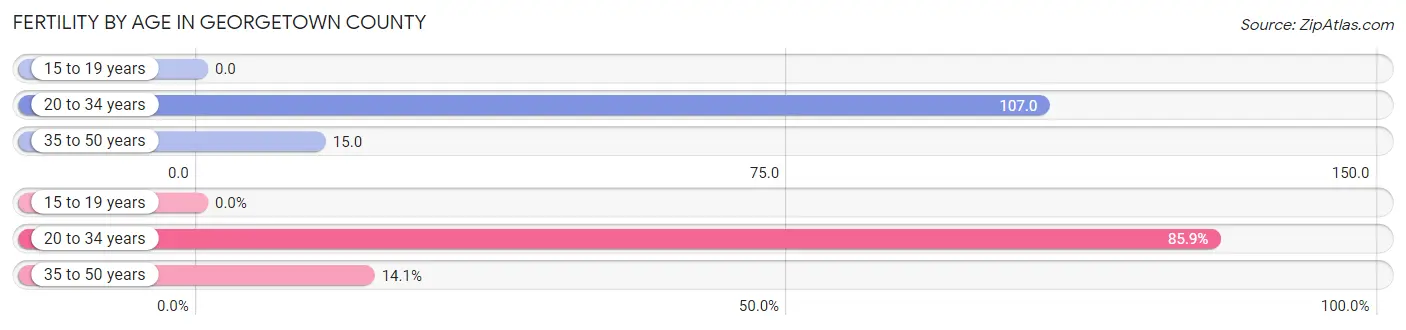
| Age Bracket | Women with Births | Births / 1,000 Women |
| 15 to 19 years | 0 (0.0%) | 0.0 |
| 20 to 34 years | 510 (85.9%) | 107.0 |
| 35 to 50 years | 84 (14.1%) | 15.0 |
| Total | 594 (100.0%) | 51.0 |
Fertility by Age by Marriage Status in Georgetown County
38.2% of women with births (594) in Georgetown County are married. The highest percentage of unmarried women with births falls into 20 to 34 years age bracket with 64.9% of them unmarried at the time of birth, while the lowest percentage of unmarried women with births belong to 35 to 50 years age bracket with 42.9% of them unmarried.
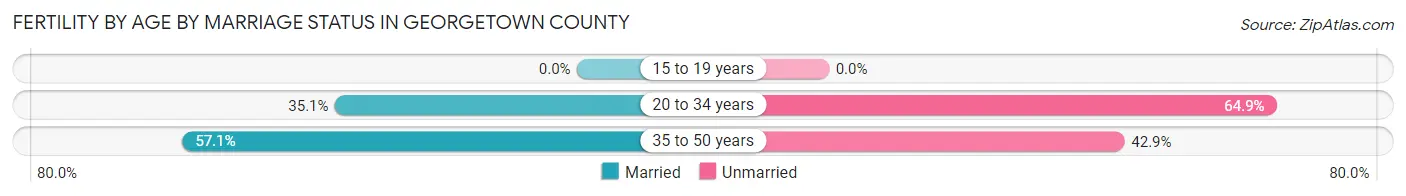
| Age Bracket | Married | Unmarried |
| 15 to 19 years | 0 (0.0%) | 0 (0.0%) |
| 20 to 34 years | 179 (35.1%) | 331 (64.9%) |
| 35 to 50 years | 48 (57.1%) | 36 (42.9%) |
| Total | 227 (38.2%) | 367 (61.8%) |
Fertility by Education in Georgetown County
Average fertility rate in Georgetown County is 51.0 births per 1,000 women. Women with the education attainment of college or associate's degree have the highest fertility rate of 59.0 births per 1,000 women, while women with the education attainment of graduate degree have the lowest fertility at 24.0 births per 1,000 women. Women with the education attainment of college or associate's degree represent 49.5% of all women with births.
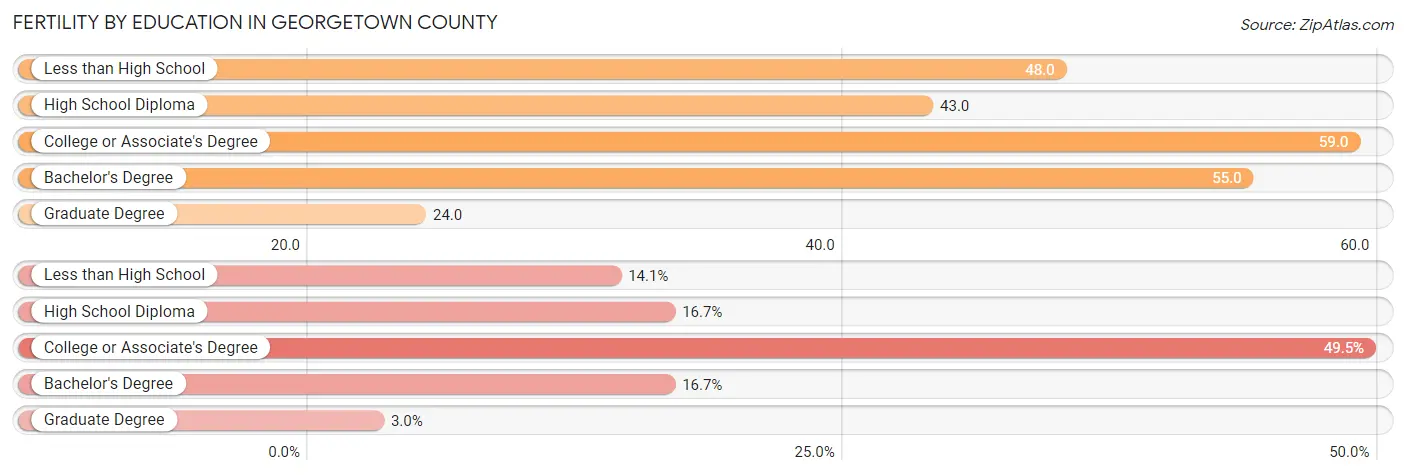
| Educational Attainment | Women with Births | Births / 1,000 Women |
| Less than High School | 84 (14.1%) | 48.0 |
| High School Diploma | 99 (16.7%) | 43.0 |
| College or Associate's Degree | 294 (49.5%) | 59.0 |
| Bachelor's Degree | 99 (16.7%) | 55.0 |
| Graduate Degree | 18 (3.0%) | 24.0 |
| Total | 594 (100.0%) | 51.0 |
Fertility by Education by Marriage Status in Georgetown County
61.8% of women with births in Georgetown County are unmarried. Women with the educational attainment of graduate degree are most likely to be married with 100.0% of them married at childbirth, while women with the educational attainment of high school diploma are least likely to be married with 100.0% of them unmarried at childbirth.
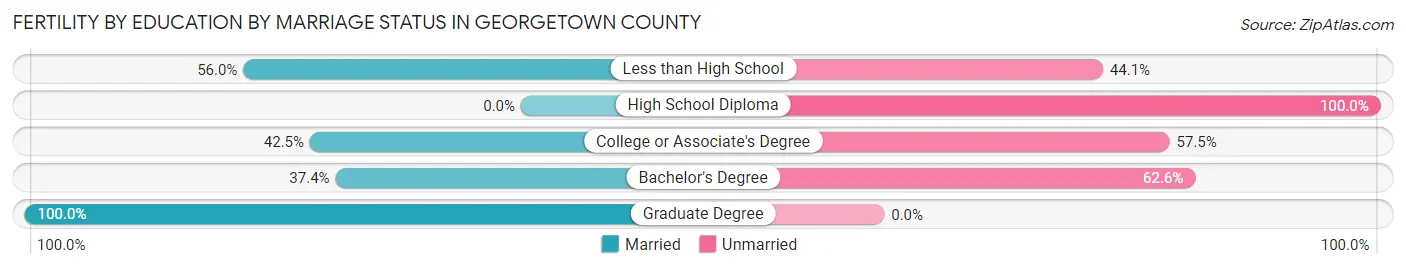
| Educational Attainment | Married | Unmarried |
| Less than High School | 47 (55.9%) | 37 (44.1%) |
| High School Diploma | 0 (0.0%) | 99 (100.0%) |
| College or Associate's Degree | 125 (42.5%) | 169 (57.5%) |
| Bachelor's Degree | 37 (37.4%) | 62 (62.6%) |
| Graduate Degree | 18 (100.0%) | 0 (0.0%) |
| Total | 227 (38.2%) | 367 (61.8%) |
Employment Characteristics in Georgetown County
Employment by Class of Employer in Georgetown County
Among the 25,553 employed individuals in Georgetown County, private company employees (15,468 | 60.5%), self-employed (not incorporated) (2,248 | 8.8%), and not-for-profit organizations (2,228 | 8.7%) make up the most common classes of employment.
| Employer Class | # Employees | % Employees |
| Private Company Employees | 15,468 | 60.5% |
| Self-Employed (Incorporated) | 1,654 | 6.5% |
| Self-Employed (Not Incorporated) | 2,248 | 8.8% |
| Not-for-profit Organizations | 2,228 | 8.7% |
| Local Government Employees | 1,704 | 6.7% |
| State Government Employees | 1,690 | 6.6% |
| Federal Government Employees | 406 | 1.6% |
| Unpaid Family Workers | 155 | 0.6% |
| Total | 25,553 | 100.0% |
Employment Status by Age in Georgetown County
According to the labor force statistics for Georgetown County, out of the total population over 16 years of age (53,711), 51.1% or 27,446 individuals are in the labor force, with 5.0% or 1,372 of them unemployed. The age group with the highest labor force participation rate is 25 to 29 years, with 88.9% or 2,671 individuals in the labor force. Within the labor force, the 20 to 24 years age range has the highest percentage of unemployed individuals, with 11.9% or 292 of them being unemployed.
| Age Bracket | In Labor Force | Unemployed |
| 16 to 19 Years | 956 (40.4%) | 35 (3.7%) |
| 20 to 24 Years | 2,450 (74.2%) | 292 (11.9%) |
| 25 to 29 Years | 2,671 (88.9%) | 254 (9.5%) |
| 30 to 34 Years | 2,476 (83.2%) | 151 (6.1%) |
| 35 to 44 Years | 4,881 (80.2%) | 327 (6.7%) |
| 45 to 54 Years | 5,416 (75.3%) | 157 (2.9%) |
| 55 to 59 Years | 2,660 (64.4%) | 13 (0.5%) |
| 60 to 64 Years | 2,718 (44.7%) | 101 (3.7%) |
| 65 to 74 Years | 2,788 (24.5%) | 33 (1.2%) |
| 75 Years and over | 439 (6.1%) | 20 (4.6%) |
| Total | 27,446 (51.1%) | 1,372 (5.0%) |
Employment Status by Educational Attainment in Georgetown County
According to labor force statistics for Georgetown County, 70.6% of individuals (20,806) out of the total population between 25 and 64 years of age (29,470) are in the labor force, with 4.8% or 999 of them being unemployed. The group with the highest labor force participation rate are those with the educational attainment of bachelor's degree or higher, with 77.2% or 6,361 individuals in the labor force. Within the labor force, individuals with less than high school education have the highest percentage of unemployment, with 10.0% or 141 of them being unemployed.
| Educational Attainment | In Labor Force | Unemployed |
| Less than High School | 1,414 (52.2%) | 271 (10.0%) |
| High School Diploma | 5,113 (63.4%) | 653 (8.1%) |
| College / Associate Degree | 7,927 (75.8%) | 492 (4.7%) |
| Bachelor's Degree or higher | 6,361 (77.2%) | 99 (1.2%) |
| Total | 20,806 (70.6%) | 1,415 (4.8%) |
Employment Occupations by Sex in Georgetown County
Management, Business, Science and Arts Occupations
The most common Management, Business, Science and Arts occupations in Georgetown County are Community & Social Service (2,860 | 11.0%), Management (2,267 | 8.7%), Health Diagnosing & Treating (1,783 | 6.8%), Education Instruction & Library (1,736 | 6.7%), and Health Technologists (1,375 | 5.3%).
Management, Business, Science and Arts Occupations by Sex
Within the Management, Business, Science and Arts occupations in Georgetown County, the most male-oriented occupations are Architecture & Engineering (89.0%), Computers, Engineering & Science (73.2%), and Computers & Mathematics (72.6%), while the most female-oriented occupations are Education Instruction & Library (84.5%), Community & Social Service (70.7%), and Health Diagnosing & Treating (68.9%).
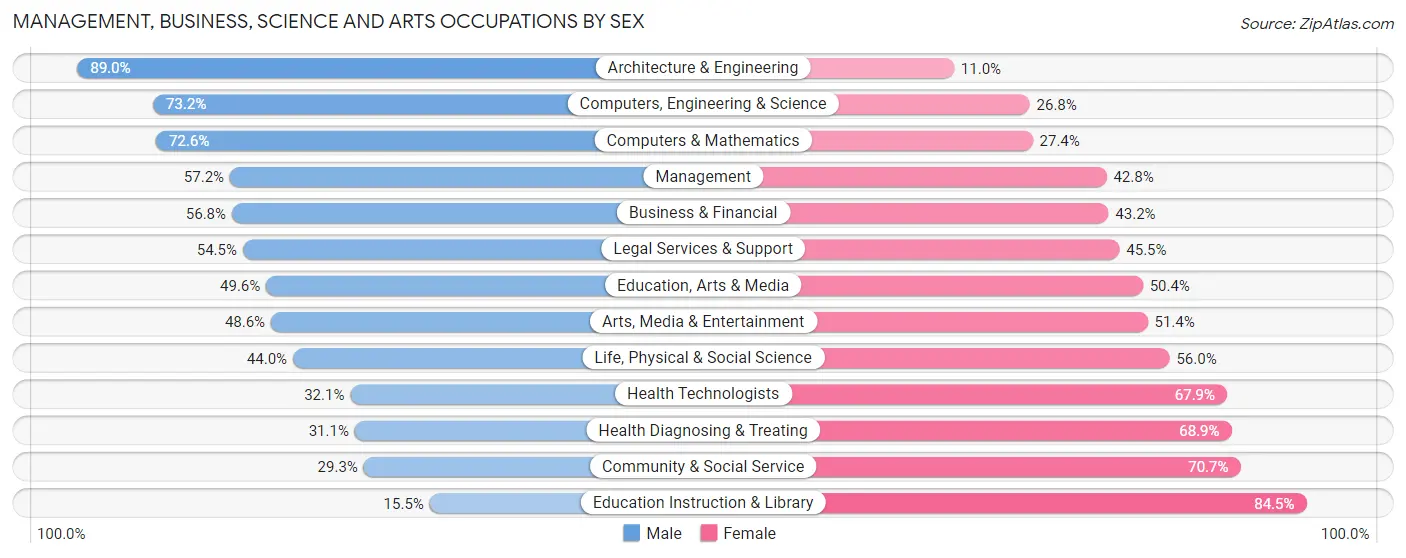
| Occupation | Male | Female |
| Management | 1,296 (57.2%) | 971 (42.8%) |
| Business & Financial | 549 (56.8%) | 418 (43.2%) |
| Computers, Engineering & Science | 623 (73.2%) | 228 (26.8%) |
| Computers & Mathematics | 278 (72.6%) | 105 (27.4%) |
| Architecture & Engineering | 275 (89.0%) | 34 (11.0%) |
| Life, Physical & Social Science | 70 (44.0%) | 89 (56.0%) |
| Community & Social Service | 837 (29.3%) | 2,023 (70.7%) |
| Education, Arts & Media | 259 (49.6%) | 263 (50.4%) |
| Legal Services & Support | 152 (54.5%) | 127 (45.5%) |
| Education Instruction & Library | 269 (15.5%) | 1,467 (84.5%) |
| Arts, Media & Entertainment | 157 (48.6%) | 166 (51.4%) |
| Health Diagnosing & Treating | 555 (31.1%) | 1,228 (68.9%) |
| Health Technologists | 441 (32.1%) | 934 (67.9%) |
| Total (Category) | 3,860 (44.2%) | 4,868 (55.8%) |
| Total (Overall) | 12,970 (49.8%) | 13,090 (50.2%) |
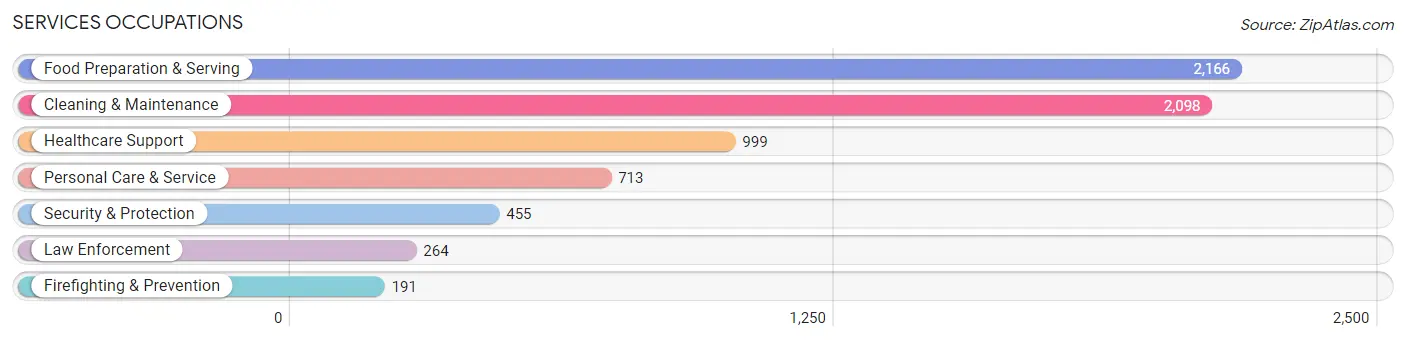
Services Occupations
The most common Services occupations in Georgetown County are Food Preparation & Serving (2,166 | 8.3%), Cleaning & Maintenance (2,098 | 8.1%), Healthcare Support (999 | 3.8%), Personal Care & Service (713 | 2.7%), and Security & Protection (455 | 1.8%).
Services Occupations by Sex
Within the Services occupations in Georgetown County, the most male-oriented occupations are Firefighting & Prevention (86.4%), Security & Protection (81.1%), and Law Enforcement (77.3%), while the most female-oriented occupations are Healthcare Support (94.4%), Personal Care & Service (83.0%), and Food Preparation & Serving (52.9%).
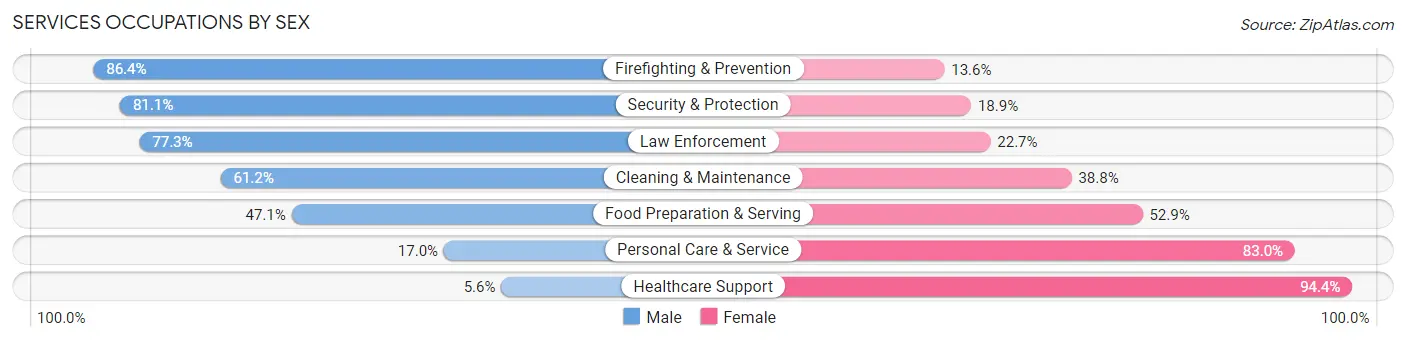
| Occupation | Male | Female |
| Healthcare Support | 56 (5.6%) | 943 (94.4%) |
| Security & Protection | 369 (81.1%) | 86 (18.9%) |
| Firefighting & Prevention | 165 (86.4%) | 26 (13.6%) |
| Law Enforcement | 204 (77.3%) | 60 (22.7%) |
| Food Preparation & Serving | 1,021 (47.1%) | 1,145 (52.9%) |
| Cleaning & Maintenance | 1,284 (61.2%) | 814 (38.8%) |
| Personal Care & Service | 121 (17.0%) | 592 (83.0%) |
| Total (Category) | 2,851 (44.3%) | 3,580 (55.7%) |
| Total (Overall) | 12,970 (49.8%) | 13,090 (50.2%) |
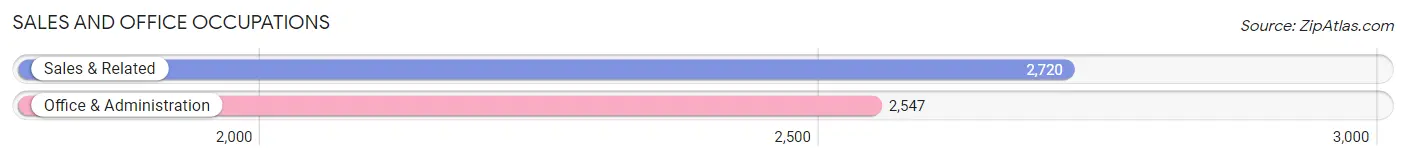
Sales and Office Occupations
The most common Sales and Office occupations in Georgetown County are Sales & Related (2,720 | 10.4%), and Office & Administration (2,547 | 9.8%).
Sales and Office Occupations by Sex

| Occupation | Male | Female |
| Sales & Related | 1,275 (46.9%) | 1,445 (53.1%) |
| Office & Administration | 261 (10.2%) | 2,286 (89.7%) |
| Total (Category) | 1,536 (29.2%) | 3,731 (70.8%) |
| Total (Overall) | 12,970 (49.8%) | 13,090 (50.2%) |
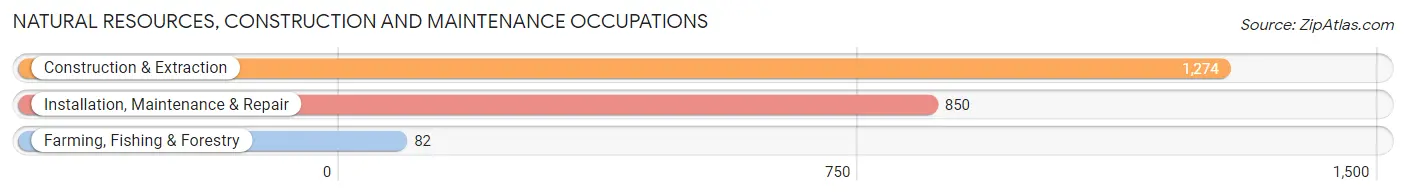
Natural Resources, Construction and Maintenance Occupations
The most common Natural Resources, Construction and Maintenance occupations in Georgetown County are Construction & Extraction (1,274 | 4.9%), Installation, Maintenance & Repair (850 | 3.3%), and Farming, Fishing & Forestry (82 | 0.3%).
Natural Resources, Construction and Maintenance Occupations by Sex
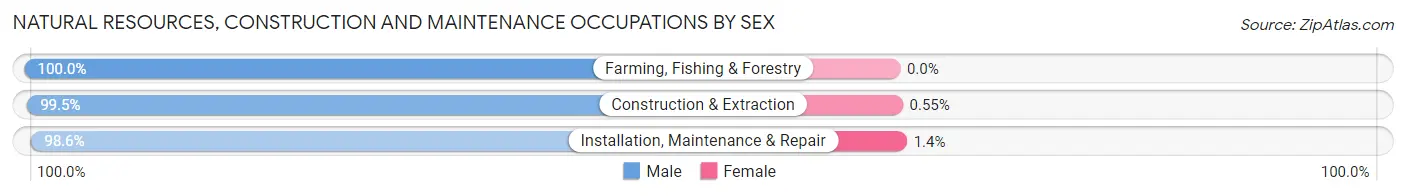
| Occupation | Male | Female |
| Farming, Fishing & Forestry | 82 (100.0%) | 0 (0.0%) |
| Construction & Extraction | 1,267 (99.5%) | 7 (0.5%) |
| Installation, Maintenance & Repair | 838 (98.6%) | 12 (1.4%) |
| Total (Category) | 2,187 (99.1%) | 19 (0.9%) |
| Total (Overall) | 12,970 (49.8%) | 13,090 (50.2%) |
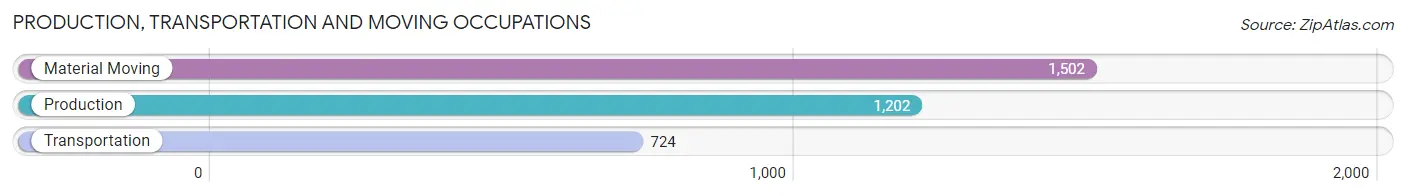
Production, Transportation and Moving Occupations
The most common Production, Transportation and Moving occupations in Georgetown County are Material Moving (1,502 | 5.8%), Production (1,202 | 4.6%), and Transportation (724 | 2.8%).
Production, Transportation and Moving Occupations by Sex
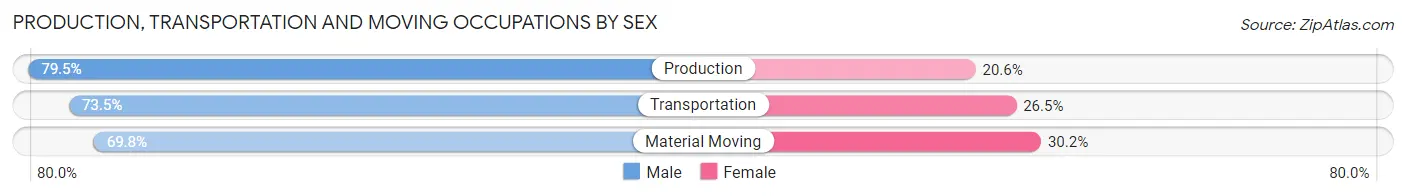
| Occupation | Male | Female |
| Production | 955 (79.4%) | 247 (20.5%) |
| Transportation | 532 (73.5%) | 192 (26.5%) |
| Material Moving | 1,049 (69.8%) | 453 (30.2%) |
| Total (Category) | 2,536 (74.0%) | 892 (26.0%) |
| Total (Overall) | 12,970 (49.8%) | 13,090 (50.2%) |
Employment Industries by Sex in Georgetown County
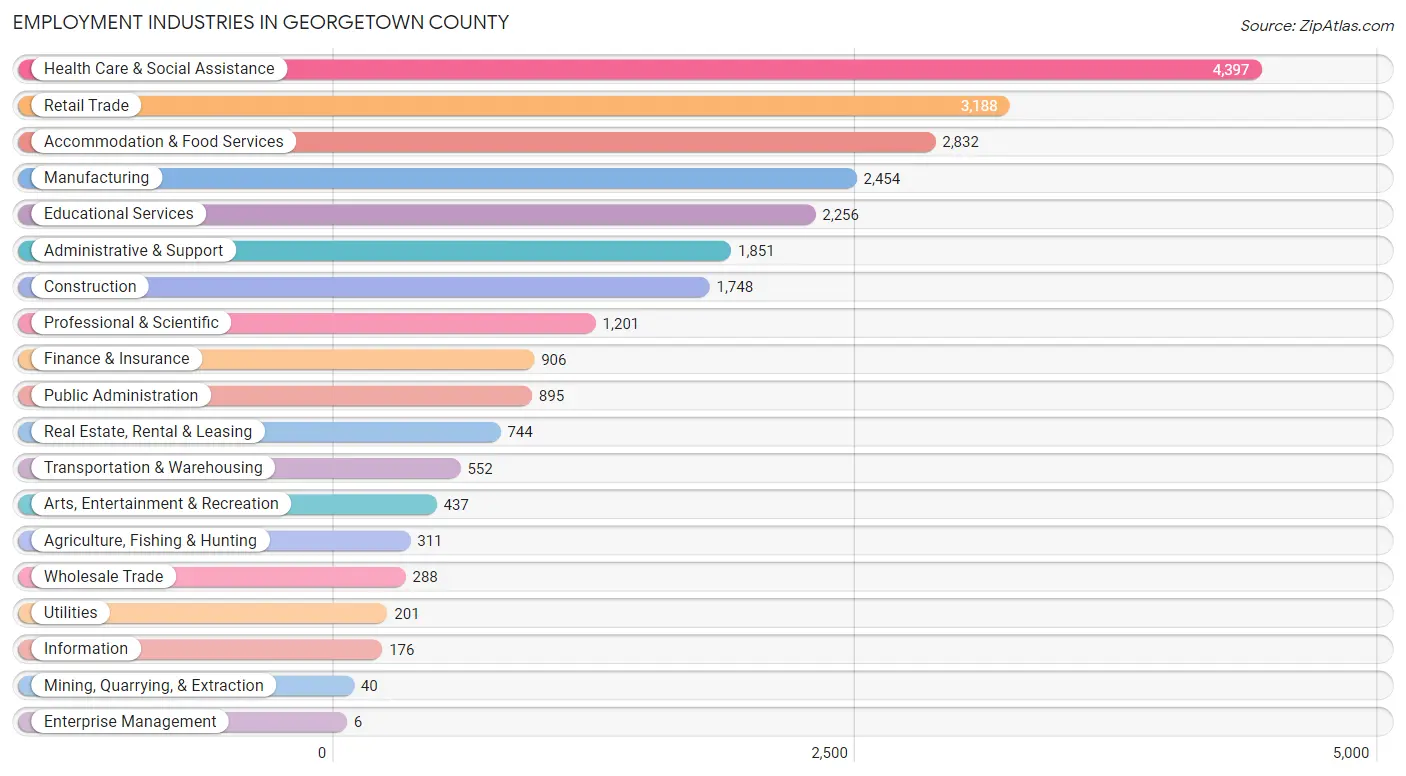
Employment Industries in Georgetown County
The major employment industries in Georgetown County include Health Care & Social Assistance (4,397 | 16.9%), Retail Trade (3,188 | 12.2%), Accommodation & Food Services (2,832 | 10.9%), Manufacturing (2,454 | 9.4%), and Educational Services (2,256 | 8.7%).
Employment Industries by Sex in Georgetown County
The Georgetown County industries that see more men than women are Mining, Quarrying, & Extraction (100.0%), Construction (94.1%), and Utilities (89.0%), whereas the industries that tend to have a higher number of women are Enterprise Management (100.0%), Health Care & Social Assistance (81.5%), and Educational Services (79.0%).
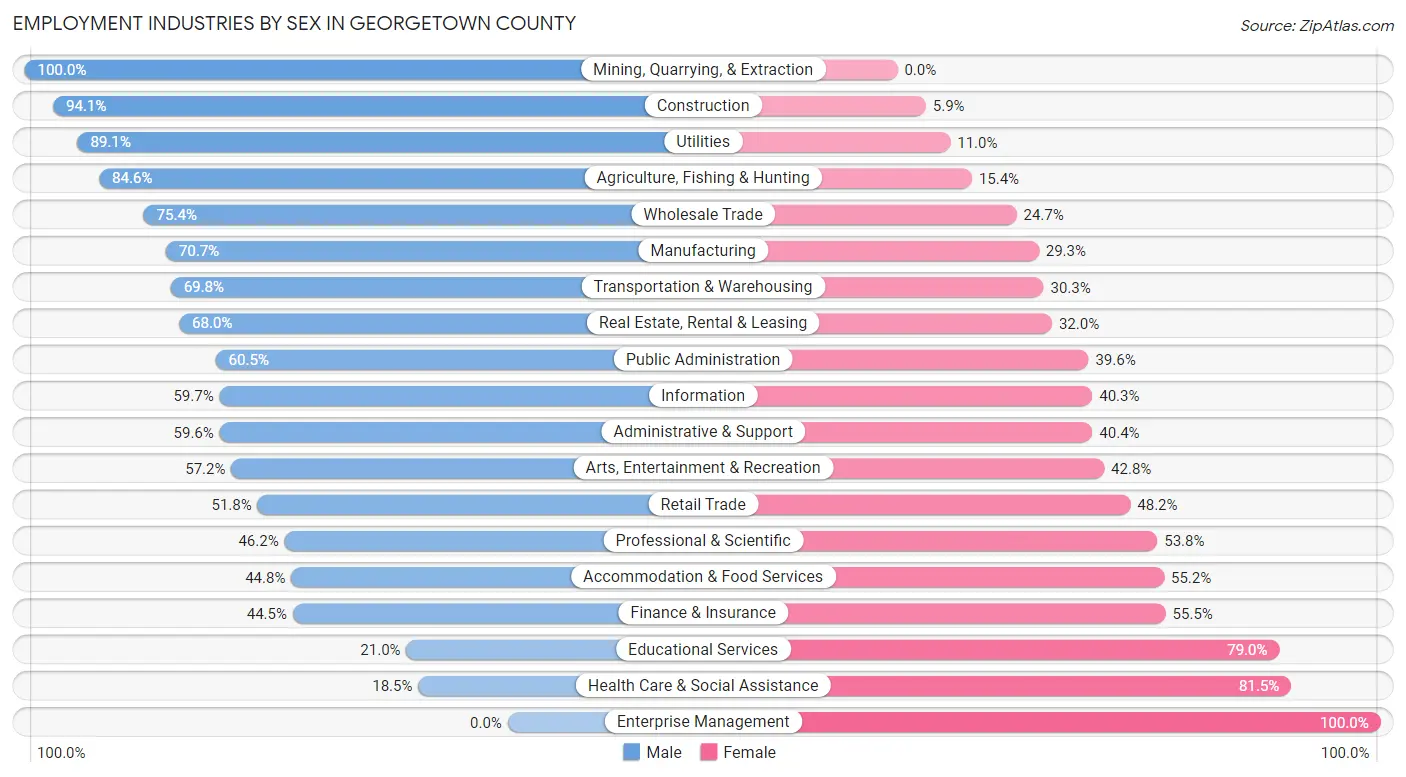
| Industry | Male | Female |
| Agriculture, Fishing & Hunting | 263 (84.6%) | 48 (15.4%) |
| Mining, Quarrying, & Extraction | 40 (100.0%) | 0 (0.0%) |
| Construction | 1,645 (94.1%) | 103 (5.9%) |
| Manufacturing | 1,736 (70.7%) | 718 (29.3%) |
| Wholesale Trade | 217 (75.3%) | 71 (24.6%) |
| Retail Trade | 1,651 (51.8%) | 1,537 (48.2%) |
| Transportation & Warehousing | 385 (69.8%) | 167 (30.2%) |
| Utilities | 179 (89.0%) | 22 (11.0%) |
| Information | 105 (59.7%) | 71 (40.3%) |
| Finance & Insurance | 403 (44.5%) | 503 (55.5%) |
| Real Estate, Rental & Leasing | 506 (68.0%) | 238 (32.0%) |
| Professional & Scientific | 555 (46.2%) | 646 (53.8%) |
| Enterprise Management | 0 (0.0%) | 6 (100.0%) |
| Administrative & Support | 1,104 (59.6%) | 747 (40.4%) |
| Educational Services | 473 (21.0%) | 1,783 (79.0%) |
| Health Care & Social Assistance | 814 (18.5%) | 3,583 (81.5%) |
| Arts, Entertainment & Recreation | 250 (57.2%) | 187 (42.8%) |
| Accommodation & Food Services | 1,269 (44.8%) | 1,563 (55.2%) |
| Public Administration | 541 (60.5%) | 354 (39.6%) |
| Total | 12,970 (49.8%) | 13,090 (50.2%) |
Education in Georgetown County
School Enrollment in Georgetown County
The most common levels of schooling among the 11,979 students in Georgetown County are high school (2,777 | 23.2%), middle school (2,775 | 23.2%), and elementary school (2,459 | 20.5%).
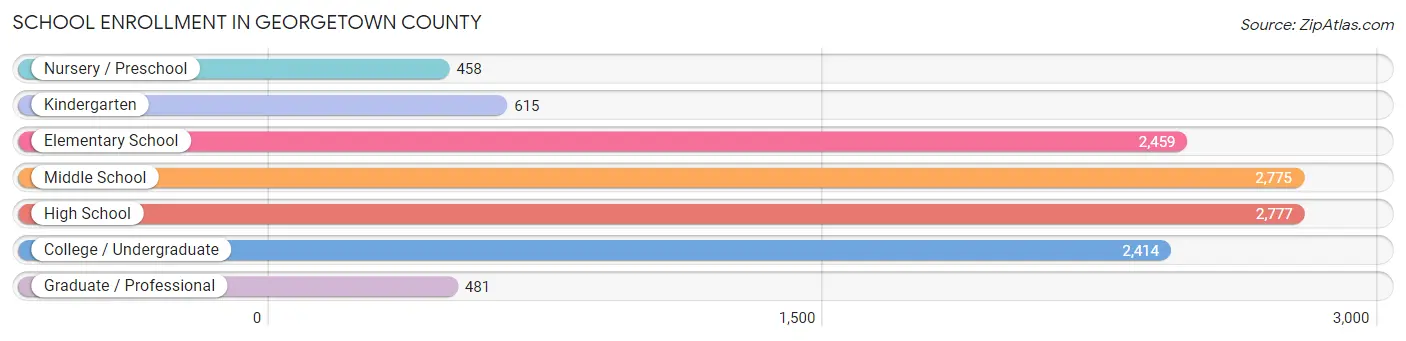
| School Level | # Students | % Students |
| Nursery / Preschool | 458 | 3.8% |
| Kindergarten | 615 | 5.1% |
| Elementary School | 2,459 | 20.5% |
| Middle School | 2,775 | 23.2% |
| High School | 2,777 | 23.2% |
| College / Undergraduate | 2,414 | 20.2% |
| Graduate / Professional | 481 | 4.0% |
| Total | 11,979 | 100.0% |
School Enrollment by Age by Funding Source in Georgetown County
Out of a total of 11,979 students who are enrolled in schools in Georgetown County, 1,234 (10.3%) attend a private institution, while the remaining 10,745 (89.7%) are enrolled in public schools. The age group of 3 to 4 year olds has the highest likelihood of being enrolled in private schools, with 78 (22.1% in the age bracket) enrolled. Conversely, the age group of 5 to 9 year old has the lowest likelihood of being enrolled in a private school, with 2,721 (93.9% in the age bracket) attending a public institution.
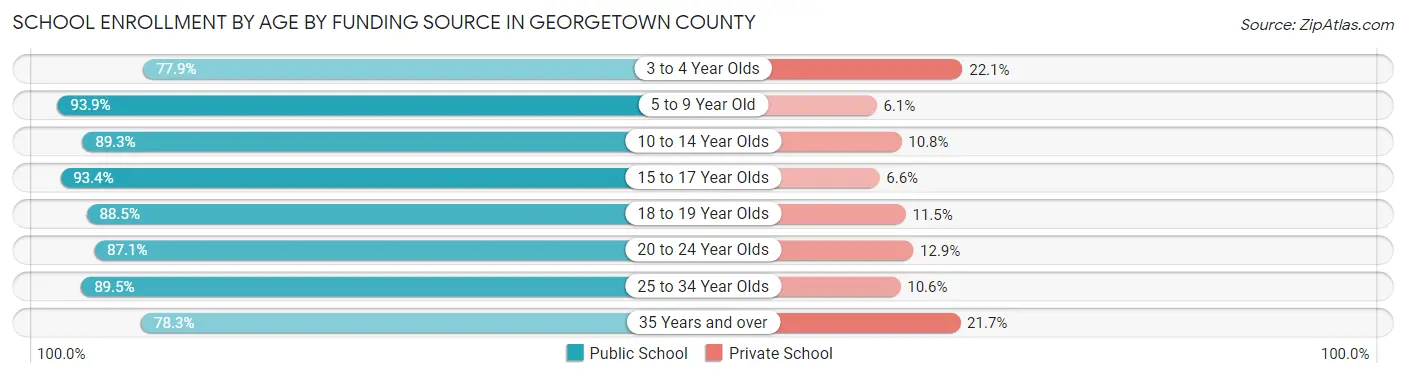
| Age Bracket | Public School | Private School |
| 3 to 4 Year Olds | 275 (77.9%) | 78 (22.1%) |
| 5 to 9 Year Old | 2,721 (93.9%) | 177 (6.1%) |
| 10 to 14 Year Olds | 2,839 (89.2%) | 342 (10.7%) |
| 15 to 17 Year Olds | 1,954 (93.4%) | 139 (6.6%) |
| 18 to 19 Year Olds | 752 (88.5%) | 98 (11.5%) |
| 20 to 24 Year Olds | 1,029 (87.1%) | 153 (12.9%) |
| 25 to 34 Year Olds | 534 (89.4%) | 63 (10.5%) |
| 35 Years and over | 646 (78.3%) | 179 (21.7%) |
| Total | 10,745 (89.7%) | 1,234 (10.3%) |
Educational Attainment by Field of Study in Georgetown County
Business (3,284 | 20.2%), education (2,867 | 17.7%), science & technology (1,616 | 10.0%), bio, nature & agricultural (1,247 | 7.7%), and engineering (1,149 | 7.1%) are the most common fields of study among 16,234 individuals in Georgetown County who have obtained a bachelor's degree or higher.
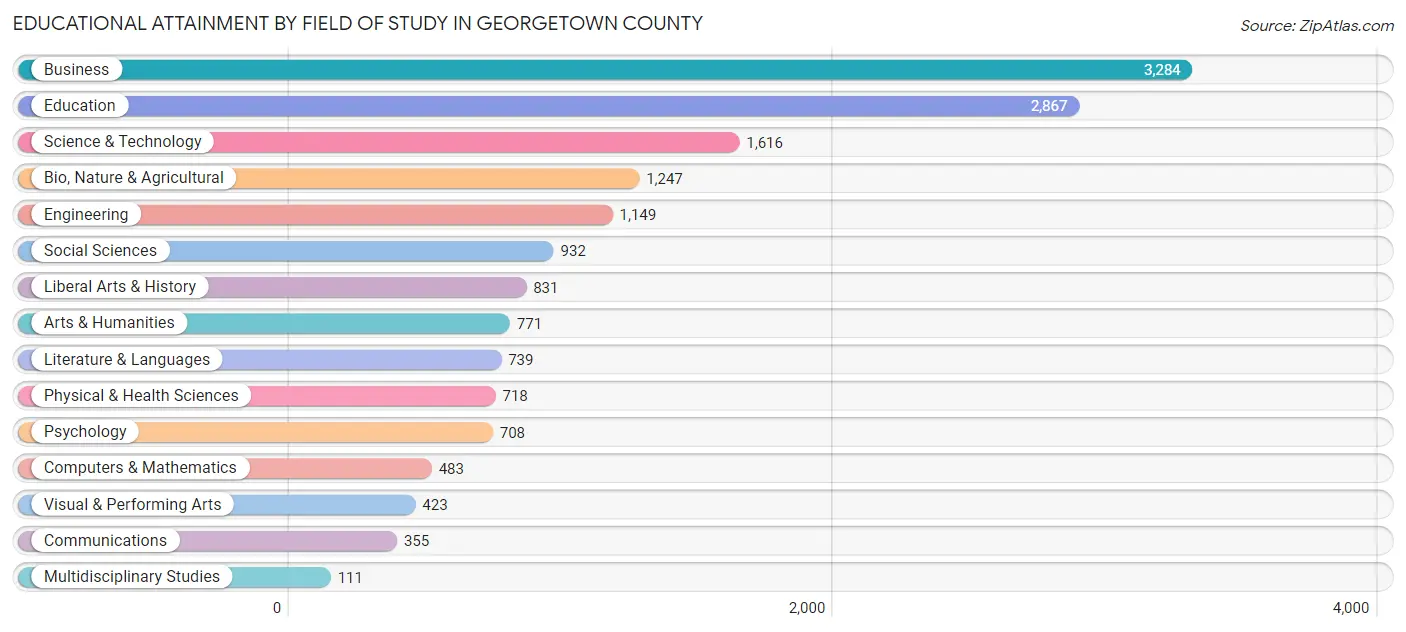
| Field of Study | # Graduates | % Graduates |
| Computers & Mathematics | 483 | 3.0% |
| Bio, Nature & Agricultural | 1,247 | 7.7% |
| Physical & Health Sciences | 718 | 4.4% |
| Psychology | 708 | 4.4% |
| Social Sciences | 932 | 5.7% |
| Engineering | 1,149 | 7.1% |
| Multidisciplinary Studies | 111 | 0.7% |
| Science & Technology | 1,616 | 10.0% |
| Business | 3,284 | 20.2% |
| Education | 2,867 | 17.7% |
| Literature & Languages | 739 | 4.5% |
| Liberal Arts & History | 831 | 5.1% |
| Visual & Performing Arts | 423 | 2.6% |
| Communications | 355 | 2.2% |
| Arts & Humanities | 771 | 4.8% |
| Total | 16,234 | 100.0% |
Transportation & Commute in Georgetown County
Vehicle Availability by Sex in Georgetown County
The most prevalent vehicle ownership categories in Georgetown County are males with 2 vehicles (4,673, accounting for 36.8%) and females with 2 vehicles (4,548, making up 36.5%).
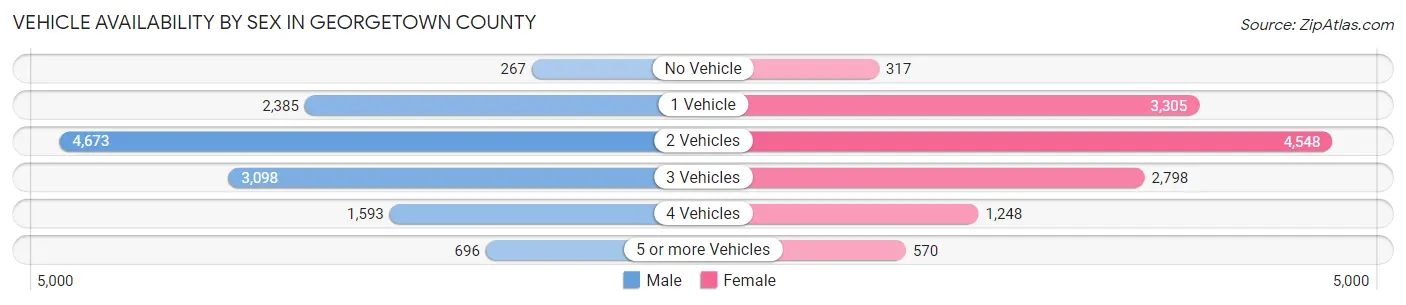
| Vehicles Available | Male | Female |
| No Vehicle | 267 (2.1%) | 317 (2.5%) |
| 1 Vehicle | 2,385 (18.8%) | 3,305 (25.9%) |
| 2 Vehicles | 4,673 (36.8%) | 4,548 (35.6%) |
| 3 Vehicles | 3,098 (24.4%) | 2,798 (21.9%) |
| 4 Vehicles | 1,593 (12.5%) | 1,248 (9.8%) |
| 5 or more Vehicles | 696 (5.5%) | 570 (4.5%) |
| Total | 12,712 (100.0%) | 12,786 (100.0%) |
Commute Time in Georgetown County
The most frequently occuring commute durations in Georgetown County are 5 to 9 minutes (3,449 commuters, 14.8%), 20 to 24 minutes (2,904 commuters, 12.5%), and 15 to 19 minutes (2,821 commuters, 12.1%).
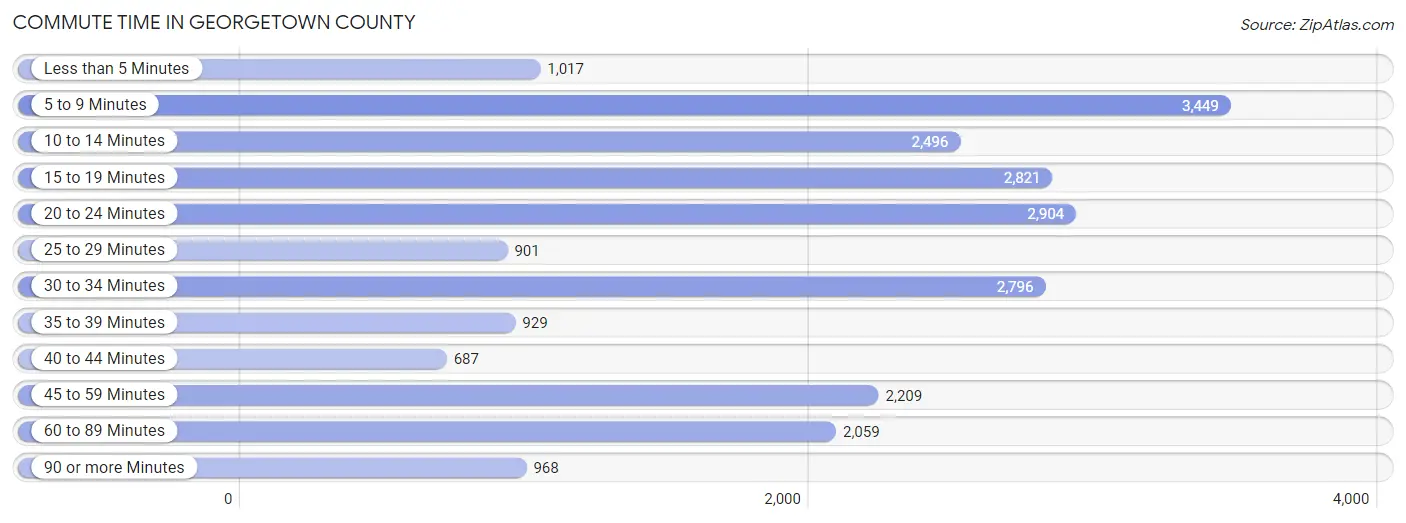
| Commute Time | # Commuters | % Commuters |
| Less than 5 Minutes | 1,017 | 4.4% |
| 5 to 9 Minutes | 3,449 | 14.8% |
| 10 to 14 Minutes | 2,496 | 10.7% |
| 15 to 19 Minutes | 2,821 | 12.1% |
| 20 to 24 Minutes | 2,904 | 12.5% |
| 25 to 29 Minutes | 901 | 3.9% |
| 30 to 34 Minutes | 2,796 | 12.0% |
| 35 to 39 Minutes | 929 | 4.0% |
| 40 to 44 Minutes | 687 | 3.0% |
| 45 to 59 Minutes | 2,209 | 9.5% |
| 60 to 89 Minutes | 2,059 | 8.9% |
| 90 or more Minutes | 968 | 4.2% |
Commute Time by Sex in Georgetown County
The most common commute times in Georgetown County are 30 to 34 minutes (1,511 commuters, 13.0%) for males and 5 to 9 minutes (1,981 commuters, 17.1%) for females.
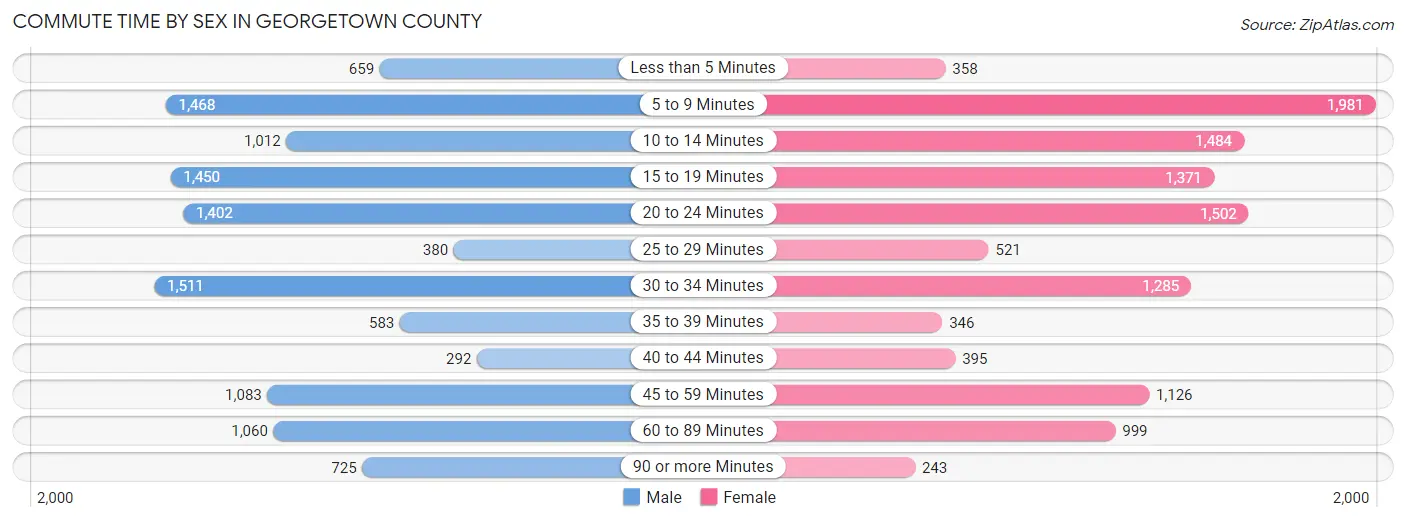
| Commute Time | Male | Female |
| Less than 5 Minutes | 659 (5.7%) | 358 (3.1%) |
| 5 to 9 Minutes | 1,468 (12.6%) | 1,981 (17.1%) |
| 10 to 14 Minutes | 1,012 (8.7%) | 1,484 (12.8%) |
| 15 to 19 Minutes | 1,450 (12.5%) | 1,371 (11.8%) |
| 20 to 24 Minutes | 1,402 (12.1%) | 1,502 (12.9%) |
| 25 to 29 Minutes | 380 (3.3%) | 521 (4.5%) |
| 30 to 34 Minutes | 1,511 (13.0%) | 1,285 (11.1%) |
| 35 to 39 Minutes | 583 (5.0%) | 346 (3.0%) |
| 40 to 44 Minutes | 292 (2.5%) | 395 (3.4%) |
| 45 to 59 Minutes | 1,083 (9.3%) | 1,126 (9.7%) |
| 60 to 89 Minutes | 1,060 (9.1%) | 999 (8.6%) |
| 90 or more Minutes | 725 (6.2%) | 243 (2.1%) |
Time of Departure to Work by Sex in Georgetown County
The most frequent times of departure to work in Georgetown County are 7:00 AM to 7:29 AM (1,886, 16.2%) for males and 7:00 AM to 7:29 AM (1,579, 13.6%) for females.
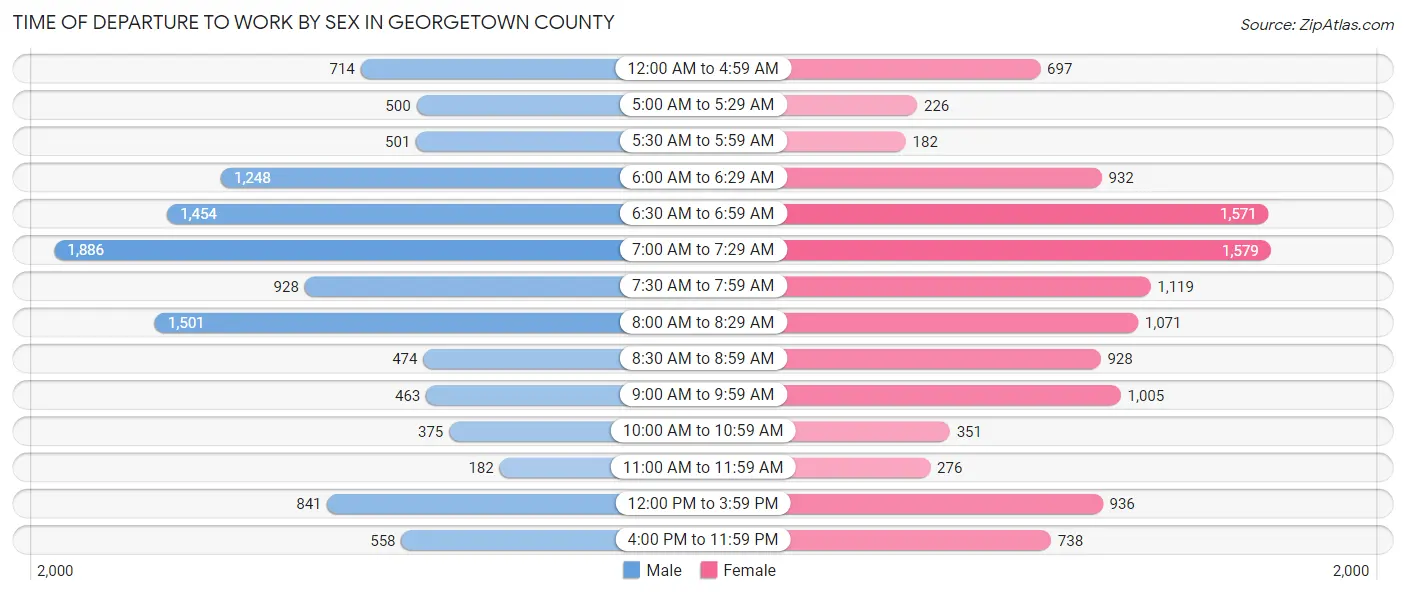
| Time of Departure | Male | Female |
| 12:00 AM to 4:59 AM | 714 (6.1%) | 697 (6.0%) |
| 5:00 AM to 5:29 AM | 500 (4.3%) | 226 (1.9%) |
| 5:30 AM to 5:59 AM | 501 (4.3%) | 182 (1.6%) |
| 6:00 AM to 6:29 AM | 1,248 (10.7%) | 932 (8.0%) |
| 6:30 AM to 6:59 AM | 1,454 (12.5%) | 1,571 (13.5%) |
| 7:00 AM to 7:29 AM | 1,886 (16.2%) | 1,579 (13.6%) |
| 7:30 AM to 7:59 AM | 928 (8.0%) | 1,119 (9.6%) |
| 8:00 AM to 8:29 AM | 1,501 (12.9%) | 1,071 (9.2%) |
| 8:30 AM to 8:59 AM | 474 (4.1%) | 928 (8.0%) |
| 9:00 AM to 9:59 AM | 463 (4.0%) | 1,005 (8.7%) |
| 10:00 AM to 10:59 AM | 375 (3.2%) | 351 (3.0%) |
| 11:00 AM to 11:59 AM | 182 (1.6%) | 276 (2.4%) |
| 12:00 PM to 3:59 PM | 841 (7.2%) | 936 (8.1%) |
| 4:00 PM to 11:59 PM | 558 (4.8%) | 738 (6.4%) |
| Total | 11,625 (100.0%) | 11,611 (100.0%) |
Housing Occupancy in Georgetown County
Occupancy by Ownership in Georgetown County
Of the total 26,029 dwellings in Georgetown County, owner-occupied units account for 21,281 (81.8%), while renter-occupied units make up 4,748 (18.2%).
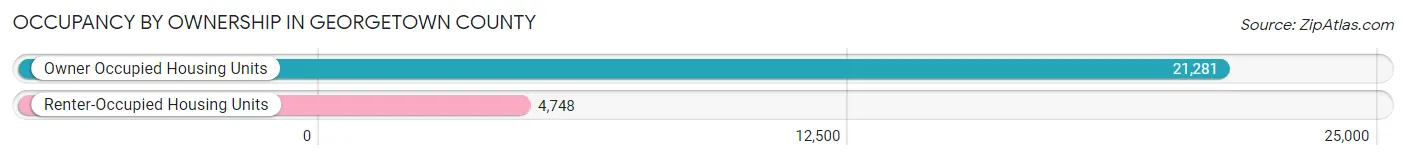
| Occupancy | # Housing Units | % Housing Units |
| Owner Occupied Housing Units | 21,281 | 81.8% |
| Renter-Occupied Housing Units | 4,748 | 18.2% |
| Total Occupied Housing Units | 26,029 | 100.0% |
Occupancy by Household Size in Georgetown County
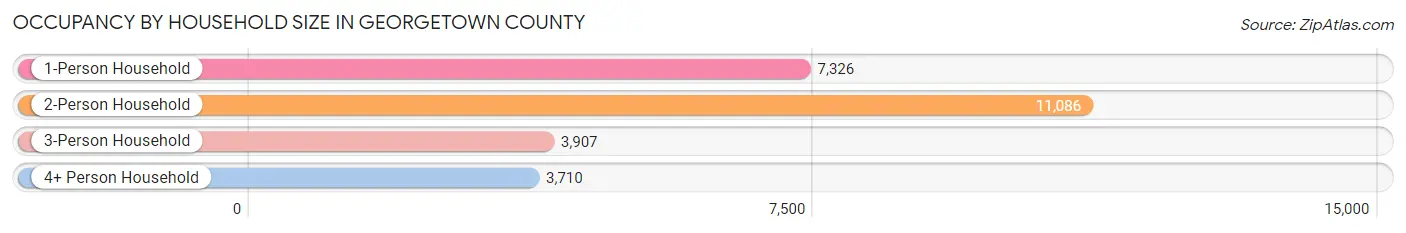
| Household Size | # Housing Units | % Housing Units |
| 1-Person Household | 7,326 | 28.1% |
| 2-Person Household | 11,086 | 42.6% |
| 3-Person Household | 3,907 | 15.0% |
| 4+ Person Household | 3,710 | 14.2% |
| Total Housing Units | 26,029 | 100.0% |
Occupancy by Ownership by Household Size in Georgetown County
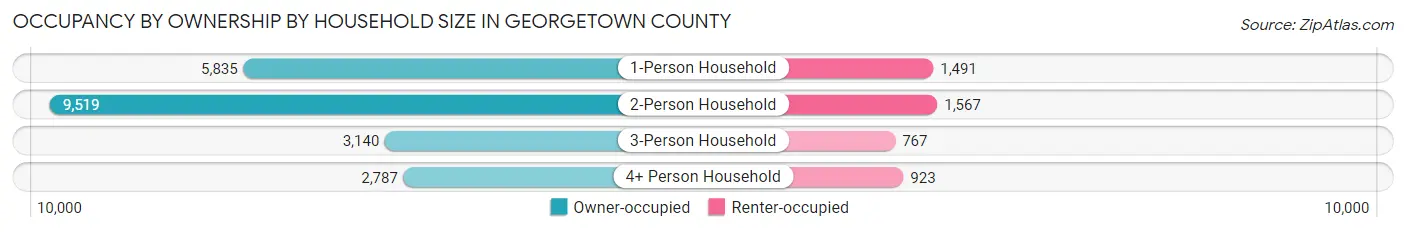
| Household Size | Owner-occupied | Renter-occupied |
| 1-Person Household | 5,835 (79.6%) | 1,491 (20.3%) |
| 2-Person Household | 9,519 (85.9%) | 1,567 (14.1%) |
| 3-Person Household | 3,140 (80.4%) | 767 (19.6%) |
| 4+ Person Household | 2,787 (75.1%) | 923 (24.9%) |
| Total Housing Units | 21,281 (81.8%) | 4,748 (18.2%) |
Occupancy by Educational Attainment in Georgetown County
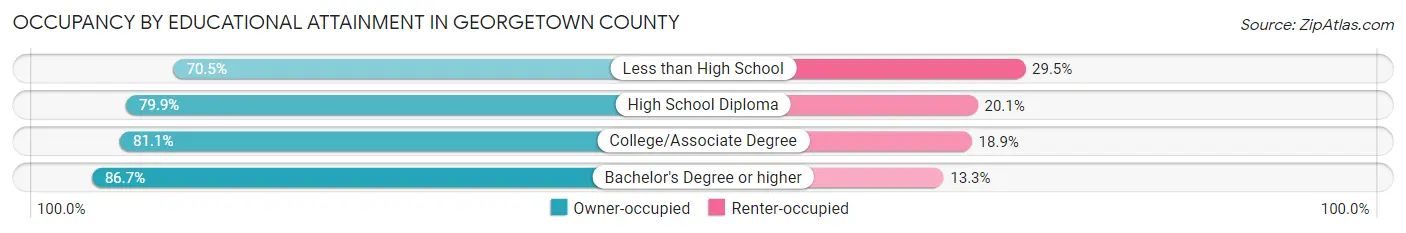
| Household Size | Owner-occupied | Renter-occupied |
| Less than High School | 1,601 (70.5%) | 671 (29.5%) |
| High School Diploma | 4,902 (79.9%) | 1,233 (20.1%) |
| College/Associate Degree | 7,182 (81.1%) | 1,677 (18.9%) |
| Bachelor's Degree or higher | 7,596 (86.7%) | 1,167 (13.3%) |
Occupancy by Age of Householder in Georgetown County
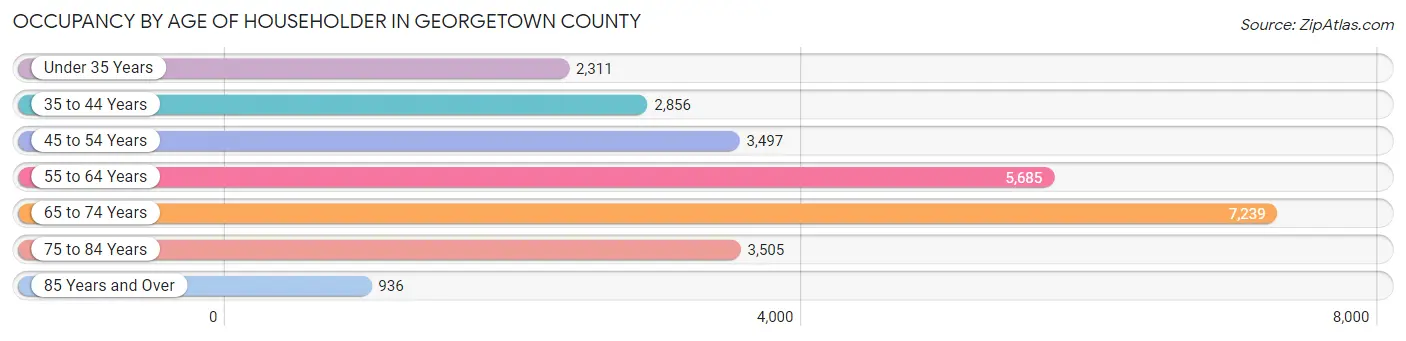
| Age Bracket | # Households | % Households |
| Under 35 Years | 2,311 | 8.9% |
| 35 to 44 Years | 2,856 | 11.0% |
| 45 to 54 Years | 3,497 | 13.4% |
| 55 to 64 Years | 5,685 | 21.8% |
| 65 to 74 Years | 7,239 | 27.8% |
| 75 to 84 Years | 3,505 | 13.5% |
| 85 Years and Over | 936 | 3.6% |
| Total | 26,029 | 100.0% |
Housing Finances in Georgetown County
Median Income by Occupancy in Georgetown County
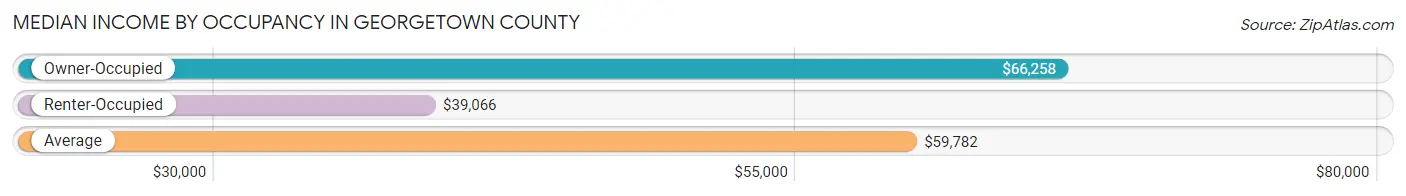
| Occupancy Type | # Households | Median Income |
| Owner-Occupied | 21,281 (81.8%) | $66,258 |
| Renter-Occupied | 4,748 (18.2%) | $39,066 |
| Average | 26,029 (100.0%) | $59,782 |
Occupancy by Householder Income Bracket in Georgetown County
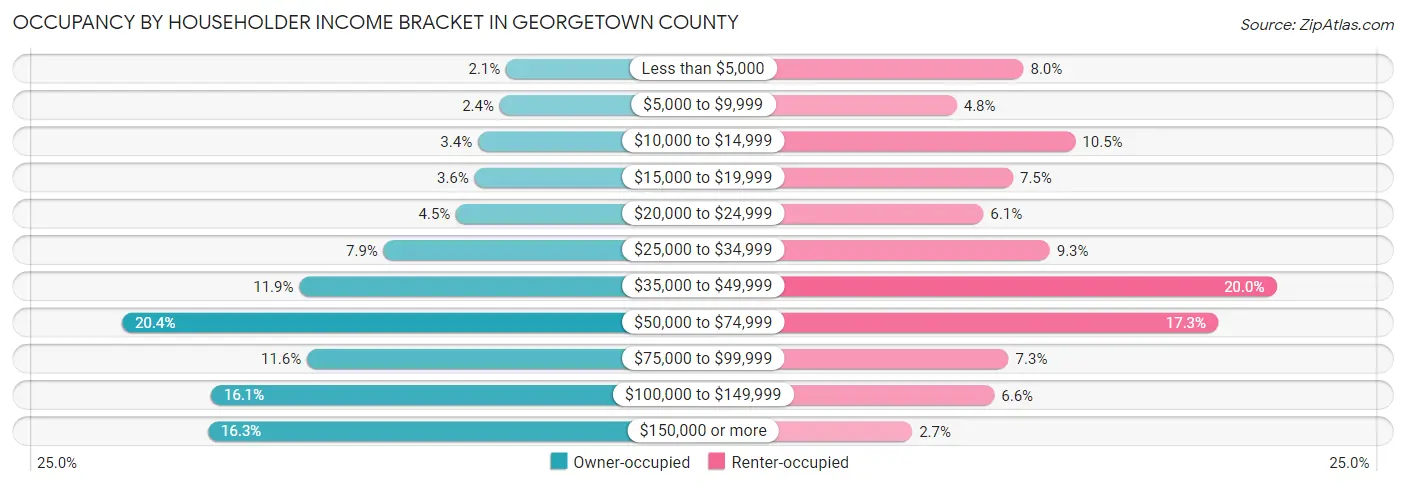
| Income Bracket | Owner-occupied | Renter-occupied |
| Less than $5,000 | 440 (2.1%) | 380 (8.0%) |
| $5,000 to $9,999 | 505 (2.4%) | 229 (4.8%) |
| $10,000 to $14,999 | 725 (3.4%) | 497 (10.5%) |
| $15,000 to $19,999 | 760 (3.6%) | 356 (7.5%) |
| $20,000 to $24,999 | 947 (4.4%) | 289 (6.1%) |
| $25,000 to $34,999 | 1,682 (7.9%) | 439 (9.2%) |
| $35,000 to $49,999 | 2,537 (11.9%) | 951 (20.0%) |
| $50,000 to $74,999 | 4,332 (20.4%) | 819 (17.2%) |
| $75,000 to $99,999 | 2,458 (11.6%) | 346 (7.3%) |
| $100,000 to $149,999 | 3,433 (16.1%) | 314 (6.6%) |
| $150,000 or more | 3,462 (16.3%) | 128 (2.7%) |
| Total | 21,281 (100.0%) | 4,748 (100.0%) |
Monthly Housing Cost Tiers in Georgetown County
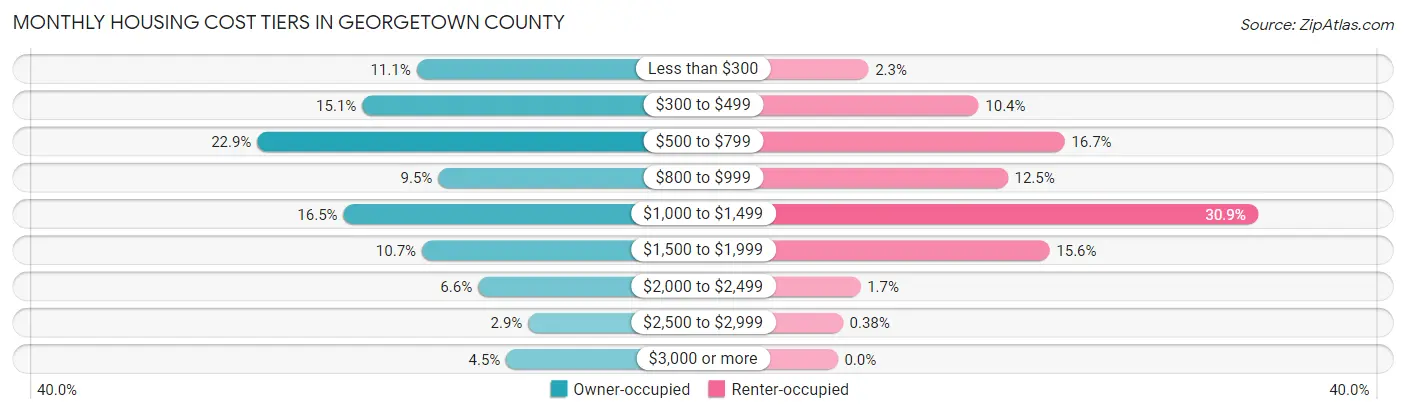
| Monthly Cost | Owner-occupied | Renter-occupied |
| Less than $300 | 2,370 (11.1%) | 108 (2.3%) |
| $300 to $499 | 3,222 (15.1%) | 493 (10.4%) |
| $500 to $799 | 4,867 (22.9%) | 794 (16.7%) |
| $800 to $999 | 2,031 (9.5%) | 595 (12.5%) |
| $1,000 to $1,499 | 3,516 (16.5%) | 1,469 (30.9%) |
| $1,500 to $1,999 | 2,285 (10.7%) | 741 (15.6%) |
| $2,000 to $2,499 | 1,406 (6.6%) | 80 (1.7%) |
| $2,500 to $2,999 | 619 (2.9%) | 18 (0.4%) |
| $3,000 or more | 965 (4.5%) | 0 (0.0%) |
| Total | 21,281 (100.0%) | 4,748 (100.0%) |
Physical Housing Characteristics in Georgetown County
Housing Structures in Georgetown County
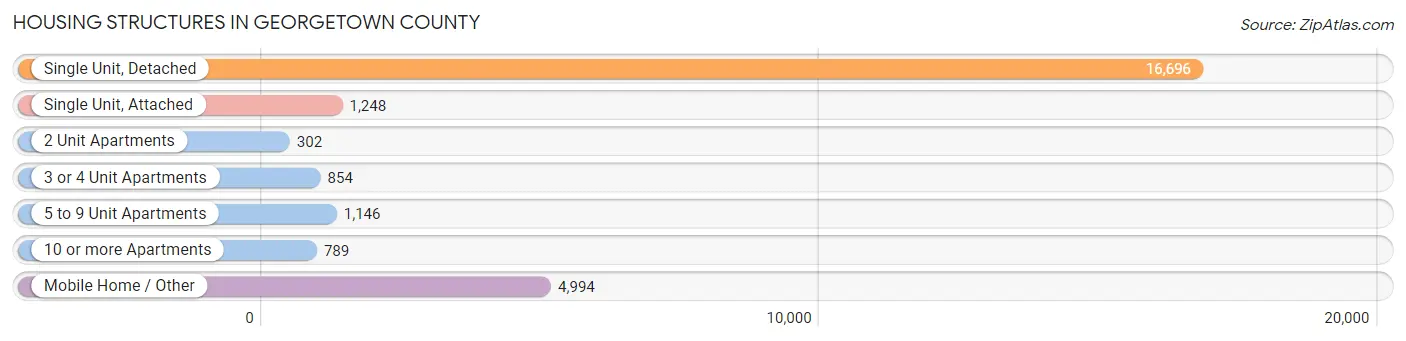
| Structure Type | # Housing Units | % Housing Units |
| Single Unit, Detached | 16,696 | 64.1% |
| Single Unit, Attached | 1,248 | 4.8% |
| 2 Unit Apartments | 302 | 1.2% |
| 3 or 4 Unit Apartments | 854 | 3.3% |
| 5 to 9 Unit Apartments | 1,146 | 4.4% |
| 10 or more Apartments | 789 | 3.0% |
| Mobile Home / Other | 4,994 | 19.2% |
| Total | 26,029 | 100.0% |
Housing Structures by Occupancy in Georgetown County
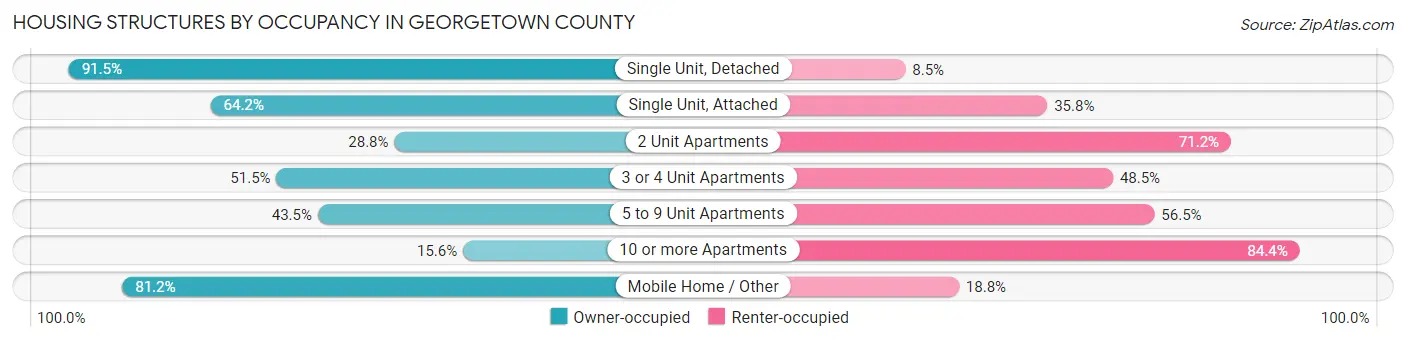
| Structure Type | Owner-occupied | Renter-occupied |
| Single Unit, Detached | 15,277 (91.5%) | 1,419 (8.5%) |
| Single Unit, Attached | 801 (64.2%) | 447 (35.8%) |
| 2 Unit Apartments | 87 (28.8%) | 215 (71.2%) |
| 3 or 4 Unit Apartments | 440 (51.5%) | 414 (48.5%) |
| 5 to 9 Unit Apartments | 499 (43.5%) | 647 (56.5%) |
| 10 or more Apartments | 123 (15.6%) | 666 (84.4%) |
| Mobile Home / Other | 4,054 (81.2%) | 940 (18.8%) |
| Total | 21,281 (81.8%) | 4,748 (18.2%) |
Housing Structures by Number of Rooms in Georgetown County
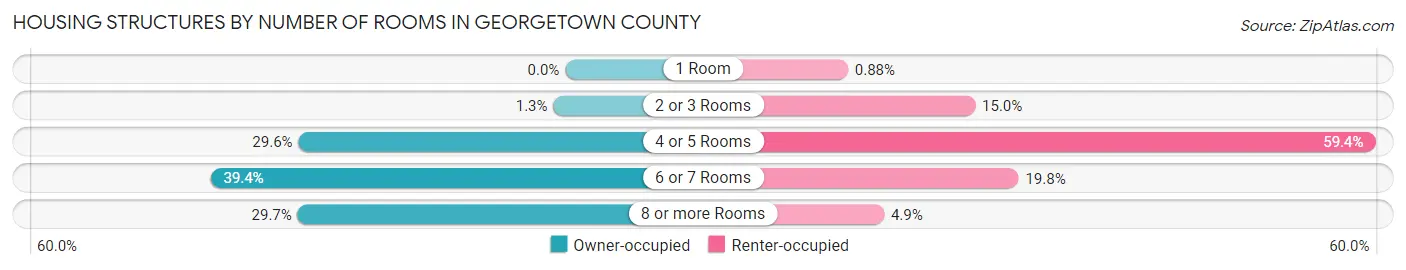
| Number of Rooms | Owner-occupied | Renter-occupied |
| 1 Room | 0 (0.0%) | 42 (0.9%) |
| 2 or 3 Rooms | 281 (1.3%) | 712 (15.0%) |
| 4 or 5 Rooms | 6,301 (29.6%) | 2,821 (59.4%) |
| 6 or 7 Rooms | 8,379 (39.4%) | 941 (19.8%) |
| 8 or more Rooms | 6,320 (29.7%) | 232 (4.9%) |
| Total | 21,281 (100.0%) | 4,748 (100.0%) |
Housing Structure by Heating Type in Georgetown County
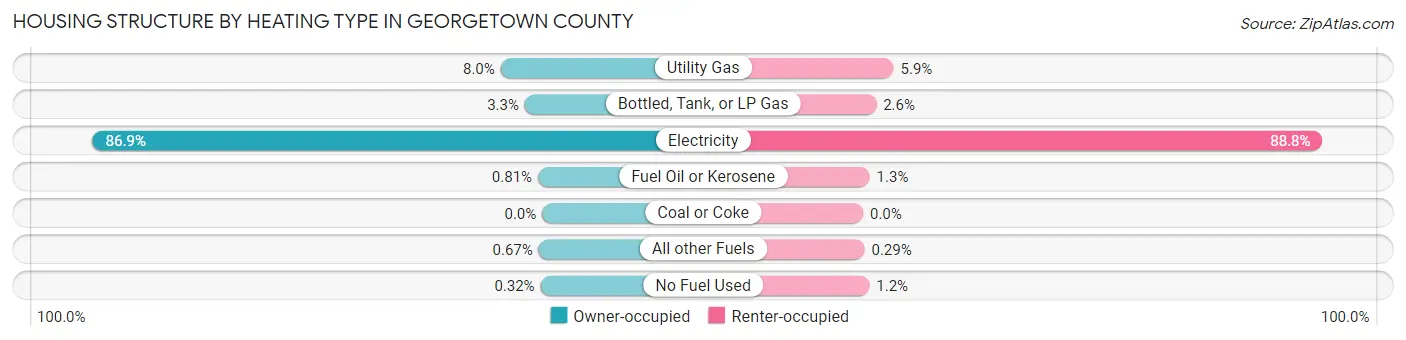
| Heating Type | Owner-occupied | Renter-occupied |
| Utility Gas | 1,706 (8.0%) | 280 (5.9%) |
| Bottled, Tank, or LP Gas | 711 (3.3%) | 121 (2.5%) |
| Electricity | 18,482 (86.9%) | 4,214 (88.7%) |
| Fuel Oil or Kerosene | 172 (0.8%) | 61 (1.3%) |
| Coal or Coke | 0 (0.0%) | 0 (0.0%) |
| All other Fuels | 142 (0.7%) | 14 (0.3%) |
| No Fuel Used | 68 (0.3%) | 58 (1.2%) |
| Total | 21,281 (100.0%) | 4,748 (100.0%) |
Household Vehicle Usage in Georgetown County
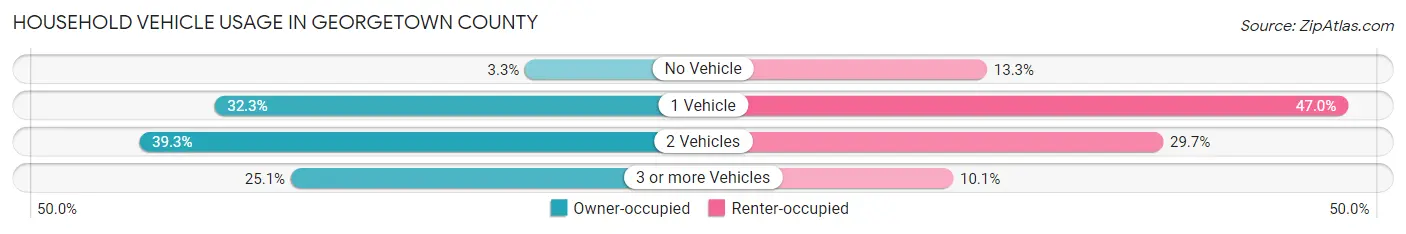
| Vehicles per Household | Owner-occupied | Renter-occupied |
| No Vehicle | 695 (3.3%) | 629 (13.3%) |
| 1 Vehicle | 6,872 (32.3%) | 2,230 (47.0%) |
| 2 Vehicles | 8,365 (39.3%) | 1,410 (29.7%) |
| 3 or more Vehicles | 5,349 (25.1%) | 479 (10.1%) |
| Total | 21,281 (100.0%) | 4,748 (100.0%) |
Real Estate & Mortgages in Georgetown County
Real Estate and Mortgage Overview in Georgetown County
| Characteristic | Without Mortgage | With Mortgage |
| Housing Units | 10,718 | 10,563 |
| Median Property Value | $182,100 | $271,000 |
| Median Household Income | $56,121 | $2,324 |
| Monthly Housing Costs | $490 | $932 |
| Real Estate Taxes | $869 | $236 |
Property Value by Mortgage Status in Georgetown County
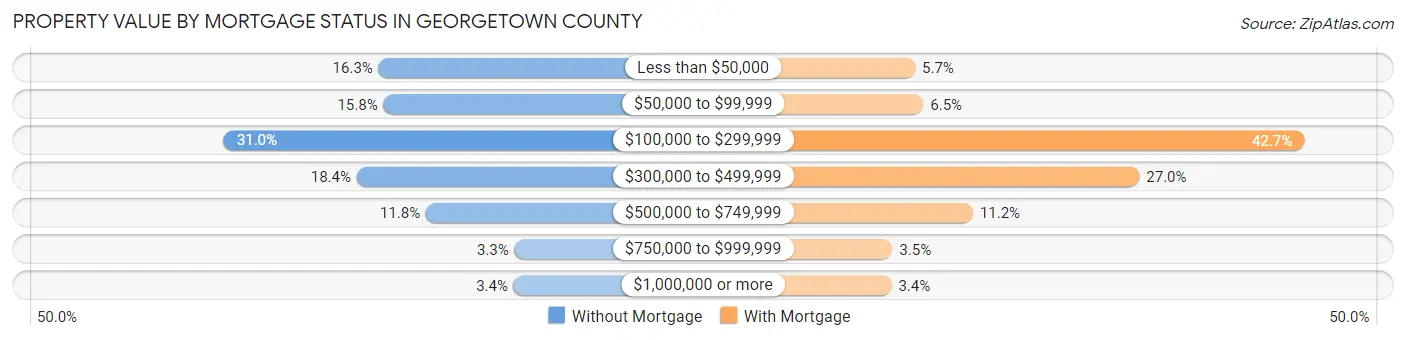
| Property Value | Without Mortgage | With Mortgage |
| Less than $50,000 | 1,745 (16.3%) | 599 (5.7%) |
| $50,000 to $99,999 | 1,696 (15.8%) | 682 (6.5%) |
| $100,000 to $299,999 | 3,325 (31.0%) | 4,514 (42.7%) |
| $300,000 to $499,999 | 1,968 (18.4%) | 2,855 (27.0%) |
| $500,000 to $749,999 | 1,261 (11.8%) | 1,181 (11.2%) |
| $750,000 to $999,999 | 358 (3.3%) | 371 (3.5%) |
| $1,000,000 or more | 365 (3.4%) | 361 (3.4%) |
| Total | 10,718 (100.0%) | 10,563 (100.0%) |
Household Income by Mortgage Status in Georgetown County
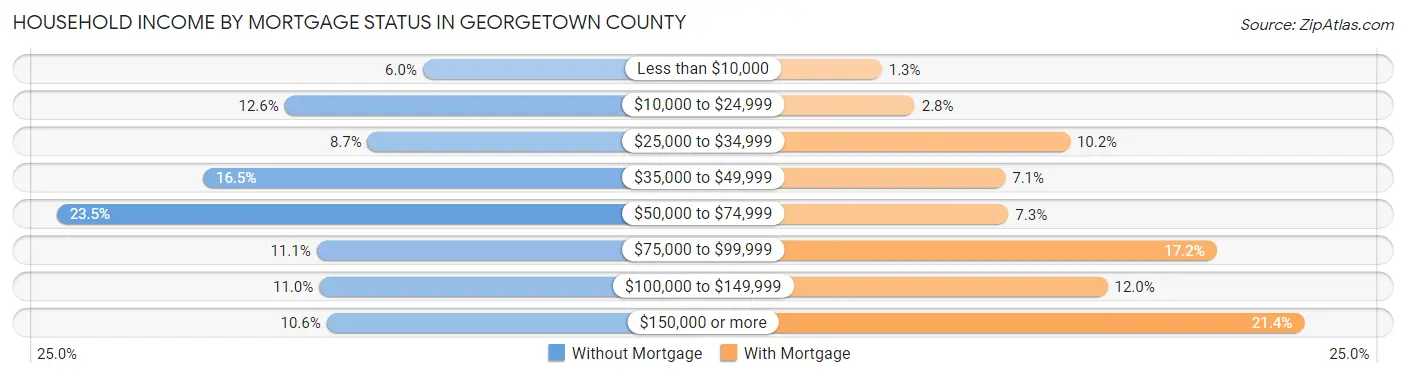
| Household Income | Without Mortgage | With Mortgage |
| Less than $10,000 | 647 (6.0%) | 132 (1.3%) |
| $10,000 to $24,999 | 1,353 (12.6%) | 298 (2.8%) |
| $25,000 to $34,999 | 929 (8.7%) | 1,079 (10.2%) |
| $35,000 to $49,999 | 1,768 (16.5%) | 753 (7.1%) |
| $50,000 to $74,999 | 2,516 (23.5%) | 769 (7.3%) |
| $75,000 to $99,999 | 1,190 (11.1%) | 1,816 (17.2%) |
| $100,000 to $149,999 | 1,177 (11.0%) | 1,268 (12.0%) |
| $150,000 or more | 1,138 (10.6%) | 2,256 (21.4%) |
| Total | 10,718 (100.0%) | 10,563 (100.0%) |
Property Value to Household Income Ratio in Georgetown County
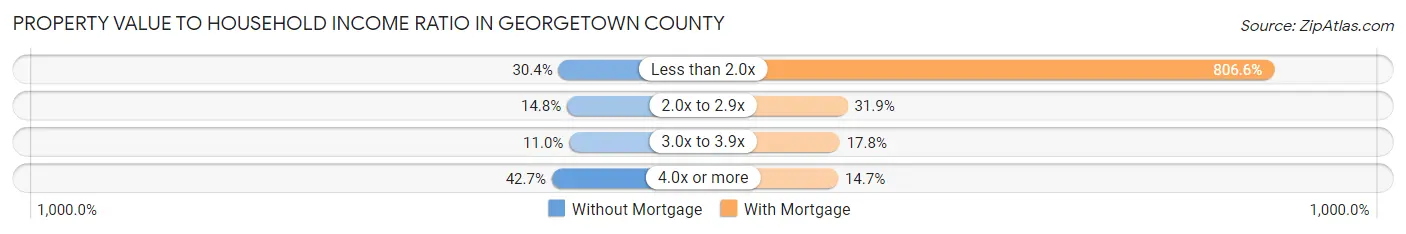
| Value-to-Income Ratio | Without Mortgage | With Mortgage |
| Less than 2.0x | 3,255 (30.4%) | 85,198 (806.6%) |
| 2.0x to 2.9x | 1,586 (14.8%) | 3,371 (31.9%) |
| 3.0x to 3.9x | 1,182 (11.0%) | 1,879 (17.8%) |
| 4.0x or more | 4,574 (42.7%) | 1,547 (14.6%) |
| Total | 10,718 (100.0%) | 10,563 (100.0%) |
Real Estate Taxes by Mortgage Status in Georgetown County
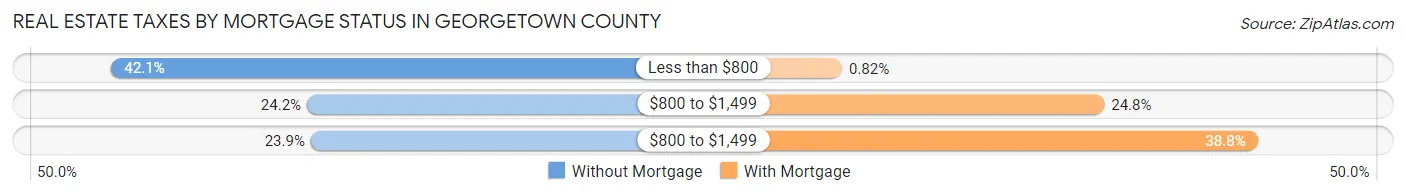
| Property Taxes | Without Mortgage | With Mortgage |
| Less than $800 | 4,509 (42.1%) | 87 (0.8%) |
| $800 to $1,499 | 2,596 (24.2%) | 2,616 (24.8%) |
| $800 to $1,499 | 2,558 (23.9%) | 4,094 (38.8%) |
| Total | 10,718 (100.0%) | 10,563 (100.0%) |
Health & Disability in Georgetown County
Health Insurance Coverage by Age in Georgetown County
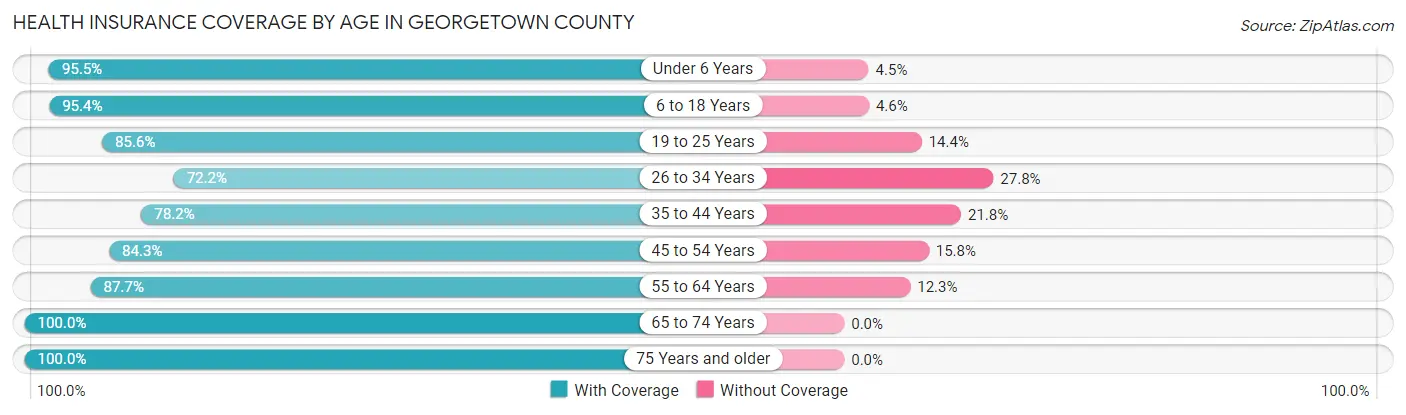
| Age Bracket | With Coverage | Without Coverage |
| Under 6 Years | 3,046 (95.5%) | 145 (4.5%) |
| 6 to 18 Years | 8,165 (95.4%) | 394 (4.6%) |
| 19 to 25 Years | 4,010 (85.6%) | 677 (14.4%) |
| 26 to 34 Years | 3,621 (72.2%) | 1,395 (27.8%) |
| 35 to 44 Years | 4,733 (78.2%) | 1,318 (21.8%) |
| 45 to 54 Years | 6,043 (84.3%) | 1,130 (15.8%) |
| 55 to 64 Years | 8,899 (87.7%) | 1,248 (12.3%) |
| 65 to 74 Years | 11,297 (100.0%) | 0 (0.0%) |
| 75 Years and older | 6,985 (100.0%) | 0 (0.0%) |
| Total | 56,799 (90.0%) | 6,307 (10.0%) |
Health Insurance Coverage by Citizenship Status in Georgetown County
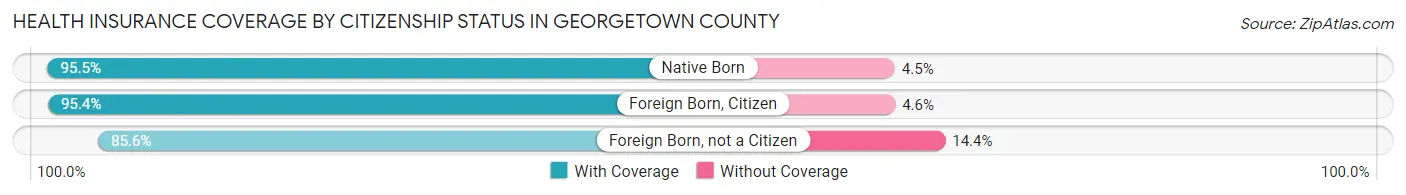
| Citizenship Status | With Coverage | Without Coverage |
| Native Born | 3,046 (95.5%) | 145 (4.5%) |
| Foreign Born, Citizen | 8,165 (95.4%) | 394 (4.6%) |
| Foreign Born, not a Citizen | 4,010 (85.6%) | 677 (14.4%) |
Health Insurance Coverage by Household Income in Georgetown County
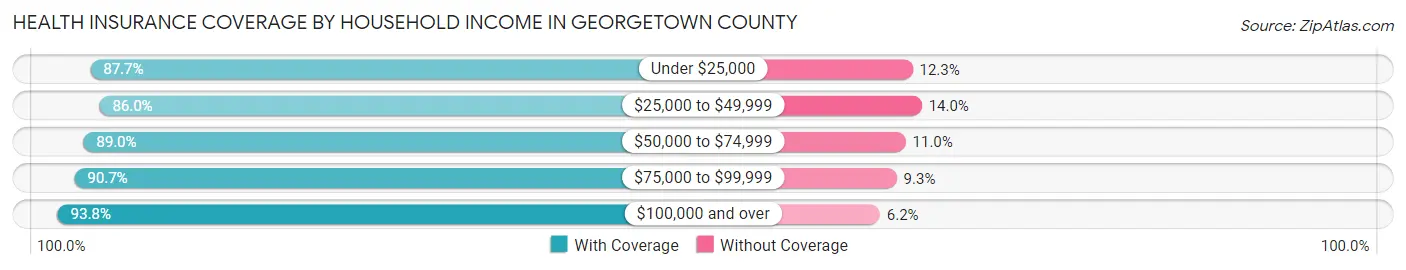
| Household Income | With Coverage | Without Coverage |
| Under $25,000 | 8,967 (87.7%) | 1,259 (12.3%) |
| $25,000 to $49,999 | 10,649 (86.0%) | 1,738 (14.0%) |
| $50,000 to $74,999 | 10,539 (89.0%) | 1,305 (11.0%) |
| $75,000 to $99,999 | 6,114 (90.7%) | 630 (9.3%) |
| $100,000 and over | 20,412 (93.8%) | 1,347 (6.2%) |
Public vs Private Health Insurance Coverage by Age in Georgetown County
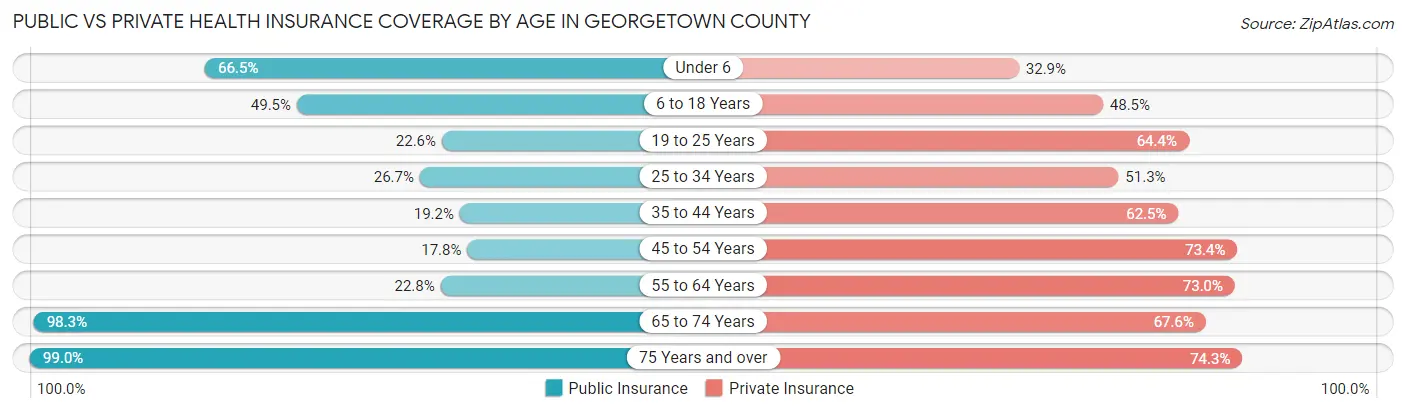
| Age Bracket | Public Insurance | Private Insurance |
| Under 6 | 2,122 (66.5%) | 1,049 (32.9%) |
| 6 to 18 Years | 4,234 (49.5%) | 4,148 (48.5%) |
| 19 to 25 Years | 1,057 (22.6%) | 3,018 (64.4%) |
| 25 to 34 Years | 1,337 (26.7%) | 2,575 (51.3%) |
| 35 to 44 Years | 1,163 (19.2%) | 3,780 (62.5%) |
| 45 to 54 Years | 1,279 (17.8%) | 5,265 (73.4%) |
| 55 to 64 Years | 2,314 (22.8%) | 7,402 (73.0%) |
| 65 to 74 Years | 11,105 (98.3%) | 7,631 (67.5%) |
| 75 Years and over | 6,916 (99.0%) | 5,191 (74.3%) |
| Total | 31,527 (50.0%) | 40,059 (63.5%) |
Disability Status by Sex by Age in Georgetown County
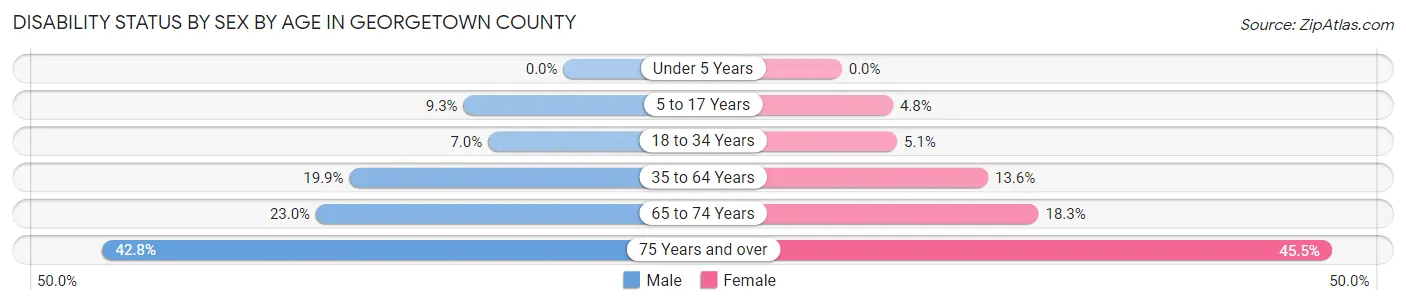
| Age Bracket | Male | Female |
| Under 5 Years | 0 (0.0%) | 0 (0.0%) |
| 5 to 17 Years | 416 (9.3%) | 186 (4.8%) |
| 18 to 34 Years | 364 (7.0%) | 265 (5.1%) |
| 35 to 64 Years | 2,143 (19.9%) | 1,707 (13.6%) |
| 65 to 74 Years | 1,187 (23.0%) | 1,119 (18.3%) |
| 75 Years and over | 1,349 (42.8%) | 1,741 (45.5%) |
Disability Class by Sex by Age in Georgetown County
Disability Class: Hearing Difficulty
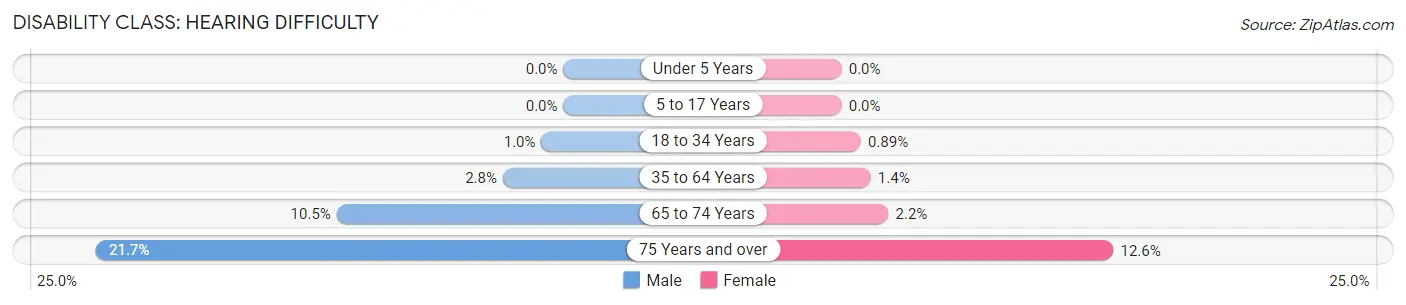
| Age Bracket | Male | Female |
| Under 5 Years | 0 (0.0%) | 0 (0.0%) |
| 5 to 17 Years | 0 (0.0%) | 0 (0.0%) |
| 18 to 34 Years | 53 (1.0%) | 46 (0.9%) |
| 35 to 64 Years | 303 (2.8%) | 170 (1.3%) |
| 65 to 74 Years | 544 (10.5%) | 133 (2.2%) |
| 75 Years and over | 684 (21.7%) | 483 (12.6%) |
Disability Class: Vision Difficulty
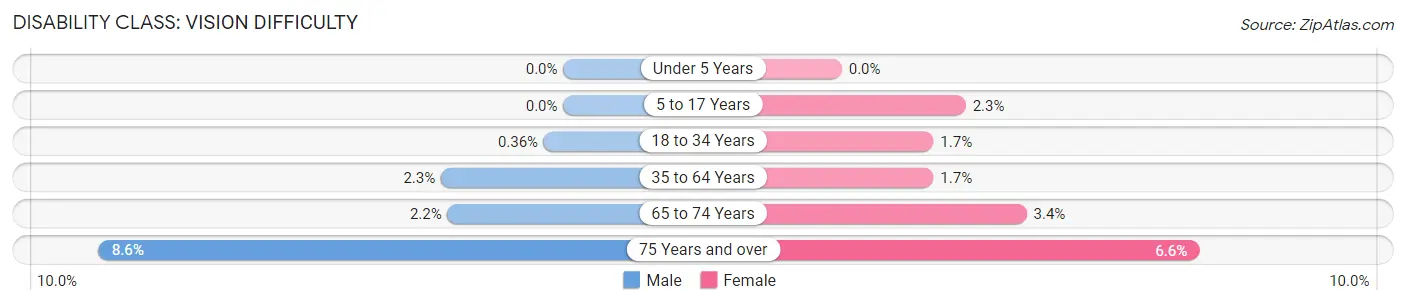
| Age Bracket | Male | Female |
| Under 5 Years | 0 (0.0%) | 0 (0.0%) |
| 5 to 17 Years | 0 (0.0%) | 90 (2.3%) |
| 18 to 34 Years | 19 (0.4%) | 88 (1.7%) |
| 35 to 64 Years | 245 (2.3%) | 214 (1.7%) |
| 65 to 74 Years | 111 (2.1%) | 210 (3.4%) |
| 75 Years and over | 272 (8.6%) | 254 (6.6%) |
Disability Class: Cognitive Difficulty
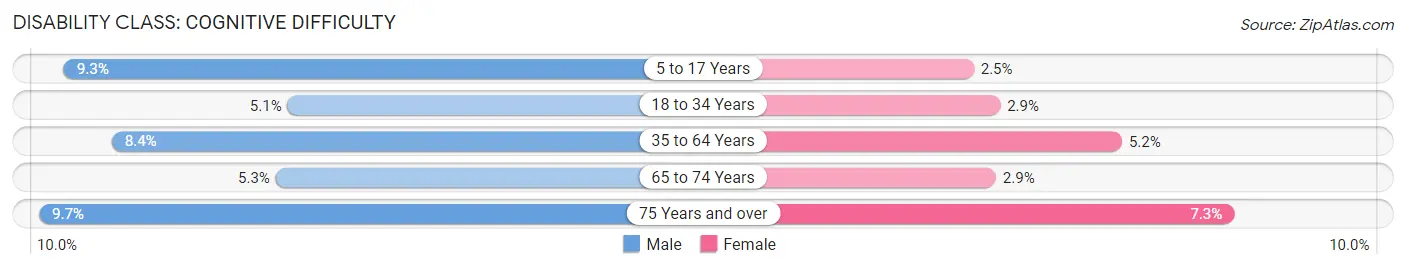
| Age Bracket | Male | Female |
| 5 to 17 Years | 416 (9.3%) | 96 (2.5%) |
| 18 to 34 Years | 267 (5.1%) | 152 (2.9%) |
| 35 to 64 Years | 904 (8.4%) | 654 (5.2%) |
| 65 to 74 Years | 276 (5.3%) | 175 (2.9%) |
| 75 Years and over | 307 (9.7%) | 279 (7.3%) |
Disability Class: Ambulatory Difficulty
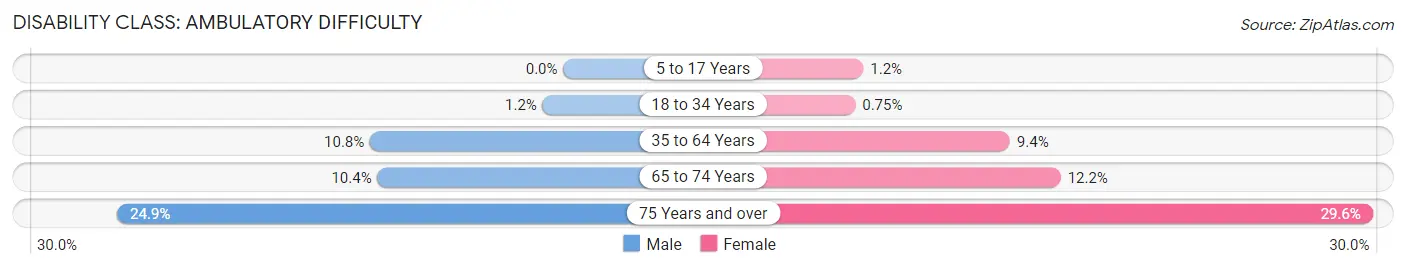
| Age Bracket | Male | Female |
| 5 to 17 Years | 0 (0.0%) | 47 (1.2%) |
| 18 to 34 Years | 60 (1.1%) | 39 (0.7%) |
| 35 to 64 Years | 1,161 (10.8%) | 1,178 (9.4%) |
| 65 to 74 Years | 535 (10.3%) | 747 (12.2%) |
| 75 Years and over | 784 (24.8%) | 1,132 (29.6%) |
Disability Class: Self-Care Difficulty
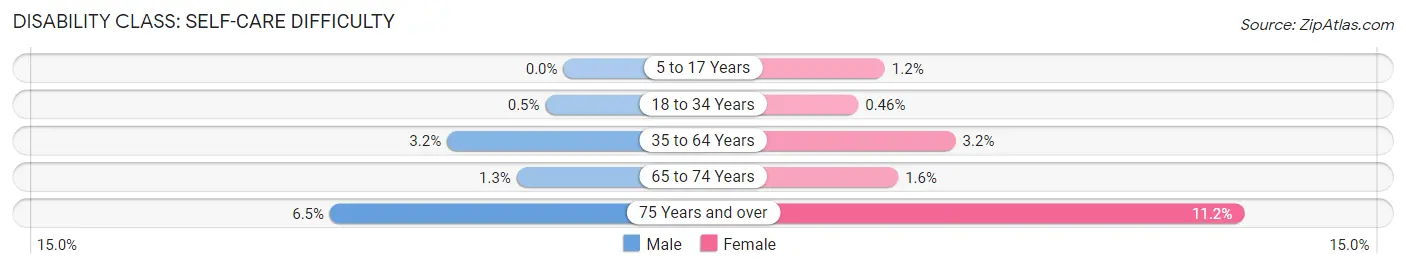
| Age Bracket | Male | Female |
| 5 to 17 Years | 0 (0.0%) | 47 (1.2%) |
| 18 to 34 Years | 26 (0.5%) | 24 (0.5%) |
| 35 to 64 Years | 350 (3.2%) | 399 (3.2%) |
| 65 to 74 Years | 67 (1.3%) | 96 (1.6%) |
| 75 Years and over | 205 (6.5%) | 429 (11.2%) |
Technology Access in Georgetown County
Computing Device Access in Georgetown County
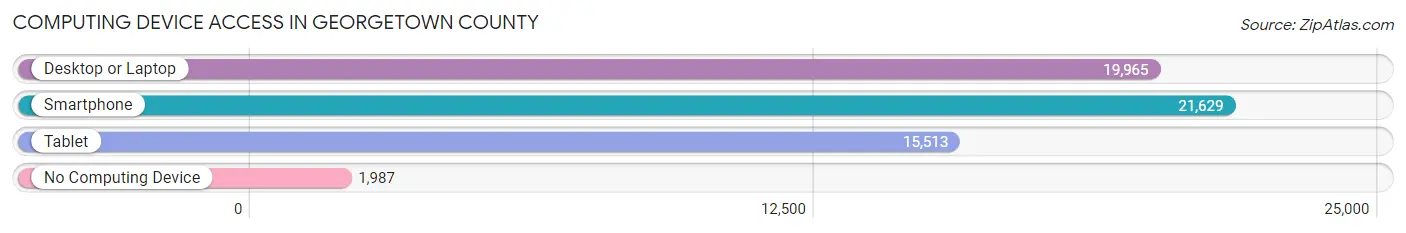
| Device Type | # Households | % Households |
| Desktop or Laptop | 19,965 | 76.7% |
| Smartphone | 21,629 | 83.1% |
| Tablet | 15,513 | 59.6% |
| No Computing Device | 1,987 | 7.6% |
| Total | 26,029 | 100.0% |
Internet Access in Georgetown County
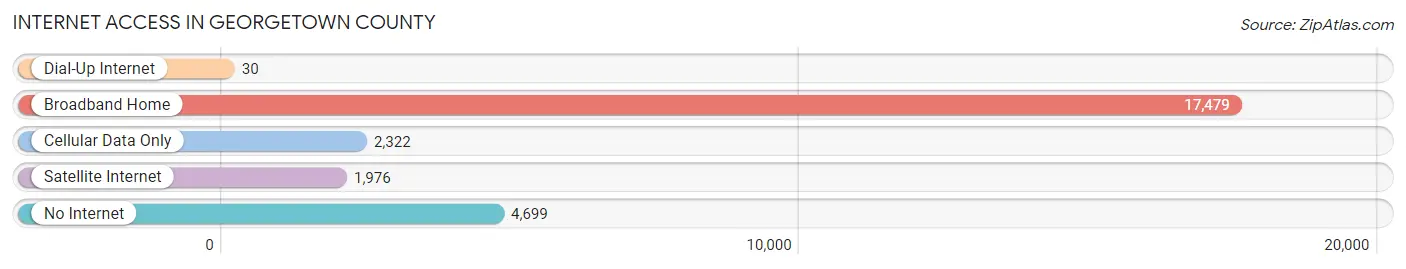
| Internet Type | # Households | % Households |
| Dial-Up Internet | 30 | 0.1% |
| Broadband Home | 17,479 | 67.1% |
| Cellular Data Only | 2,322 | 8.9% |
| Satellite Internet | 1,976 | 7.6% |
| No Internet | 4,699 | 18.0% |
| Total | 26,029 | 100.0% |
Georgetown County Summary
Georgetown County, South Carolina is located in the southeastern corner of the state, along the Atlantic coast. It is bordered by Horry County to the north, Williamsburg County to the west, and Charleston County to the south. The county seat is Georgetown, and the county is home to a population of 60,158 people, according to the 2020 U.S. Census.
Geography
Georgetown County is located in the coastal plain region of South Carolina, and is characterized by flat terrain and sandy soils. The county is divided into two distinct regions: the coastal plain and the uplands. The coastal plain is located along the Atlantic coast and is characterized by low-lying terrain and sandy soils. The uplands are located further inland and are characterized by rolling hills and clay soils. The county is home to several rivers, including the Sampit, Black, and Waccamaw Rivers.
The county is home to several protected areas, including the Francis Marion National Forest, the Waccamaw National Wildlife Refuge, and the Santee Coastal Reserve. These areas provide habitat for a variety of wildlife, including white-tailed deer, wild turkeys, and bald eagles.
History
Georgetown County was established in 1769, and was named after King George III of England. The county was originally part of the colonial Province of South Carolina, and was one of the original seven counties of the state.
The county was home to several Native American tribes, including the Waccamaw, Pee Dee, and Catawba. The first European settlers arrived in the area in the late 1600s, and the county was home to several plantations during the colonial period.
The county was an important port during the Revolutionary War, and was the site of several battles. The county was also an important port during the Civil War, and was the site of several battles.
Economy
Georgetown County is home to a diverse economy, with a mix of manufacturing, agriculture, and tourism. The county is home to several manufacturing companies, including International Paper, Sonoco Products, and DAK Americas. The county is also home to several agricultural operations, including poultry, soybean, and cotton farms.
Tourism is an important part of the county’s economy, and the county is home to several popular attractions, including Huntington Beach State Park, Brookgreen Gardens, and the Georgetown County Museum.
Demographics
According to the 2020 U.S. Census, the population of Georgetown County is 60,158 people. The population is 57.3% White, 37.2% African American, 2.2% Hispanic or Latino, 1.2% Asian, and 0.3% Native American. The median household income is $45,845, and the median home value is $179,400.
Georgetown County is home to several colleges and universities, including Coastal Carolina University, Horry-Georgetown Technical College, and the University of South Carolina-Beaufort. The county is also home to several public schools, including Georgetown High School, Waccamaw High School, and Carvers Bay High School.
Conclusion
Georgetown County, South Carolina is a coastal county located in the southeastern corner of the state. The county is home to a population of 60,158 people, and is characterized by flat terrain and sandy soils. The county is home to a diverse economy, with a mix of manufacturing, agriculture, and tourism. The population is 57.3% White, 37.2% African American, 2.2% Hispanic or Latino, 1.2% Asian, and 0.3% Native American. Georgetown County is home to several protected areas, colleges and universities, and public schools.
Common Questions
What is Per Capita Income in Georgetown County?
Per Capita income in Georgetown County is $39,403.
What is the Median Family Income in Georgetown County?
Median Family Income in Georgetown County is $71,440.
What is the Median Household income in Georgetown County?
Median Household Income in Georgetown County is $59,782.
What is Income or Wage Gap in Georgetown County?
Income or Wage Gap in Georgetown County is 36.0%.
Women in Georgetown County earn 64.0 cents for every dollar earned by a man.
What is Family Income Deficit in Georgetown County?
Family Income Deficit in Georgetown County is $9,056.
Families that are below poverty line in Georgetown County earn $9,056 less on average than the poverty threshold level.
What is Inequality or Gini Index in Georgetown County?
Inequality or Gini Index in Georgetown County is 0.49.
What is the Total Population of Georgetown County?
Total Population of Georgetown County is 63,594.
What is the Total Male Population of Georgetown County?
Total Male Population of Georgetown County is 30,536.
What is the Total Female Population of Georgetown County?
Total Female Population of Georgetown County is 33,058.
What is the Ratio of Males per 100 Females in Georgetown County?
There are 92.37 Males per 100 Females in Georgetown County.
What is the Ratio of Females per 100 Males in Georgetown County?
There are 108.26 Females per 100 Males in Georgetown County.
What is the Median Population Age in Georgetown County?
Median Population Age in Georgetown County is 51.0 Years.
What is the Average Family Size in Georgetown County
Average Family Size in Georgetown County is 3.0 People.
What is the Average Household Size in Georgetown County
Average Household Size in Georgetown County is 2.4 People.
How Large is the Labor Force in Georgetown County?
There are 27,446 People in the Labor Forcein in Georgetown County.
What is the Percentage of People in the Labor Force in Georgetown County?
51.1% of People are in the Labor Force in Georgetown County.
What is the Unemployment Rate in Georgetown County?
Unemployment Rate in Georgetown County is 5.0%.