Cities with the Highest Percentage of Population Employed in Mining, Quarrying, & Extraction in the United States
RELATED REPORTS & OPTIONS
Mining, Quarrying, & Extraction
United States
Compare Cities
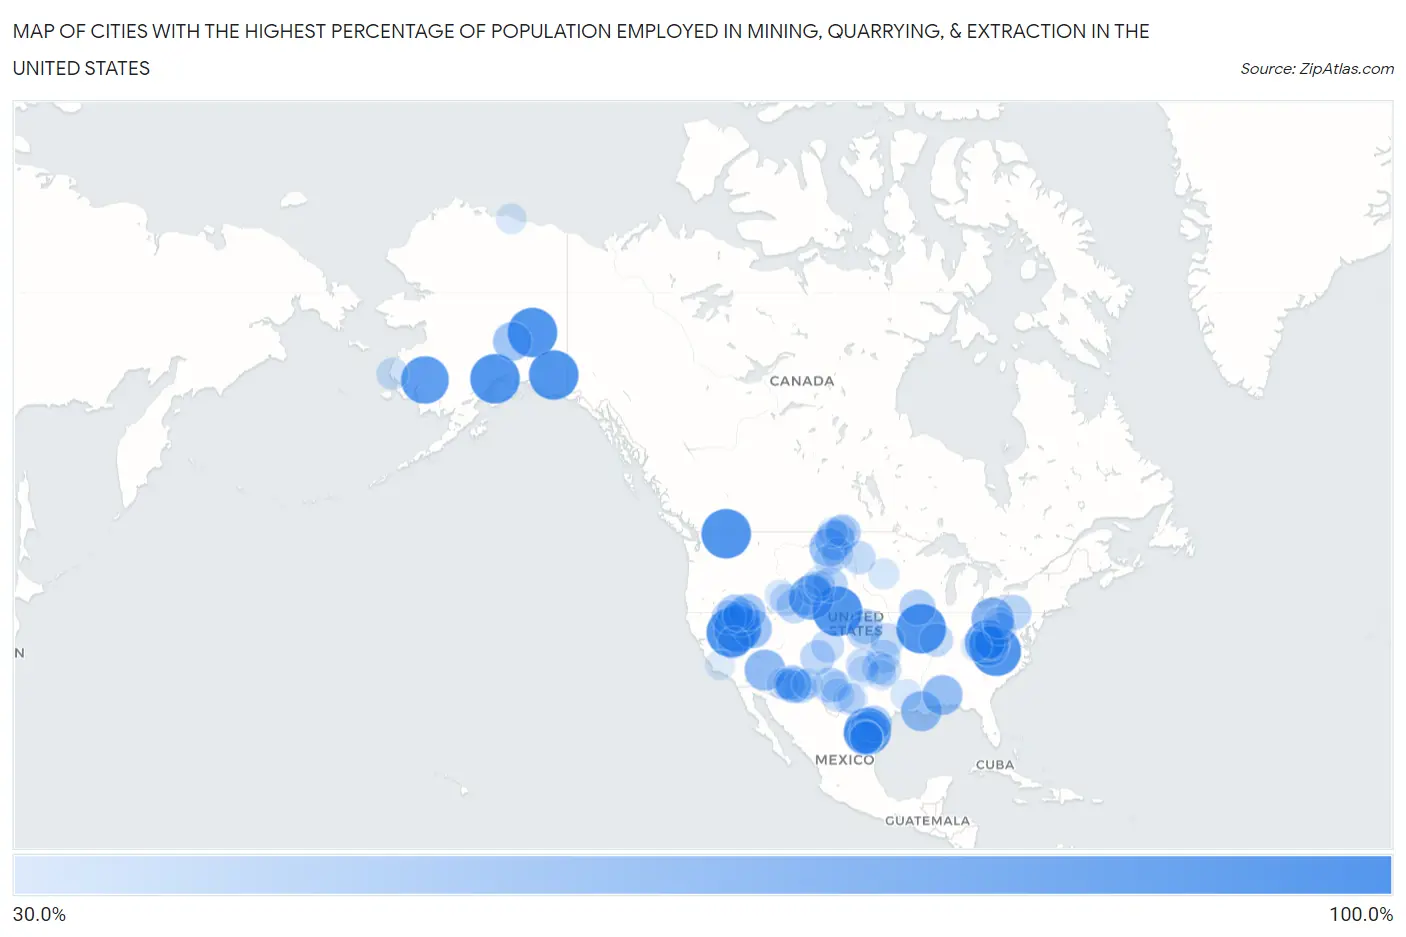
Map of Cities with the Highest Percentage of Population Employed in Mining, Quarrying, & Extraction in the United States
0.0%
100.0%
Cities with the Highest Percentage of Population Employed in Mining, Quarrying, & Extraction in the United States
| City | % Employed | vs State | vs National | |
| 1. | St Clement | 100.0% | 0.18%(+99.8)#1 | 0.44%(+99.6)#1 |
| 2. | Gabbs | 100.0% | 0.96%(+99.0)#1 | 0.44%(+99.6)#2 |
| 3. | Whitestone | 100.0% | 3.1%(+96.9)#1 | 0.44%(+99.6)#3 |
| 4. | Loma Linda East Cdp Jim Wells County | 100.0% | 1.9%(+98.1)#1 | 0.44%(+99.6)#4 |
| 5. | Malo | 100.0% | 0.087%(+99.9)#1 | 0.44%(+99.6)#5 |
| 6. | Fancy Gap | 100.0% | 0.17%(+99.8)#1 | 0.44%(+99.6)#6 |
| 7. | Lorenzo | 100.0% | 0.14%(+99.9)#1 | 0.44%(+99.6)#7 |
| 8. | Beluga | 100.0% | 3.1%(+96.9)#2 | 0.44%(+99.6)#8 |
| 9. | Mccarthy | 100.0% | 3.1%(+96.9)#3 | 0.44%(+99.6)#9 |
| 10. | Tuluksak | 93.2% | 3.1%(+90.1)#4 | 0.44%(+92.8)#10 |
| 11. | Kingston | 91.3% | 0.96%(+90.3)#2 | 0.44%(+90.9)#11 |
| 12. | South Fork Estates | 91.3% | 1.9%(+89.5)#2 | 0.44%(+90.9)#12 |
| 13. | Sarah Ann | 84.1% | 2.6%(+81.6)#1 | 0.44%(+83.7)#13 |
| 14. | Alcova | 82.4% | 6.4%(+76.0)#1 | 0.44%(+81.9)#14 |
| 15. | Chula Vista Cdp Cameron County | 79.1% | 1.9%(+77.2)#3 | 0.44%(+78.6)#15 |
| 16. | Tippecanoe | 73.3% | 0.21%(+73.1)#1 | 0.44%(+72.9)#16 |
| 17. | Bagdad | 68.9% | 0.46%(+68.5)#1 | 0.44%(+68.5)#17 |
| 18. | Raysal | 66.7% | 2.6%(+64.1)#2 | 0.44%(+66.2)#18 |
| 19. | Casas Adobes | 66.7% | 2.1%(+64.5)#1 | 0.44%(+66.2)#19 |
| 20. | Falcon Mesa | 66.7% | 1.9%(+64.8)#4 | 0.44%(+66.2)#20 |
| 21. | Siracusaville | 66.4% | 2.4%(+64.0)#1 | 0.44%(+65.9)#21 |
| 22. | Cullomburg | 66.0% | 0.39%(+65.7)#1 | 0.44%(+65.6)#22 |
| 23. | Epping | 63.2% | 3.0%(+60.2)#1 | 0.44%(+62.7)#23 |
| 24. | Denali Park | 61.7% | 3.1%(+58.6)#5 | 0.44%(+61.2)#24 |
| 25. | Ruth | 61.7% | 0.96%(+60.7)#3 | 0.44%(+61.2)#25 |
| 26. | Crane | 61.1% | 1.4%(+59.7)#1 | 0.44%(+60.7)#26 |
| 27. | Crescent Valley | 59.4% | 0.96%(+58.4)#4 | 0.44%(+58.9)#27 |
| 28. | Realitos | 59.0% | 1.9%(+57.1)#5 | 0.44%(+58.5)#28 |
| 29. | Fox | 56.0% | 2.5%(+53.5)#1 | 0.44%(+55.6)#29 |
| 30. | Morenci | 55.3% | 0.46%(+54.8)#2 | 0.44%(+54.9)#30 |
| 31. | Osino | 54.5% | 0.96%(+53.6)#5 | 0.44%(+54.1)#31 |
| 32. | Bolt | 53.7% | 2.6%(+51.1)#3 | 0.44%(+53.2)#32 |
| 33. | Flaxton | 52.9% | 3.0%(+50.0)#2 | 0.44%(+52.5)#33 |
| 34. | Paisano Park | 52.6% | 1.9%(+50.8)#6 | 0.44%(+52.2)#34 |
| 35. | Golconda | 52.0% | 0.96%(+51.0)#6 | 0.44%(+51.6)#35 |
| 36. | Mccarr | 51.9% | 0.53%(+51.4)#1 | 0.44%(+51.5)#36 |
| 37. | Rossmore | 51.7% | 2.6%(+49.1)#4 | 0.44%(+51.3)#37 |
| 38. | York | 51.6% | 0.46%(+51.1)#3 | 0.44%(+51.1)#38 |
| 39. | La Clede | 51.5% | 0.16%(+51.4)#1 | 0.44%(+51.1)#39 |
| 40. | Frytown | 51.4% | 0.17%(+51.3)#1 | 0.44%(+51.0)#40 |
| 41. | La Minita | 50.5% | 1.9%(+48.6)#7 | 0.44%(+50.0)#41 |
| 42. | Woodruff | 50.0% | 0.53%(+49.5)#1 | 0.44%(+49.6)#42 |
| 43. | Hill View Heights | 48.7% | 6.4%(+42.4)#2 | 0.44%(+48.3)#43 |
| 44. | Kylertown | 48.7% | 0.36%(+48.4)#1 | 0.44%(+48.3)#44 |
| 45. | Loco Hills | 48.6% | 2.1%(+46.5)#2 | 0.44%(+48.2)#45 |
| 46. | Woodston | 48.5% | 0.53%(+48.0)#2 | 0.44%(+48.0)#46 |
| 47. | Waka | 47.2% | 1.9%(+45.4)#8 | 0.44%(+46.8)#47 |
| 48. | Cordova | 46.8% | 2.1%(+44.7)#3 | 0.44%(+46.4)#48 |
| 49. | Humboldt River Ranch | 46.2% | 0.96%(+45.2)#7 | 0.44%(+45.7)#49 |
| 50. | Reliance | 45.0% | 6.4%(+38.6)#3 | 0.44%(+44.6)#50 |
| 51. | Rosedale | 44.4% | 2.1%(+42.3)#4 | 0.44%(+44.0)#51 |
| 52. | Mulkeytown | 44.4% | 0.16%(+44.3)#2 | 0.44%(+44.0)#52 |
| 53. | Virgil | 44.4% | 0.53%(+43.9)#3 | 0.44%(+44.0)#53 |
| 54. | Rancho Viejo | 43.6% | 1.9%(+41.8)#9 | 0.44%(+43.2)#54 |
| 55. | Munjor | 43.4% | 0.53%(+42.9)#4 | 0.44%(+43.0)#55 |
| 56. | Midwest | 43.1% | 6.4%(+36.8)#4 | 0.44%(+42.7)#56 |
| 57. | Lester | 42.9% | 2.6%(+40.3)#5 | 0.44%(+42.4)#57 |
| 58. | Hallett | 42.9% | 2.5%(+40.3)#2 | 0.44%(+42.4)#58 |
| 59. | Braddock | 42.9% | 3.0%(+39.9)#3 | 0.44%(+42.4)#59 |
| 60. | Thorntonville | 42.1% | 1.9%(+40.2)#10 | 0.44%(+41.6)#60 |
| 61. | Colcord | 41.9% | 2.6%(+39.4)#6 | 0.44%(+41.5)#61 |
| 62. | Hoehne | 41.7% | 0.87%(+40.8)#1 | 0.44%(+41.2)#62 |
| 63. | Rosedale | 41.7% | 2.5%(+39.2)#3 | 0.44%(+41.2)#63 |
| 64. | Carter | 41.5% | 2.5%(+39.0)#4 | 0.44%(+41.0)#64 |
| 65. | Galloway | 41.2% | 2.6%(+38.6)#7 | 0.44%(+40.7)#65 |
| 66. | La Barge | 40.5% | 6.4%(+34.2)#5 | 0.44%(+40.1)#66 |
| 67. | Centrahoma | 40.0% | 2.5%(+37.5)#5 | 0.44%(+39.6)#67 |
| 68. | San Juan | 39.1% | 1.9%(+37.3)#11 | 0.44%(+38.7)#68 |
| 69. | Silver Peak | 39.1% | 0.96%(+38.1)#8 | 0.44%(+38.6)#69 |
| 70. | Hayden | 38.8% | 0.46%(+38.4)#4 | 0.44%(+38.4)#70 |
| 71. | New Ulm | 38.8% | 1.9%(+36.9)#12 | 0.44%(+38.3)#71 |
| 72. | Holladay | 38.7% | 0.14%(+38.6)#1 | 0.44%(+38.3)#72 |
| 73. | Chevak | 38.7% | 3.1%(+35.6)#6 | 0.44%(+38.2)#73 |
| 74. | Bairoil | 38.6% | 6.4%(+32.3)#6 | 0.44%(+38.2)#74 |
| 75. | South Heart | 38.5% | 3.0%(+35.5)#4 | 0.44%(+38.0)#75 |
| 76. | Ocosta | 38.1% | 0.087%(+38.0)#2 | 0.44%(+37.7)#76 |
| 77. | Brazos | 38.1% | 1.9%(+36.2)#13 | 0.44%(+37.7)#77 |
| 78. | Bryce | 38.0% | 0.46%(+37.5)#5 | 0.44%(+37.6)#78 |
| 79. | Rogersville | 37.6% | 0.36%(+37.2)#2 | 0.44%(+37.1)#79 |
| 80. | Big Lake | 37.3% | 1.9%(+35.5)#14 | 0.44%(+36.9)#80 |
| 81. | Nadine | 36.2% | 2.1%(+34.1)#5 | 0.44%(+35.8)#81 |
| 82. | Fort Jesup | 35.9% | 2.4%(+33.6)#2 | 0.44%(+35.5)#82 |
| 83. | San Jose | 35.7% | 0.46%(+35.3)#6 | 0.44%(+35.3)#83 |
| 84. | Las Palomas | 35.4% | 2.1%(+33.3)#6 | 0.44%(+35.0)#84 |
| 85. | Battle Mountain | 35.1% | 0.96%(+34.1)#9 | 0.44%(+34.7)#85 |
| 86. | Elmer | 35.0% | 2.5%(+32.5)#6 | 0.44%(+34.6)#86 |
| 87. | Revillo | 34.9% | 0.43%(+34.5)#1 | 0.44%(+34.5)#87 |
| 88. | Portal | 34.8% | 3.0%(+31.9)#5 | 0.44%(+34.4)#88 |
| 89. | Sleepy Hollow | 34.4% | 6.4%(+28.0)#7 | 0.44%(+33.9)#89 |
| 90. | Lebanon | 34.3% | 2.5%(+31.8)#7 | 0.44%(+33.9)#90 |
| 91. | Baker | 34.3% | 1.4%(+32.9)#2 | 0.44%(+33.9)#91 |
| 92. | Prudhoe Bay | 34.0% | 3.1%(+31.0)#7 | 0.44%(+33.6)#92 |
| 93. | Wright | 33.7% | 6.4%(+27.4)#8 | 0.44%(+33.3)#93 |
| 94. | Auburn | 33.7% | 6.4%(+27.4)#9 | 0.44%(+33.3)#94 |
| 95. | Mertzon | 33.3% | 1.9%(+31.5)#15 | 0.44%(+32.9)#95 |
| 96. | Buckhorn | 33.3% | 0.53%(+32.8)#2 | 0.44%(+32.9)#96 |
| 97. | Fortuna | 33.3% | 3.0%(+30.4)#6 | 0.44%(+32.9)#97 |
| 98. | Bunch | 33.3% | 2.5%(+30.8)#8 | 0.44%(+32.9)#98 |
| 99. | Lindsay | 33.3% | 1.4%(+32.0)#3 | 0.44%(+32.9)#99 |
| 100. | Fellows | 32.0% | 0.12%(+31.9)#1 | 0.44%(+31.6)#100 |
Common Questions
What are the Top 10 Cities with the Highest Percentage of Population Employed in Mining, Quarrying, & Extraction in the United States?
Top 10 Cities with the Highest Percentage of Population Employed in Mining, Quarrying, & Extraction in the United States are:
What city has the Highest Percentage of Population Employed in Mining, Quarrying, & Extraction in the United States?
St Clement has the Highest Percentage of Population Employed in Mining, Quarrying, & Extraction in the United States with 100.0%.
What is the Percentage of Population Employed in Mining, Quarrying, & Extraction in the United States?
Percentage of Population Employed in Mining, Quarrying, & Extraction in the United States is 0.44%.