Cities with the Highest Percentage of Immigrants from Russia in the United States
RELATED REPORTS & OPTIONS
Russia
United States
Compare Cities
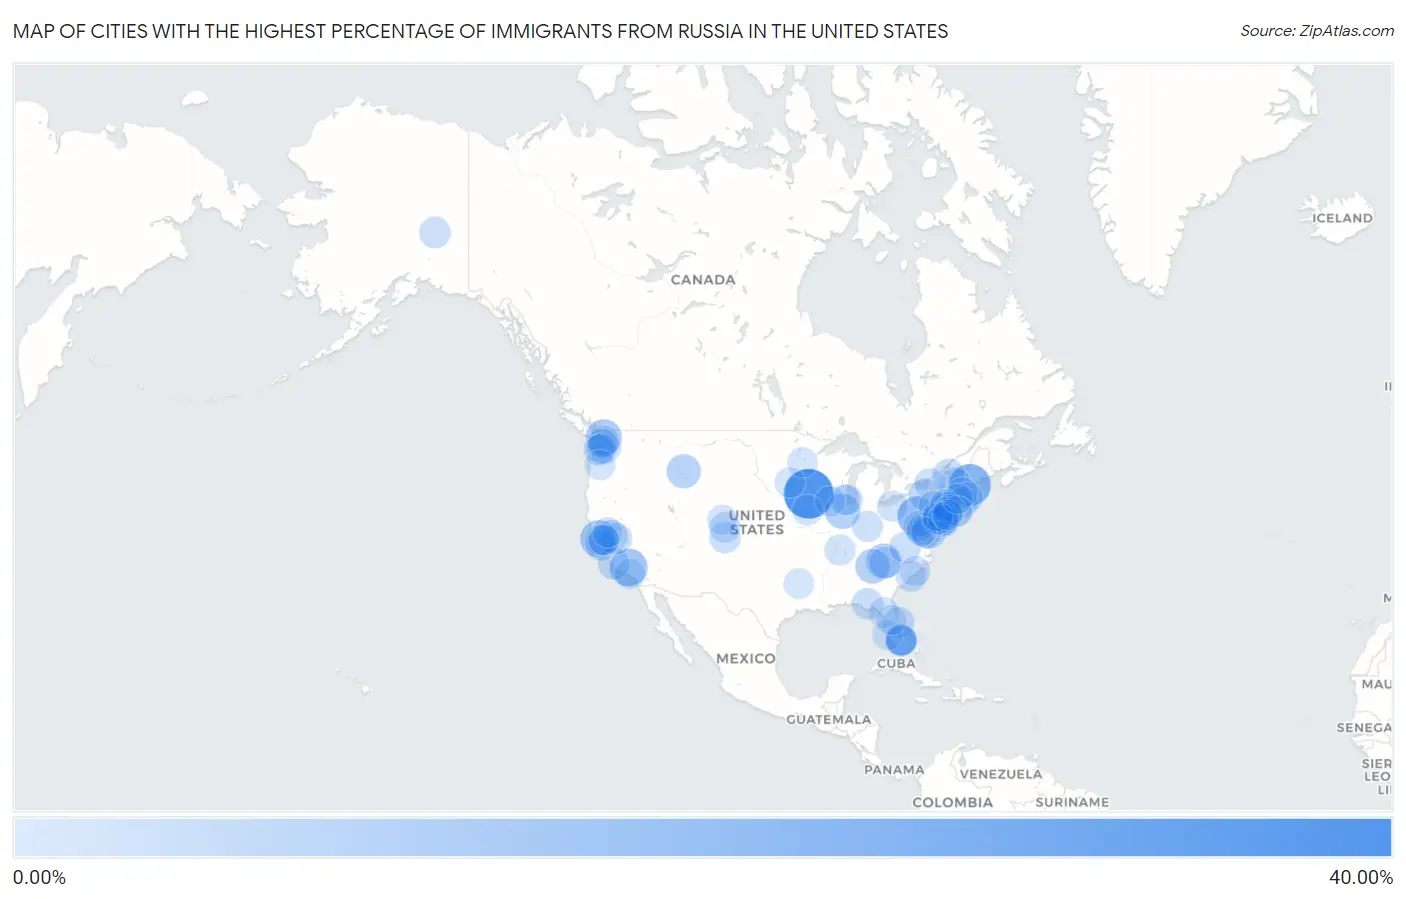
Map of Cities with the Highest Percentage of Immigrants from Russia in the United States
0.00%
40.00%
Cities with the Highest Percentage of Immigrants from Russia in the United States
| City | Russia | vs State | vs National | |
| 1. | Chapin | 34.31% | 0.045%(+34.3)#1 | 0.12%(+34.2)#1 |
| 2. | Little Falls | 21.10% | 0.062%(+21.0)#1 | 0.12%(+21.0)#2 |
| 3. | Atkinson Mills | 18.25% | 0.12%(+18.1)#1 | 0.12%(+18.1)#3 |
| 4. | Lake Hughes | 14.19% | 0.18%(+14.0)#1 | 0.12%(+14.1)#4 |
| 5. | Griggstown | 13.61% | 0.22%(+13.4)#1 | 0.12%(+13.5)#5 |
| 6. | San Geronimo | 12.88% | 0.18%(+12.7)#2 | 0.12%(+12.8)#6 |
| 7. | Linville | 12.36% | 0.077%(+12.3)#1 | 0.12%(+12.2)#7 |
| 8. | Lake Cavanaugh | 11.73% | 0.28%(+11.5)#1 | 0.12%(+11.6)#8 |
| 9. | Avery Creek | 10.13% | 0.077%(+10.0)#2 | 0.12%(+10.0)#9 |
| 10. | Emington | 10.00% | 0.13%(+9.87)#1 | 0.12%(+9.88)#10 |
| 11. | St Michaels | 9.59% | 0.15%(+9.43)#1 | 0.12%(+9.46)#11 |
| 12. | Mineral Bluff | 8.92% | 0.055%(+8.86)#1 | 0.12%(+8.80)#12 |
| 13. | Mont Clare | 8.89% | 0.12%(+8.77)#2 | 0.12%(+8.77)#13 |
| 14. | Corwin Springs | 8.39% | 0.039%(+8.35)#1 | 0.12%(+8.26)#14 |
| 15. | Cedar Glen West | 6.53% | 0.22%(+6.31)#2 | 0.12%(+6.41)#15 |
| 16. | Buena Vista | 5.61% | 0.18%(+5.43)#3 | 0.12%(+5.49)#16 |
| 17. | Ovid | 5.60% | 0.38%(+5.22)#1 | 0.12%(+5.48)#17 |
| 18. | Kaloko | 5.57% | 0.051%(+5.52)#1 | 0.12%(+5.44)#18 |
| 19. | South Royalton | 5.26% | 0.085%(+5.18)#1 | 0.12%(+5.14)#19 |
| 20. | Parc | 5.26% | 0.38%(+4.88)#2 | 0.12%(+5.14)#20 |
| 21. | Sunny Isles Beach | 5.25% | 0.14%(+5.10)#1 | 0.12%(+5.12)#21 |
| 22. | Edna | 4.79% | 0.18%(+4.61)#4 | 0.12%(+4.67)#22 |
| 23. | Ridgefield | 4.74% | 0.13%(+4.61)#2 | 0.12%(+4.61)#23 |
| 24. | Titusville | 4.73% | 0.38%(+4.35)#3 | 0.12%(+4.61)#24 |
| 25. | Kauneonga Lake | 4.64% | 0.38%(+4.26)#4 | 0.12%(+4.52)#25 |
| 26. | Balfour | 4.55% | 0.077%(+4.48)#3 | 0.12%(+4.43)#26 |
| 27. | Wilderness Rim | 4.22% | 0.28%(+3.94)#2 | 0.12%(+4.10)#27 |
| 28. | Indian Field | 4.21% | 0.18%(+4.03)#1 | 0.12%(+4.09)#28 |
| 29. | Lake Mystic | 4.16% | 0.14%(+4.02)#2 | 0.12%(+4.04)#29 |
| 30. | Plainsboro Center | 4.16% | 0.22%(+3.94)#3 | 0.12%(+4.03)#30 |
| 31. | La Honda | 4.15% | 0.18%(+3.97)#5 | 0.12%(+4.03)#31 |
| 32. | Harmonyville | 4.13% | 0.085%(+4.04)#2 | 0.12%(+4.01)#32 |
| 33. | Delta Junction | 4.09% | 0.12%(+3.97)#1 | 0.12%(+3.96)#33 |
| 34. | Holiday Heights | 4.00% | 0.22%(+3.78)#4 | 0.12%(+3.88)#34 |
| 35. | Twain Harte | 3.95% | 0.18%(+3.76)#6 | 0.12%(+3.82)#35 |
| 36. | Cavalero | 3.91% | 0.28%(+3.63)#3 | 0.12%(+3.79)#36 |
| 37. | Derwood | 3.89% | 0.15%(+3.74)#2 | 0.12%(+3.77)#37 |
| 38. | Penhook | 3.88% | 0.11%(+3.78)#1 | 0.12%(+3.76)#38 |
| 39. | Beulah Valley | 3.73% | 0.14%(+3.60)#1 | 0.12%(+3.61)#39 |
| 40. | Churchville | 3.69% | 0.12%(+3.57)#3 | 0.12%(+3.57)#40 |
| 41. | Governors | 3.62% | 0.077%(+3.55)#4 | 0.12%(+3.50)#41 |
| 42. | Bal Harbour | 3.59% | 0.14%(+3.45)#3 | 0.12%(+3.47)#42 |
| 43. | Indialantic | 3.48% | 0.14%(+3.34)#4 | 0.12%(+3.36)#43 |
| 44. | Harmony | 3.40% | 0.11%(+3.29)#1 | 0.12%(+3.28)#44 |
| 45. | Henderson | 3.36% | 0.38%(+2.98)#5 | 0.12%(+3.24)#45 |
| 46. | Contra Costa Centre | 3.36% | 0.18%(+3.17)#7 | 0.12%(+3.23)#46 |
| 47. | Mount Carmel | 3.23% | 0.049%(+3.18)#1 | 0.12%(+3.10)#47 |
| 48. | Perry Park | 3.21% | 0.14%(+3.08)#2 | 0.12%(+3.09)#48 |
| 49. | Briarcliffe Acres | 3.17% | 0.068%(+3.10)#1 | 0.12%(+3.05)#49 |
| 50. | Highland Falls | 3.15% | 0.38%(+2.77)#6 | 0.12%(+3.02)#50 |
| 51. | Swampscott | 3.13% | 0.26%(+2.87)#1 | 0.12%(+3.00)#51 |
| 52. | Water Mill | 3.08% | 0.38%(+2.70)#7 | 0.12%(+2.95)#52 |
| 53. | Fancy Farm | 3.00% | 0.036%(+2.96)#1 | 0.12%(+2.88)#53 |
| 54. | Fair Lawn Borough | 2.96% | 0.22%(+2.74)#5 | 0.12%(+2.84)#54 |
| 55. | Muir Beach | 2.95% | 0.18%(+2.77)#8 | 0.12%(+2.83)#55 |
| 56. | Fisher Island | 2.94% | 0.14%(+2.79)#5 | 0.12%(+2.81)#56 |
| 57. | Village Shires | 2.94% | 0.12%(+2.82)#4 | 0.12%(+2.81)#57 |
| 58. | Hallandale Beach | 2.90% | 0.14%(+2.76)#6 | 0.12%(+2.78)#58 |
| 59. | Williamson | 2.88% | 0.045%(+2.83)#2 | 0.12%(+2.75)#59 |
| 60. | Mayfield | 2.84% | 0.072%(+2.77)#1 | 0.12%(+2.72)#60 |
| 61. | Oregon Shores | 2.84% | 0.12%(+2.71)#1 | 0.12%(+2.71)#61 |
| 62. | Burkittsville | 2.80% | 0.15%(+2.64)#3 | 0.12%(+2.67)#62 |
| 63. | Northfield | 2.79% | 0.13%(+2.66)#3 | 0.12%(+2.66)#63 |
| 64. | Anderson Island | 2.78% | 0.28%(+2.50)#4 | 0.12%(+2.65)#64 |
| 65. | Brewster Hill | 2.76% | 0.38%(+2.39)#8 | 0.12%(+2.64)#65 |
| 66. | Auburn | 2.73% | 0.22%(+2.51)#6 | 0.12%(+2.60)#66 |
| 67. | Feasterville | 2.63% | 0.12%(+2.52)#5 | 0.12%(+2.51)#67 |
| 68. | Sandy Creek | 2.63% | 0.077%(+2.55)#5 | 0.12%(+2.51)#68 |
| 69. | Chinchilla | 2.61% | 0.12%(+2.49)#6 | 0.12%(+2.48)#69 |
| 70. | Forest Lake | 2.60% | 0.13%(+2.48)#4 | 0.12%(+2.48)#70 |
| 71. | Dunkirk | 2.59% | 0.15%(+2.44)#4 | 0.12%(+2.47)#71 |
| 72. | Maltby | 2.59% | 0.28%(+2.31)#5 | 0.12%(+2.47)#72 |
| 73. | Pinardville | 2.58% | 0.098%(+2.48)#1 | 0.12%(+2.45)#73 |
| 74. | Castle Hill | 2.57% | 0.18%(+2.39)#9 | 0.12%(+2.45)#74 |
| 75. | Clintondale | 2.55% | 0.38%(+2.17)#9 | 0.12%(+2.42)#75 |
| 76. | West Hollywood | 2.52% | 0.18%(+2.34)#10 | 0.12%(+2.40)#76 |
| 77. | Bard College | 2.52% | 0.38%(+2.14)#10 | 0.12%(+2.39)#77 |
| 78. | East Bronson | 2.49% | 0.14%(+2.35)#7 | 0.12%(+2.37)#78 |
| 79. | Fife Heights | 2.48% | 0.28%(+2.20)#6 | 0.12%(+2.36)#79 |
| 80. | Andover | 2.48% | 0.045%(+2.43)#3 | 0.12%(+2.36)#80 |
| 81. | Pine Harbor | 2.48% | 0.058%(+2.42)#1 | 0.12%(+2.35)#81 |
| 82. | Noyack | 2.44% | 0.38%(+2.06)#11 | 0.12%(+2.32)#82 |
| 83. | Greenvale | 2.41% | 0.38%(+2.03)#12 | 0.12%(+2.28)#83 |
| 84. | Niagara University | 2.38% | 0.38%(+2.00)#13 | 0.12%(+2.26)#84 |
| 85. | Buckman | 2.38% | 0.11%(+2.27)#1 | 0.12%(+2.26)#85 |
| 86. | Southport | 2.38% | 0.18%(+2.20)#2 | 0.12%(+2.25)#86 |
| 87. | Pineland | 2.37% | 0.14%(+2.23)#8 | 0.12%(+2.25)#87 |
| 88. | Lazy Acres | 2.37% | 0.14%(+2.23)#3 | 0.12%(+2.24)#88 |
| 89. | Saddle River Borough | 2.35% | 0.22%(+2.13)#7 | 0.12%(+2.23)#89 |
| 90. | Orchards | 2.34% | 0.28%(+2.06)#7 | 0.12%(+2.22)#90 |
| 91. | Morganville | 2.33% | 0.22%(+2.11)#8 | 0.12%(+2.21)#91 |
| 92. | Leisure Knoll | 2.33% | 0.22%(+2.11)#9 | 0.12%(+2.20)#92 |
| 93. | Hadley | 2.33% | 0.11%(+2.21)#2 | 0.12%(+2.20)#93 |
| 94. | Plumsteadville | 2.31% | 0.12%(+2.19)#7 | 0.12%(+2.18)#94 |
| 95. | Hewlett Bay Park | 2.27% | 0.38%(+1.89)#14 | 0.12%(+2.14)#95 |
| 96. | Gotha | 2.26% | 0.14%(+2.11)#9 | 0.12%(+2.13)#96 |
| 97. | Ware | 2.25% | 0.26%(+1.99)#2 | 0.12%(+2.13)#97 |
| 98. | Clifton | 2.23% | 0.11%(+2.13)#2 | 0.12%(+2.11)#98 |
| 99. | Elverta | 2.23% | 0.18%(+2.05)#11 | 0.12%(+2.11)#99 |
| 100. | Whitfield Cdp Manatee County | 2.22% | 0.14%(+2.08)#10 | 0.12%(+2.10)#100 |
Common Questions
What are the Top 10 Cities with the Highest Percentage of Immigrants from Russia in the United States?
Top 10 Cities with the Highest Percentage of Immigrants from Russia in the United States are:
#1
34.31%
#2
21.10%
#3
18.25%
#4
14.19%
#5
13.61%
#6
12.88%
#7
11.73%
#8
10.13%
#9
10.00%
#10
9.59%
What city has the Highest Percentage of Immigrants from Russia in the United States?
Chapin has the Highest Percentage of Immigrants from Russia in the United States with 34.31%.
What is the Percentage of Immigrants from Russia in the United States?
Percentage of Immigrants from Russia in the United States is 0.12%.