Cities with the Most Immigrants from Eastern Europe in the United States
RELATED REPORTS & OPTIONS
Eastern Europe
United States
Compare Cities
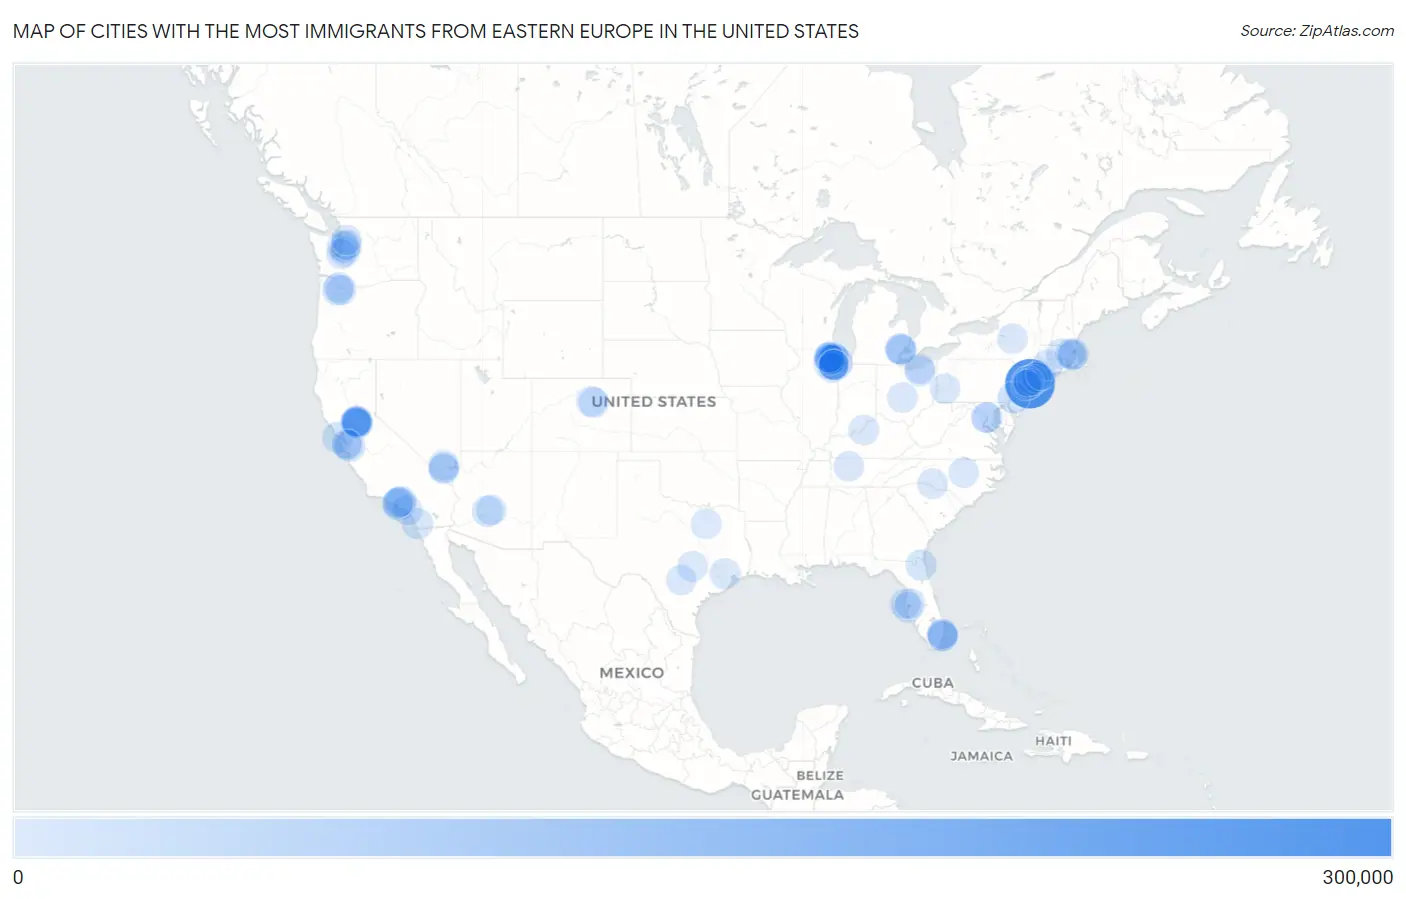
Map of Cities with the Most Immigrants from Eastern Europe in the United States
0
300,000
Cities with the Most Immigrants from Eastern Europe in the United States
| City | Eastern Europe | vs State | vs National | |
| 1. | New York | 268,458 | 372,407(72.09%)#1 | 2,208,794(12.15%)#1 |
| 2. | Chicago | 67,169 | 271,973(24.70%)#1 | 2,208,794(3.04%)#2 |
| 3. | Los Angeles | 45,575 | 268,790(16.96%)#1 | 2,208,794(2.06%)#3 |
| 4. | Philadelphia | 22,777 | 84,280(27.03%)#1 | 2,208,794(1.03%)#4 |
| 5. | San Francisco | 13,995 | 268,790(5.21%)#2 | 2,208,794(0.63%)#5 |
| 6. | Phoenix | 12,635 | 33,676(37.52%)#1 | 2,208,794(0.57%)#6 |
| 7. | San Diego | 12,340 | 268,790(4.59%)#3 | 2,208,794(0.56%)#7 |
| 8. | Jacksonville | 11,666 | 167,150(6.98%)#1 | 2,208,794(0.53%)#8 |
| 9. | San Jose | 9,827 | 268,790(3.66%)#4 | 2,208,794(0.44%)#9 |
| 10. | Houston | 8,601 | 65,032(13.23%)#1 | 2,208,794(0.39%)#10 |
| 11. | Portland | 8,090 | 27,566(29.35%)#1 | 2,208,794(0.37%)#11 |
| 12. | Seattle | 7,833 | 95,891(8.17%)#1 | 2,208,794(0.35%)#12 |
| 13. | Boston | 7,791 | 78,957(9.87%)#1 | 2,208,794(0.35%)#13 |
| 14. | Sterling Heights | 6,291 | 69,997(8.99%)#1 | 2,208,794(0.28%)#14 |
| 15. | Arlington Heights | 6,094 | 271,973(2.24%)#2 | 2,208,794(0.28%)#15 |
| 16. | Garfield | 5,902 | 145,122(4.07%)#1 | 2,208,794(0.27%)#16 |
| 17. | Des Plaines | 5,899 | 271,973(2.17%)#3 | 2,208,794(0.27%)#17 |
| 18. | Mount Prospect | 5,756 | 271,973(2.12%)#4 | 2,208,794(0.26%)#18 |
| 19. | Charlotte | 5,421 | 34,793(15.58%)#1 | 2,208,794(0.25%)#19 |
| 20. | New Britain | 5,392 | 55,372(9.74%)#1 | 2,208,794(0.24%)#20 |
| 21. | Vancouver | 5,379 | 95,891(5.61%)#2 | 2,208,794(0.24%)#21 |
| 22. | Buffalo Grove | 5,355 | 271,973(1.97%)#5 | 2,208,794(0.24%)#22 |
| 23. | Worcester | 5,305 | 78,957(6.72%)#2 | 2,208,794(0.24%)#23 |
| 24. | Wheeling | 5,293 | 271,973(1.95%)#6 | 2,208,794(0.24%)#24 |
| 25. | Antelope | 5,153 | 268,790(1.92%)#5 | 2,208,794(0.23%)#25 |
| 26. | Sacramento | 5,137 | 268,790(1.91%)#6 | 2,208,794(0.23%)#26 |
| 27. | Schaumburg | 4,973 | 271,973(1.83%)#7 | 2,208,794(0.23%)#27 |
| 28. | Denver | 4,924 | 30,080(16.37%)#1 | 2,208,794(0.22%)#28 |
| 29. | North Highlands | 4,816 | 268,790(1.79%)#7 | 2,208,794(0.22%)#29 |
| 30. | Austin | 4,813 | 65,032(7.40%)#2 | 2,208,794(0.22%)#30 |
| 31. | Clifton | 4,708 | 145,122(3.24%)#2 | 2,208,794(0.21%)#31 |
| 32. | Washington | 4,468 | 4,468(100.00%)#1 | 2,208,794(0.20%)#32 |
| 33. | Bellevue | 4,461 | 95,891(4.65%)#3 | 2,208,794(0.20%)#33 |
| 34. | Hallandale Beach | 4,424 | 167,150(2.65%)#2 | 2,208,794(0.20%)#34 |
| 35. | Citrus Heights | 4,296 | 268,790(1.60%)#8 | 2,208,794(0.19%)#35 |
| 36. | Las Vegas | 4,173 | 19,071(21.88%)#1 | 2,208,794(0.19%)#36 |
| 37. | Columbus | 4,167 | 52,367(7.96%)#1 | 2,208,794(0.19%)#37 |
| 38. | Irvine | 4,157 | 268,790(1.55%)#9 | 2,208,794(0.19%)#38 |
| 39. | Utica | 4,152 | 372,407(1.11%)#2 | 2,208,794(0.19%)#39 |
| 40. | Niles | 4,145 | 271,973(1.52%)#8 | 2,208,794(0.19%)#40 |
| 41. | Yonkers | 4,138 | 372,407(1.11%)#3 | 2,208,794(0.19%)#41 |
| 42. | Fair Lawn Borough | 4,101 | 145,122(2.83%)#3 | 2,208,794(0.19%)#42 |
| 43. | Palatine | 3,939 | 271,973(1.45%)#9 | 2,208,794(0.18%)#43 |
| 44. | Wallington Borough | 3,881 | 145,122(2.67%)#4 | 2,208,794(0.18%)#44 |
| 45. | Naperville | 3,868 | 271,973(1.42%)#10 | 2,208,794(0.18%)#45 |
| 46. | Stamford | 3,840 | 55,372(6.93%)#2 | 2,208,794(0.17%)#46 |
| 47. | Kent | 3,732 | 95,891(3.89%)#4 | 2,208,794(0.17%)#47 |
| 48. | Spring Valley | 3,700 | 19,071(19.40%)#2 | 2,208,794(0.17%)#48 |
| 49. | Parma | 3,687 | 52,367(7.04%)#2 | 2,208,794(0.17%)#49 |
| 50. | Hollywood | 3,637 | 167,150(2.18%)#3 | 2,208,794(0.16%)#50 |
| 51. | Jersey City | 3,591 | 145,122(2.47%)#5 | 2,208,794(0.16%)#51 |
| 52. | Aurora | 3,573 | 30,080(11.88%)#2 | 2,208,794(0.16%)#52 |
| 53. | Rancho Cordova | 3,568 | 268,790(1.33%)#10 | 2,208,794(0.16%)#53 |
| 54. | Dallas | 3,546 | 65,032(5.45%)#3 | 2,208,794(0.16%)#54 |
| 55. | Skokie | 3,451 | 271,973(1.27%)#11 | 2,208,794(0.16%)#55 |
| 56. | Newton | 3,450 | 78,957(4.37%)#3 | 2,208,794(0.16%)#56 |
| 57. | Carmichael | 3,368 | 268,790(1.25%)#11 | 2,208,794(0.15%)#57 |
| 58. | Glendale | 3,214 | 268,790(1.20%)#12 | 2,208,794(0.15%)#58 |
| 59. | Louisville | 3,196 | 10,366(30.83%)#1 | 2,208,794(0.14%)#59 |
| 60. | Norridge | 3,195 | 271,973(1.17%)#12 | 2,208,794(0.14%)#60 |
| 61. | Enterprise | 3,152 | 19,071(16.53%)#3 | 2,208,794(0.14%)#61 |
| 62. | St Petersburg | 3,104 | 167,150(1.86%)#4 | 2,208,794(0.14%)#62 |
| 63. | Foothill Farms | 3,084 | 268,790(1.15%)#13 | 2,208,794(0.14%)#63 |
| 64. | Elmwood Park | 3,007 | 271,973(1.11%)#13 | 2,208,794(0.14%)#64 |
| 65. | Arlington | 2,969 | 36,166(8.21%)#1 | 2,208,794(0.13%)#65 |
| 66. | Sunny Isles Beach | 2,957 | 167,150(1.77%)#5 | 2,208,794(0.13%)#66 |
| 67. | Palos Hills | 2,957 | 271,973(1.09%)#14 | 2,208,794(0.13%)#67 |
| 68. | Glenview | 2,914 | 271,973(1.07%)#15 | 2,208,794(0.13%)#68 |
| 69. | Schiller Park | 2,901 | 271,973(1.07%)#16 | 2,208,794(0.13%)#69 |
| 70. | Tacoma | 2,787 | 95,891(2.91%)#5 | 2,208,794(0.13%)#70 |
| 71. | Clearwater | 2,745 | 167,150(1.64%)#6 | 2,208,794(0.12%)#71 |
| 72. | Mountain View | 2,697 | 268,790(1.00%)#14 | 2,208,794(0.12%)#72 |
| 73. | Park Ridge | 2,682 | 271,973(0.99%)#17 | 2,208,794(0.12%)#73 |
| 74. | Burbank | 2,669 | 271,973(0.98%)#18 | 2,208,794(0.12%)#74 |
| 75. | Elk Grove Village | 2,666 | 271,973(0.98%)#19 | 2,208,794(0.12%)#75 |
| 76. | Fort Lauderdale | 2,658 | 167,150(1.59%)#7 | 2,208,794(0.12%)#76 |
| 77. | Redmond | 2,650 | 95,891(2.76%)#6 | 2,208,794(0.12%)#77 |
| 78. | Orland Park | 2,648 | 271,973(0.97%)#20 | 2,208,794(0.12%)#78 |
| 79. | Linden | 2,549 | 145,122(1.76%)#6 | 2,208,794(0.12%)#79 |
| 80. | Raleigh | 2,535 | 34,793(7.29%)#2 | 2,208,794(0.11%)#80 |
| 81. | Everett | 2,525 | 95,891(2.63%)#7 | 2,208,794(0.11%)#81 |
| 82. | Pittsburgh | 2,503 | 84,280(2.97%)#2 | 2,208,794(0.11%)#82 |
| 83. | Tampa | 2,502 | 167,150(1.50%)#8 | 2,208,794(0.11%)#83 |
| 84. | Roselle | 2,480 | 271,973(0.91%)#21 | 2,208,794(0.11%)#84 |
| 85. | San Antonio | 2,449 | 65,032(3.77%)#4 | 2,208,794(0.11%)#85 |
| 86. | Nashville | 2,438 | 14,323(17.02%)#1 | 2,208,794(0.11%)#86 |
| 87. | Troy | 2,437 | 69,997(3.48%)#2 | 2,208,794(0.11%)#87 |
| 88. | Cleveland | 2,410 | 52,367(4.60%)#3 | 2,208,794(0.11%)#88 |
| 89. | Bridgeport | 2,405 | 55,372(4.34%)#3 | 2,208,794(0.11%)#89 |
| 90. | Arden Arcade | 2,405 | 268,790(0.89%)#15 | 2,208,794(0.11%)#90 |
| 91. | Warren | 2,400 | 69,997(3.43%)#3 | 2,208,794(0.11%)#91 |
| 92. | Santa Monica | 2,388 | 268,790(0.89%)#16 | 2,208,794(0.11%)#92 |
| 93. | Gresham | 2,353 | 27,566(8.54%)#2 | 2,208,794(0.11%)#93 |
| 94. | Hickory Hills | 2,339 | 271,973(0.86%)#22 | 2,208,794(0.11%)#94 |
| 95. | Scottsdale | 2,328 | 33,676(6.91%)#2 | 2,208,794(0.11%)#95 |
| 96. | Hoffman Estates | 2,318 | 271,973(0.85%)#23 | 2,208,794(0.10%)#96 |
| 97. | Quincy | 2,309 | 78,957(2.92%)#4 | 2,208,794(0.10%)#97 |
| 98. | Sunnyvale | 2,302 | 268,790(0.86%)#17 | 2,208,794(0.10%)#98 |
| 99. | West Hollywood | 2,298 | 268,790(0.85%)#18 | 2,208,794(0.10%)#99 |
| 100. | Oak Lawn | 2,288 | 271,973(0.84%)#24 | 2,208,794(0.10%)#100 |
Common Questions
What are the Top 10 Cities with the Most Immigrants from Eastern Europe in the United States?
Top 10 Cities with the Most Immigrants from Eastern Europe in the United States are:
#1
268,458
#2
67,169
#3
45,575
#4
22,777
#5
13,995
#6
12,635
#7
12,340
#8
11,666
#9
9,827
#10
8,601
What city has the Most Immigrants from Eastern Europe in the United States?
New York has the Most Immigrants from Eastern Europe in the United States with 268,458.
What is the Total Immigrants from Eastern Europe in the United States?
Total Immigrants from Eastern Europe in the United States is 2,208,794.