Cities with the Highest Percentage of Fijian Population in the United States
RELATED REPORTS & OPTIONS
Fijian
United States
Compare Cities
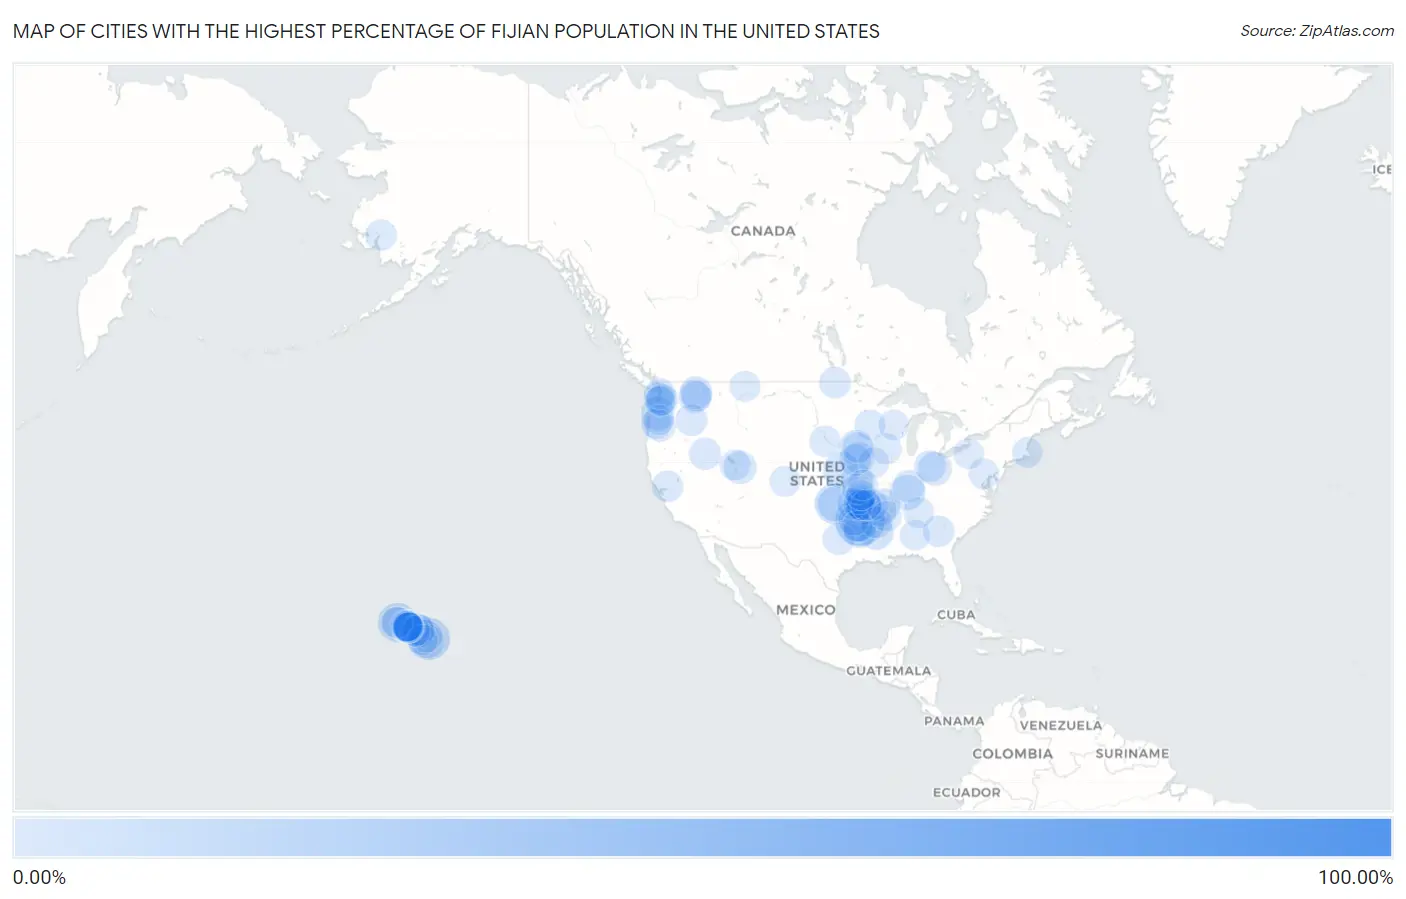
Map of Cities with the Highest Percentage of Fijian Population in the United States
0.00%
100.00%
Cities with the Highest Percentage of Fijian Population in the United States
| City | Fijian | vs State | vs National | |
| 1. | Evansville | 87.84% | 0.29%(+87.5)#1 | 0.012%(+87.8)#1 |
| 2. | Vandervoort | 19.70% | 0.29%(+19.4)#2 | 0.012%(+19.7)#2 |
| 3. | Pepeekeo | 12.52% | 0.64%(+11.9)#1 | 0.012%(+12.5)#3 |
| 4. | North Enid | 10.46% | 0.083%(+10.4)#1 | 0.012%(+10.4)#4 |
| 5. | Hanamaulu | 9.40% | 0.64%(+8.76)#2 | 0.012%(+9.39)#5 |
| 6. | Springdale | 6.55% | 0.29%(+6.26)#3 | 0.012%(+6.54)#6 |
| 7. | Jansen | 5.94% | 0.00082%(+5.94)#1 | 0.012%(+5.93)#7 |
| 8. | Corydon | 5.43% | 0.0023%(+5.42)#1 | 0.012%(+5.41)#8 |
| 9. | Broken Bow | 5.23% | 0.083%(+5.15)#2 | 0.012%(+5.22)#9 |
| 10. | Fonda | 4.81% | 0.036%(+4.77)#1 | 0.012%(+4.80)#10 |
| 11. | Enid | 4.65% | 0.083%(+4.57)#3 | 0.012%(+4.64)#11 |
| 12. | West Crossett | 4.60% | 0.29%(+4.31)#4 | 0.012%(+4.59)#12 |
| 13. | Kailua Cdp Hawaii County | 4.27% | 0.64%(+3.63)#3 | 0.012%(+4.25)#13 |
| 14. | Lowell | 4.09% | 0.29%(+3.79)#5 | 0.012%(+4.08)#14 |
| 15. | Kula | 4.04% | 0.64%(+3.41)#4 | 0.012%(+4.03)#15 |
| 16. | Fern Forest | 4.00% | 0.64%(+3.37)#5 | 0.012%(+3.99)#16 |
| 17. | Deer Island | 3.91% | 0.052%(+3.86)#1 | 0.012%(+3.90)#17 |
| 18. | De Graff | 3.75% | 0.0030%(+3.75)#1 | 0.012%(+3.74)#18 |
| 19. | Huntsville | 3.70% | 0.29%(+3.41)#6 | 0.012%(+3.69)#19 |
| 20. | De Queen | 3.26% | 0.29%(+2.97)#7 | 0.012%(+3.25)#20 |
| 21. | Pocahontas | 3.22% | 0.29%(+2.93)#8 | 0.012%(+3.21)#21 |
| 22. | Airway Heights | 3.21% | 0.064%(+3.14)#1 | 0.012%(+3.19)#22 |
| 23. | Timber Lakes | 3.10% | 0.037%(+3.06)#1 | 0.012%(+3.09)#23 |
| 24. | Halawa | 3.08% | 0.64%(+2.44)#6 | 0.012%(+3.07)#24 |
| 25. | Southside | 2.92% | 0.29%(+2.63)#9 | 0.012%(+2.91)#25 |
| 26. | Waipahu | 2.90% | 0.64%(+2.26)#7 | 0.012%(+2.89)#26 |
| 27. | Edwardsville | 2.87% | 0.0074%(+2.86)#1 | 0.012%(+2.85)#27 |
| 28. | Maud | 2.81% | 0.0041%(+2.81)#1 | 0.012%(+2.80)#28 |
| 29. | Honokaa | 2.58% | 0.64%(+1.94)#8 | 0.012%(+2.56)#29 |
| 30. | Deer Park | 2.41% | 0.064%(+2.35)#2 | 0.012%(+2.40)#30 |
| 31. | Nanakuli | 2.41% | 0.64%(+1.77)#9 | 0.012%(+2.40)#31 |
| 32. | Kaiminani | 2.39% | 0.64%(+1.75)#10 | 0.012%(+2.37)#32 |
| 33. | Cleburne | 2.35% | 0.0041%(+2.35)#2 | 0.012%(+2.34)#33 |
| 34. | Princeton | 2.33% | 0.0096%(+2.32)#1 | 0.012%(+2.31)#34 |
| 35. | Tontitown | 2.29% | 0.29%(+1.99)#10 | 0.012%(+2.28)#35 |
| 36. | Kahului | 2.19% | 0.64%(+1.55)#11 | 0.012%(+2.18)#36 |
| 37. | Owyhee | 2.17% | 0.0096%(+2.16)#1 | 0.012%(+2.16)#37 |
| 38. | Makaha | 1.92% | 0.64%(+1.28)#12 | 0.012%(+1.91)#38 |
| 39. | Makaha Valley | 1.90% | 0.64%(+1.26)#13 | 0.012%(+1.89)#39 |
| 40. | Griswold | 1.89% | 0.036%(+1.86)#2 | 0.012%(+1.88)#40 |
| 41. | Island City | 1.80% | 0.052%(+1.75)#2 | 0.012%(+1.79)#41 |
| 42. | Celina | 1.78% | 0.0030%(+1.77)#2 | 0.012%(+1.76)#42 |
| 43. | White Hall | 1.71% | 0.29%(+1.42)#11 | 0.012%(+1.70)#43 |
| 44. | Walhalla | 1.65% | 0.035%(+1.61)#1 | 0.012%(+1.64)#44 |
| 45. | Berryville | 1.52% | 0.29%(+1.22)#12 | 0.012%(+1.51)#45 |
| 46. | Royal Kunia | 1.52% | 0.64%(+0.878)#14 | 0.012%(+1.50)#46 |
| 47. | Eleele | 1.51% | 0.64%(+0.870)#15 | 0.012%(+1.50)#47 |
| 48. | Decatur | 1.48% | 0.29%(+1.18)#13 | 0.012%(+1.46)#48 |
| 49. | Florin | 1.46% | 0.0059%(+1.45)#1 | 0.012%(+1.44)#49 |
| 50. | Noel | 1.45% | 0.0027%(+1.45)#1 | 0.012%(+1.44)#50 |
| 51. | Gentry | 1.43% | 0.29%(+1.14)#14 | 0.012%(+1.42)#51 |
| 52. | Waianae | 1.43% | 0.64%(+0.788)#16 | 0.012%(+1.41)#52 |
| 53. | Eatonton | 1.35% | 0.0011%(+1.35)#1 | 0.012%(+1.34)#53 |
| 54. | Casey | 1.33% | 0.036%(+1.30)#3 | 0.012%(+1.32)#54 |
| 55. | Bull Shoals | 1.28% | 0.29%(+0.992)#15 | 0.012%(+1.27)#55 |
| 56. | Wailuku | 1.27% | 0.64%(+0.634)#17 | 0.012%(+1.26)#56 |
| 57. | Koloa | 1.23% | 0.64%(+0.590)#18 | 0.012%(+1.22)#57 |
| 58. | Clayton | 1.21% | 0.083%(+1.13)#4 | 0.012%(+1.20)#58 |
| 59. | Foyil | 1.20% | 0.083%(+1.12)#5 | 0.012%(+1.19)#59 |
| 60. | Burke | 1.17% | 0.0033%(+1.16)#1 | 0.012%(+1.16)#60 |
| 61. | Idabel | 1.09% | 0.083%(+1.00)#6 | 0.012%(+1.07)#61 |
| 62. | Mill City | 1.08% | 0.052%(+1.03)#3 | 0.012%(+1.07)#62 |
| 63. | Kearns | 1.07% | 0.037%(+1.04)#2 | 0.012%(+1.06)#63 |
| 64. | Bethel | 1.06% | 0.0094%(+1.05)#1 | 0.012%(+1.05)#64 |
| 65. | Dubuque | 1.04% | 0.036%(+1.01)#4 | 0.012%(+1.03)#65 |
| 66. | Alpha Borough | 1.03% | 0.0014%(+1.03)#1 | 0.012%(+1.02)#66 |
| 67. | Auburn | 1.02% | 0.064%(+0.960)#3 | 0.012%(+1.01)#67 |
| 68. | Green Mountain Falls | 0.97% | 0.0043%(+0.961)#1 | 0.012%(+0.953)#68 |
| 69. | Pleasanton | 0.93% | 0.0074%(+0.921)#2 | 0.012%(+0.916)#69 |
| 70. | Port Orchard | 0.92% | 0.064%(+0.859)#4 | 0.012%(+0.910)#70 |
| 71. | Ottumwa | 0.92% | 0.036%(+0.883)#5 | 0.012%(+0.906)#71 |
| 72. | Manchester | 0.82% | 0.0025%(+0.817)#1 | 0.012%(+0.807)#72 |
| 73. | Salem | 0.82% | 0.052%(+0.764)#4 | 0.012%(+0.804)#73 |
| 74. | Kapolei | 0.81% | 0.64%(+0.177)#19 | 0.012%(+0.802)#74 |
| 75. | Diamond | 0.81% | 0.0027%(+0.812)#2 | 0.012%(+0.802)#75 |
| 76. | Rudyard | 0.80% | 0.018%(+0.786)#1 | 0.012%(+0.792)#76 |
| 77. | Rogers | 0.79% | 0.29%(+0.500)#16 | 0.012%(+0.781)#77 |
| 78. | Fife | 0.79% | 0.064%(+0.726)#5 | 0.012%(+0.777)#78 |
| 79. | Hanson | 0.77% | 0.00033%(+0.766)#1 | 0.012%(+0.754)#79 |
| 80. | St Paul Park | 0.76% | 0.0029%(+0.761)#1 | 0.012%(+0.752)#80 |
| 81. | Pomeroy | 0.76% | 0.036%(+0.723)#6 | 0.012%(+0.747)#81 |
| 82. | Kahaluu Keauhou | 0.74% | 0.64%(+0.105)#20 | 0.012%(+0.730)#82 |
| 83. | Parkville | 0.73% | 0.00080%(+0.729)#1 | 0.012%(+0.717)#83 |
| 84. | Port Gamble Tribal Community | 0.71% | 0.064%(+0.642)#6 | 0.012%(+0.693)#84 |
| 85. | Tualatin | 0.67% | 0.052%(+0.617)#5 | 0.012%(+0.656)#85 |
| 86. | Lanai City | 0.66% | 0.64%(+0.024)#21 | 0.012%(+0.649)#86 |
| 87. | Green Forest | 0.66% | 0.29%(+0.366)#17 | 0.012%(+0.647)#87 |
| 88. | Urban Honolulu | 0.64% | 0.64%(+0.005)#22 | 0.012%(+0.630)#88 |
| 89. | Kronenwetter | 0.61% | 0.0036%(+0.608)#1 | 0.012%(+0.599)#89 |
| 90. | Cambridge Springs Borough | 0.61% | 0.00080%(+0.609)#2 | 0.012%(+0.597)#90 |
| 91. | Creighton | 0.61% | 0.0027%(+0.605)#3 | 0.012%(+0.595)#91 |
| 92. | Lamar | 0.60% | 0.0027%(+0.602)#4 | 0.012%(+0.592)#92 |
| 93. | Thorsby | 0.59% | 0.0021%(+0.586)#1 | 0.012%(+0.575)#93 |
| 94. | University Place | 0.57% | 0.064%(+0.507)#7 | 0.012%(+0.558)#94 |
| 95. | North Warren | 0.52% | 0.00080%(+0.519)#3 | 0.012%(+0.508)#95 |
| 96. | Mililani Town | 0.51% | 0.64%(-0.131)#23 | 0.012%(+0.494)#96 |
| 97. | Spokane | 0.50% | 0.064%(+0.432)#8 | 0.012%(+0.484)#97 |
| 98. | Whitmore Village | 0.49% | 0.64%(-0.152)#24 | 0.012%(+0.474)#98 |
| 99. | Maunawili | 0.48% | 0.64%(-0.154)#25 | 0.012%(+0.471)#99 |
| 100. | Forrest City | 0.48% | 0.29%(+0.183)#18 | 0.012%(+0.464)#100 |
Common Questions
What are the Top 10 Cities with the Highest Percentage of Fijian Population in the United States?
Top 10 Cities with the Highest Percentage of Fijian Population in the United States are:
#1
19.70%
#2
12.52%
#3
10.46%
#4
9.40%
#5
6.55%
#6
5.94%
#7
5.43%
#8
5.23%
#9
4.81%
#10
4.65%
What city has the Highest Percentage of Fijian Population in the United States?
Vandervoort has the Highest Percentage of Fijian Population in the United States with 19.70%.
What is the Percentage of Fijian Population in the United States?
Percentage of Fijian Population in the United States is 0.012%.