Cities with the Highest Percentage of Immigrants from South America in the United States
RELATED REPORTS & OPTIONS
South America
United States
Compare Cities
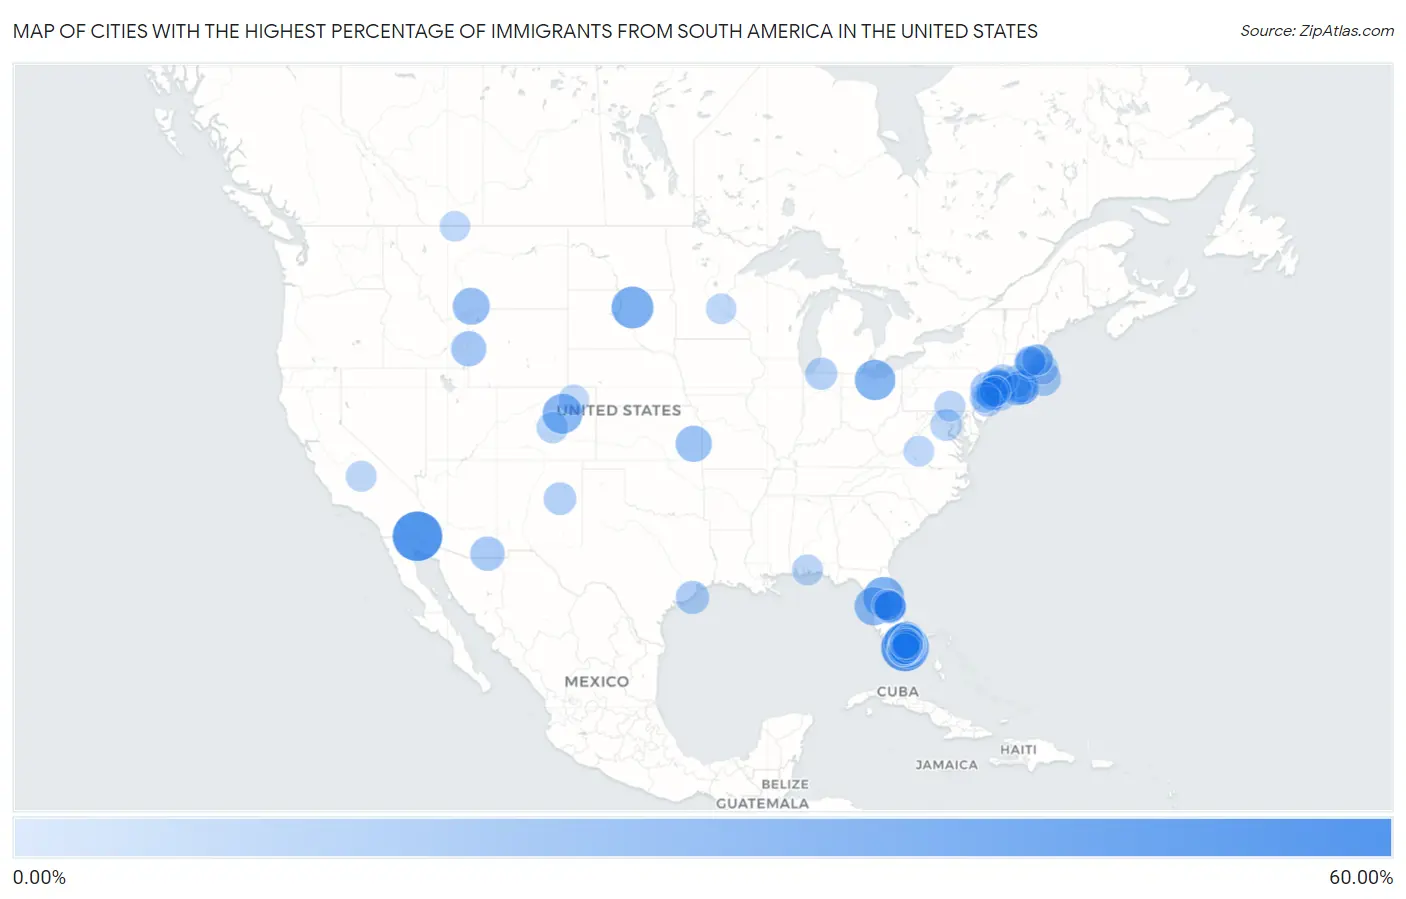
Map of Cities with the Highest Percentage of Immigrants from South America in the United States
0.00%
60.00%
Cities with the Highest Percentage of Immigrants from South America in the United States
| City | South America | vs State | vs National | |
| 1. | Padre Ranchitos | 59.38% | 0.33%(+59.0)#-1 | 1.10%(+58.3)#0 |
| 2. | Doral | 54.26% | 4.53%(+49.7)#245 | 1.10%(+53.2)#5,095 |
| 3. | East Newark Borough | 47.76% | 3.91%(+43.8)#74 | 1.10%(+46.7)#5,096 |
| 4. | Seneca | 40.48% | 0.070%(+40.4)#-1 | 1.10%(+39.4)#5,097 |
| 5. | Lisbon | 38.15% | 4.53%(+33.6)#246 | 1.10%(+37.1)#5,098 |
| 6. | Mitiwanga | 36.55% | 0.19%(+36.4)#-1 | 1.10%(+35.4)#5,099 |
| 7. | Brick Center | 35.23% | 0.51%(+34.7)#-1 | 1.10%(+34.1)#5,100 |
| 8. | Weston | 33.78% | 4.53%(+29.2)#247 | 1.10%(+32.7)#5,101 |
| 9. | Key Biscayne | 32.43% | 4.53%(+27.9)#248 | 1.10%(+31.3)#5,102 |
| 10. | Victory Gardens Borough | 32.37% | 3.91%(+28.5)#75 | 1.10%(+31.3)#5,103 |
| 11. | Quail Ridge | 32.09% | 4.53%(+27.6)#609 | 1.10%(+31.0)#11,857 |
| 12. | Bay Harbor Islands | 31.82% | 4.53%(+27.3)#610 | 1.10%(+30.7)#11,858 |
| 13. | Golden Beach | 28.47% | 4.53%(+23.9)#611 | 1.10%(+27.4)#11,859 |
| 14. | Corwin Springs | 28.39% | 0.13%(+28.3)#5 | 1.10%(+27.3)#11,860 |
| 15. | Moonachie Borough | 27.77% | 3.91%(+23.9)#199 | 1.10%(+26.7)#11,861 |
| 16. | Ojus | 27.39% | 4.53%(+22.9)#612 | 1.10%(+26.3)#11,862 |
| 17. | Sunny Isles Beach | 26.86% | 4.53%(+22.3)#613 | 1.10%(+25.8)#11,863 |
| 18. | Aventura | 26.68% | 4.53%(+22.1)#614 | 1.10%(+25.6)#11,864 |
| 19. | Moran | 26.60% | 0.25%(+26.3)#-1 | 1.10%(+25.5)#11,865 |
| 20. | North Bay Village | 25.19% | 4.53%(+20.7)#615 | 1.10%(+24.1)#11,866 |
| 21. | Freedom | 24.19% | 0.20%(+24.0)#-1 | 1.10%(+23.1)#11,867 |
| 22. | Cornwall | 24.10% | 2.73%(+21.4)#-1 | 1.10%(+23.0)#11,868 |
| 23. | Fountainebleau | 23.23% | 4.53%(+18.7)#616 | 1.10%(+22.1)#11,869 |
| 24. | East Hampton North | 22.98% | 3.10%(+19.9)#49 | 1.10%(+21.9)#11,870 |
| 25. | Watergate | 22.88% | 4.53%(+18.3)#617 | 1.10%(+21.8)#11,871 |
| 26. | Kearny | 22.82% | 3.91%(+18.9)#200 | 1.10%(+21.7)#11,872 |
| 27. | Wharton Borough | 22.60% | 3.91%(+18.7)#350 | 1.10%(+21.5)#12,555 |
| 28. | Virginia Gardens | 22.28% | 4.53%(+17.7)#618 | 1.10%(+21.2)#12,556 |
| 29. | Mcneal | 22.22% | 0.33%(+21.9)#152 | 1.10%(+21.1)#12,557 |
| 30. | Andres | 21.95% | 0.55%(+21.4)#-1 | 1.10%(+20.9)#12,558 |
| 31. | Vineyard Haven | 21.72% | 2.25%(+19.5)#-1 | 1.10%(+20.6)#12,559 |
| 32. | Silver Lake Cdp Essex County | 21.44% | 3.91%(+17.5)#351 | 1.10%(+20.3)#12,560 |
| 33. | Harrison | 21.01% | 3.91%(+17.1)#352 | 1.10%(+19.9)#12,561 |
| 34. | Dover | 20.95% | 3.91%(+17.0)#353 | 1.10%(+19.9)#12,562 |
| 35. | Napeague | 20.78% | 3.10%(+17.7)#50 | 1.10%(+19.7)#12,563 |
| 36. | Byram | 20.53% | 2.73%(+17.8)#8 | 1.10%(+19.4)#12,564 |
| 37. | Ampere North | 20.43% | 3.91%(+16.5)#354 | 1.10%(+19.3)#12,565 |
| 38. | Hunters Creek | 20.11% | 4.53%(+15.6)#619 | 1.10%(+19.0)#12,566 |
| 39. | Quintana | 19.51% | 0.77%(+18.7)#-1 | 1.10%(+18.4)#12,567 |
| 40. | Miami Beach | 19.41% | 4.53%(+14.9)#620 | 1.10%(+18.3)#12,568 |
| 41. | Elizabeth | 19.36% | 3.91%(+15.5)#355 | 1.10%(+18.3)#12,569 |
| 42. | Country Club | 19.11% | 4.53%(+14.6)#621 | 1.10%(+18.0)#12,570 |
| 43. | The Hammocks | 18.93% | 4.53%(+14.4)#622 | 1.10%(+17.8)#12,571 |
| 44. | Port Chester | 18.41% | 3.10%(+15.3)#51 | 1.10%(+17.3)#12,572 |
| 45. | Puerto De Luna | 17.90% | 0.25%(+17.7)#-1 | 1.10%(+16.8)#12,573 |
| 46. | Saybrook Manor | 17.63% | 2.73%(+14.9)#9 | 1.10%(+16.5)#12,574 |
| 47. | Springs | 17.46% | 3.10%(+14.4)#439 | 1.10%(+16.4)#12,575 |
| 48. | Three Lakes | 17.40% | 4.53%(+12.9)#623 | 1.10%(+16.3)#12,576 |
| 49. | Dunellen Borough | 17.20% | 3.91%(+13.3)#356 | 1.10%(+16.1)#12,577 |
| 50. | Ives Estates | 17.16% | 4.53%(+12.6)#624 | 1.10%(+16.1)#12,578 |
| 51. | Kendall West | 17.15% | 4.53%(+12.6)#625 | 1.10%(+16.0)#12,579 |
| 52. | The Crossings | 16.77% | 4.53%(+12.2)#626 | 1.10%(+15.7)#12,580 |
| 53. | Indian Village | 16.54% | 0.25%(+16.3)#-1 | 1.10%(+15.4)#12,581 |
| 54. | Coconut Creek | 16.34% | 4.53%(+11.8)#627 | 1.10%(+15.2)#12,582 |
| 55. | Meadow Woods | 16.21% | 4.53%(+11.7)#628 | 1.10%(+15.1)#12,583 |
| 56. | Union City | 16.12% | 3.91%(+12.2)#357 | 1.10%(+15.0)#12,584 |
| 57. | Milford | 16.06% | 2.25%(+13.8)#32 | 1.10%(+15.0)#12,585 |
| 58. | Kissimmee | 15.93% | 4.53%(+11.4)#629 | 1.10%(+14.8)#12,586 |
| 59. | Lauderdale By The Sea | 15.88% | 4.53%(+11.3)#630 | 1.10%(+14.8)#12,587 |
| 60. | Ossining | 15.66% | 3.10%(+12.6)#440 | 1.10%(+14.6)#12,588 |
| 61. | North Miami Beach | 15.66% | 4.53%(+11.1)#631 | 1.10%(+14.6)#12,589 |
| 62. | North Plymouth | 15.44% | 2.25%(+13.2)#33 | 1.10%(+14.3)#12,590 |
| 63. | Island Park | 15.32% | 3.10%(+12.2)#441 | 1.10%(+14.2)#12,591 |
| 64. | Midland | 15.29% | 0.51%(+14.8)#0 | 1.10%(+14.2)#12,592 |
| 65. | Oak Grove | 15.24% | 1.17%(+14.1)#274 | 1.10%(+14.1)#12,593 |
| 66. | Hallandale Beach | 15.16% | 4.53%(+10.6)#632 | 1.10%(+14.1)#12,594 |
| 67. | Sleepy Hollow | 15.06% | 3.10%(+12.0)#442 | 1.10%(+14.0)#12,595 |
| 68. | Port Morris | 15.05% | 3.91%(+11.1)#358 | 1.10%(+13.9)#12,596 |
| 69. | Deerfield Beach | 14.86% | 4.53%(+10.3)#633 | 1.10%(+13.8)#12,597 |
| 70. | Everett | 14.76% | 2.25%(+12.5)#34 | 1.10%(+13.7)#12,598 |
| 71. | Sunrise | 14.74% | 4.53%(+10.2)#634 | 1.10%(+13.6)#12,599 |
| 72. | Danbury | 14.51% | 2.73%(+11.8)#13 | 1.10%(+13.4)#12,600 |
| 73. | Southchase | 14.47% | 4.53%(+9.94)#635 | 1.10%(+13.4)#12,601 |
| 74. | Surfside | 14.31% | 4.53%(+9.78)#636 | 1.10%(+13.2)#12,602 |
| 75. | Guttenberg | 14.29% | 3.91%(+10.4)#359 | 1.10%(+13.2)#12,603 |
| 76. | West Miami | 14.02% | 4.53%(+9.49)#637 | 1.10%(+12.9)#12,604 |
| 77. | Floridatown | 13.92% | 4.53%(+9.39)#638 | 1.10%(+12.8)#12,605 |
| 78. | Hampton Bays | 13.80% | 3.10%(+10.7)#443 | 1.10%(+12.7)#12,606 |
| 79. | Ponderosa | 13.79% | 0.74%(+13.1)#341 | 1.10%(+12.7)#12,607 |
| 80. | El Portal | 13.76% | 4.53%(+9.23)#639 | 1.10%(+12.7)#12,608 |
| 81. | Horizon West | 13.61% | 4.53%(+9.08)#640 | 1.10%(+12.5)#12,609 |
| 82. | Framingham | 13.55% | 2.25%(+11.3)#35 | 1.10%(+12.5)#12,610 |
| 83. | South Miami | 13.50% | 4.53%(+8.97)#641 | 1.10%(+12.4)#12,611 |
| 84. | Twin Rivers | 13.49% | 3.91%(+9.59)#360 | 1.10%(+12.4)#12,612 |
| 85. | Revere | 13.45% | 2.25%(+11.2)#36 | 1.10%(+12.3)#12,613 |
| 86. | Gardners | 13.40% | 0.49%(+12.9)#9 | 1.10%(+12.3)#12,614 |
| 87. | Big Island | 13.26% | 1.17%(+12.1)#275 | 1.10%(+12.2)#12,615 |
| 88. | Snyder | 13.21% | 0.51%(+12.7)#1 | 1.10%(+12.1)#12,616 |
| 89. | West New York | 13.21% | 3.91%(+9.30)#361 | 1.10%(+12.1)#12,617 |
| 90. | Lodi Borough | 13.19% | 3.91%(+9.29)#362 | 1.10%(+12.1)#12,618 |
| 91. | Newark | 13.12% | 3.91%(+9.21)#363 | 1.10%(+12.0)#12,619 |
| 92. | North Plainfield Borough | 12.96% | 3.91%(+9.06)#364 | 1.10%(+11.9)#12,620 |
| 93. | Hilltop | 12.94% | 0.45%(+12.5)#17 | 1.10%(+11.8)#12,621 |
| 94. | Hollywood | 12.92% | 4.53%(+8.39)#642 | 1.10%(+11.8)#12,622 |
| 95. | Sweet Grass | 12.86% | 0.13%(+12.7)#6 | 1.10%(+11.8)#12,623 |
| 96. | Pembroke Pines | 12.83% | 4.53%(+8.30)#643 | 1.10%(+11.7)#12,624 |
| 97. | Menlo Park Terrace | 12.80% | 3.91%(+8.90)#365 | 1.10%(+11.7)#12,625 |
| 98. | Skillman | 12.79% | 3.91%(+8.89)#366 | 1.10%(+11.7)#12,626 |
| 99. | Marlborough | 12.77% | 2.25%(+10.5)#37 | 1.10%(+11.7)#12,627 |
| 100. | Hightstown Borough | 12.69% | 3.91%(+8.78)#367 | 1.10%(+11.6)#12,628 |
Common Questions
What are the Top 10 Cities with the Highest Percentage of Immigrants from South America in the United States?
Top 10 Cities with the Highest Percentage of Immigrants from South America in the United States are:
#1
59.38%
#2
54.26%
#3
40.48%
#4
38.15%
#5
36.55%
#6
35.23%
#7
33.78%
#8
32.43%
#9
32.09%
#10
31.82%
What city has the Highest Percentage of Immigrants from South America in the United States?
Padre Ranchitos has the Highest Percentage of Immigrants from South America in the United States with 59.38%.
What is the Percentage of Immigrants from South America in the United States?
Percentage of Immigrants from South America in the United States is 1.10%.