North Charleston, SC Map & Demographics
North Charleston Map
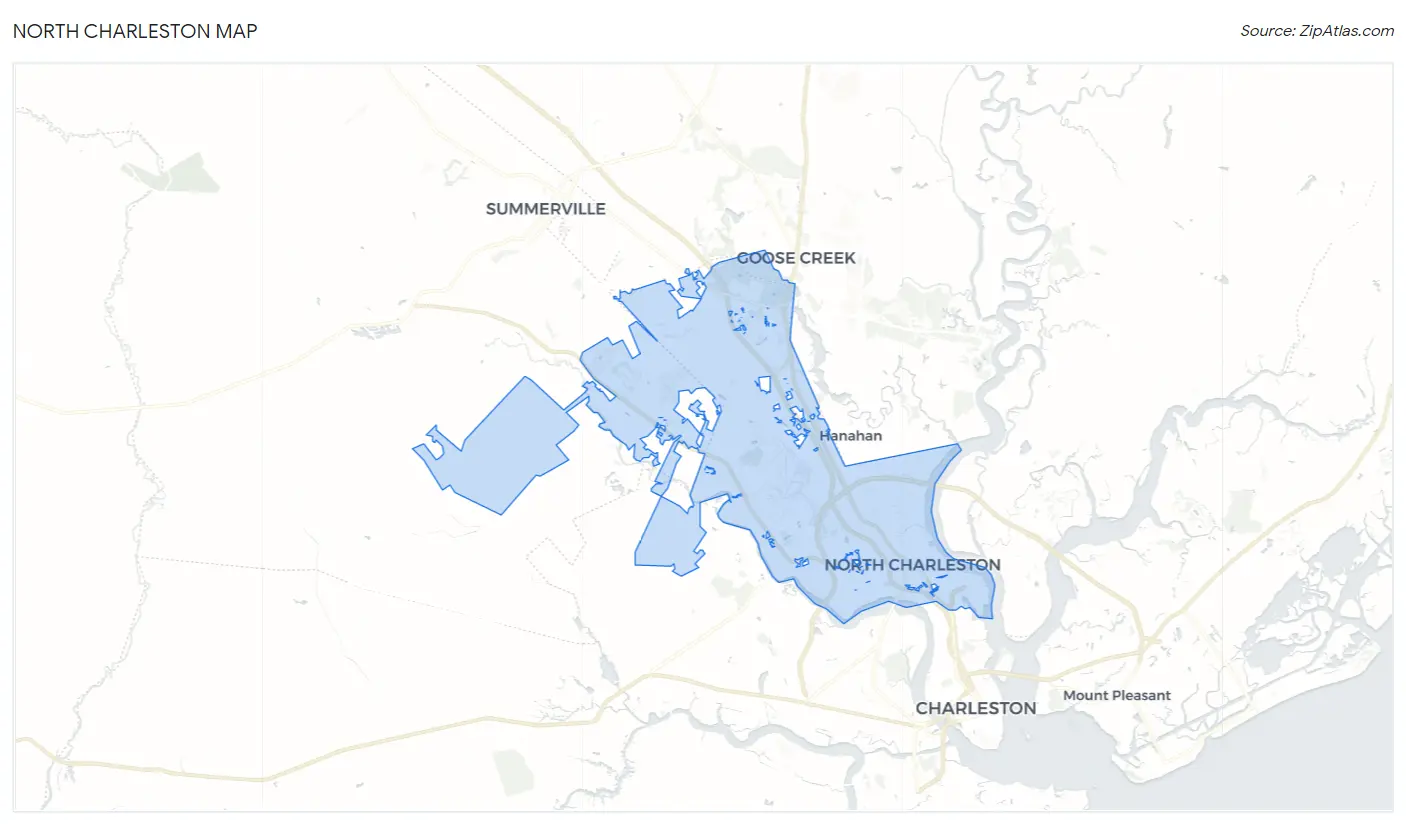
North Charleston Overview
$33,419
PER CAPITA INCOME
$72,565
AVG FAMILY INCOME
$58,534
AVG HOUSEHOLD INCOME
21.6%
WAGE / INCOME GAP [ % ]
78.4¢/ $1
WAGE / INCOME GAP [ $ ]
$10,098
FAMILY INCOME DEFICIT
0.45
INEQUALITY / GINI INDEX
115,755
TOTAL POPULATION
57,721
MALE POPULATION
58,034
FEMALE POPULATION
99.46
MALES / 100 FEMALES
100.54
FEMALES / 100 MALES
33.8
MEDIAN AGE
3.2
AVG FAMILY SIZE
2.4
AVG HOUSEHOLD SIZE
62,974
LABOR FORCE [ PEOPLE ]
69.0%
PERCENT IN LABOR FORCE
4.3%
UNEMPLOYMENT RATE
North Charleston Area Codes
Income in North Charleston
Income Overview in North Charleston
Per Capita Income in North Charleston is $33,419, while median incomes of families and households are $72,565 and $58,534 respectively.
| Characteristic | Number | Measure |
| Per Capita Income | 115,755 | $33,419 |
| Median Family Income | 25,422 | $72,565 |
| Mean Family Income | 25,422 | $89,004 |
| Median Household Income | 45,917 | $58,534 |
| Mean Household Income | 45,917 | $79,035 |
| Income Deficit | 25,422 | $10,098 |
| Wage / Income Gap (%) | 115,755 | 21.63% |
| Wage / Income Gap ($) | 115,755 | 78.37¢ per $1 |
| Gini / Inequality Index | 115,755 | 0.45 |
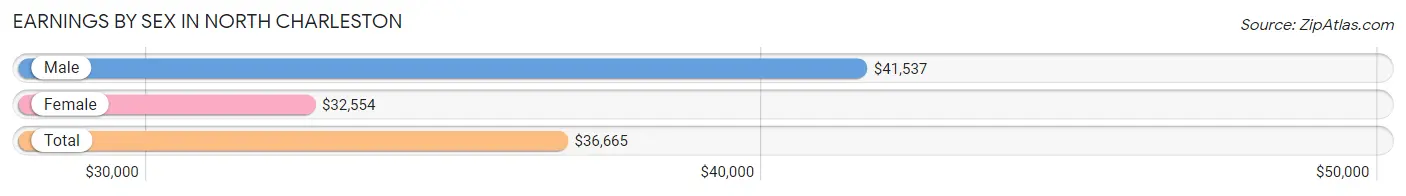
Earnings by Sex in North Charleston
Average Earnings in North Charleston are $36,665, $41,537 for men and $32,554 for women, a difference of 21.6%.
| Sex | Number | Average Earnings |
| Male | 34,720 (52.9%) | $41,537 |
| Female | 30,916 (47.1%) | $32,554 |
| Total | 65,636 (100.0%) | $36,665 |
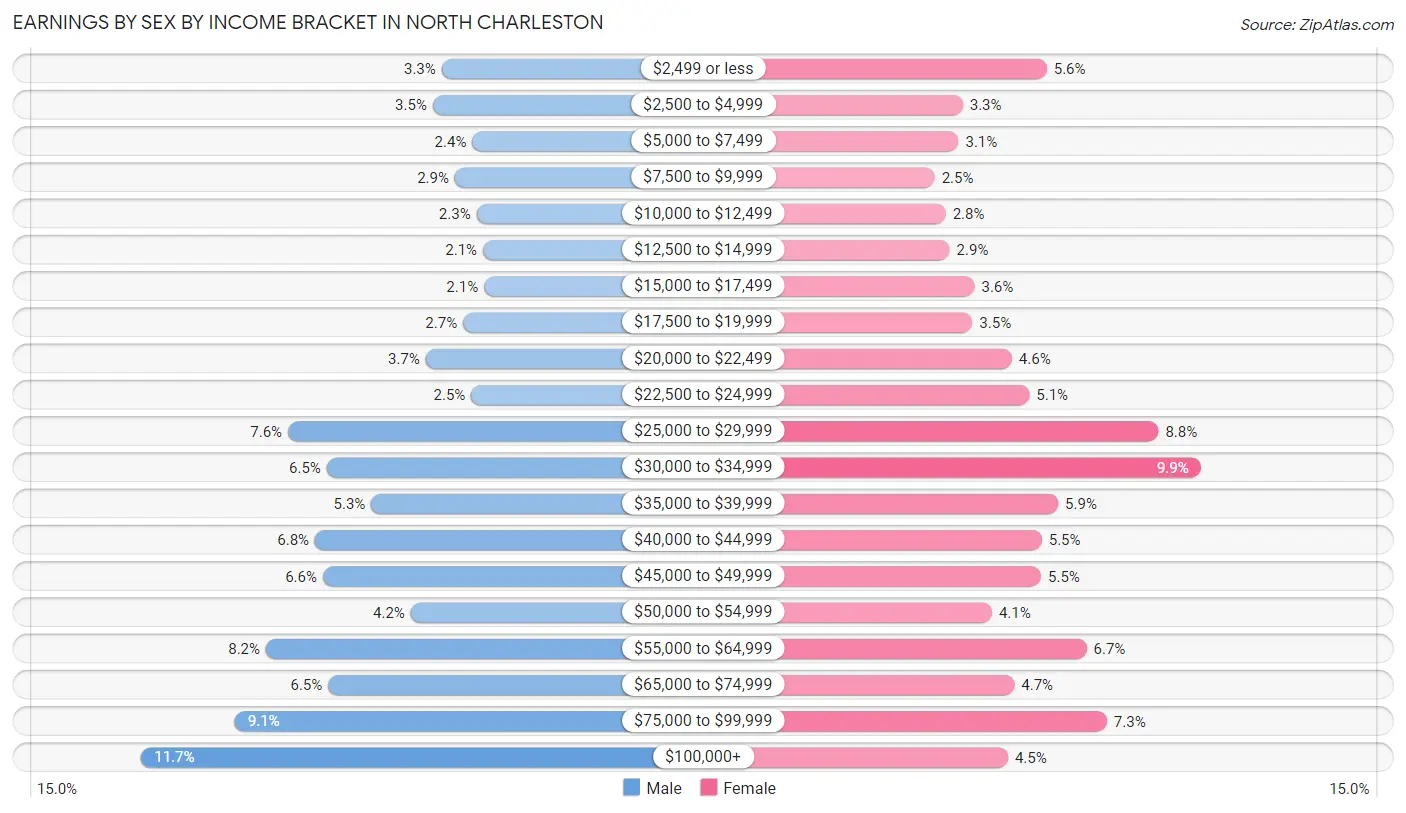
Earnings by Sex by Income Bracket in North Charleston
The most common earnings brackets in North Charleston are $100,000+ for men (4,070 | 11.7%) and $30,000 to $34,999 for women (3,072 | 9.9%).
| Income | Male | Female |
| $2,499 or less | 1,139 (3.3%) | 1,739 (5.6%) |
| $2,500 to $4,999 | 1,225 (3.5%) | 1,009 (3.3%) |
| $5,000 to $7,499 | 841 (2.4%) | 970 (3.1%) |
| $7,500 to $9,999 | 1,011 (2.9%) | 765 (2.5%) |
| $10,000 to $12,499 | 798 (2.3%) | 860 (2.8%) |
| $12,500 to $14,999 | 735 (2.1%) | 892 (2.9%) |
| $15,000 to $17,499 | 727 (2.1%) | 1,109 (3.6%) |
| $17,500 to $19,999 | 932 (2.7%) | 1,092 (3.5%) |
| $20,000 to $22,499 | 1,294 (3.7%) | 1,436 (4.6%) |
| $22,500 to $24,999 | 852 (2.5%) | 1,586 (5.1%) |
| $25,000 to $29,999 | 2,639 (7.6%) | 2,708 (8.8%) |
| $30,000 to $34,999 | 2,260 (6.5%) | 3,072 (9.9%) |
| $35,000 to $39,999 | 1,827 (5.3%) | 1,837 (5.9%) |
| $40,000 to $44,999 | 2,374 (6.8%) | 1,695 (5.5%) |
| $45,000 to $49,999 | 2,298 (6.6%) | 1,687 (5.5%) |
| $50,000 to $54,999 | 1,440 (4.2%) | 1,262 (4.1%) |
| $55,000 to $64,999 | 2,854 (8.2%) | 2,083 (6.7%) |
| $65,000 to $74,999 | 2,247 (6.5%) | 1,455 (4.7%) |
| $75,000 to $99,999 | 3,157 (9.1%) | 2,259 (7.3%) |
| $100,000+ | 4,070 (11.7%) | 1,400 (4.5%) |
| Total | 34,720 (100.0%) | 30,916 (100.0%) |
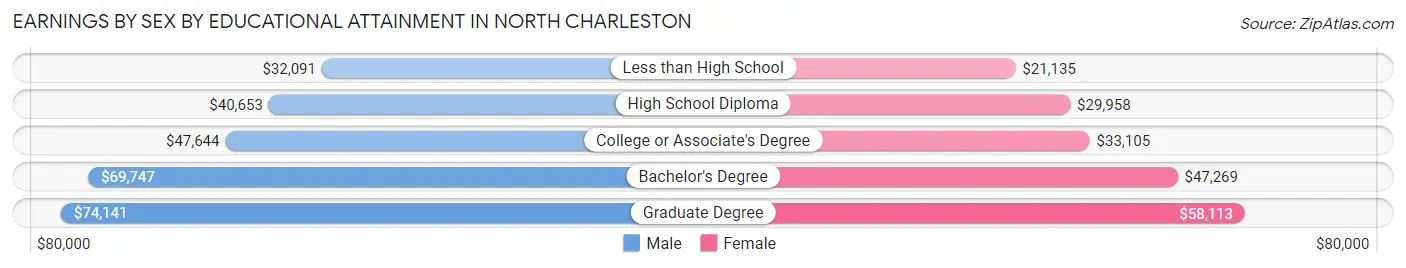
Earnings by Sex by Educational Attainment in North Charleston
Average earnings in North Charleston are $46,525 for men and $34,721 for women, a difference of 25.4%. Men with an educational attainment of graduate degree enjoy the highest average annual earnings of $74,141, while those with less than high school education earn the least with $32,091. Women with an educational attainment of graduate degree earn the most with the average annual earnings of $58,113, while those with less than high school education have the smallest earnings of $21,135.
| Educational Attainment | Male Income | Female Income |
| Less than High School | $32,091 | $21,135 |
| High School Diploma | $40,653 | $29,958 |
| College or Associate's Degree | $47,644 | $33,105 |
| Bachelor's Degree | $69,747 | $47,269 |
| Graduate Degree | $74,141 | $58,113 |
| Total | $46,525 | $34,721 |
Family Income in North Charleston
Family Income Brackets in North Charleston
According to the North Charleston family income data, there are 4,474 families falling into the $100,000 to $149,999 income range, which is the most common income bracket and makes up 17.6% of all families. Conversely, the $10,000 to $14,999 income bracket is the least frequent group with only 330 families (1.3%) belonging to this category.
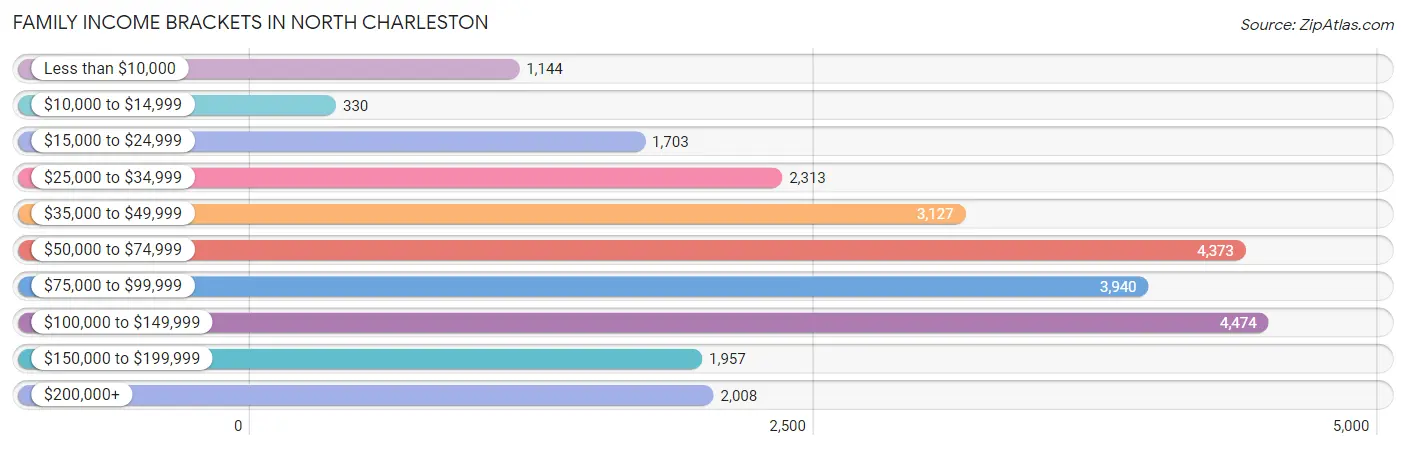
| Income Bracket | # Families | % Families |
| Less than $10,000 | 1,144 | 4.5% |
| $10,000 to $14,999 | 330 | 1.3% |
| $15,000 to $24,999 | 1,703 | 6.7% |
| $25,000 to $34,999 | 2,313 | 9.1% |
| $35,000 to $49,999 | 3,127 | 12.3% |
| $50,000 to $74,999 | 4,373 | 17.2% |
| $75,000 to $99,999 | 3,940 | 15.5% |
| $100,000 to $149,999 | 4,474 | 17.6% |
| $150,000 to $199,999 | 1,957 | 7.7% |
| $200,000+ | 2,008 | 7.9% |
Family Income by Famaliy Size in North Charleston
6-person families (485 | 1.9%) account for the highest median family income in North Charleston with $102,228 per family, while 2-person families (12,514 | 49.2%) have the highest median income of $34,808 per family member.
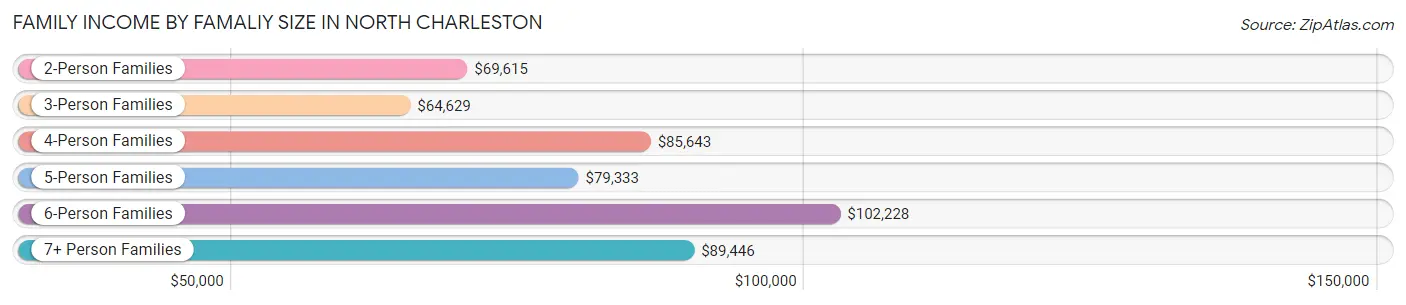
| Income Bracket | # Families | Median Income |
| 2-Person Families | 12,514 (49.2%) | $69,615 |
| 3-Person Families | 6,394 (25.2%) | $64,629 |
| 4-Person Families | 3,796 (14.9%) | $85,643 |
| 5-Person Families | 1,830 (7.2%) | $79,333 |
| 6-Person Families | 485 (1.9%) | $102,228 |
| 7+ Person Families | 403 (1.6%) | $89,446 |
| Total | 25,422 (100.0%) | $72,565 |
Family Income by Number of Earners in North Charleston
The median family income in North Charleston is $72,565, with families comprising 3+ earners (2,220) having the highest median family income of $118,457, while families with no earners (2,932) have the lowest median family income of $40,781, accounting for 8.7% and 11.5% of families, respectively.
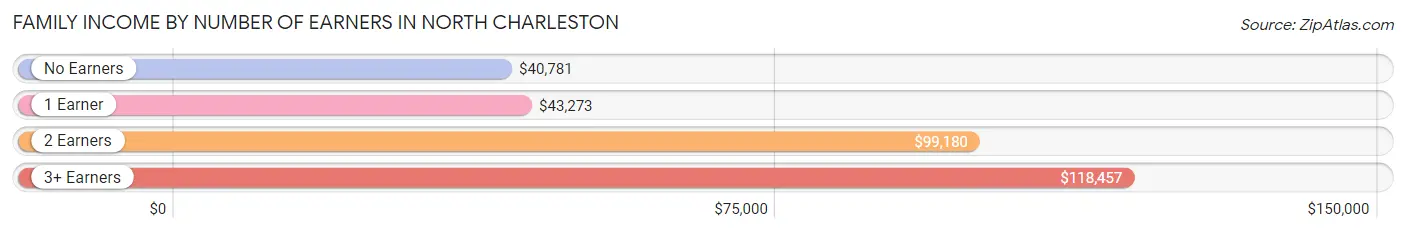
| Number of Earners | # Families | Median Income |
| No Earners | 2,932 (11.5%) | $40,781 |
| 1 Earner | 9,753 (38.4%) | $43,273 |
| 2 Earners | 10,517 (41.4%) | $99,180 |
| 3+ Earners | 2,220 (8.7%) | $118,457 |
| Total | 25,422 (100.0%) | $72,565 |
Household Income in North Charleston
Household Income Brackets in North Charleston
With 8,908 households falling in the category, the $50,000 to $74,999 income range is the most frequent in North Charleston, accounting for 19.4% of all households. In contrast, only 1,561 households (3.4%) fall into the $10,000 to $14,999 income bracket, making it the least populous group.
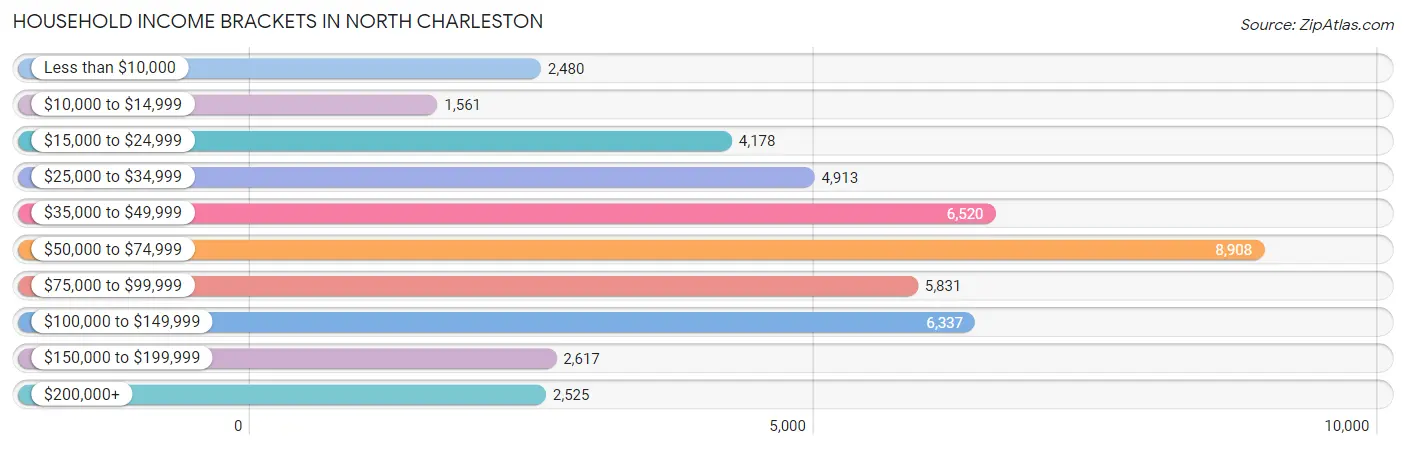
| Income Bracket | # Households | % Households |
| Less than $10,000 | 2,480 | 5.4% |
| $10,000 to $14,999 | 1,561 | 3.4% |
| $15,000 to $24,999 | 4,178 | 9.1% |
| $25,000 to $34,999 | 4,913 | 10.7% |
| $35,000 to $49,999 | 6,520 | 14.2% |
| $50,000 to $74,999 | 8,908 | 19.4% |
| $75,000 to $99,999 | 5,831 | 12.7% |
| $100,000 to $149,999 | 6,337 | 13.8% |
| $150,000 to $199,999 | 2,617 | 5.7% |
| $200,000+ | 2,525 | 5.5% |
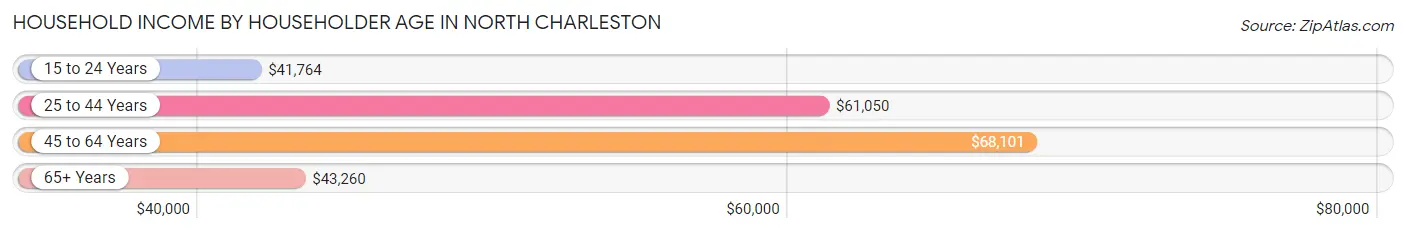
Household Income by Householder Age in North Charleston
The median household income in North Charleston is $58,534, with the highest median household income of $68,101 found in the 45 to 64 years age bracket for the primary householder. A total of 15,022 households (32.7%) fall into this category. Meanwhile, the 15 to 24 years age bracket for the primary householder has the lowest median household income of $41,764, with 2,151 households (4.7%) in this group.
| Income Bracket | # Households | Median Income |
| 15 to 24 Years | 2,151 (4.7%) | $41,764 |
| 25 to 44 Years | 20,143 (43.9%) | $61,050 |
| 45 to 64 Years | 15,022 (32.7%) | $68,101 |
| 65+ Years | 8,601 (18.7%) | $43,260 |
| Total | 45,917 (100.0%) | $58,534 |
Poverty in North Charleston
Income Below Poverty by Sex and Age in North Charleston
With 15.3% poverty level for males and 17.6% for females among the residents of North Charleston, 12 to 14 year old males and 16 and 17 year old females are the most vulnerable to poverty, with 1,010 males (50.3%) and 327 females (31.2%) in their respective age groups living below the poverty level.
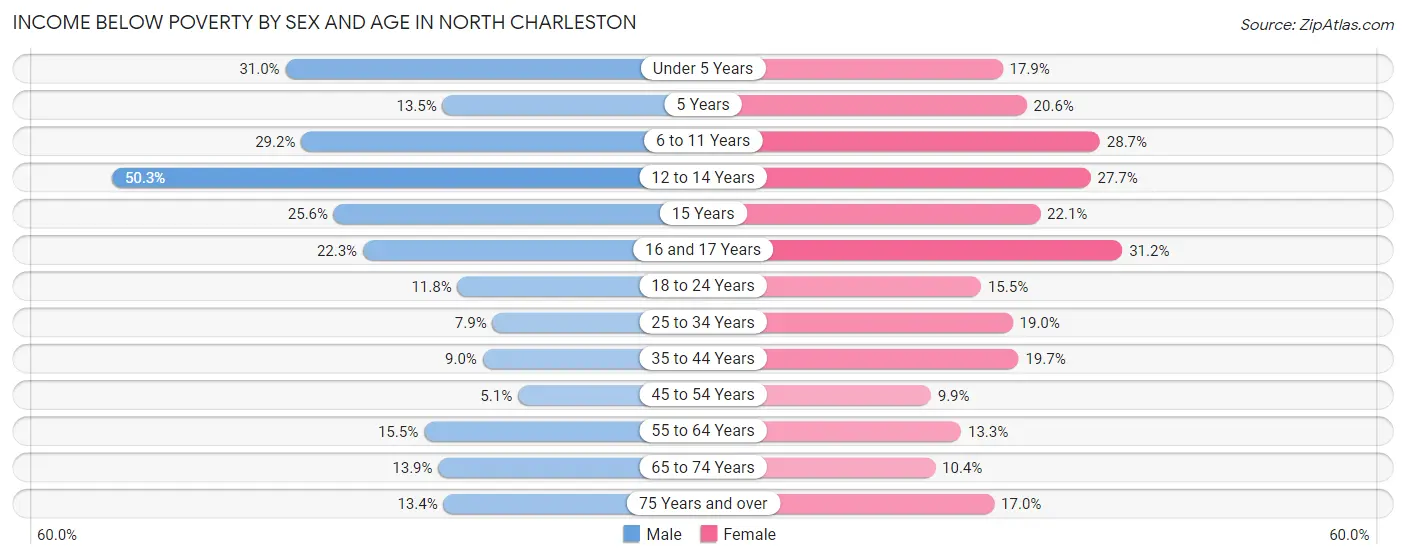
| Age Bracket | Male | Female |
| Under 5 Years | 1,272 (30.9%) | 600 (17.9%) |
| 5 Years | 62 (13.5%) | 97 (20.6%) |
| 6 to 11 Years | 1,464 (29.2%) | 1,377 (28.7%) |
| 12 to 14 Years | 1,010 (50.3%) | 575 (27.7%) |
| 15 Years | 184 (25.6%) | 152 (22.1%) |
| 16 and 17 Years | 227 (22.3%) | 327 (31.2%) |
| 18 to 24 Years | 565 (11.8%) | 660 (15.5%) |
| 25 to 34 Years | 870 (7.9%) | 2,008 (19.0%) |
| 35 to 44 Years | 700 (9.0%) | 1,548 (19.7%) |
| 45 to 54 Years | 311 (5.1%) | 640 (9.9%) |
| 55 to 64 Years | 881 (15.5%) | 967 (13.3%) |
| 65 to 74 Years | 554 (13.9%) | 464 (10.4%) |
| 75 Years and over | 235 (13.4%) | 515 (17.0%) |
| Total | 8,335 (15.3%) | 9,930 (17.6%) |
Income Above Poverty by Sex and Age in North Charleston
According to the poverty statistics in North Charleston, males aged 45 to 54 years and females aged 45 to 54 years are the age groups that are most secure financially, with 95.0% of males and 90.1% of females in these age groups living above the poverty line.
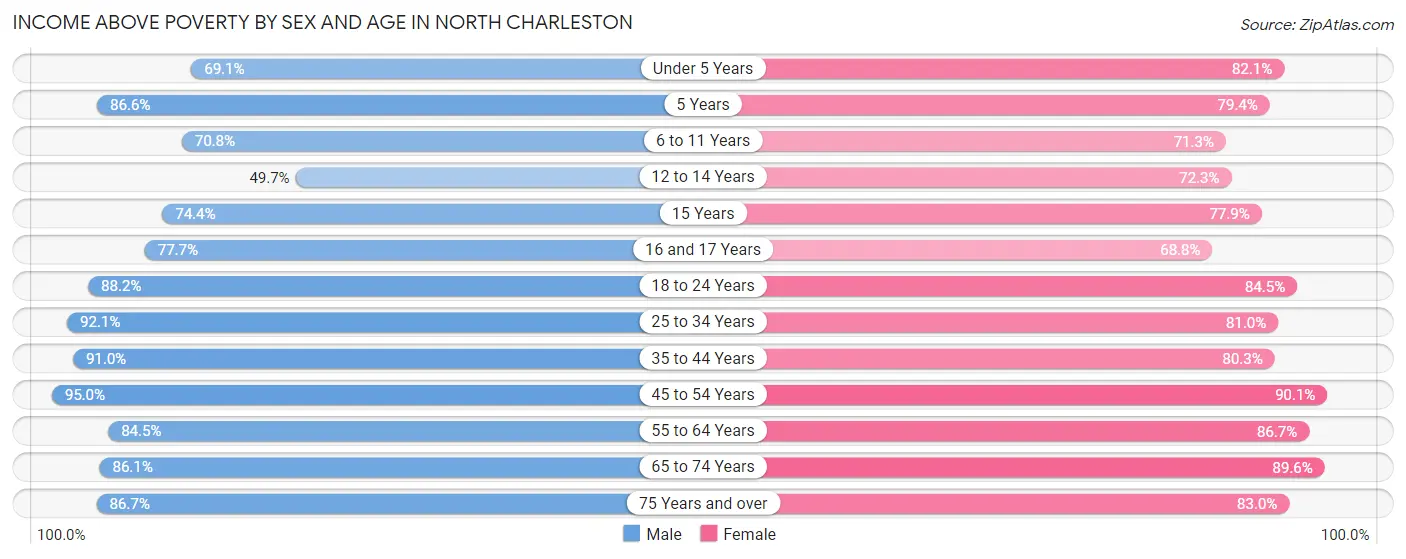
| Age Bracket | Male | Female |
| Under 5 Years | 2,838 (69.1%) | 2,751 (82.1%) |
| 5 Years | 399 (86.6%) | 374 (79.4%) |
| 6 to 11 Years | 3,551 (70.8%) | 3,415 (71.3%) |
| 12 to 14 Years | 999 (49.7%) | 1,501 (72.3%) |
| 15 Years | 536 (74.4%) | 536 (77.9%) |
| 16 and 17 Years | 790 (77.7%) | 720 (68.8%) |
| 18 to 24 Years | 4,229 (88.2%) | 3,597 (84.5%) |
| 25 to 34 Years | 10,156 (92.1%) | 8,549 (81.0%) |
| 35 to 44 Years | 7,099 (91.0%) | 6,317 (80.3%) |
| 45 to 54 Years | 5,846 (95.0%) | 5,820 (90.1%) |
| 55 to 64 Years | 4,794 (84.5%) | 6,317 (86.7%) |
| 65 to 74 Years | 3,425 (86.1%) | 4,002 (89.6%) |
| 75 Years and over | 1,525 (86.7%) | 2,519 (83.0%) |
| Total | 46,187 (84.7%) | 46,418 (82.4%) |
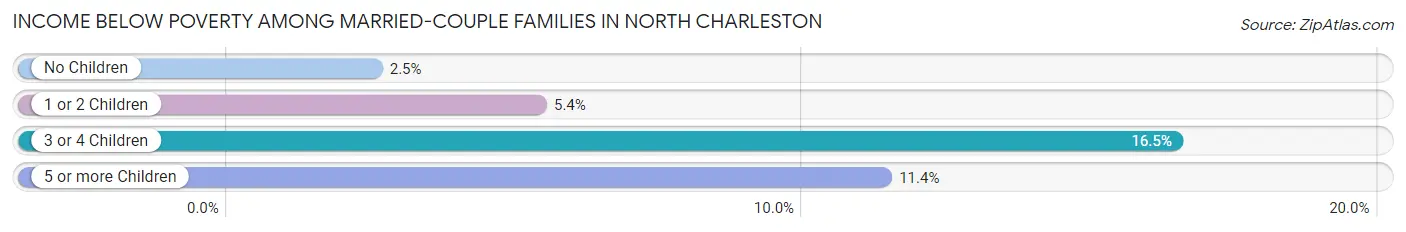
Income Below Poverty Among Married-Couple Families in North Charleston
The poverty statistics for married-couple families in North Charleston show that 4.7% or 719 of the total 15,373 families live below the poverty line. Families with 3 or 4 children have the highest poverty rate of 16.5%, comprising of 201 families. On the other hand, families with no children have the lowest poverty rate of 2.5%, which includes 219 families.
| Children | Above Poverty | Below Poverty |
| No Children | 8,467 (97.5%) | 219 (2.5%) |
| 1 or 2 Children | 5,097 (94.6%) | 290 (5.4%) |
| 3 or 4 Children | 1,020 (83.5%) | 201 (16.5%) |
| 5 or more Children | 70 (88.6%) | 9 (11.4%) |
| Total | 14,654 (95.3%) | 719 (4.7%) |
Income Below Poverty Among Single-Parent Households in North Charleston
According to the poverty data in North Charleston, 12.9% or 282 single-father households and 28.4% or 2,233 single-mother households are living below the poverty line. Among single-father households, those with 3 or 4 children have the highest poverty rate, with 94 households (49.2%) experiencing poverty. Likewise, among single-mother households, those with 5 or more children have the highest poverty rate, with 52 households (78.8%) falling below the poverty line.
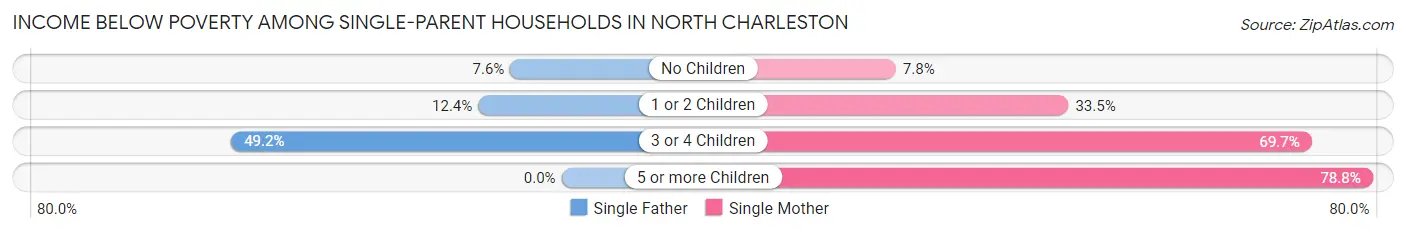
| Children | Single Father | Single Mother |
| No Children | 95 (7.6%) | 228 (7.8%) |
| 1 or 2 Children | 93 (12.4%) | 1,327 (33.5%) |
| 3 or 4 Children | 94 (49.2%) | 626 (69.7%) |
| 5 or more Children | 0 (0.0%) | 52 (78.8%) |
| Total | 282 (12.9%) | 2,233 (28.4%) |
Income Below Poverty Among Married-Couple vs Single-Parent Households in North Charleston
The poverty data for North Charleston shows that 719 of the married-couple family households (4.7%) and 2,515 of the single-parent households (25.0%) are living below the poverty level. Within the married-couple family households, those with 3 or 4 children have the highest poverty rate, with 201 households (16.5%) falling below the poverty line. Among the single-parent households, those with 5 or more children have the highest poverty rate, with 52 household (66.7%) living below poverty.
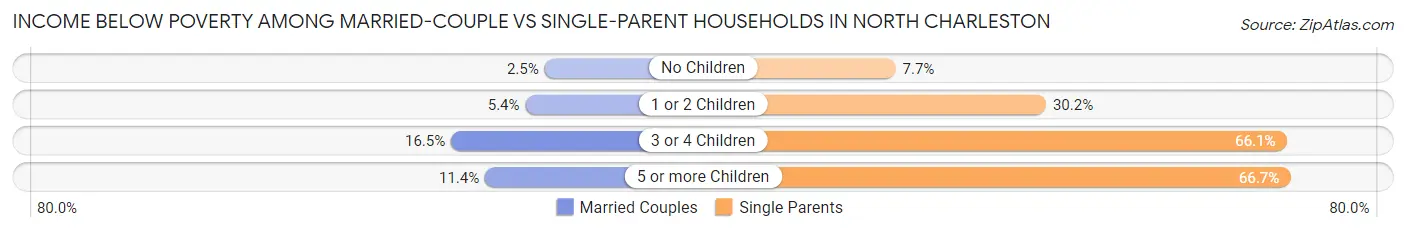
| Children | Married-Couple Families | Single-Parent Households |
| No Children | 219 (2.5%) | 323 (7.7%) |
| 1 or 2 Children | 290 (5.4%) | 1,420 (30.1%) |
| 3 or 4 Children | 201 (16.5%) | 720 (66.1%) |
| 5 or more Children | 9 (11.4%) | 52 (66.7%) |
| Total | 719 (4.7%) | 2,515 (25.0%) |
Race in North Charleston
The most populous races in North Charleston are Black / African American (51,905 | 44.8%), White / Caucasian (45,812 | 39.6%), and Hispanic or Latino (11,926 | 10.3%).
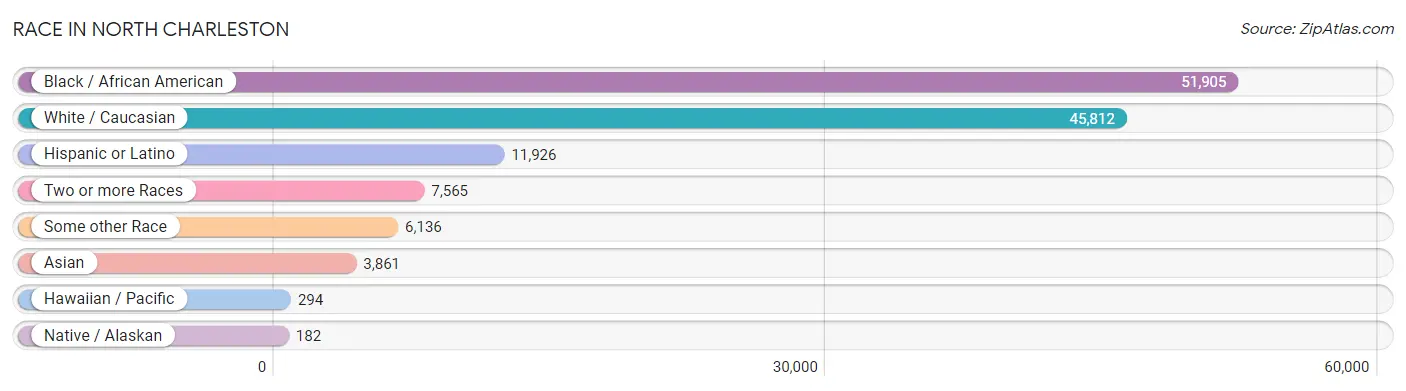
| Race | # Population | % Population |
| Asian | 3,861 | 3.3% |
| Black / African American | 51,905 | 44.8% |
| Hawaiian / Pacific | 294 | 0.3% |
| Hispanic or Latino | 11,926 | 10.3% |
| Native / Alaskan | 182 | 0.2% |
| White / Caucasian | 45,812 | 39.6% |
| Two or more Races | 7,565 | 6.5% |
| Some other Race | 6,136 | 5.3% |
| Total | 115,755 | 100.0% |
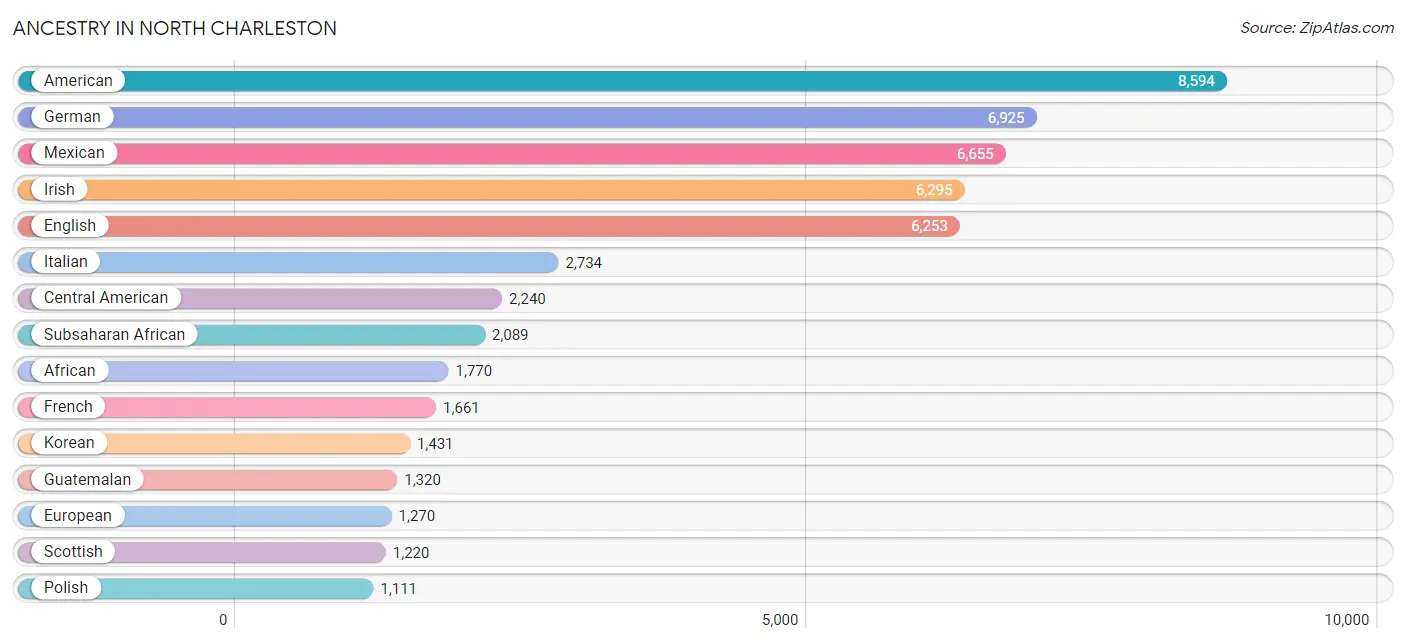
Ancestry in North Charleston
The most populous ancestries reported in North Charleston are American (8,594 | 7.4%), German (6,925 | 6.0%), Mexican (6,655 | 5.8%), Irish (6,295 | 5.4%), and English (6,253 | 5.4%), together accounting for 30.0% of all North Charleston residents.
| Ancestry | # Population | % Population |
| African | 1,770 | 1.5% |
| Alaskan Athabascan | 2 | 0.0% |
| American | 8,594 | 7.4% |
| Arab | 236 | 0.2% |
| Argentinean | 16 | 0.0% |
| Armenian | 23 | 0.0% |
| Australian | 6 | 0.0% |
| Austrian | 124 | 0.1% |
| Bangladeshi | 53 | 0.1% |
| Belgian | 32 | 0.0% |
| Bhutanese | 155 | 0.1% |
| Brazilian | 254 | 0.2% |
| British | 577 | 0.5% |
| British West Indian | 83 | 0.1% |
| Burmese | 228 | 0.2% |
| Cajun | 12 | 0.0% |
| Canadian | 200 | 0.2% |
| Central American | 2,240 | 1.9% |
| Central American Indian | 53 | 0.1% |
| Cherokee | 516 | 0.4% |
| Chippewa | 22 | 0.0% |
| Choctaw | 11 | 0.0% |
| Colombian | 292 | 0.3% |
| Costa Rican | 32 | 0.0% |
| Creek | 5 | 0.0% |
| Cuban | 48 | 0.0% |
| Czech | 171 | 0.2% |
| Czechoslovakian | 45 | 0.0% |
| Danish | 116 | 0.1% |
| Dominican | 564 | 0.5% |
| Dutch | 411 | 0.4% |
| Eastern European | 48 | 0.0% |
| Ecuadorian | 416 | 0.4% |
| Egyptian | 76 | 0.1% |
| English | 6,253 | 5.4% |
| Ethiopian | 27 | 0.0% |
| European | 1,270 | 1.1% |
| Filipino | 14 | 0.0% |
| Finnish | 56 | 0.1% |
| French | 1,661 | 1.4% |
| French Canadian | 302 | 0.3% |
| German | 6,925 | 6.0% |
| Ghanaian | 40 | 0.0% |
| Greek | 322 | 0.3% |
| Guamanian / Chamorro | 31 | 0.0% |
| Guatemalan | 1,320 | 1.1% |
| Haitian | 49 | 0.0% |
| Honduran | 699 | 0.6% |
| Houma | 10 | 0.0% |
| Hungarian | 105 | 0.1% |
| Indian (Asian) | 1,065 | 0.9% |
| Indonesian | 72 | 0.1% |
| Inupiat | 7 | 0.0% |
| Iranian | 24 | 0.0% |
| Iraqi | 14 | 0.0% |
| Irish | 6,295 | 5.4% |
| Iroquois | 7 | 0.0% |
| Italian | 2,734 | 2.4% |
| Jamaican | 304 | 0.3% |
| Kenyan | 179 | 0.2% |
| Korean | 1,431 | 1.2% |
| Laotian | 5 | 0.0% |
| Latvian | 15 | 0.0% |
| Lebanese | 121 | 0.1% |
| Lithuanian | 46 | 0.0% |
| Lumbee | 9 | 0.0% |
| Mexican | 6,655 | 5.8% |
| Mexican American Indian | 67 | 0.1% |
| Native Hawaiian | 93 | 0.1% |
| Navajo | 6 | 0.0% |
| Northern European | 18 | 0.0% |
| Norwegian | 406 | 0.4% |
| Osage | 60 | 0.1% |
| Pakistani | 32 | 0.0% |
| Panamanian | 51 | 0.0% |
| Pennsylvania German | 17 | 0.0% |
| Peruvian | 36 | 0.0% |
| Polish | 1,111 | 1.0% |
| Portuguese | 579 | 0.5% |
| Puerto Rican | 722 | 0.6% |
| Romanian | 40 | 0.0% |
| Russian | 347 | 0.3% |
| Salvadoran | 138 | 0.1% |
| Samoan | 9 | 0.0% |
| Scandinavian | 178 | 0.2% |
| Scotch-Irish | 923 | 0.8% |
| Scottish | 1,220 | 1.1% |
| Serbian | 48 | 0.0% |
| Sioux | 11 | 0.0% |
| Slavic | 6 | 0.0% |
| Slovak | 31 | 0.0% |
| South American | 1,032 | 0.9% |
| Spaniard | 184 | 0.2% |
| Spanish | 54 | 0.1% |
| Sri Lankan | 932 | 0.8% |
| Subsaharan African | 2,089 | 1.8% |
| Swedish | 230 | 0.2% |
| Swiss | 200 | 0.2% |
| Thai | 683 | 0.6% |
| Trinidadian and Tobagonian | 246 | 0.2% |
| Turkish | 7 | 0.0% |
| U.S. Virgin Islander | 33 | 0.0% |
| Ukrainian | 59 | 0.1% |
| Venezuelan | 272 | 0.2% |
| Vietnamese | 106 | 0.1% |
| Welsh | 264 | 0.2% |
| West Indian | 10 | 0.0% | View All 107 Rows |
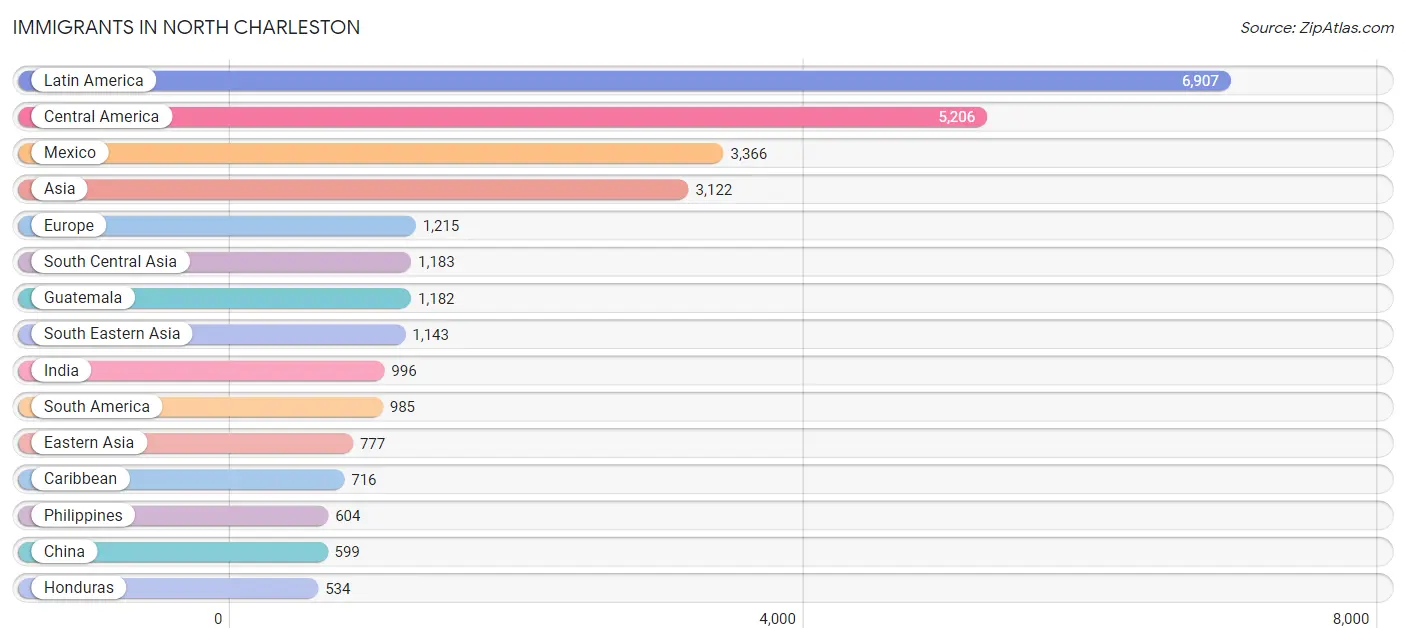
Immigrants in North Charleston
The most numerous immigrant groups reported in North Charleston came from Latin America (6,907 | 6.0%), Central America (5,206 | 4.5%), Mexico (3,366 | 2.9%), Asia (3,122 | 2.7%), and Europe (1,215 | 1.1%), together accounting for 17.1% of all North Charleston residents.
| Immigration Origin | # Population | % Population |
| Africa | 420 | 0.4% |
| Asia | 3,122 | 2.7% |
| Austria | 12 | 0.0% |
| Bahamas | 32 | 0.0% |
| Bangladesh | 61 | 0.1% |
| Belarus | 12 | 0.0% |
| Brazil | 372 | 0.3% |
| Canada | 316 | 0.3% |
| Caribbean | 716 | 0.6% |
| Central America | 5,206 | 4.5% |
| China | 599 | 0.5% |
| Colombia | 165 | 0.1% |
| Costa Rica | 22 | 0.0% |
| Cuba | 202 | 0.2% |
| Denmark | 6 | 0.0% |
| Dominican Republic | 183 | 0.2% |
| Eastern Africa | 155 | 0.1% |
| Eastern Asia | 777 | 0.7% |
| Eastern Europe | 180 | 0.2% |
| Ecuador | 253 | 0.2% |
| Egypt | 90 | 0.1% |
| El Salvador | 91 | 0.1% |
| England | 154 | 0.1% |
| Ethiopia | 28 | 0.0% |
| Europe | 1,215 | 1.1% |
| France | 25 | 0.0% |
| Germany | 200 | 0.2% |
| Ghana | 40 | 0.0% |
| Greece | 71 | 0.1% |
| Guatemala | 1,182 | 1.0% |
| Guyana | 44 | 0.0% |
| Haiti | 31 | 0.0% |
| Honduras | 534 | 0.5% |
| Hong Kong | 204 | 0.2% |
| India | 996 | 0.9% |
| Iraq | 8 | 0.0% |
| Ireland | 79 | 0.1% |
| Italy | 60 | 0.1% |
| Jamaica | 212 | 0.2% |
| Japan | 62 | 0.1% |
| Kazakhstan | 16 | 0.0% |
| Kenya | 127 | 0.1% |
| Korea | 116 | 0.1% |
| Latin America | 6,907 | 6.0% |
| Mexico | 3,366 | 2.9% |
| Micronesia | 186 | 0.2% |
| Nepal | 58 | 0.1% |
| Netherlands | 18 | 0.0% |
| Nigeria | 26 | 0.0% |
| Northern Africa | 90 | 0.1% |
| Northern Europe | 385 | 0.3% |
| Oceania | 186 | 0.2% |
| Panama | 11 | 0.0% |
| Peru | 19 | 0.0% |
| Philippines | 604 | 0.5% |
| Portugal | 264 | 0.2% |
| Russia | 119 | 0.1% |
| Saudi Arabia | 11 | 0.0% |
| Scotland | 119 | 0.1% |
| Serbia | 16 | 0.0% |
| South America | 985 | 0.9% |
| South Central Asia | 1,183 | 1.0% |
| South Eastern Asia | 1,143 | 1.0% |
| Southern Europe | 395 | 0.3% |
| Sri Lanka | 1 | 0.0% |
| Sweden | 18 | 0.0% |
| Taiwan | 6 | 0.0% |
| Thailand | 35 | 0.0% |
| Trinidad and Tobago | 56 | 0.1% |
| Ukraine | 33 | 0.0% |
| Uzbekistan | 51 | 0.0% |
| Venezuela | 132 | 0.1% |
| Vietnam | 455 | 0.4% |
| Western Africa | 66 | 0.1% |
| Western Asia | 19 | 0.0% |
| Western Europe | 255 | 0.2% | View All 76 Rows |
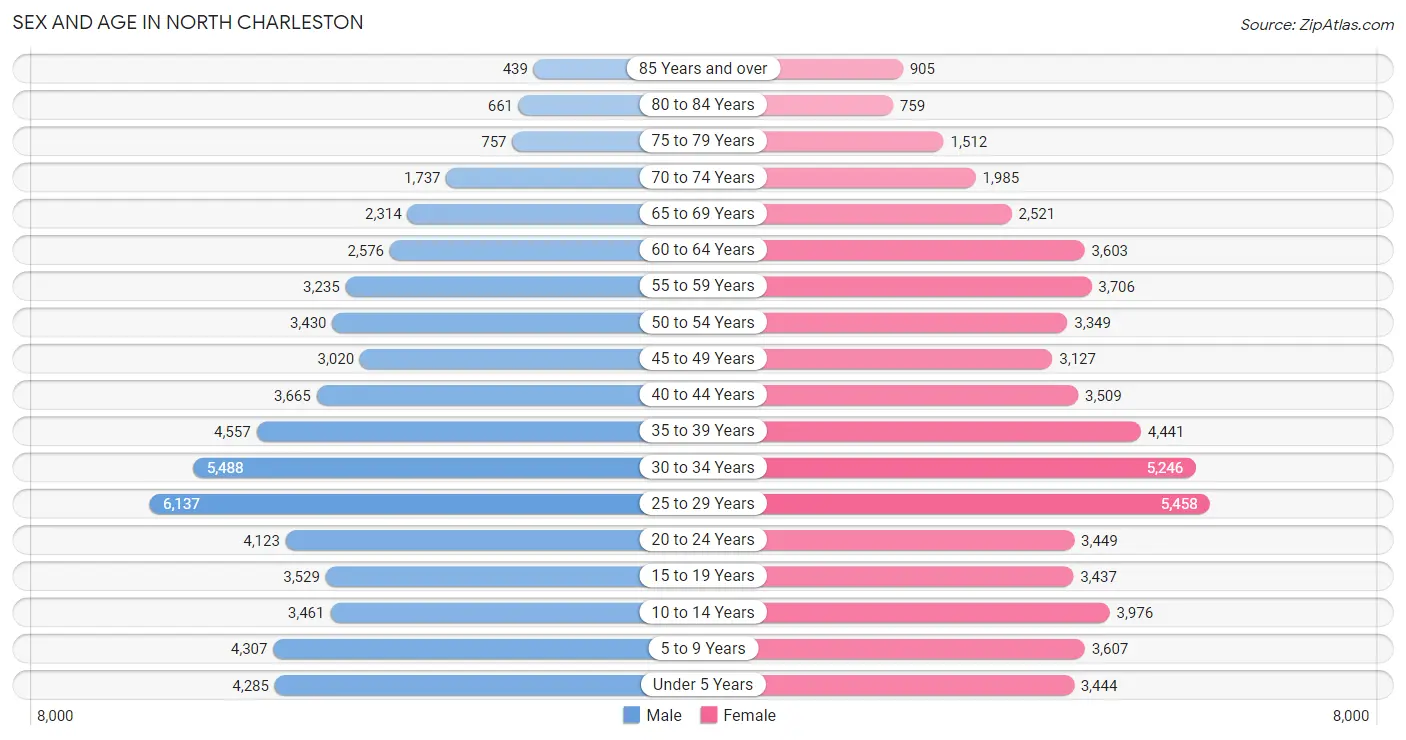
Sex and Age in North Charleston
Sex and Age in North Charleston
The most populous age groups in North Charleston are 25 to 29 Years (6,137 | 10.6%) for men and 25 to 29 Years (5,458 | 9.4%) for women.
| Age Bracket | Male | Female |
| Under 5 Years | 4,285 (7.4%) | 3,444 (5.9%) |
| 5 to 9 Years | 4,307 (7.5%) | 3,607 (6.2%) |
| 10 to 14 Years | 3,461 (6.0%) | 3,976 (6.9%) |
| 15 to 19 Years | 3,529 (6.1%) | 3,437 (5.9%) |
| 20 to 24 Years | 4,123 (7.1%) | 3,449 (5.9%) |
| 25 to 29 Years | 6,137 (10.6%) | 5,458 (9.4%) |
| 30 to 34 Years | 5,488 (9.5%) | 5,246 (9.0%) |
| 35 to 39 Years | 4,557 (7.9%) | 4,441 (7.6%) |
| 40 to 44 Years | 3,665 (6.4%) | 3,509 (6.0%) |
| 45 to 49 Years | 3,020 (5.2%) | 3,127 (5.4%) |
| 50 to 54 Years | 3,430 (5.9%) | 3,349 (5.8%) |
| 55 to 59 Years | 3,235 (5.6%) | 3,706 (6.4%) |
| 60 to 64 Years | 2,576 (4.5%) | 3,603 (6.2%) |
| 65 to 69 Years | 2,314 (4.0%) | 2,521 (4.3%) |
| 70 to 74 Years | 1,737 (3.0%) | 1,985 (3.4%) |
| 75 to 79 Years | 757 (1.3%) | 1,512 (2.6%) |
| 80 to 84 Years | 661 (1.1%) | 759 (1.3%) |
| 85 Years and over | 439 (0.8%) | 905 (1.6%) |
| Total | 57,721 (100.0%) | 58,034 (100.0%) |
Families and Households in North Charleston
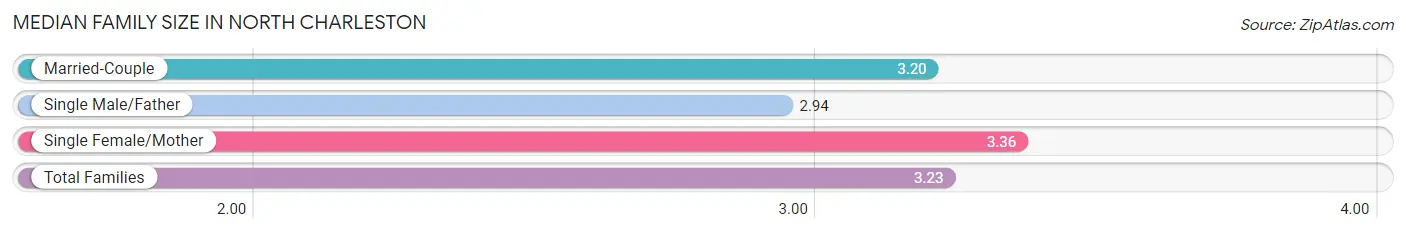
Median Family Size in North Charleston
The median family size in North Charleston is 3.23 persons per family, with single female/mother families (7,854 | 30.9%) accounting for the largest median family size of 3.36 persons per family. On the other hand, single male/father families (2,195 | 8.6%) represent the smallest median family size with 2.94 persons per family.
| Family Type | # Families | Family Size |
| Married-Couple | 15,373 (60.5%) | 3.20 |
| Single Male/Father | 2,195 (8.6%) | 2.94 |
| Single Female/Mother | 7,854 (30.9%) | 3.36 |
| Total Families | 25,422 (100.0%) | 3.23 |
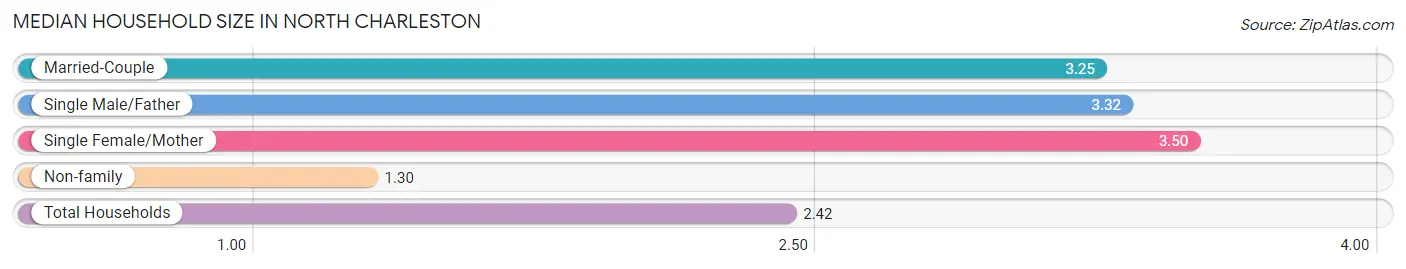
Median Household Size in North Charleston
The median household size in North Charleston is 2.42 persons per household, with single female/mother households (7,854 | 17.1%) accounting for the largest median household size of 3.5 persons per household. non-family households (20,495 | 44.6%) represent the smallest median household size with 1.30 persons per household.
| Household Type | # Households | Household Size |
| Married-Couple | 15,373 (33.5%) | 3.25 |
| Single Male/Father | 2,195 (4.8%) | 3.32 |
| Single Female/Mother | 7,854 (17.1%) | 3.50 |
| Non-family | 20,495 (44.6%) | 1.30 |
| Total Households | 45,917 (100.0%) | 2.42 |
Household Size by Marriage Status in North Charleston
Out of a total of 45,917 households in North Charleston, 25,422 (55.4%) are family households, while 20,495 (44.6%) are nonfamily households. The most numerous type of family households are 2-person households, comprising 11,654, and the most common type of nonfamily households are 1-person households, comprising 16,911.
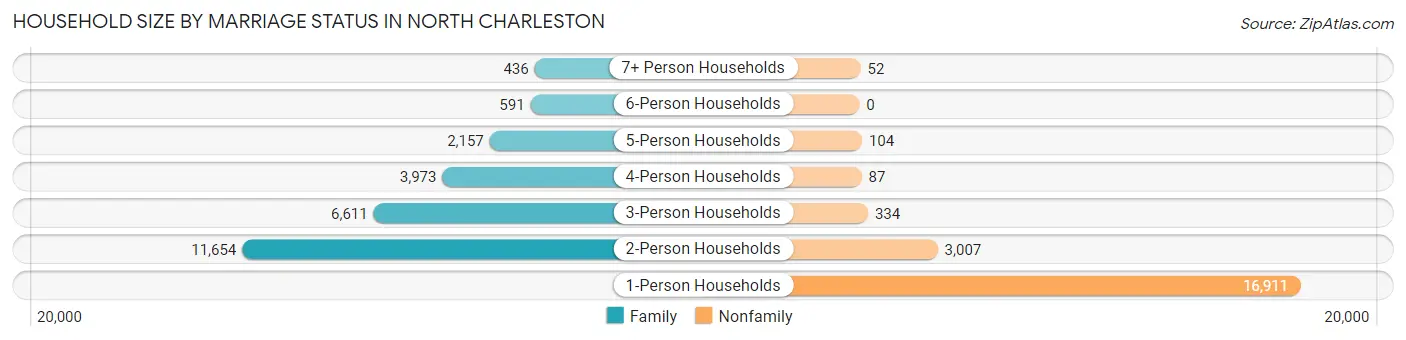
| Household Size | Family Households | Nonfamily Households |
| 1-Person Households | - | 16,911 (36.8%) |
| 2-Person Households | 11,654 (25.4%) | 3,007 (6.6%) |
| 3-Person Households | 6,611 (14.4%) | 334 (0.7%) |
| 4-Person Households | 3,973 (8.6%) | 87 (0.2%) |
| 5-Person Households | 2,157 (4.7%) | 104 (0.2%) |
| 6-Person Households | 591 (1.3%) | 0 (0.0%) |
| 7+ Person Households | 436 (0.9%) | 52 (0.1%) |
| Total | 25,422 (55.4%) | 20,495 (44.6%) |
Female Fertility in North Charleston
Fertility by Age in North Charleston
Average fertility rate in North Charleston is 69.0 births per 1,000 women. Women in the age bracket of 20 to 34 years have the highest fertility rate with 99.0 births per 1,000 women. Women in the age bracket of 20 to 34 years acount for 69.7% of all women with births.
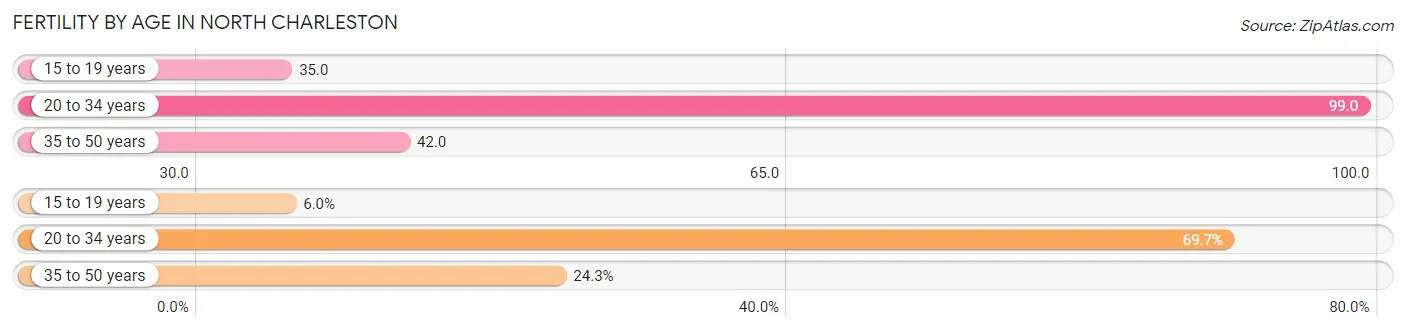
| Age Bracket | Women with Births | Births / 1,000 Women |
| 15 to 19 years | 121 (6.0%) | 35.0 |
| 20 to 34 years | 1,407 (69.7%) | 99.0 |
| 35 to 50 years | 491 (24.3%) | 42.0 |
| Total | 2,019 (100.0%) | 69.0 |
Fertility by Age by Marriage Status in North Charleston
50.3% of women with births (2,019) in North Charleston are married. The highest percentage of unmarried women with births falls into 35 to 50 years age bracket with 50.9% of them unmarried at the time of birth, while the lowest percentage of unmarried women with births belong to 15 to 19 years age bracket with 33.1% of them unmarried.
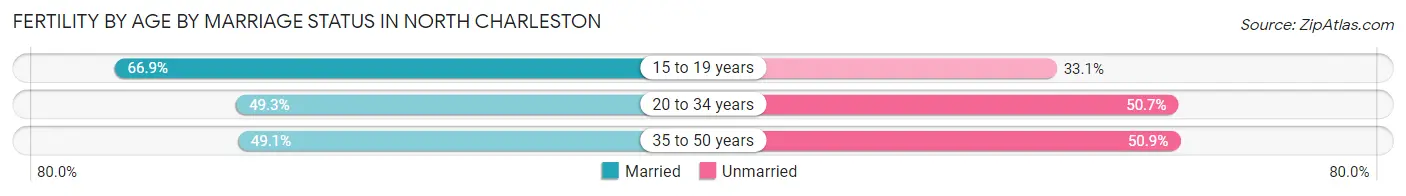
| Age Bracket | Married | Unmarried |
| 15 to 19 years | 81 (66.9%) | 40 (33.1%) |
| 20 to 34 years | 694 (49.3%) | 713 (50.7%) |
| 35 to 50 years | 241 (49.1%) | 250 (50.9%) |
| Total | 1,016 (50.3%) | 1,003 (49.7%) |
Fertility by Education in North Charleston
Average fertility rate in North Charleston is 69.0 births per 1,000 women. Women with the education attainment of graduate degree have the highest fertility rate of 96.0 births per 1,000 women, while women with the education attainment of bachelor's degree have the lowest fertility at 44.0 births per 1,000 women. Women with the education attainment of college or associate's degree represent 40.6% of all women with births.
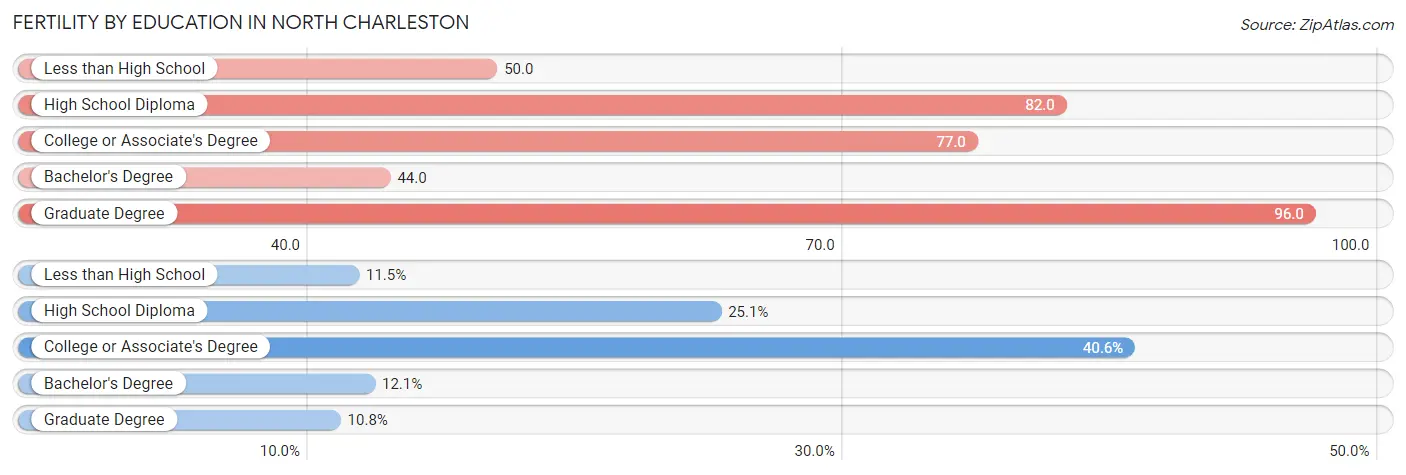
| Educational Attainment | Women with Births | Births / 1,000 Women |
| Less than High School | 232 (11.5%) | 50.0 |
| High School Diploma | 506 (25.1%) | 82.0 |
| College or Associate's Degree | 819 (40.6%) | 77.0 |
| Bachelor's Degree | 244 (12.1%) | 44.0 |
| Graduate Degree | 218 (10.8%) | 96.0 |
| Total | 2,019 (100.0%) | 69.0 |
Fertility by Education by Marriage Status in North Charleston
49.7% of women with births in North Charleston are unmarried. Women with the educational attainment of graduate degree are most likely to be married with 100.0% of them married at childbirth, while women with the educational attainment of less than high school are least likely to be married with 63.4% of them unmarried at childbirth.
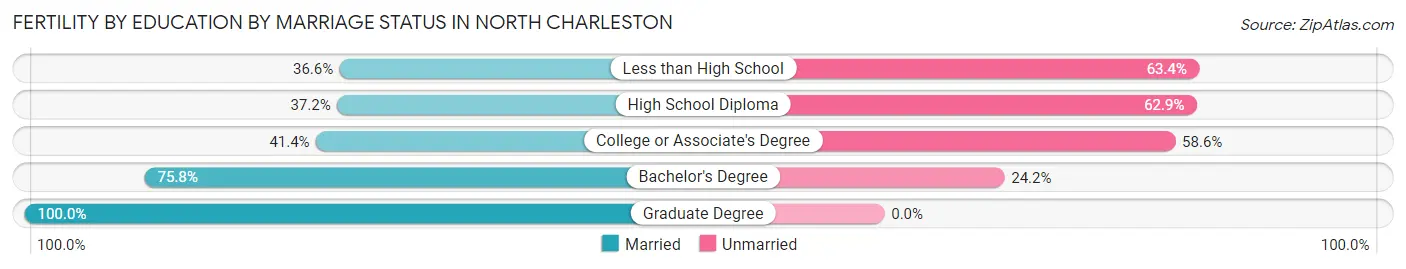
| Educational Attainment | Married | Unmarried |
| Less than High School | 85 (36.6%) | 147 (63.4%) |
| High School Diploma | 188 (37.1%) | 318 (62.8%) |
| College or Associate's Degree | 339 (41.4%) | 480 (58.6%) |
| Bachelor's Degree | 185 (75.8%) | 59 (24.2%) |
| Graduate Degree | 218 (100.0%) | 0 (0.0%) |
| Total | 1,016 (50.3%) | 1,003 (49.7%) |
Employment Characteristics in North Charleston
Employment by Class of Employer in North Charleston
Among the 58,940 employed individuals in North Charleston, private company employees (38,756 | 65.8%), federal government employees (5,852 | 9.9%), and local government employees (3,848 | 6.5%) make up the most common classes of employment.
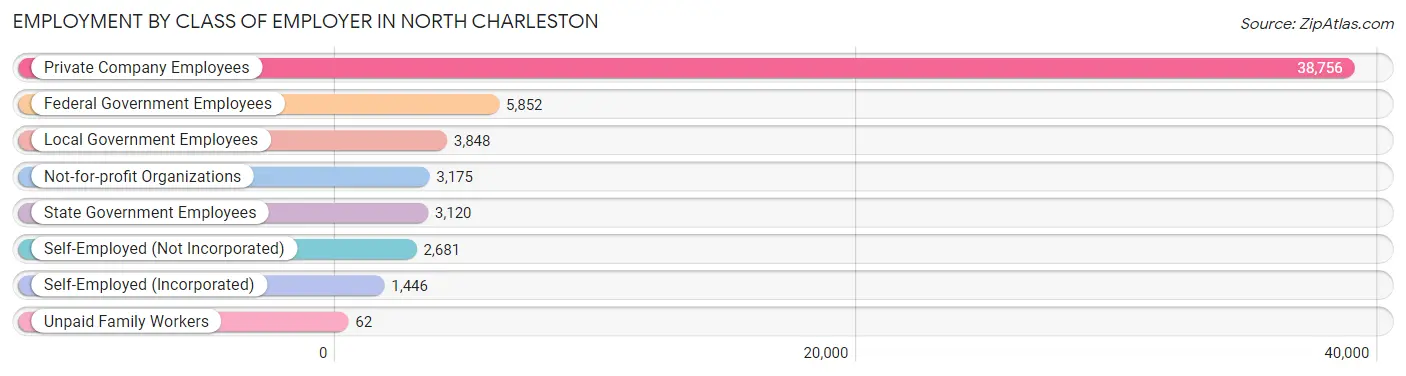
| Employer Class | # Employees | % Employees |
| Private Company Employees | 38,756 | 65.8% |
| Self-Employed (Incorporated) | 1,446 | 2.5% |
| Self-Employed (Not Incorporated) | 2,681 | 4.5% |
| Not-for-profit Organizations | 3,175 | 5.4% |
| Local Government Employees | 3,848 | 6.5% |
| State Government Employees | 3,120 | 5.3% |
| Federal Government Employees | 5,852 | 9.9% |
| Unpaid Family Workers | 62 | 0.1% |
| Total | 58,940 | 100.0% |
Employment Status by Age in North Charleston
According to the labor force statistics for North Charleston, out of the total population over 16 years of age (91,267), 69.0% or 62,974 individuals are in the labor force, with 4.3% or 2,708 of them unemployed. The age group with the highest labor force participation rate is 30 to 34 years, with 85.7% or 9,199 individuals in the labor force. Within the labor force, the 16 to 19 years age range has the highest percentage of unemployed individuals, with 10.1% or 230 of them being unemployed.
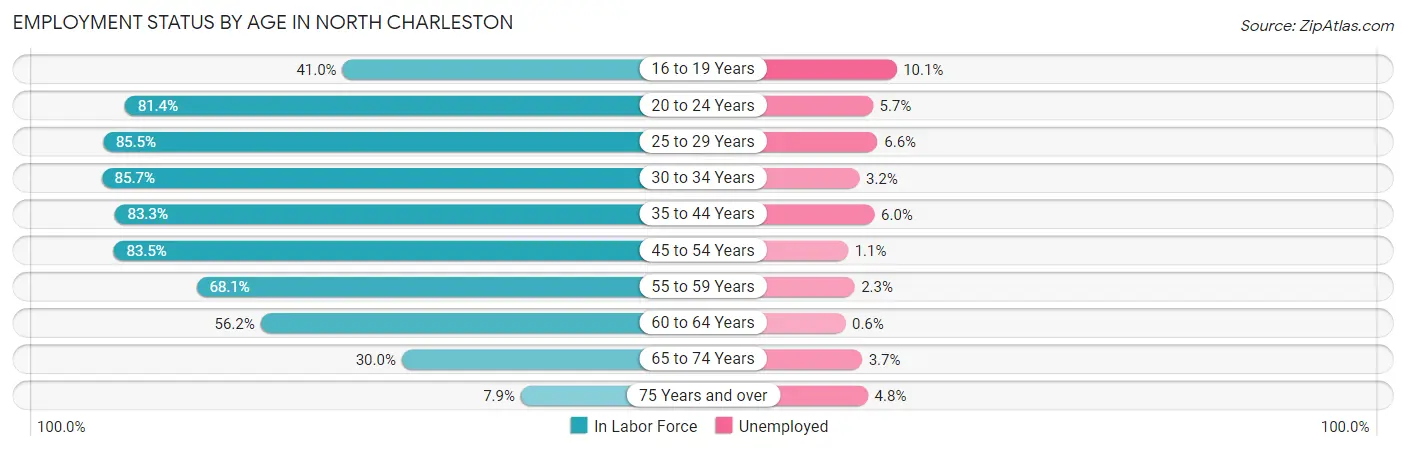
| Age Bracket | In Labor Force | Unemployed |
| 16 to 19 Years | 2,279 (41.0%) | 230 (10.1%) |
| 20 to 24 Years | 6,164 (81.4%) | 351 (5.7%) |
| 25 to 29 Years | 9,914 (85.5%) | 654 (6.6%) |
| 30 to 34 Years | 9,199 (85.7%) | 294 (3.2%) |
| 35 to 44 Years | 13,471 (83.3%) | 808 (6.0%) |
| 45 to 54 Years | 10,793 (83.5%) | 119 (1.1%) |
| 55 to 59 Years | 4,727 (68.1%) | 109 (2.3%) |
| 60 to 64 Years | 3,473 (56.2%) | 21 (0.6%) |
| 65 to 74 Years | 2,567 (30.0%) | 95 (3.7%) |
| 75 Years and over | 398 (7.9%) | 19 (4.8%) |
| Total | 62,974 (69.0%) | 2,708 (4.3%) |
Employment Status by Educational Attainment in North Charleston
According to labor force statistics for North Charleston, 79.9% of individuals (51,573) out of the total population between 25 and 64 years of age (64,547) are in the labor force, with 3.9% or 2,011 of them being unemployed. The group with the highest labor force participation rate are those with the educational attainment of bachelor's degree or higher, with 89.3% or 15,694 individuals in the labor force. Within the labor force, individuals with less than high school education have the highest percentage of unemployment, with 8.2% or 434 of them being unemployed.
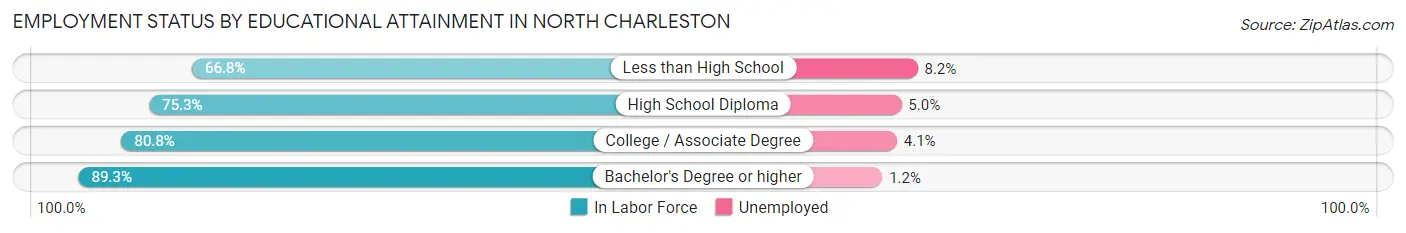
| Educational Attainment | In Labor Force | Unemployed |
| Less than High School | 5,289 (66.8%) | 649 (8.2%) |
| High School Diploma | 13,058 (75.3%) | 867 (5.0%) |
| College / Associate Degree | 17,545 (80.8%) | 890 (4.1%) |
| Bachelor's Degree or higher | 15,694 (89.3%) | 211 (1.2%) |
| Total | 51,573 (79.9%) | 2,517 (3.9%) |
Employment Occupations by Sex in North Charleston
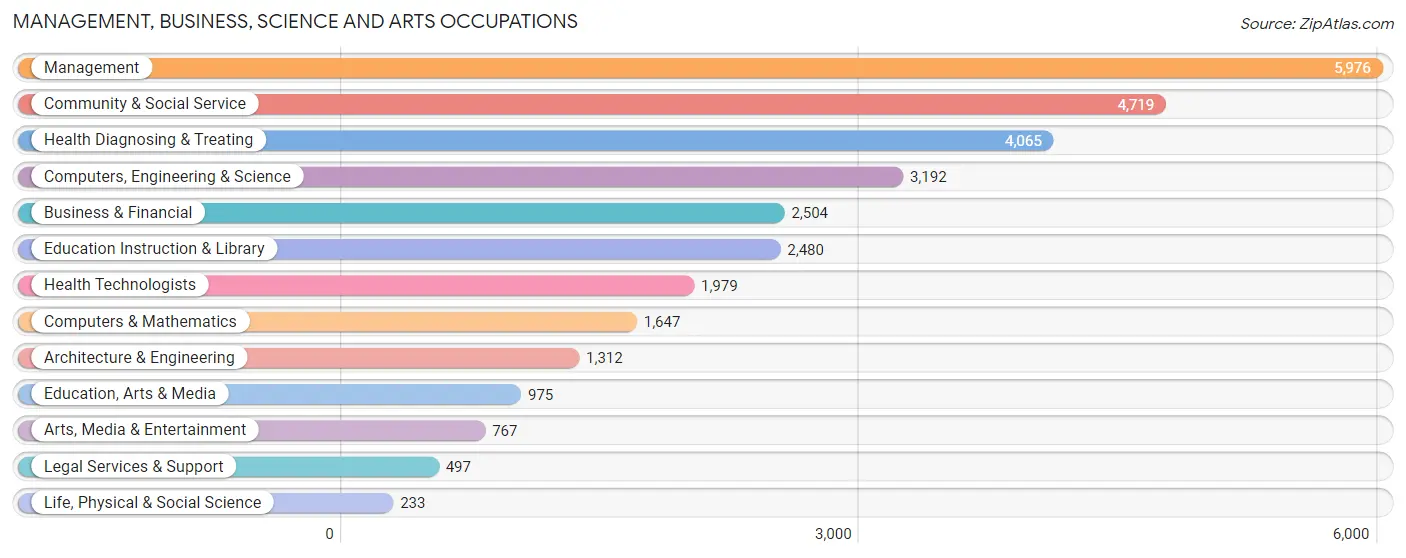
Management, Business, Science and Arts Occupations
The most common Management, Business, Science and Arts occupations in North Charleston are Management (5,976 | 10.4%), Community & Social Service (4,719 | 8.2%), Health Diagnosing & Treating (4,065 | 7.1%), Computers, Engineering & Science (3,192 | 5.6%), and Business & Financial (2,504 | 4.3%).
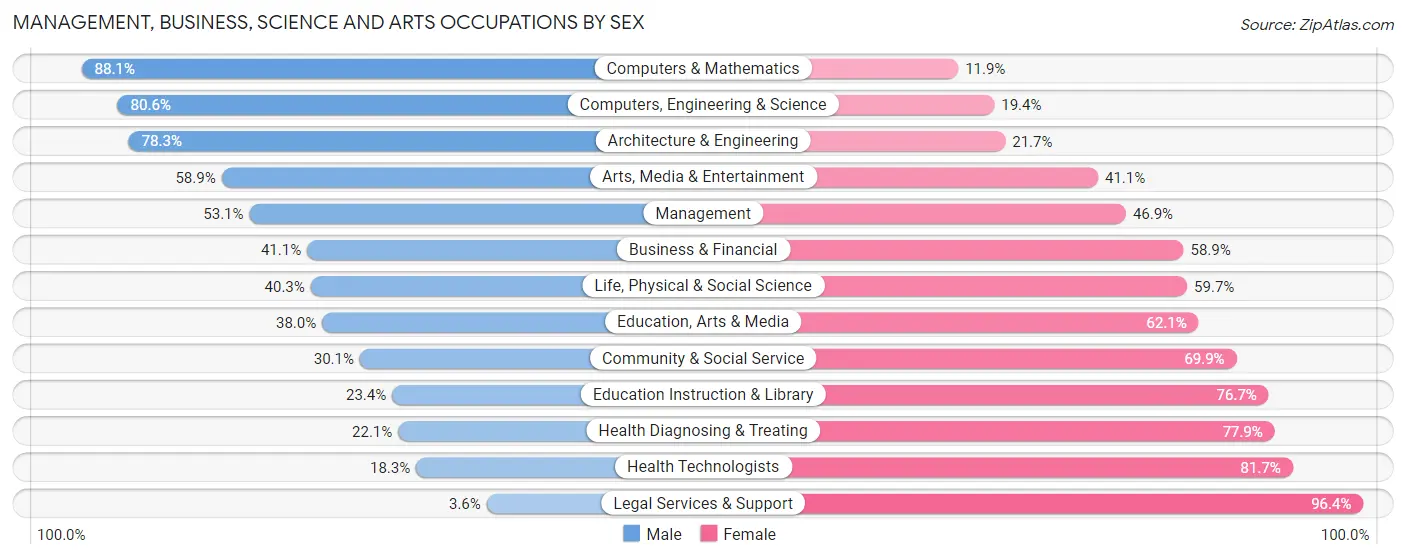
Management, Business, Science and Arts Occupations by Sex
Within the Management, Business, Science and Arts occupations in North Charleston, the most male-oriented occupations are Computers & Mathematics (88.1%), Computers, Engineering & Science (80.6%), and Architecture & Engineering (78.3%), while the most female-oriented occupations are Legal Services & Support (96.4%), Health Technologists (81.7%), and Health Diagnosing & Treating (77.9%).
| Occupation | Male | Female |
| Management | 3,174 (53.1%) | 2,802 (46.9%) |
| Business & Financial | 1,029 (41.1%) | 1,475 (58.9%) |
| Computers, Engineering & Science | 2,572 (80.6%) | 620 (19.4%) |
| Computers & Mathematics | 1,451 (88.1%) | 196 (11.9%) |
| Architecture & Engineering | 1,027 (78.3%) | 285 (21.7%) |
| Life, Physical & Social Science | 94 (40.3%) | 139 (59.7%) |
| Community & Social Service | 1,419 (30.1%) | 3,300 (69.9%) |
| Education, Arts & Media | 370 (38.0%) | 605 (62.1%) |
| Legal Services & Support | 18 (3.6%) | 479 (96.4%) |
| Education Instruction & Library | 579 (23.4%) | 1,901 (76.6%) |
| Arts, Media & Entertainment | 452 (58.9%) | 315 (41.1%) |
| Health Diagnosing & Treating | 898 (22.1%) | 3,167 (77.9%) |
| Health Technologists | 363 (18.3%) | 1,616 (81.7%) |
| Total (Category) | 9,092 (44.5%) | 11,364 (55.5%) |
| Total (Overall) | 29,873 (51.9%) | 27,691 (48.1%) |
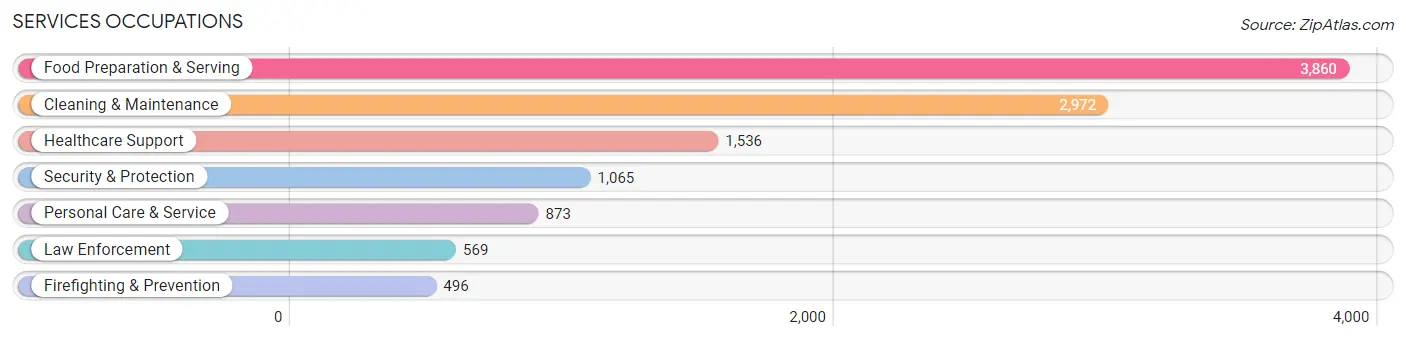
Services Occupations
The most common Services occupations in North Charleston are Food Preparation & Serving (3,860 | 6.7%), Cleaning & Maintenance (2,972 | 5.2%), Healthcare Support (1,536 | 2.7%), Security & Protection (1,065 | 1.8%), and Personal Care & Service (873 | 1.5%).
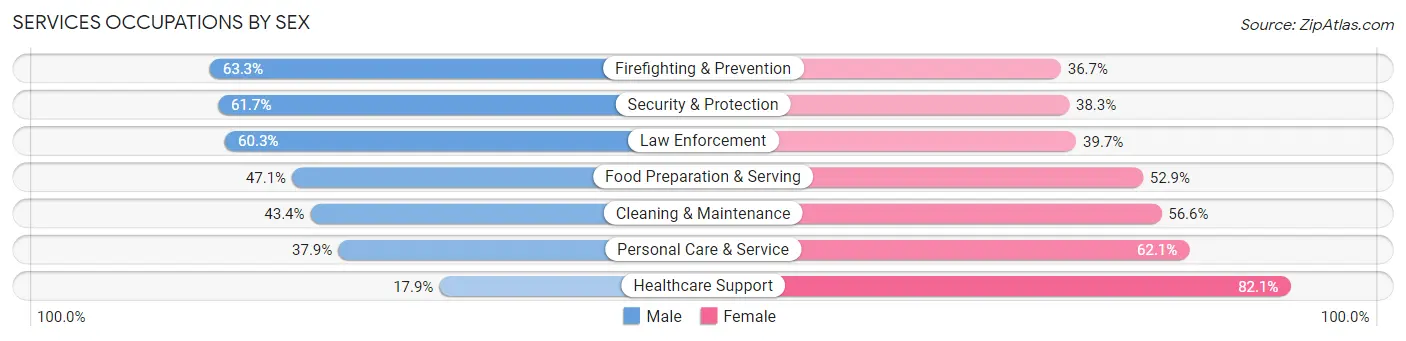
Services Occupations by Sex
Within the Services occupations in North Charleston, the most male-oriented occupations are Firefighting & Prevention (63.3%), Security & Protection (61.7%), and Law Enforcement (60.3%), while the most female-oriented occupations are Healthcare Support (82.1%), Personal Care & Service (62.1%), and Cleaning & Maintenance (56.6%).
| Occupation | Male | Female |
| Healthcare Support | 275 (17.9%) | 1,261 (82.1%) |
| Security & Protection | 657 (61.7%) | 408 (38.3%) |
| Firefighting & Prevention | 314 (63.3%) | 182 (36.7%) |
| Law Enforcement | 343 (60.3%) | 226 (39.7%) |
| Food Preparation & Serving | 1,817 (47.1%) | 2,043 (52.9%) |
| Cleaning & Maintenance | 1,290 (43.4%) | 1,682 (56.6%) |
| Personal Care & Service | 331 (37.9%) | 542 (62.1%) |
| Total (Category) | 4,370 (42.4%) | 5,936 (57.6%) |
| Total (Overall) | 29,873 (51.9%) | 27,691 (48.1%) |
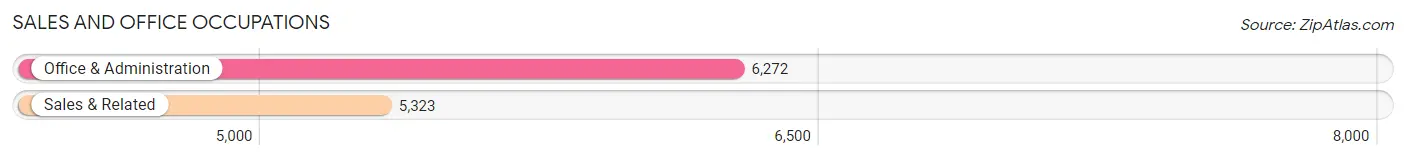
Sales and Office Occupations
The most common Sales and Office occupations in North Charleston are Office & Administration (6,272 | 10.9%), and Sales & Related (5,323 | 9.2%).
Sales and Office Occupations by Sex
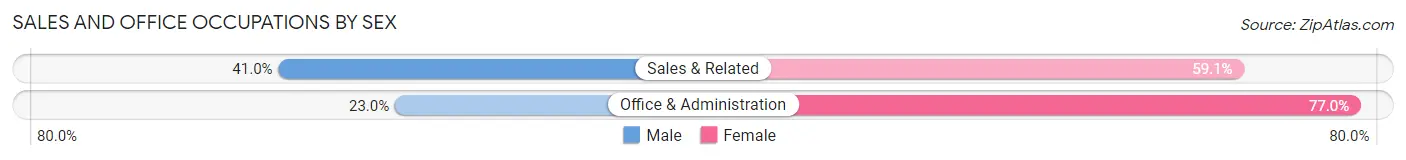
| Occupation | Male | Female |
| Sales & Related | 2,180 (40.9%) | 3,143 (59.1%) |
| Office & Administration | 1,443 (23.0%) | 4,829 (77.0%) |
| Total (Category) | 3,623 (31.2%) | 7,972 (68.8%) |
| Total (Overall) | 29,873 (51.9%) | 27,691 (48.1%) |
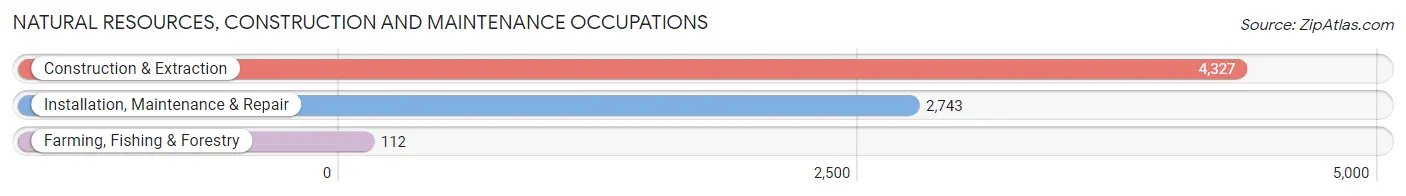
Natural Resources, Construction and Maintenance Occupations
The most common Natural Resources, Construction and Maintenance occupations in North Charleston are Construction & Extraction (4,327 | 7.5%), Installation, Maintenance & Repair (2,743 | 4.8%), and Farming, Fishing & Forestry (112 | 0.2%).
Natural Resources, Construction and Maintenance Occupations by Sex
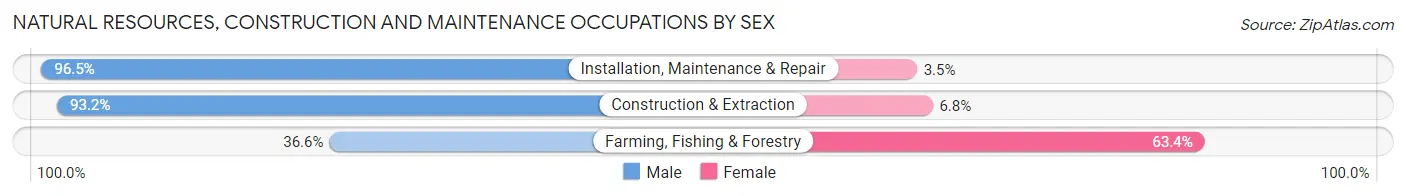
| Occupation | Male | Female |
| Farming, Fishing & Forestry | 41 (36.6%) | 71 (63.4%) |
| Construction & Extraction | 4,034 (93.2%) | 293 (6.8%) |
| Installation, Maintenance & Repair | 2,647 (96.5%) | 96 (3.5%) |
| Total (Category) | 6,722 (93.6%) | 460 (6.4%) |
| Total (Overall) | 29,873 (51.9%) | 27,691 (48.1%) |
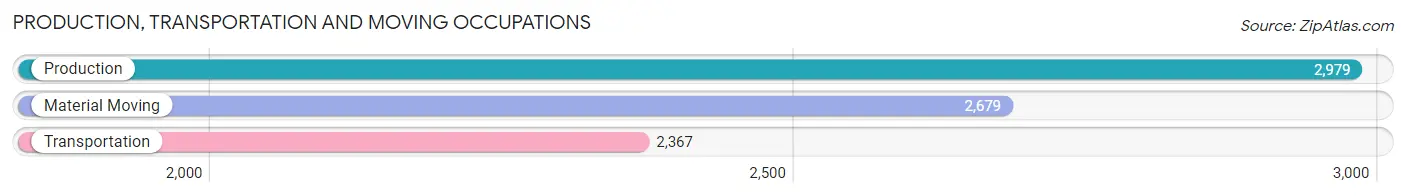
Production, Transportation and Moving Occupations
The most common Production, Transportation and Moving occupations in North Charleston are Production (2,979 | 5.2%), Material Moving (2,679 | 4.6%), and Transportation (2,367 | 4.1%).
Production, Transportation and Moving Occupations by Sex
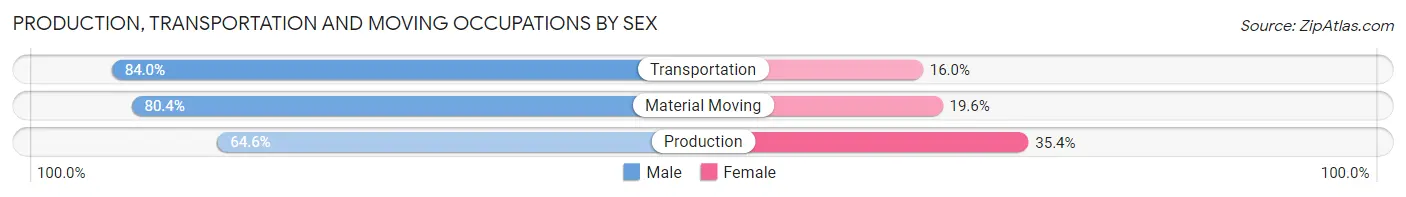
| Occupation | Male | Female |
| Production | 1,925 (64.6%) | 1,054 (35.4%) |
| Transportation | 1,988 (84.0%) | 379 (16.0%) |
| Material Moving | 2,153 (80.4%) | 526 (19.6%) |
| Total (Category) | 6,066 (75.6%) | 1,959 (24.4%) |
| Total (Overall) | 29,873 (51.9%) | 27,691 (48.1%) |
Employment Industries by Sex in North Charleston
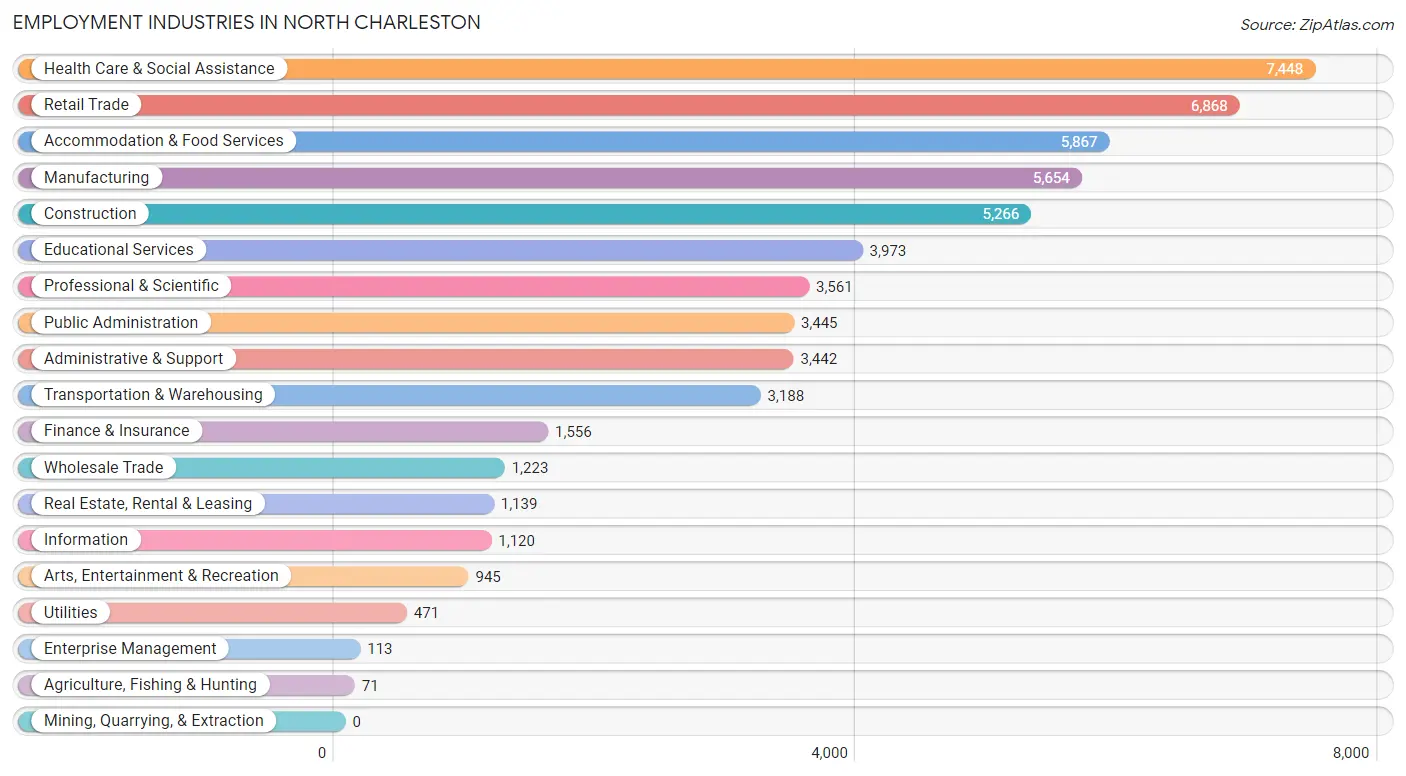
Employment Industries in North Charleston
The major employment industries in North Charleston include Health Care & Social Assistance (7,448 | 12.9%), Retail Trade (6,868 | 11.9%), Accommodation & Food Services (5,867 | 10.2%), Manufacturing (5,654 | 9.8%), and Construction (5,266 | 9.1%).
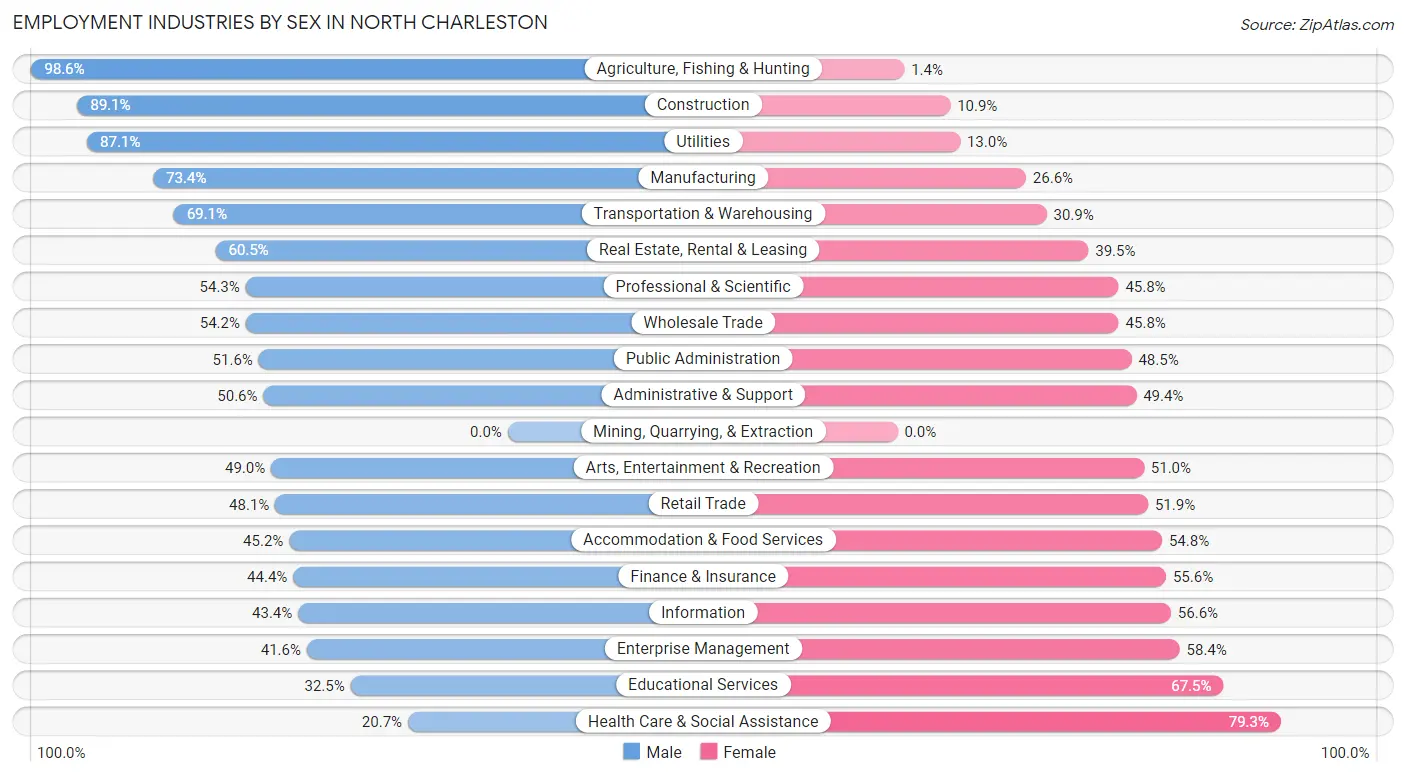
Employment Industries by Sex in North Charleston
The North Charleston industries that see more men than women are Agriculture, Fishing & Hunting (98.6%), Construction (89.1%), and Utilities (87.1%), whereas the industries that tend to have a higher number of women are Health Care & Social Assistance (79.3%), Educational Services (67.5%), and Enterprise Management (58.4%).
| Industry | Male | Female |
| Agriculture, Fishing & Hunting | 70 (98.6%) | 1 (1.4%) |
| Mining, Quarrying, & Extraction | 0 (0.0%) | 0 (0.0%) |
| Construction | 4,691 (89.1%) | 575 (10.9%) |
| Manufacturing | 4,150 (73.4%) | 1,504 (26.6%) |
| Wholesale Trade | 663 (54.2%) | 560 (45.8%) |
| Retail Trade | 3,306 (48.1%) | 3,562 (51.9%) |
| Transportation & Warehousing | 2,204 (69.1%) | 984 (30.9%) |
| Utilities | 410 (87.1%) | 61 (13.0%) |
| Information | 486 (43.4%) | 634 (56.6%) |
| Finance & Insurance | 691 (44.4%) | 865 (55.6%) |
| Real Estate, Rental & Leasing | 689 (60.5%) | 450 (39.5%) |
| Professional & Scientific | 1,932 (54.2%) | 1,629 (45.8%) |
| Enterprise Management | 47 (41.6%) | 66 (58.4%) |
| Administrative & Support | 1,741 (50.6%) | 1,701 (49.4%) |
| Educational Services | 1,293 (32.5%) | 2,680 (67.5%) |
| Health Care & Social Assistance | 1,539 (20.7%) | 5,909 (79.3%) |
| Arts, Entertainment & Recreation | 463 (49.0%) | 482 (51.0%) |
| Accommodation & Food Services | 2,654 (45.2%) | 3,213 (54.8%) |
| Public Administration | 1,776 (51.5%) | 1,669 (48.4%) |
| Total | 29,873 (51.9%) | 27,691 (48.1%) |
Education in North Charleston
School Enrollment in North Charleston
The most common levels of schooling among the 27,602 students in North Charleston are elementary school (6,236 | 22.6%), middle school (6,002 | 21.7%), and college / undergraduate (5,426 | 19.7%).
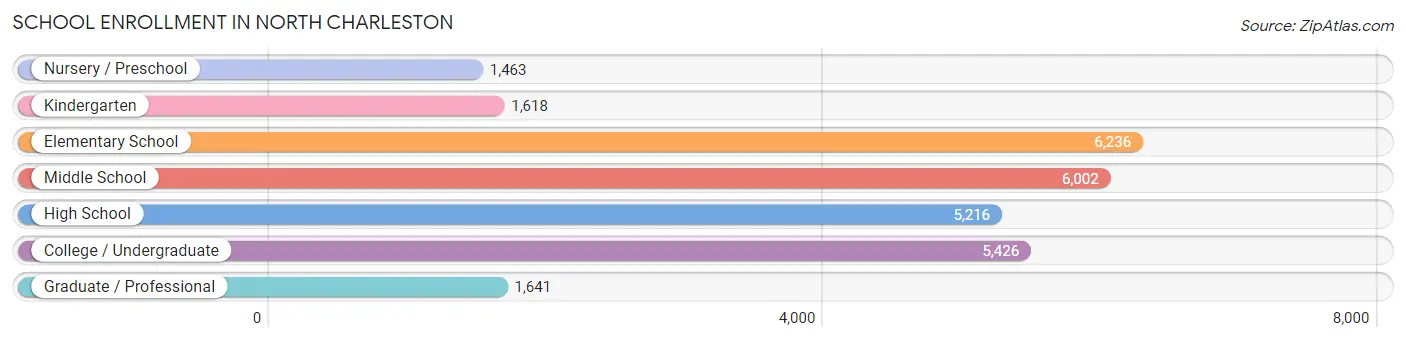
| School Level | # Students | % Students |
| Nursery / Preschool | 1,463 | 5.3% |
| Kindergarten | 1,618 | 5.9% |
| Elementary School | 6,236 | 22.6% |
| Middle School | 6,002 | 21.7% |
| High School | 5,216 | 18.9% |
| College / Undergraduate | 5,426 | 19.7% |
| Graduate / Professional | 1,641 | 5.9% |
| Total | 27,602 | 100.0% |
School Enrollment by Age by Funding Source in North Charleston
Out of a total of 27,602 students who are enrolled in schools in North Charleston, 3,975 (14.4%) attend a private institution, while the remaining 23,627 (85.6%) are enrolled in public schools. The age group of 20 to 24 year olds has the highest likelihood of being enrolled in private schools, with 565 (30.4% in the age bracket) enrolled. Conversely, the age group of 15 to 17 year olds has the lowest likelihood of being enrolled in a private school, with 3,123 (90.9% in the age bracket) attending a public institution.
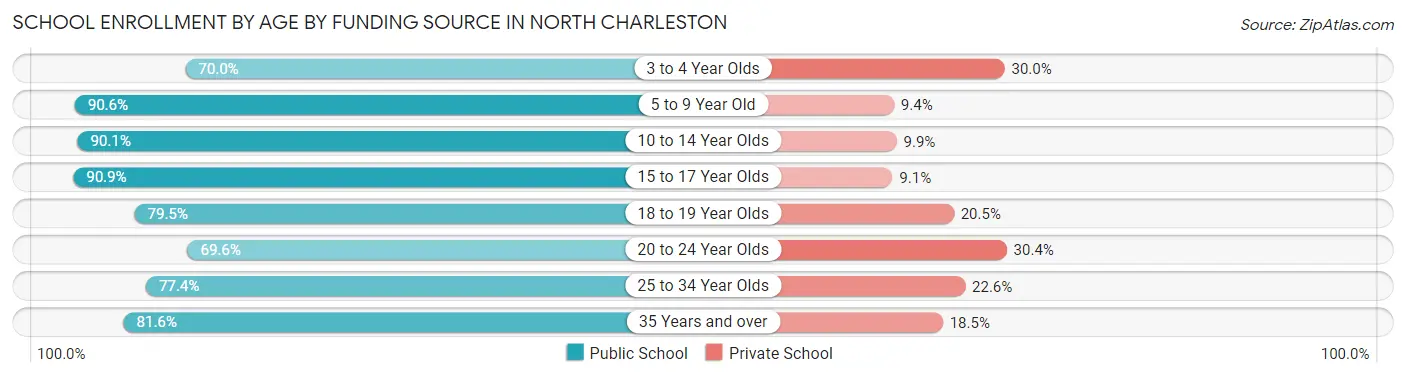
| Age Bracket | Public School | Private School |
| 3 to 4 Year Olds | 949 (70.0%) | 406 (30.0%) |
| 5 to 9 Year Old | 6,885 (90.6%) | 711 (9.4%) |
| 10 to 14 Year Olds | 6,602 (90.1%) | 722 (9.9%) |
| 15 to 17 Year Olds | 3,123 (90.9%) | 312 (9.1%) |
| 18 to 19 Year Olds | 1,613 (79.5%) | 416 (20.5%) |
| 20 to 24 Year Olds | 1,296 (69.6%) | 565 (30.4%) |
| 25 to 34 Year Olds | 2,111 (77.4%) | 617 (22.6%) |
| 35 Years and over | 1,039 (81.6%) | 235 (18.4%) |
| Total | 23,627 (85.6%) | 3,975 (14.4%) |
Educational Attainment by Field of Study in North Charleston
Business (5,090 | 23.3%), science & technology (2,483 | 11.4%), education (2,196 | 10.1%), arts & humanities (1,569 | 7.2%), and engineering (1,518 | 7.0%) are the most common fields of study among 21,822 individuals in North Charleston who have obtained a bachelor's degree or higher.
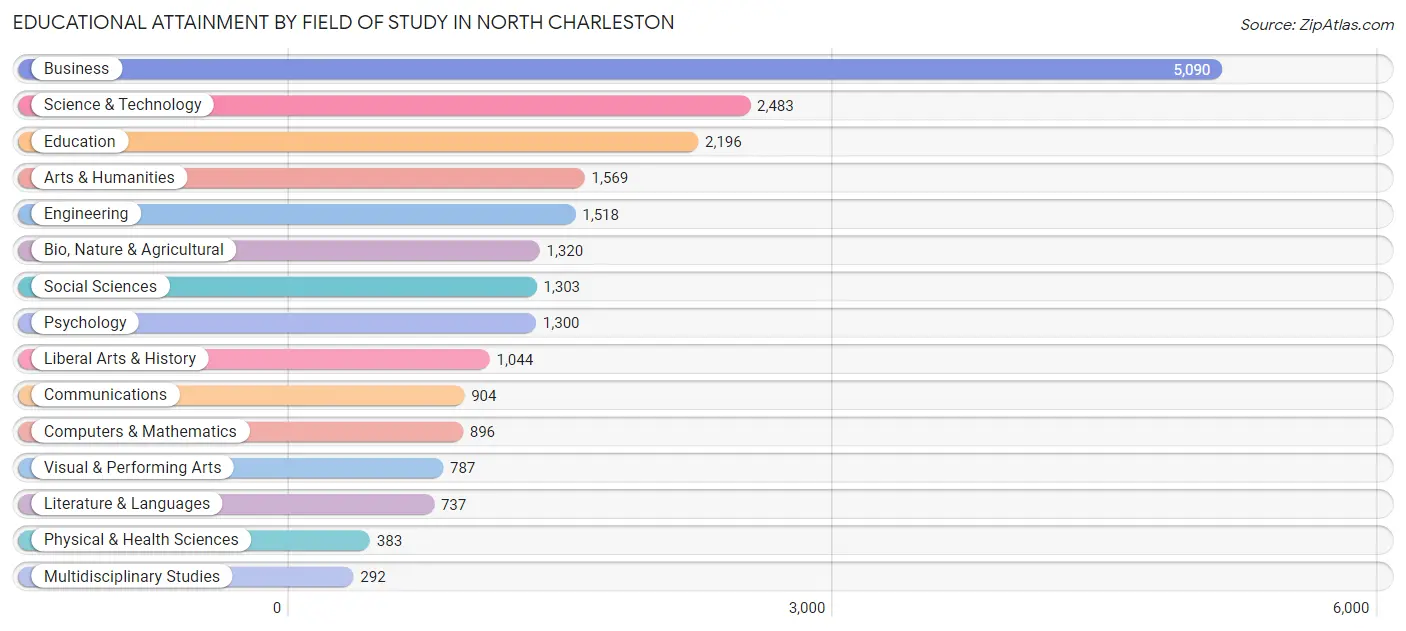
| Field of Study | # Graduates | % Graduates |
| Computers & Mathematics | 896 | 4.1% |
| Bio, Nature & Agricultural | 1,320 | 6.0% |
| Physical & Health Sciences | 383 | 1.8% |
| Psychology | 1,300 | 6.0% |
| Social Sciences | 1,303 | 6.0% |
| Engineering | 1,518 | 7.0% |
| Multidisciplinary Studies | 292 | 1.3% |
| Science & Technology | 2,483 | 11.4% |
| Business | 5,090 | 23.3% |
| Education | 2,196 | 10.1% |
| Literature & Languages | 737 | 3.4% |
| Liberal Arts & History | 1,044 | 4.8% |
| Visual & Performing Arts | 787 | 3.6% |
| Communications | 904 | 4.1% |
| Arts & Humanities | 1,569 | 7.2% |
| Total | 21,822 | 100.0% |
Transportation & Commute in North Charleston
Vehicle Availability by Sex in North Charleston
The most prevalent vehicle ownership categories in North Charleston are males with 2 vehicles (12,604, accounting for 40.5%) and females with 2 vehicles (10,496, making up 46.9%).
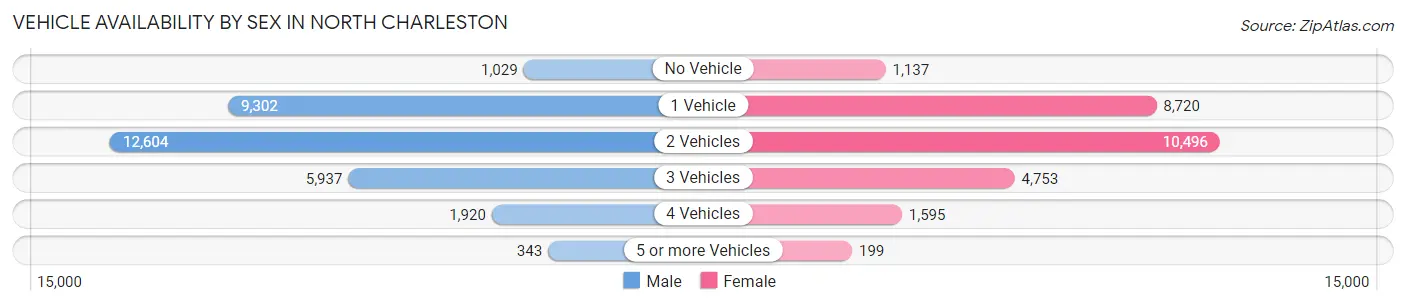
| Vehicles Available | Male | Female |
| No Vehicle | 1,029 (3.3%) | 1,137 (4.2%) |
| 1 Vehicle | 9,302 (29.9%) | 8,720 (32.4%) |
| 2 Vehicles | 12,604 (40.5%) | 10,496 (39.0%) |
| 3 Vehicles | 5,937 (19.1%) | 4,753 (17.7%) |
| 4 Vehicles | 1,920 (6.2%) | 1,595 (5.9%) |
| 5 or more Vehicles | 343 (1.1%) | 199 (0.7%) |
| Total | 31,135 (100.0%) | 26,900 (100.0%) |
Commute Time in North Charleston
The most frequently occuring commute durations in North Charleston are 20 to 24 minutes (10,946 commuters, 19.9%), 15 to 19 minutes (9,805 commuters, 17.8%), and 30 to 34 minutes (9,236 commuters, 16.8%).
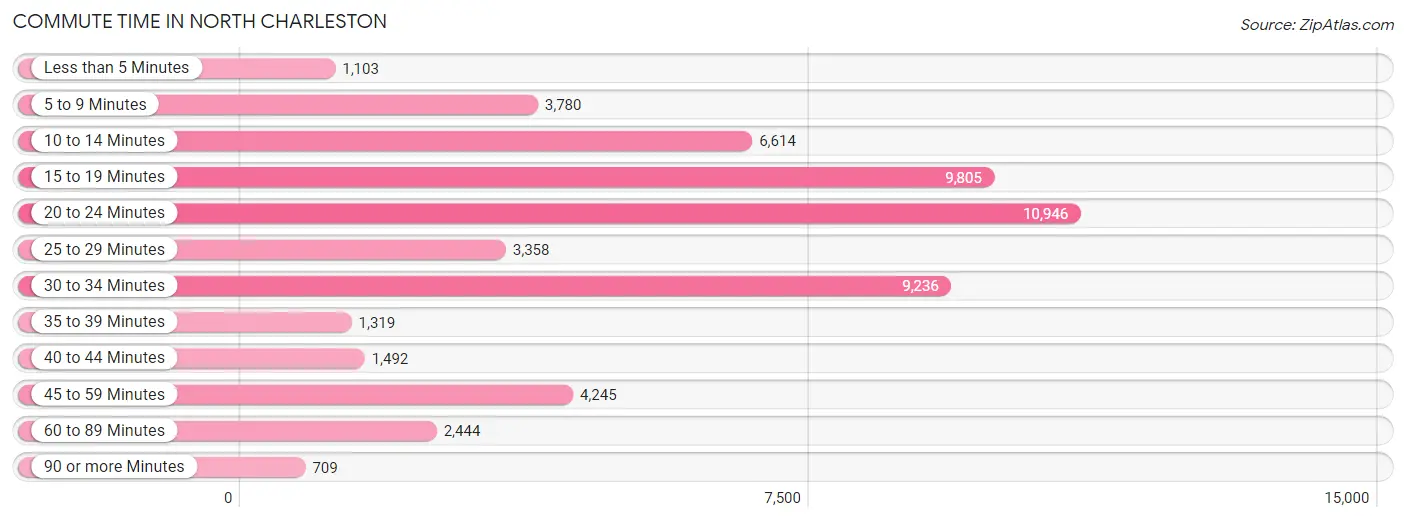
| Commute Time | # Commuters | % Commuters |
| Less than 5 Minutes | 1,103 | 2.0% |
| 5 to 9 Minutes | 3,780 | 6.9% |
| 10 to 14 Minutes | 6,614 | 12.0% |
| 15 to 19 Minutes | 9,805 | 17.8% |
| 20 to 24 Minutes | 10,946 | 19.9% |
| 25 to 29 Minutes | 3,358 | 6.1% |
| 30 to 34 Minutes | 9,236 | 16.8% |
| 35 to 39 Minutes | 1,319 | 2.4% |
| 40 to 44 Minutes | 1,492 | 2.7% |
| 45 to 59 Minutes | 4,245 | 7.7% |
| 60 to 89 Minutes | 2,444 | 4.4% |
| 90 or more Minutes | 709 | 1.3% |
Commute Time by Sex in North Charleston
The most common commute times in North Charleston are 20 to 24 minutes (5,919 commuters, 19.9%) for males and 20 to 24 minutes (5,027 commuters, 19.9%) for females.
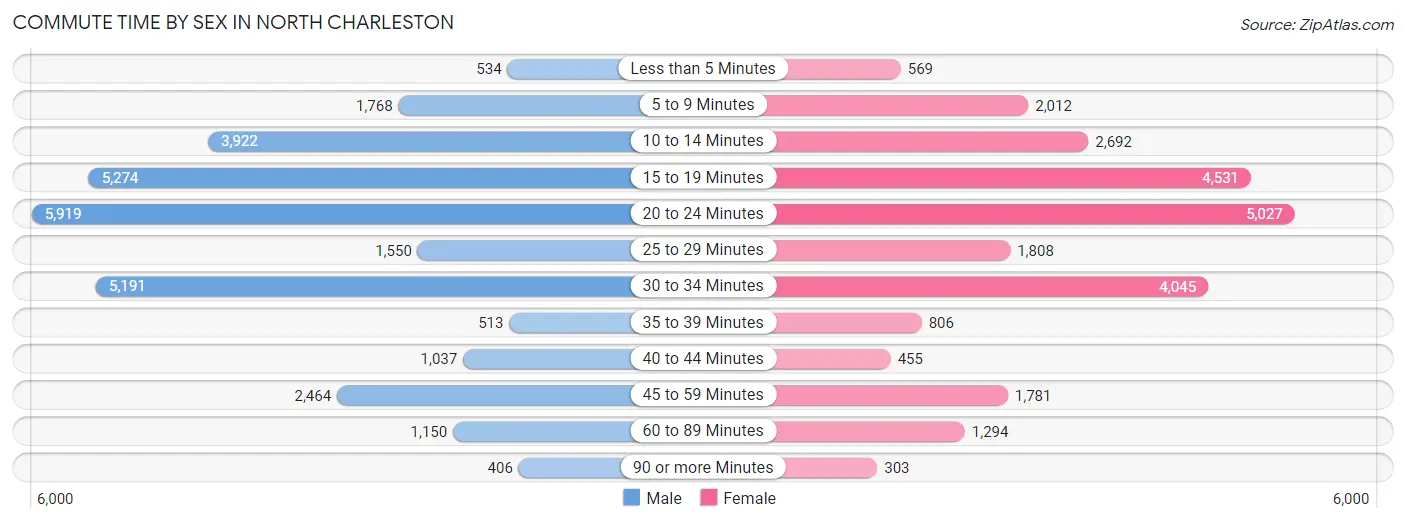
| Commute Time | Male | Female |
| Less than 5 Minutes | 534 (1.8%) | 569 (2.2%) |
| 5 to 9 Minutes | 1,768 (5.9%) | 2,012 (8.0%) |
| 10 to 14 Minutes | 3,922 (13.2%) | 2,692 (10.6%) |
| 15 to 19 Minutes | 5,274 (17.7%) | 4,531 (17.9%) |
| 20 to 24 Minutes | 5,919 (19.9%) | 5,027 (19.9%) |
| 25 to 29 Minutes | 1,550 (5.2%) | 1,808 (7.1%) |
| 30 to 34 Minutes | 5,191 (17.5%) | 4,045 (16.0%) |
| 35 to 39 Minutes | 513 (1.7%) | 806 (3.2%) |
| 40 to 44 Minutes | 1,037 (3.5%) | 455 (1.8%) |
| 45 to 59 Minutes | 2,464 (8.3%) | 1,781 (7.0%) |
| 60 to 89 Minutes | 1,150 (3.9%) | 1,294 (5.1%) |
| 90 or more Minutes | 406 (1.4%) | 303 (1.2%) |
Time of Departure to Work by Sex in North Charleston
The most frequent times of departure to work in North Charleston are 7:00 AM to 7:29 AM (5,120, 17.2%) for males and 8:00 AM to 8:29 AM (3,817, 15.1%) for females.
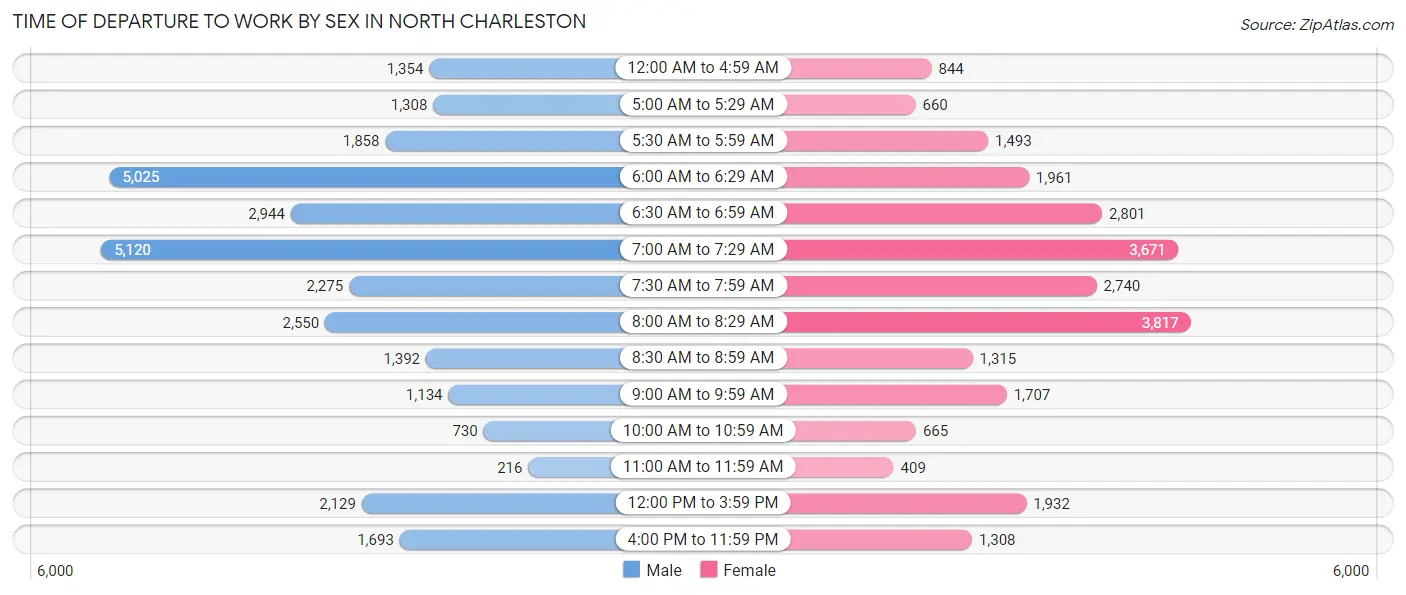
| Time of Departure | Male | Female |
| 12:00 AM to 4:59 AM | 1,354 (4.5%) | 844 (3.3%) |
| 5:00 AM to 5:29 AM | 1,308 (4.4%) | 660 (2.6%) |
| 5:30 AM to 5:59 AM | 1,858 (6.2%) | 1,493 (5.9%) |
| 6:00 AM to 6:29 AM | 5,025 (16.9%) | 1,961 (7.7%) |
| 6:30 AM to 6:59 AM | 2,944 (9.9%) | 2,801 (11.1%) |
| 7:00 AM to 7:29 AM | 5,120 (17.2%) | 3,671 (14.5%) |
| 7:30 AM to 7:59 AM | 2,275 (7.6%) | 2,740 (10.8%) |
| 8:00 AM to 8:29 AM | 2,550 (8.6%) | 3,817 (15.1%) |
| 8:30 AM to 8:59 AM | 1,392 (4.7%) | 1,315 (5.2%) |
| 9:00 AM to 9:59 AM | 1,134 (3.8%) | 1,707 (6.7%) |
| 10:00 AM to 10:59 AM | 730 (2.5%) | 665 (2.6%) |
| 11:00 AM to 11:59 AM | 216 (0.7%) | 409 (1.6%) |
| 12:00 PM to 3:59 PM | 2,129 (7.2%) | 1,932 (7.6%) |
| 4:00 PM to 11:59 PM | 1,693 (5.7%) | 1,308 (5.2%) |
| Total | 29,728 (100.0%) | 25,323 (100.0%) |
Housing Occupancy in North Charleston
Occupancy by Ownership in North Charleston
Of the total 45,917 dwellings in North Charleston, owner-occupied units account for 22,694 (49.4%), while renter-occupied units make up 23,223 (50.6%).
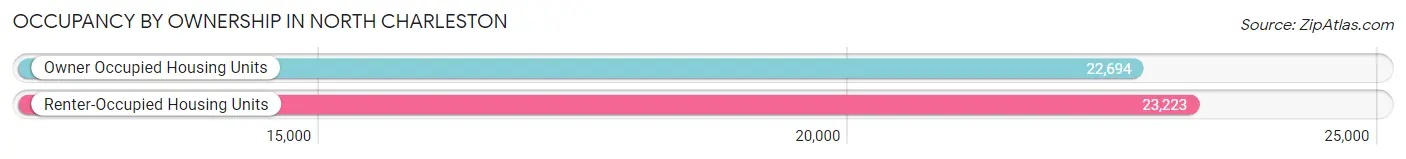
| Occupancy | # Housing Units | % Housing Units |
| Owner Occupied Housing Units | 22,694 | 49.4% |
| Renter-Occupied Housing Units | 23,223 | 50.6% |
| Total Occupied Housing Units | 45,917 | 100.0% |
Occupancy by Household Size in North Charleston
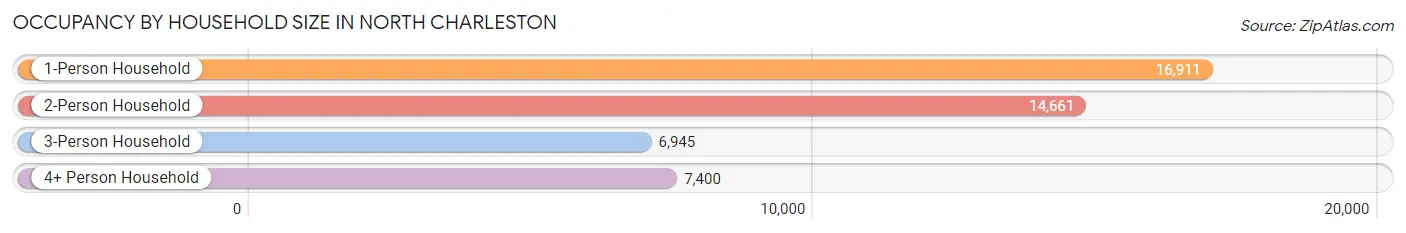
| Household Size | # Housing Units | % Housing Units |
| 1-Person Household | 16,911 | 36.8% |
| 2-Person Household | 14,661 | 31.9% |
| 3-Person Household | 6,945 | 15.1% |
| 4+ Person Household | 7,400 | 16.1% |
| Total Housing Units | 45,917 | 100.0% |
Occupancy by Ownership by Household Size in North Charleston
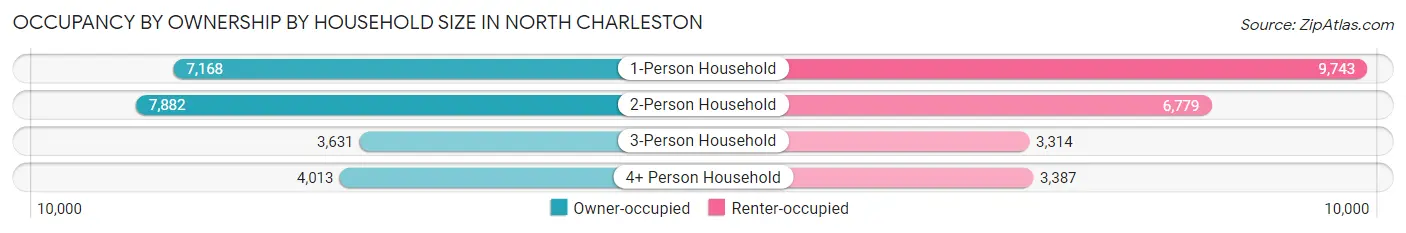
| Household Size | Owner-occupied | Renter-occupied |
| 1-Person Household | 7,168 (42.4%) | 9,743 (57.6%) |
| 2-Person Household | 7,882 (53.8%) | 6,779 (46.2%) |
| 3-Person Household | 3,631 (52.3%) | 3,314 (47.7%) |
| 4+ Person Household | 4,013 (54.2%) | 3,387 (45.8%) |
| Total Housing Units | 22,694 (49.4%) | 23,223 (50.6%) |
Occupancy by Educational Attainment in North Charleston
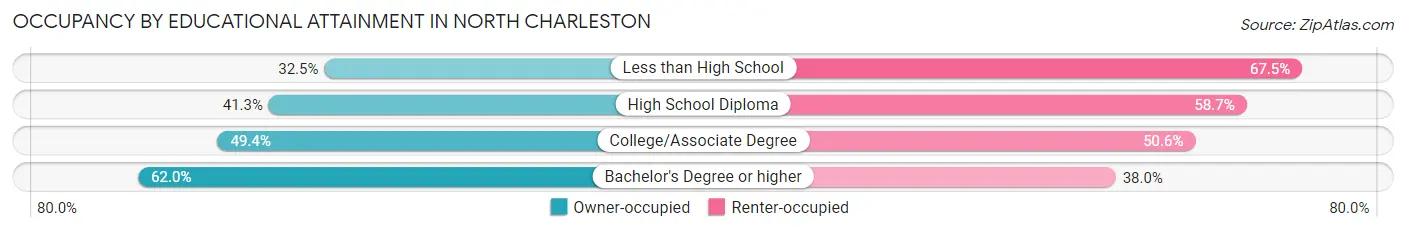
| Household Size | Owner-occupied | Renter-occupied |
| Less than High School | 1,580 (32.5%) | 3,287 (67.5%) |
| High School Diploma | 4,699 (41.3%) | 6,686 (58.7%) |
| College/Associate Degree | 7,754 (49.4%) | 7,943 (50.6%) |
| Bachelor's Degree or higher | 8,661 (62.0%) | 5,307 (38.0%) |
Occupancy by Age of Householder in North Charleston
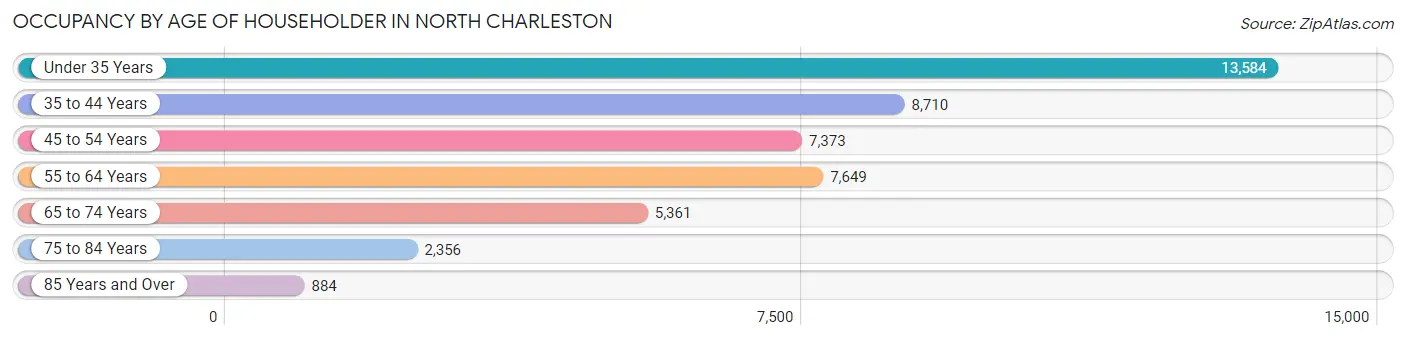
| Age Bracket | # Households | % Households |
| Under 35 Years | 13,584 | 29.6% |
| 35 to 44 Years | 8,710 | 19.0% |
| 45 to 54 Years | 7,373 | 16.1% |
| 55 to 64 Years | 7,649 | 16.7% |
| 65 to 74 Years | 5,361 | 11.7% |
| 75 to 84 Years | 2,356 | 5.1% |
| 85 Years and Over | 884 | 1.9% |
| Total | 45,917 | 100.0% |
Housing Finances in North Charleston
Median Income by Occupancy in North Charleston
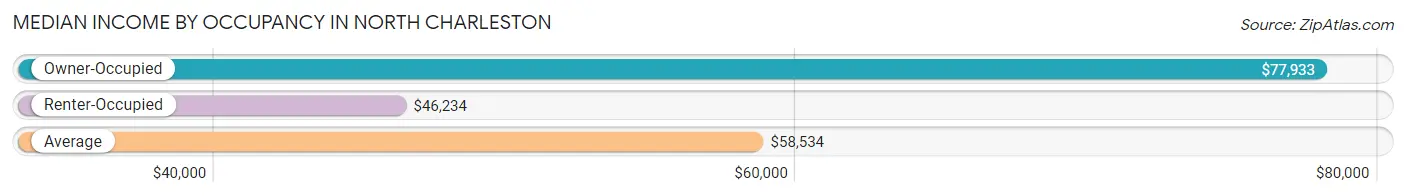
| Occupancy Type | # Households | Median Income |
| Owner-Occupied | 22,694 (49.4%) | $77,933 |
| Renter-Occupied | 23,223 (50.6%) | $46,234 |
| Average | 45,917 (100.0%) | $58,534 |
Occupancy by Householder Income Bracket in North Charleston
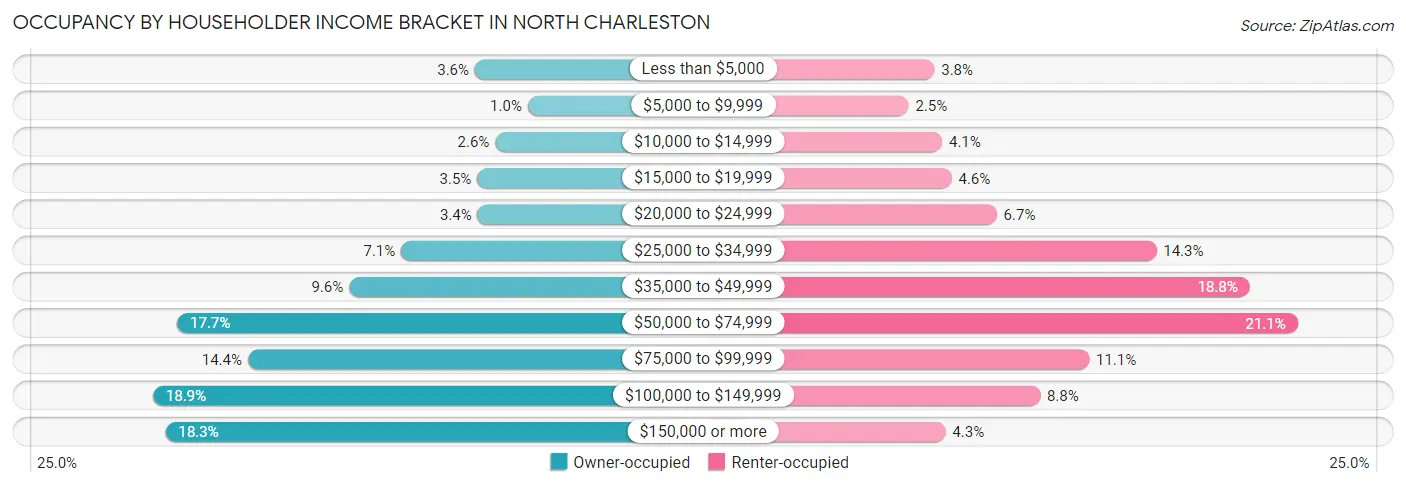
| Income Bracket | Owner-occupied | Renter-occupied |
| Less than $5,000 | 809 (3.6%) | 871 (3.7%) |
| $5,000 to $9,999 | 237 (1.0%) | 585 (2.5%) |
| $10,000 to $14,999 | 587 (2.6%) | 956 (4.1%) |
| $15,000 to $19,999 | 782 (3.5%) | 1,062 (4.6%) |
| $20,000 to $24,999 | 778 (3.4%) | 1,560 (6.7%) |
| $25,000 to $34,999 | 1,604 (7.1%) | 3,325 (14.3%) |
| $35,000 to $49,999 | 2,168 (9.6%) | 4,359 (18.8%) |
| $50,000 to $74,999 | 4,027 (17.7%) | 4,889 (21.0%) |
| $75,000 to $99,999 | 3,262 (14.4%) | 2,582 (11.1%) |
| $100,000 to $149,999 | 4,288 (18.9%) | 2,039 (8.8%) |
| $150,000 or more | 4,152 (18.3%) | 995 (4.3%) |
| Total | 22,694 (100.0%) | 23,223 (100.0%) |
Monthly Housing Cost Tiers in North Charleston
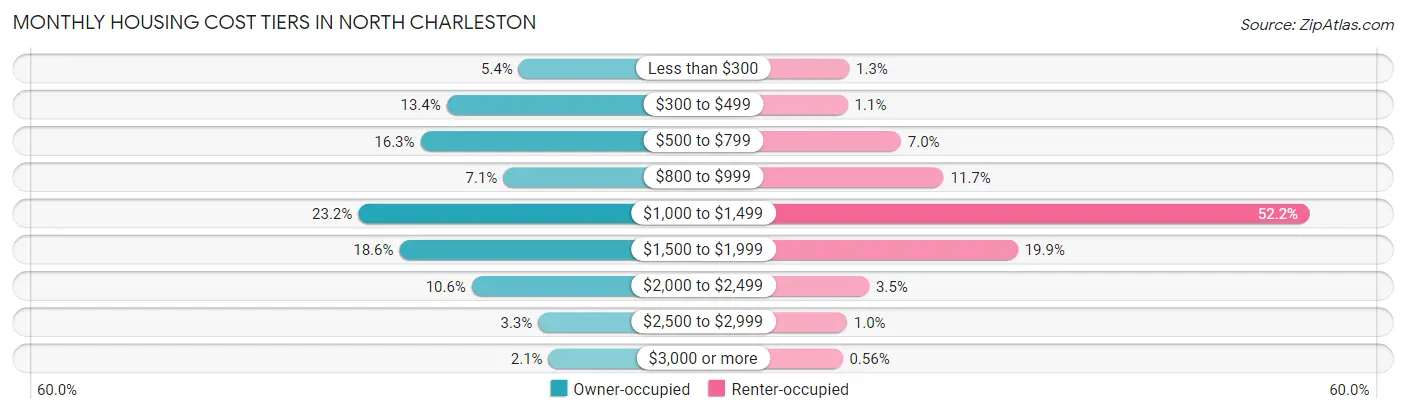
| Monthly Cost | Owner-occupied | Renter-occupied |
| Less than $300 | 1,230 (5.4%) | 299 (1.3%) |
| $300 to $499 | 3,038 (13.4%) | 262 (1.1%) |
| $500 to $799 | 3,695 (16.3%) | 1,629 (7.0%) |
| $800 to $999 | 1,619 (7.1%) | 2,725 (11.7%) |
| $1,000 to $1,499 | 5,255 (23.2%) | 12,121 (52.2%) |
| $1,500 to $1,999 | 4,223 (18.6%) | 4,626 (19.9%) |
| $2,000 to $2,499 | 2,408 (10.6%) | 812 (3.5%) |
| $2,500 to $2,999 | 742 (3.3%) | 242 (1.0%) |
| $3,000 or more | 484 (2.1%) | 130 (0.6%) |
| Total | 22,694 (100.0%) | 23,223 (100.0%) |
Physical Housing Characteristics in North Charleston
Housing Structures in North Charleston
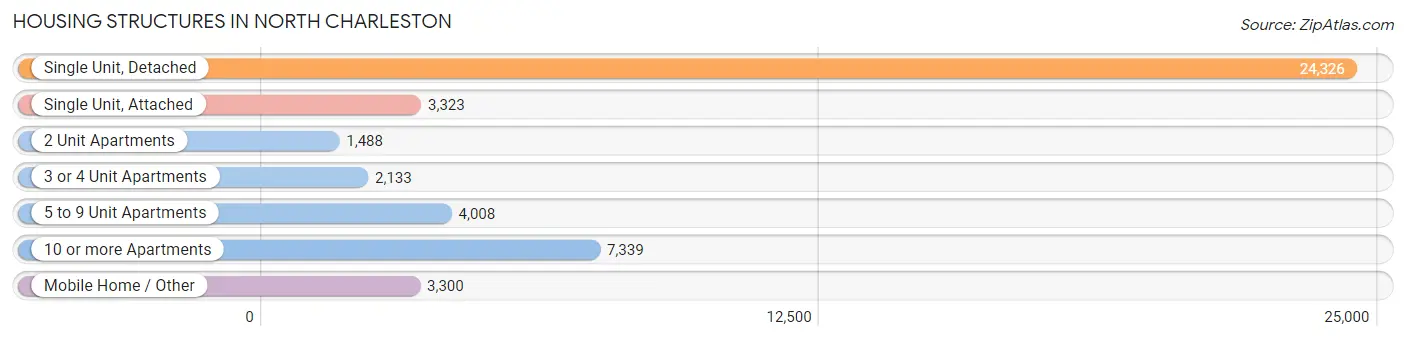
| Structure Type | # Housing Units | % Housing Units |
| Single Unit, Detached | 24,326 | 53.0% |
| Single Unit, Attached | 3,323 | 7.2% |
| 2 Unit Apartments | 1,488 | 3.2% |
| 3 or 4 Unit Apartments | 2,133 | 4.6% |
| 5 to 9 Unit Apartments | 4,008 | 8.7% |
| 10 or more Apartments | 7,339 | 16.0% |
| Mobile Home / Other | 3,300 | 7.2% |
| Total | 45,917 | 100.0% |
Housing Structures by Occupancy in North Charleston
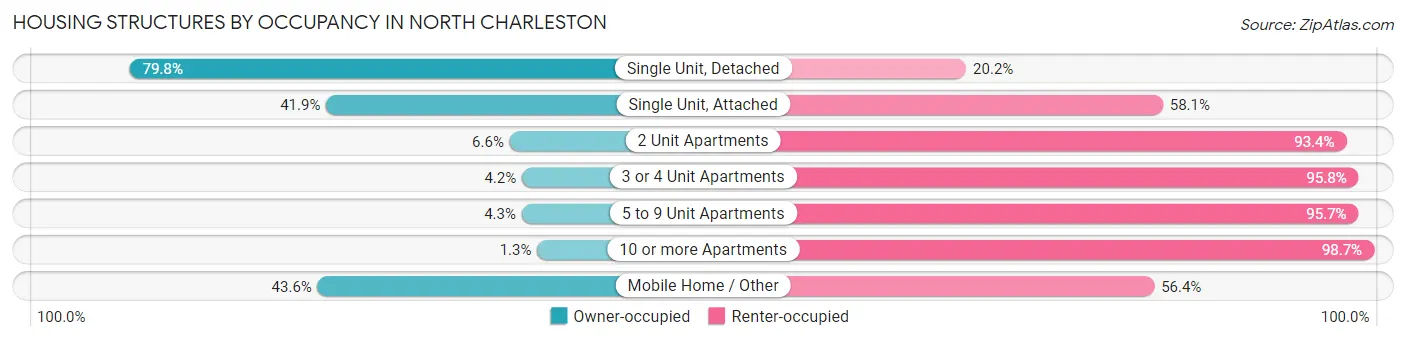
| Structure Type | Owner-occupied | Renter-occupied |
| Single Unit, Detached | 19,410 (79.8%) | 4,916 (20.2%) |
| Single Unit, Attached | 1,393 (41.9%) | 1,930 (58.1%) |
| 2 Unit Apartments | 98 (6.6%) | 1,390 (93.4%) |
| 3 or 4 Unit Apartments | 90 (4.2%) | 2,043 (95.8%) |
| 5 to 9 Unit Apartments | 171 (4.3%) | 3,837 (95.7%) |
| 10 or more Apartments | 94 (1.3%) | 7,245 (98.7%) |
| Mobile Home / Other | 1,438 (43.6%) | 1,862 (56.4%) |
| Total | 22,694 (49.4%) | 23,223 (50.6%) |
Housing Structures by Number of Rooms in North Charleston
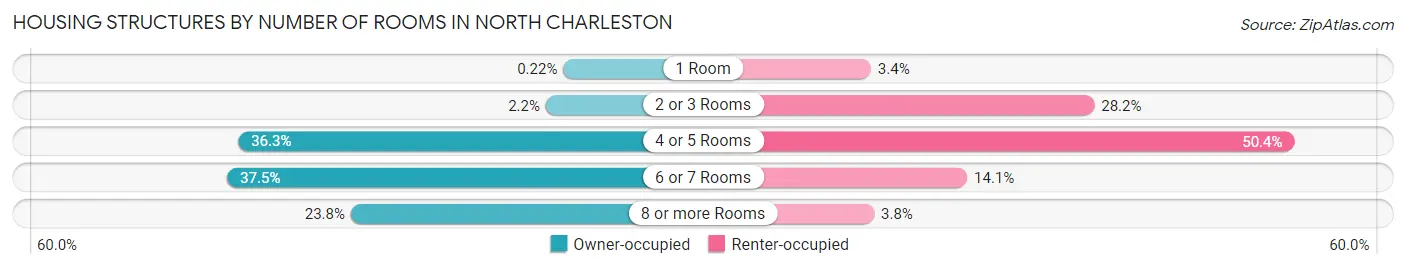
| Number of Rooms | Owner-occupied | Renter-occupied |
| 1 Room | 50 (0.2%) | 798 (3.4%) |
| 2 or 3 Rooms | 491 (2.2%) | 6,556 (28.2%) |
| 4 or 5 Rooms | 8,237 (36.3%) | 11,710 (50.4%) |
| 6 or 7 Rooms | 8,514 (37.5%) | 3,279 (14.1%) |
| 8 or more Rooms | 5,402 (23.8%) | 880 (3.8%) |
| Total | 22,694 (100.0%) | 23,223 (100.0%) |
Housing Structure by Heating Type in North Charleston
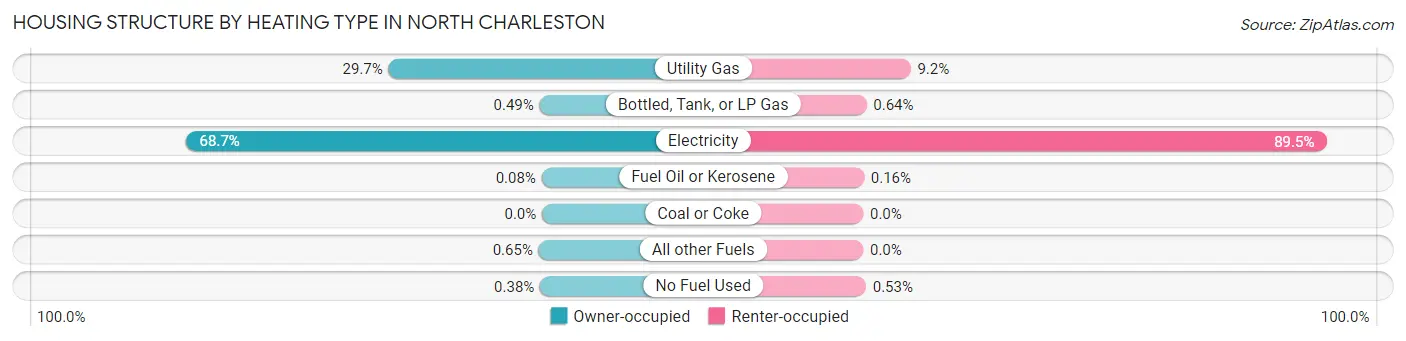
| Heating Type | Owner-occupied | Renter-occupied |
| Utility Gas | 6,733 (29.7%) | 2,129 (9.2%) |
| Bottled, Tank, or LP Gas | 111 (0.5%) | 148 (0.6%) |
| Electricity | 15,598 (68.7%) | 20,785 (89.5%) |
| Fuel Oil or Kerosene | 18 (0.1%) | 37 (0.2%) |
| Coal or Coke | 0 (0.0%) | 0 (0.0%) |
| All other Fuels | 148 (0.6%) | 0 (0.0%) |
| No Fuel Used | 86 (0.4%) | 124 (0.5%) |
| Total | 22,694 (100.0%) | 23,223 (100.0%) |
Household Vehicle Usage in North Charleston
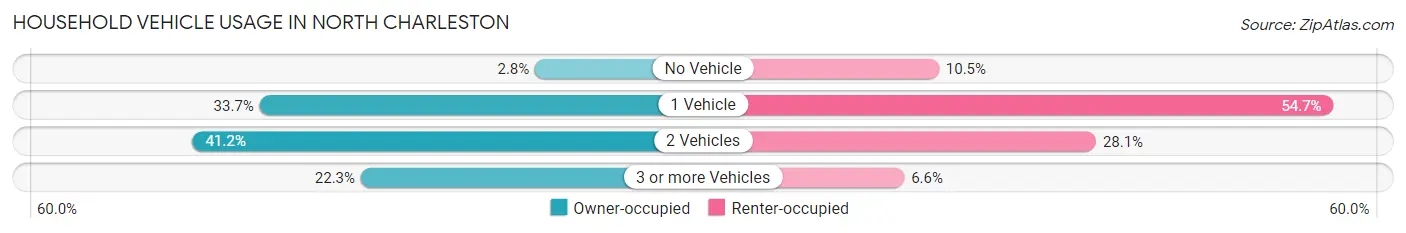
| Vehicles per Household | Owner-occupied | Renter-occupied |
| No Vehicle | 638 (2.8%) | 2,442 (10.5%) |
| 1 Vehicle | 7,642 (33.7%) | 12,708 (54.7%) |
| 2 Vehicles | 9,347 (41.2%) | 6,530 (28.1%) |
| 3 or more Vehicles | 5,067 (22.3%) | 1,543 (6.6%) |
| Total | 22,694 (100.0%) | 23,223 (100.0%) |
Real Estate & Mortgages in North Charleston
Real Estate and Mortgage Overview in North Charleston
| Characteristic | Without Mortgage | With Mortgage |
| Housing Units | 7,521 | 15,173 |
| Median Property Value | $181,600 | $267,300 |
| Median Household Income | $51,669 | $3,250 |
| Monthly Housing Costs | $477 | $484 |
| Real Estate Taxes | $944 | $405 |
Property Value by Mortgage Status in North Charleston
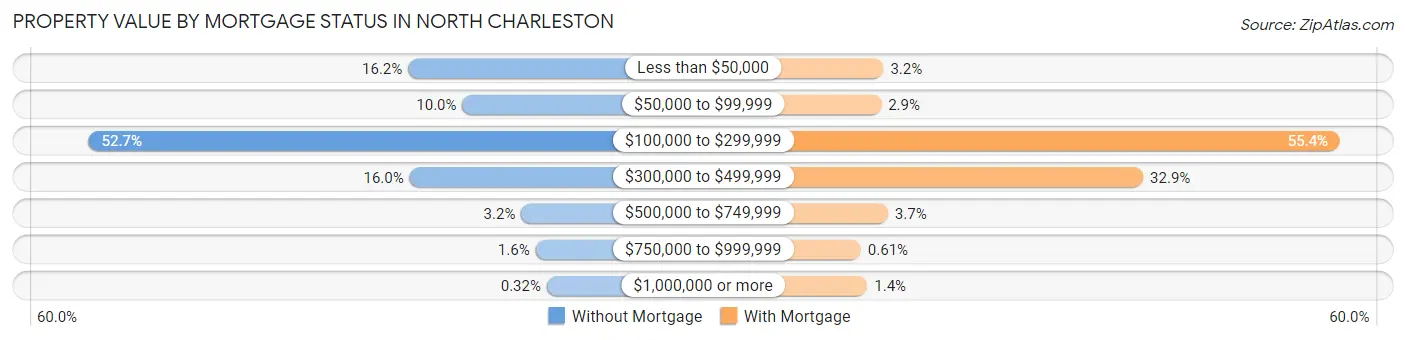
| Property Value | Without Mortgage | With Mortgage |
| Less than $50,000 | 1,216 (16.2%) | 484 (3.2%) |
| $50,000 to $99,999 | 750 (10.0%) | 444 (2.9%) |
| $100,000 to $299,999 | 3,962 (52.7%) | 8,398 (55.3%) |
| $300,000 to $499,999 | 1,204 (16.0%) | 4,988 (32.9%) |
| $500,000 to $749,999 | 244 (3.2%) | 561 (3.7%) |
| $750,000 to $999,999 | 121 (1.6%) | 93 (0.6%) |
| $1,000,000 or more | 24 (0.3%) | 205 (1.3%) |
| Total | 7,521 (100.0%) | 15,173 (100.0%) |
Household Income by Mortgage Status in North Charleston
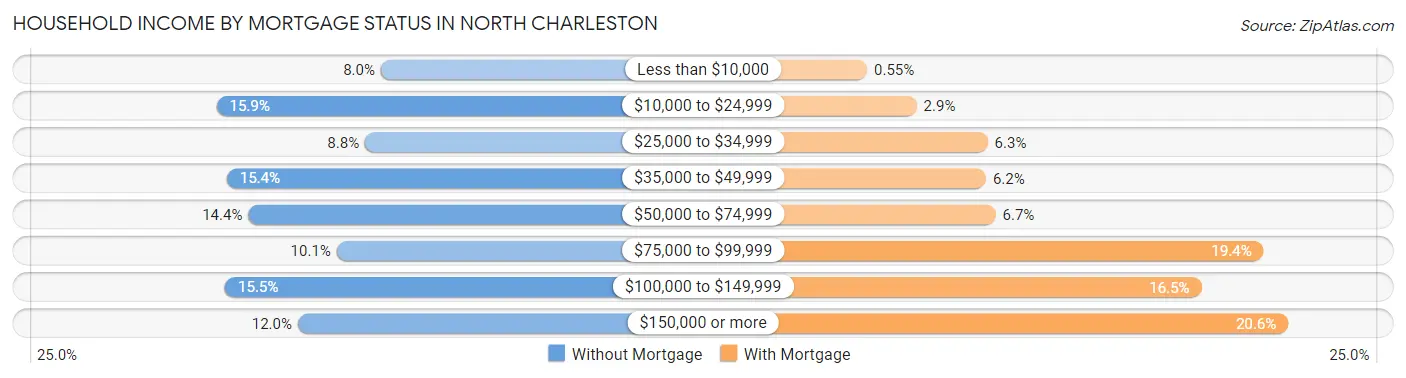
| Household Income | Without Mortgage | With Mortgage |
| Less than $10,000 | 605 (8.0%) | 83 (0.5%) |
| $10,000 to $24,999 | 1,193 (15.9%) | 441 (2.9%) |
| $25,000 to $34,999 | 661 (8.8%) | 954 (6.3%) |
| $35,000 to $49,999 | 1,156 (15.4%) | 943 (6.2%) |
| $50,000 to $74,999 | 1,079 (14.3%) | 1,012 (6.7%) |
| $75,000 to $99,999 | 763 (10.1%) | 2,948 (19.4%) |
| $100,000 to $149,999 | 1,162 (15.4%) | 2,499 (16.5%) |
| $150,000 or more | 902 (12.0%) | 3,126 (20.6%) |
| Total | 7,521 (100.0%) | 15,173 (100.0%) |
Property Value to Household Income Ratio in North Charleston
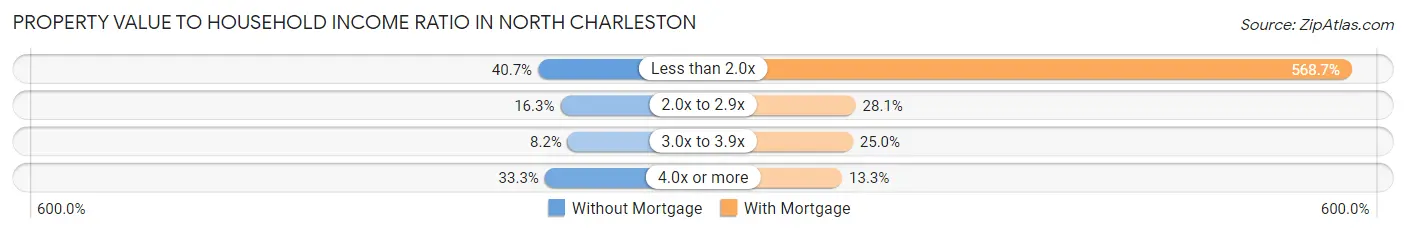
| Value-to-Income Ratio | Without Mortgage | With Mortgage |
| Less than 2.0x | 3,058 (40.7%) | 86,289 (568.7%) |
| 2.0x to 2.9x | 1,228 (16.3%) | 4,258 (28.1%) |
| 3.0x to 3.9x | 618 (8.2%) | 3,797 (25.0%) |
| 4.0x or more | 2,505 (33.3%) | 2,013 (13.3%) |
| Total | 7,521 (100.0%) | 15,173 (100.0%) |
Real Estate Taxes by Mortgage Status in North Charleston
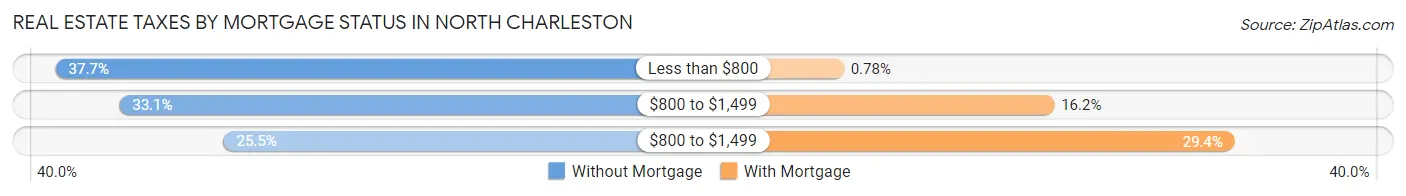
| Property Taxes | Without Mortgage | With Mortgage |
| Less than $800 | 2,838 (37.7%) | 118 (0.8%) |
| $800 to $1,499 | 2,488 (33.1%) | 2,452 (16.2%) |
| $800 to $1,499 | 1,915 (25.5%) | 4,453 (29.3%) |
| Total | 7,521 (100.0%) | 15,173 (100.0%) |
Health & Disability in North Charleston
Health Insurance Coverage by Age in North Charleston
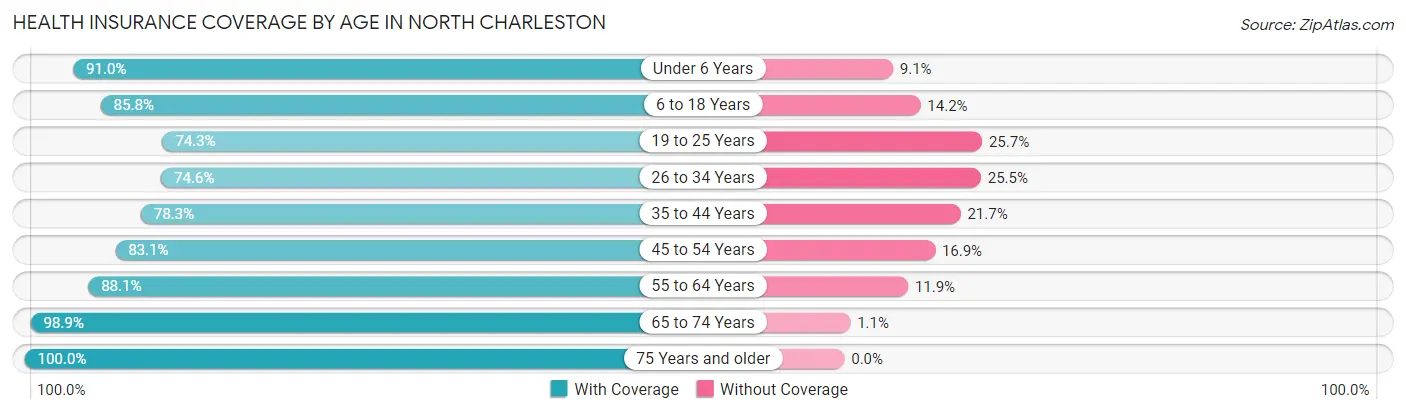
| Age Bracket | With Coverage | Without Coverage |
| Under 6 Years | 7,897 (90.9%) | 786 (9.0%) |
| 6 to 18 Years | 16,465 (85.8%) | 2,723 (14.2%) |
| 19 to 25 Years | 7,896 (74.3%) | 2,729 (25.7%) |
| 26 to 34 Years | 13,322 (74.6%) | 4,548 (25.5%) |
| 35 to 44 Years | 12,113 (78.3%) | 3,352 (21.7%) |
| 45 to 54 Years | 10,238 (83.1%) | 2,082 (16.9%) |
| 55 to 64 Years | 11,398 (88.1%) | 1,535 (11.9%) |
| 65 to 74 Years | 8,352 (98.9%) | 93 (1.1%) |
| 75 Years and older | 4,794 (100.0%) | 0 (0.0%) |
| Total | 92,475 (83.8%) | 17,848 (16.2%) |
Health Insurance Coverage by Citizenship Status in North Charleston
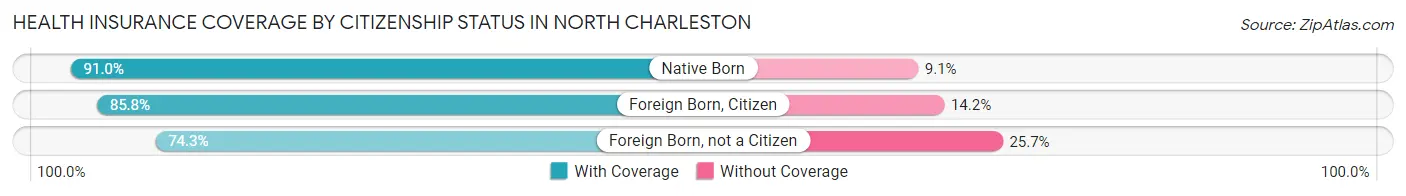
| Citizenship Status | With Coverage | Without Coverage |
| Native Born | 7,897 (90.9%) | 786 (9.0%) |
| Foreign Born, Citizen | 16,465 (85.8%) | 2,723 (14.2%) |
| Foreign Born, not a Citizen | 7,896 (74.3%) | 2,729 (25.7%) |
Health Insurance Coverage by Household Income in North Charleston
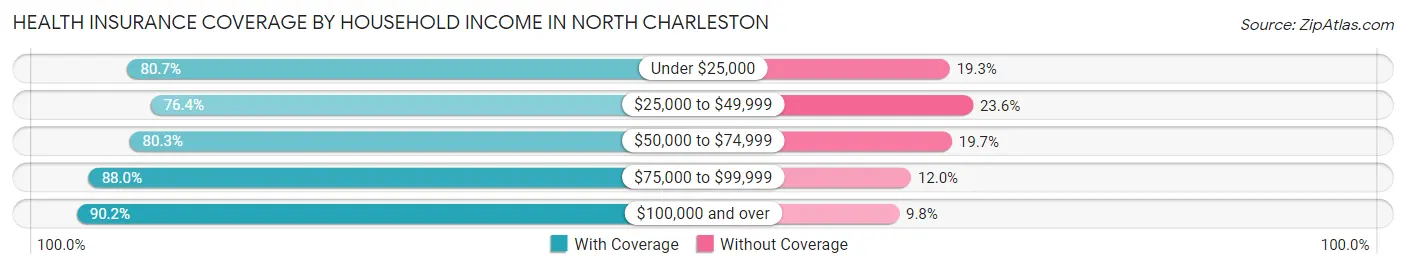
| Household Income | With Coverage | Without Coverage |
| Under $25,000 | 11,946 (80.7%) | 2,853 (19.3%) |
| $25,000 to $49,999 | 19,085 (76.4%) | 5,909 (23.6%) |
| $50,000 to $74,999 | 15,700 (80.3%) | 3,850 (19.7%) |
| $75,000 to $99,999 | 12,792 (88.0%) | 1,747 (12.0%) |
| $100,000 and over | 31,508 (90.2%) | 3,421 (9.8%) |
Public vs Private Health Insurance Coverage by Age in North Charleston
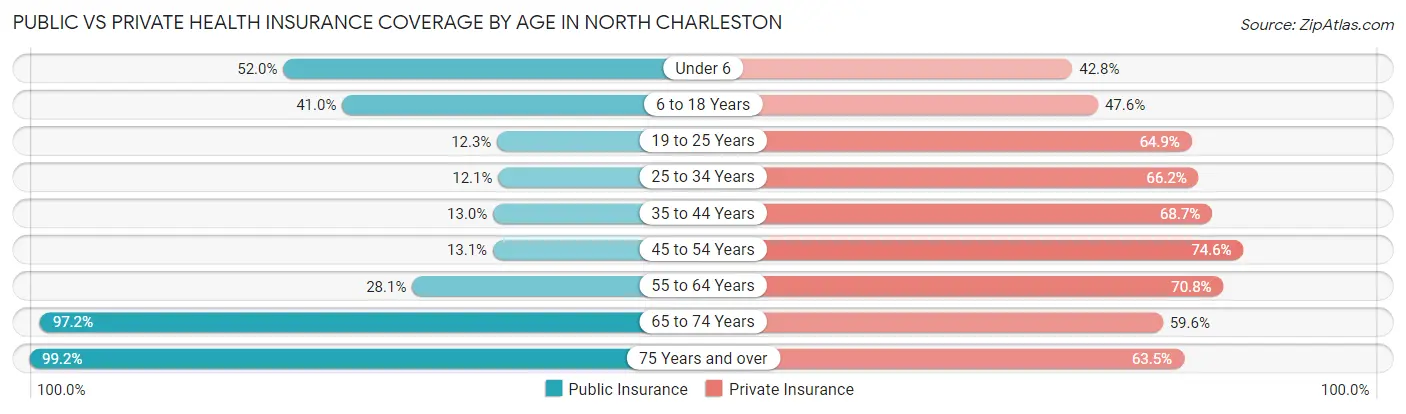
| Age Bracket | Public Insurance | Private Insurance |
| Under 6 | 4,514 (52.0%) | 3,715 (42.8%) |
| 6 to 18 Years | 7,874 (41.0%) | 9,124 (47.5%) |
| 19 to 25 Years | 1,305 (12.3%) | 6,900 (64.9%) |
| 25 to 34 Years | 2,158 (12.1%) | 11,835 (66.2%) |
| 35 to 44 Years | 2,016 (13.0%) | 10,630 (68.7%) |
| 45 to 54 Years | 1,610 (13.1%) | 9,184 (74.6%) |
| 55 to 64 Years | 3,628 (28.1%) | 9,160 (70.8%) |
| 65 to 74 Years | 8,206 (97.2%) | 5,031 (59.6%) |
| 75 Years and over | 4,754 (99.2%) | 3,044 (63.5%) |
| Total | 36,065 (32.7%) | 68,623 (62.2%) |
Disability Status by Sex by Age in North Charleston
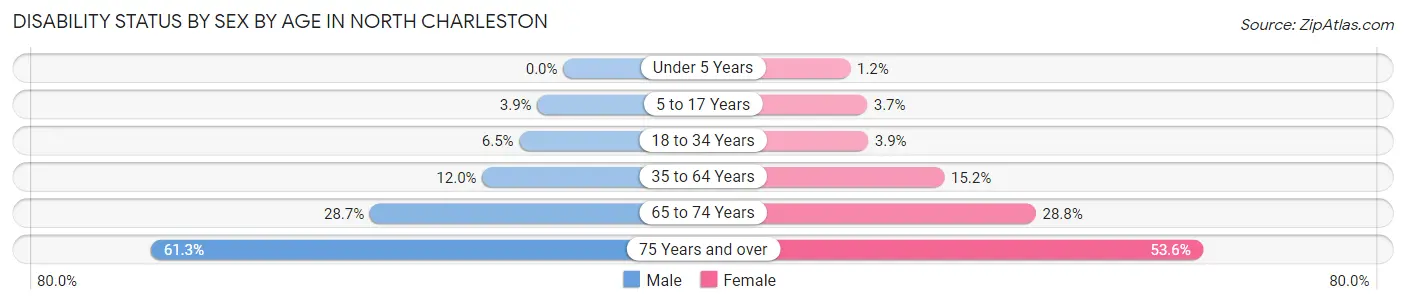
| Age Bracket | Male | Female |
| Under 5 Years | 0 (0.0%) | 42 (1.2%) |
| 5 to 17 Years | 365 (3.8%) | 346 (3.7%) |
| 18 to 34 Years | 970 (6.5%) | 579 (3.9%) |
| 35 to 64 Years | 2,300 (12.0%) | 3,276 (15.2%) |
| 65 to 74 Years | 1,142 (28.7%) | 1,285 (28.8%) |
| 75 Years and over | 1,078 (61.3%) | 1,625 (53.6%) |
Disability Class by Sex by Age in North Charleston
Disability Class: Hearing Difficulty
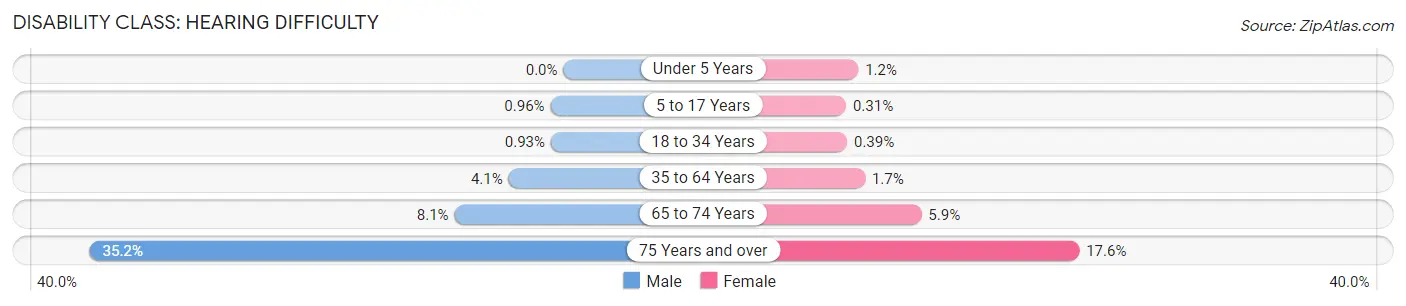
| Age Bracket | Male | Female |
| Under 5 Years | 0 (0.0%) | 42 (1.2%) |
| 5 to 17 Years | 91 (1.0%) | 29 (0.3%) |
| 18 to 34 Years | 138 (0.9%) | 59 (0.4%) |
| 35 to 64 Years | 779 (4.1%) | 372 (1.7%) |
| 65 to 74 Years | 322 (8.1%) | 264 (5.9%) |
| 75 Years and over | 619 (35.2%) | 535 (17.6%) |
Disability Class: Vision Difficulty
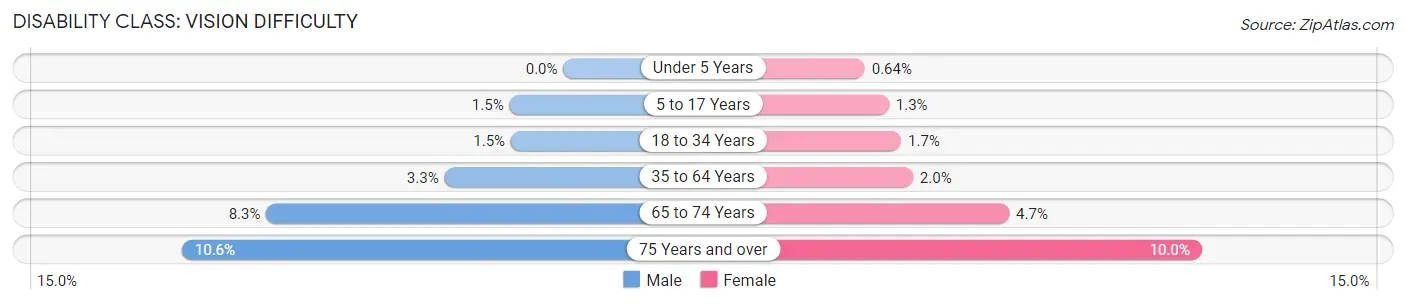
| Age Bracket | Male | Female |
| Under 5 Years | 0 (0.0%) | 22 (0.6%) |
| 5 to 17 Years | 142 (1.5%) | 122 (1.3%) |
| 18 to 34 Years | 217 (1.5%) | 247 (1.7%) |
| 35 to 64 Years | 633 (3.3%) | 427 (2.0%) |
| 65 to 74 Years | 329 (8.3%) | 208 (4.7%) |
| 75 Years and over | 187 (10.6%) | 304 (10.0%) |
Disability Class: Cognitive Difficulty
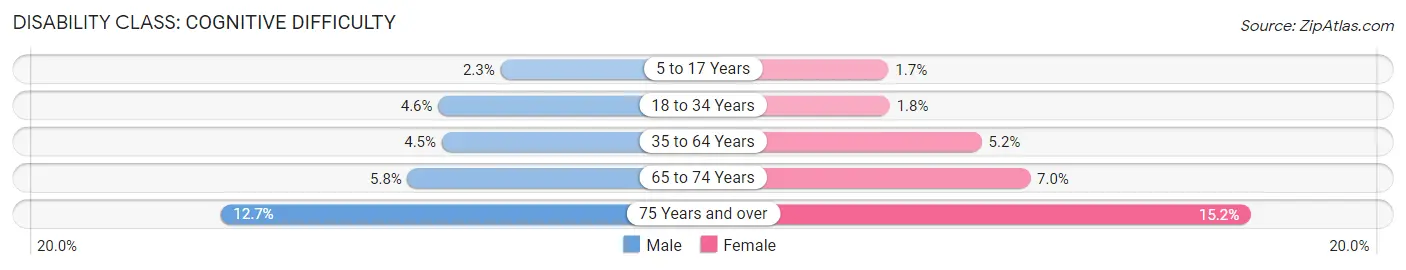
| Age Bracket | Male | Female |
| 5 to 17 Years | 221 (2.3%) | 161 (1.7%) |
| 18 to 34 Years | 690 (4.6%) | 266 (1.8%) |
| 35 to 64 Years | 864 (4.5%) | 1,119 (5.2%) |
| 65 to 74 Years | 230 (5.8%) | 312 (7.0%) |
| 75 Years and over | 224 (12.7%) | 461 (15.2%) |
Disability Class: Ambulatory Difficulty
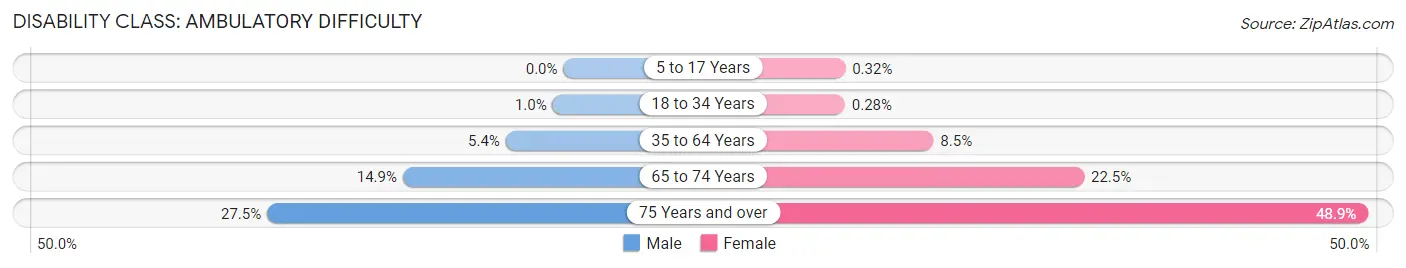
| Age Bracket | Male | Female |
| 5 to 17 Years | 0 (0.0%) | 30 (0.3%) |
| 18 to 34 Years | 149 (1.0%) | 42 (0.3%) |
| 35 to 64 Years | 1,025 (5.3%) | 1,835 (8.5%) |
| 65 to 74 Years | 593 (14.9%) | 1,004 (22.5%) |
| 75 Years and over | 484 (27.5%) | 1,482 (48.8%) |
Disability Class: Self-Care Difficulty
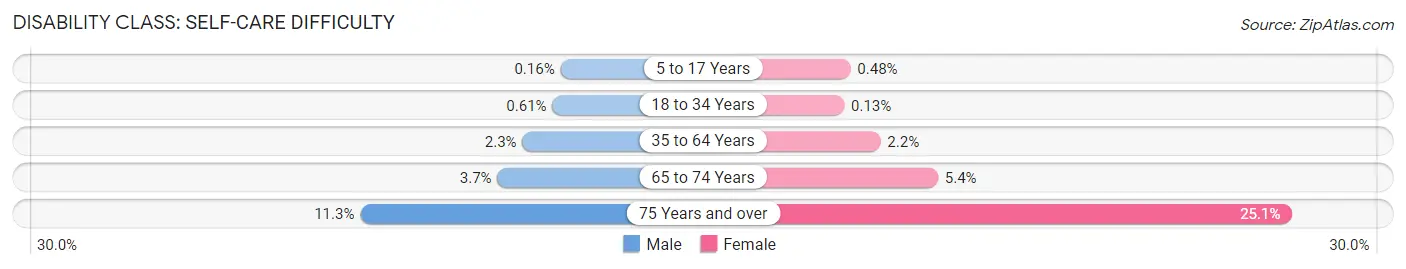
| Age Bracket | Male | Female |
| 5 to 17 Years | 15 (0.2%) | 45 (0.5%) |
| 18 to 34 Years | 91 (0.6%) | 19 (0.1%) |
| 35 to 64 Years | 437 (2.3%) | 464 (2.1%) |
| 65 to 74 Years | 146 (3.7%) | 239 (5.3%) |
| 75 Years and over | 199 (11.3%) | 761 (25.1%) |
Technology Access in North Charleston
Computing Device Access in North Charleston
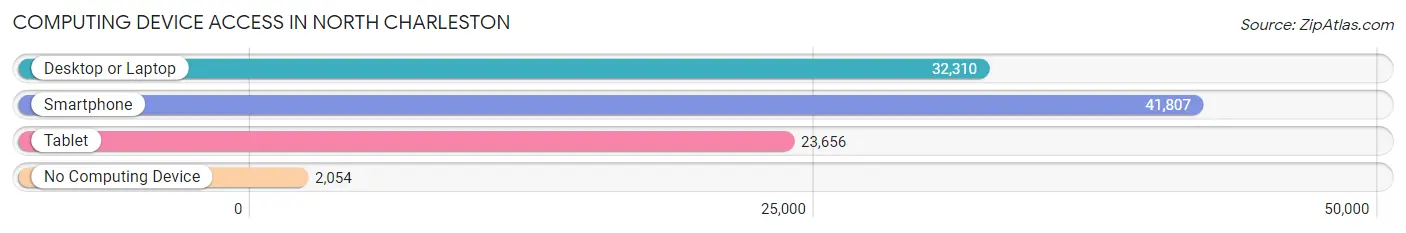
| Device Type | # Households | % Households |
| Desktop or Laptop | 32,310 | 70.4% |
| Smartphone | 41,807 | 91.0% |
| Tablet | 23,656 | 51.5% |
| No Computing Device | 2,054 | 4.5% |
| Total | 45,917 | 100.0% |
Internet Access in North Charleston
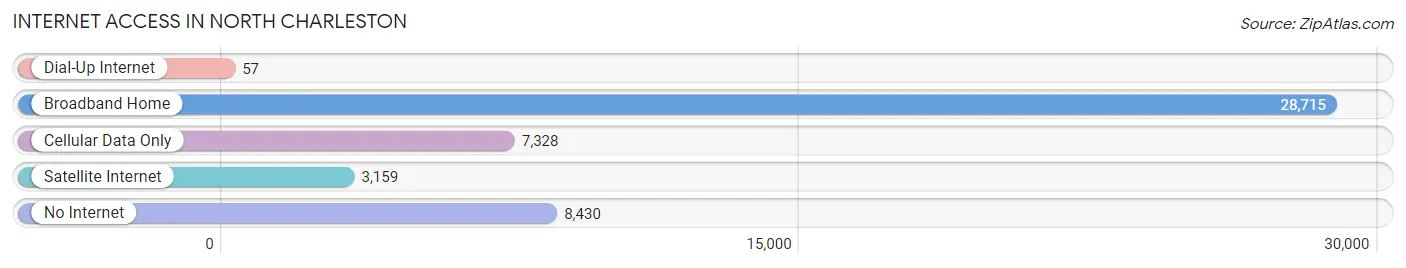
| Internet Type | # Households | % Households |
| Dial-Up Internet | 57 | 0.1% |
| Broadband Home | 28,715 | 62.5% |
| Cellular Data Only | 7,328 | 16.0% |
| Satellite Internet | 3,159 | 6.9% |
| No Internet | 8,430 | 18.4% |
| Total | 45,917 | 100.0% |
North Charleston Summary
Charleston, South Carolina is a city located in the southeastern United States. It is the largest city in the state and the county seat of Charleston County. The city is situated on the banks of the Ashley and Cooper Rivers, which flow into the Atlantic Ocean. It is the second-largest city in the state, behind Columbia.
History
Charleston was founded in 1670 by English settlers. It was named after King Charles II of England. The city quickly became a major port and trading center for the region. It was the site of the first shots of the American Revolution in 1776. During the Civil War, the city was the site of the first battle of the war, the Battle of Fort Sumter. After the war, the city was rebuilt and became a major industrial center.
Geography
Charleston is located in the Lowcountry region of South Carolina. It is situated on the banks of the Ashley and Cooper Rivers, which flow into the Atlantic Ocean. The city is located on a peninsula, surrounded by the Ashley and Cooper Rivers to the north and south, and the Atlantic Ocean to the east. The city has a humid subtropical climate, with hot, humid summers and mild winters.
Economy
Charleston has a diverse economy, with a mix of manufacturing, tourism, and services. The city is home to several major employers, including Boeing, Joint Base Charleston, and the Medical University of South Carolina. Tourism is a major industry in the city, with visitors coming to experience the city’s historic sites, beaches, and other attractions.
Demographics
As of the 2010 census, the population of Charleston was 120,083. The city is racially diverse, with a majority of the population being African American (47.2%), followed by White (41.2%), Hispanic (7.2%), and Asian (2.7%). The median household income in the city is $45,890, and the median age is 35.
Conclusion
Charleston, South Carolina is a city with a rich history and a diverse economy. It is located on the banks of the Ashley and Cooper Rivers, and is home to a diverse population. The city is a major tourist destination, with visitors coming to experience its historic sites, beaches, and other attractions. The city is also home to several major employers, including Boeing, Joint Base Charleston, and the Medical University of South Carolina.
Common Questions
What is Per Capita Income in North Charleston?
Per Capita income in North Charleston is $33,419.
What is the Median Family Income in North Charleston?
Median Family Income in North Charleston is $72,565.
What is the Median Household income in North Charleston?
Median Household Income in North Charleston is $58,534.
What is Income or Wage Gap in North Charleston?
Income or Wage Gap in North Charleston is 21.6%.
Women in North Charleston earn 78.4 cents for every dollar earned by a man.
What is Family Income Deficit in North Charleston?
Family Income Deficit in North Charleston is $10,098.
Families that are below poverty line in North Charleston earn $10,098 less on average than the poverty threshold level.
What is Inequality or Gini Index in North Charleston?
Inequality or Gini Index in North Charleston is 0.45.
What is the Total Population of North Charleston?
Total Population of North Charleston is 115,755.
What is the Total Male Population of North Charleston?
Total Male Population of North Charleston is 57,721.
What is the Total Female Population of North Charleston?
Total Female Population of North Charleston is 58,034.
What is the Ratio of Males per 100 Females in North Charleston?
There are 99.46 Males per 100 Females in North Charleston.
What is the Ratio of Females per 100 Males in North Charleston?
There are 100.54 Females per 100 Males in North Charleston.
What is the Median Population Age in North Charleston?
Median Population Age in North Charleston is 33.8 Years.
What is the Average Family Size in North Charleston
Average Family Size in North Charleston is 3.2 People.
What is the Average Household Size in North Charleston
Average Household Size in North Charleston is 2.4 People.
How Large is the Labor Force in North Charleston?
There are 62,974 People in the Labor Forcein in North Charleston.
What is the Percentage of People in the Labor Force in North Charleston?
69.0% of People are in the Labor Force in North Charleston.
What is the Unemployment Rate in North Charleston?
Unemployment Rate in North Charleston is 4.3%.