Cities with the Highest Percentage of Immigrants from India in the United States
RELATED REPORTS & OPTIONS
India
United States
Compare Cities
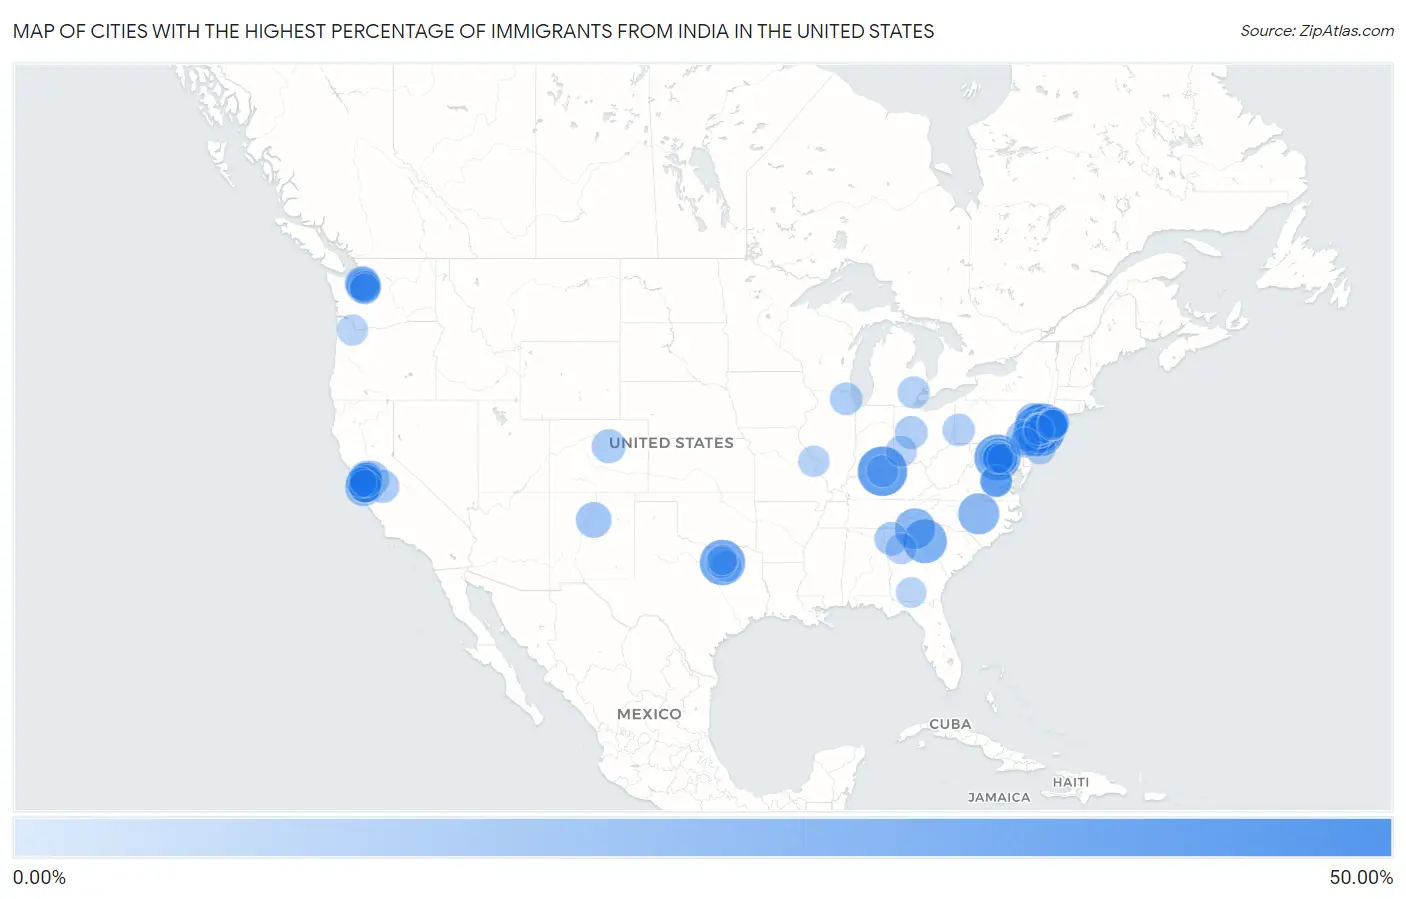
Map of Cities with the Highest Percentage of Immigrants from India in the United States
0.00%
50.00%
Cities with the Highest Percentage of Immigrants from India in the United States
| City | India | vs State | vs National | |
| 1. | Mongaup Valley | 43.40% | 0.79%(+42.6)#-1 | 0.83%(+42.6)#0 |
| 2. | Monroe Manor | 40.60% | 2.97%(+37.6)#-1 | 0.83%(+39.8)#1 |
| 3. | Hurstbourne Acres | 36.72% | 0.30%(+36.4)#-1 | 0.83%(+35.9)#2 |
| 4. | Ten Mile Run | 36.41% | 2.97%(+33.4)#0 | 0.83%(+35.6)#3 |
| 5. | Deans | 35.56% | 2.97%(+32.6)#1 | 0.83%(+34.7)#4 |
| 6. | Iselin | 34.84% | 2.97%(+31.9)#2 | 0.83%(+34.0)#5 |
| 7. | Princeton Meadows | 33.85% | 2.97%(+30.9)#3 | 0.83%(+33.0)#6 |
| 8. | Forsgate | 33.65% | 2.97%(+30.7)#4 | 0.83%(+32.8)#7 |
| 9. | Loudoun Valley Estates | 32.07% | 1.13%(+30.9)#-1 | 0.83%(+31.2)#8 |
| 10. | Hebron | 31.09% | 1.05%(+30.0)#-1 | 0.83%(+30.3)#9 |
| 11. | Dayton | 29.98% | 2.97%(+27.0)#5 | 0.83%(+29.2)#10 |
| 12. | Heathcote | 29.97% | 2.97%(+27.0)#6 | 0.83%(+29.1)#11 |
| 13. | Monmouth Junction | 29.95% | 2.97%(+27.0)#7 | 0.83%(+29.1)#12 |
| 14. | Belle Mead | 29.66% | 2.97%(+26.7)#8 | 0.83%(+28.8)#13 |
| 15. | Sully Square | 29.34% | 1.13%(+28.2)#0 | 0.83%(+28.5)#14 |
| 16. | Lowndesville | 28.80% | 0.36%(+28.4)#-1 | 0.83%(+28.0)#15 |
| 17. | Frazer | 28.69% | 0.77%(+27.9)#-1 | 0.83%(+27.9)#16 |
| 18. | Morrisville | 24.96% | 0.77%(+24.2)#-1 | 0.83%(+24.1)#17 |
| 19. | Sky Valley | 24.87% | 0.96%(+23.9)#-1 | 0.83%(+24.0)#18 |
| 20. | Plainsboro Center | 24.48% | 2.97%(+21.5)#9 | 0.83%(+23.7)#19 |
| 21. | Troy Hills | 24.34% | 2.97%(+21.4)#10 | 0.83%(+23.5)#20 |
| 22. | Parsippany | 24.16% | 2.97%(+21.2)#11 | 0.83%(+23.3)#21 |
| 23. | Moorefield | 22.15% | 1.13%(+21.0)#1 | 0.83%(+21.3)#22 |
| 24. | Brambleton | 22.12% | 1.13%(+21.0)#2 | 0.83%(+21.3)#23 |
| 25. | Mcnair | 21.03% | 1.13%(+19.9)#3 | 0.83%(+20.2)#24 |
| 26. | Fremont | 20.23% | 1.37%(+18.9)#-1 | 0.83%(+19.4)#25 |
| 27. | Weston | 20.15% | 2.97%(+17.2)#12 | 0.83%(+19.3)#26 |
| 28. | Cupertino | 19.83% | 1.37%(+18.5)#0 | 0.83%(+19.0)#27 |
| 29. | Lake Hiawatha | 19.78% | 2.97%(+16.8)#13 | 0.83%(+19.0)#28 |
| 30. | Hope | 18.72% | 2.97%(+15.8)#14 | 0.83%(+17.9)#29 |
| 31. | Harlingen | 18.65% | 2.97%(+15.7)#15 | 0.83%(+17.8)#30 |
| 32. | Bradley Gardens | 18.31% | 2.97%(+15.3)#16 | 0.83%(+17.5)#31 |
| 33. | Mountain House | 18.15% | 1.37%(+16.8)#1 | 0.83%(+17.3)#32 |
| 34. | Franklin Park | 18.05% | 2.97%(+15.1)#17 | 0.83%(+17.2)#33 |
| 35. | Camino Tassajara | 17.89% | 1.37%(+16.5)#2 | 0.83%(+17.1)#34 |
| 36. | Lamy | 17.80% | 0.14%(+17.7)#-1 | 0.83%(+17.0)#35 |
| 37. | Exton | 17.60% | 0.77%(+16.8)#0 | 0.83%(+16.8)#36 |
| 38. | Bothell East | 17.59% | 1.32%(+16.3)#-1 | 0.83%(+16.8)#37 |
| 39. | New Lisbon | 17.54% | 0.47%(+17.1)#-1 | 0.83%(+16.7)#38 |
| 40. | Milpitas | 17.02% | 1.37%(+15.6)#3 | 0.83%(+16.2)#39 |
| 41. | Secaucus | 16.69% | 2.97%(+13.7)#18 | 0.83%(+15.9)#40 |
| 42. | Dublin | 16.69% | 1.37%(+15.3)#4 | 0.83%(+15.9)#41 |
| 43. | Redmond | 16.34% | 1.32%(+15.0)#0 | 0.83%(+15.5)#42 |
| 44. | Millbourne Borough | 15.93% | 0.77%(+15.2)#1 | 0.83%(+15.1)#43 |
| 45. | Six Mile Run | 15.87% | 2.97%(+12.9)#19 | 0.83%(+15.0)#44 |
| 46. | Inverness | 15.55% | 0.38%(+15.2)#-1 | 0.83%(+14.7)#45 |
| 47. | Mill Creek East | 15.13% | 1.32%(+13.8)#1 | 0.83%(+14.3)#46 |
| 48. | Arcola | 14.98% | 1.13%(+13.8)#4 | 0.83%(+14.2)#47 |
| 49. | Plainville | 14.97% | 0.96%(+14.0)#0 | 0.83%(+14.1)#48 |
| 50. | Livingston | 14.77% | 1.37%(+13.4)#5 | 0.83%(+13.9)#49 |
| 51. | Norris Canyon | 14.57% | 1.37%(+13.2)#6 | 0.83%(+13.7)#50 |
| 52. | San Ramon | 14.34% | 1.37%(+13.0)#7 | 0.83%(+13.5)#51 |
| 53. | Sunnyvale | 14.14% | 1.37%(+12.8)#8 | 0.83%(+13.3)#52 |
| 54. | East Liberty | 14.11% | 0.56%(+13.5)#-1 | 0.83%(+13.3)#53 |
| 55. | Searingtown | 14.11% | 0.79%(+13.3)#0 | 0.83%(+13.3)#54 |
| 56. | Robbinsville Center | 13.85% | 2.97%(+10.9)#20 | 0.83%(+13.0)#55 |
| 57. | Santa Clara | 13.69% | 1.37%(+12.3)#9 | 0.83%(+12.9)#56 |
| 58. | South Barrington | 13.64% | 1.30%(+12.3)#-1 | 0.83%(+12.8)#57 |
| 59. | Pleasanton | 13.63% | 1.37%(+12.3)#10 | 0.83%(+12.8)#58 |
| 60. | Carteret Borough | 13.39% | 2.97%(+10.4)#21 | 0.83%(+12.6)#59 |
| 61. | Enlow | 13.36% | 0.77%(+12.6)#2 | 0.83%(+12.5)#60 |
| 62. | Navy | 13.11% | 1.13%(+12.0)#5 | 0.83%(+12.3)#61 |
| 63. | Hurstbourne | 12.96% | 0.30%(+12.7)#0 | 0.83%(+12.1)#62 |
| 64. | Wyndham | 12.96% | 1.13%(+11.8)#6 | 0.83%(+12.1)#63 |
| 65. | Menlo Park Terrace | 12.93% | 2.97%(+9.96)#22 | 0.83%(+12.1)#64 |
| 66. | Farmington | 12.92% | 0.77%(+12.2)#-1 | 0.83%(+12.1)#65 |
| 67. | Innsbrook | 12.88% | 1.13%(+11.7)#7 | 0.83%(+12.0)#66 |
| 68. | Sunnyvale | 12.59% | 1.05%(+11.5)#0 | 0.83%(+11.8)#67 |
| 69. | Kendall Park | 12.56% | 2.97%(+9.59)#23 | 0.83%(+11.7)#68 |
| 70. | Goose Creek | 12.48% | 1.13%(+11.3)#8 | 0.83%(+11.7)#69 |
| 71. | Floris | 12.36% | 1.13%(+11.2)#9 | 0.83%(+11.5)#70 |
| 72. | Coppell | 12.34% | 1.05%(+11.3)#1 | 0.83%(+11.5)#71 |
| 73. | Franklin Center | 12.22% | 2.97%(+9.25)#24 | 0.83%(+11.4)#72 |
| 74. | Union Hill Novelty Hill | 12.14% | 1.32%(+10.8)#2 | 0.83%(+11.3)#73 |
| 75. | Scottdale | 11.90% | 0.96%(+10.9)#1 | 0.83%(+11.1)#74 |
| 76. | Maryland Heights | 11.87% | 0.37%(+11.5)#-1 | 0.83%(+11.0)#75 |
| 77. | Pomona | 11.86% | 2.97%(+8.89)#25 | 0.83%(+11.0)#76 |
| 78. | Short Pump | 11.83% | 1.13%(+10.7)#10 | 0.83%(+11.0)#77 |
| 79. | Sixteen Mile Stand | 11.83% | 0.56%(+11.3)#0 | 0.83%(+11.0)#78 |
| 80. | Bethany | 11.75% | 0.46%(+11.3)#-1 | 0.83%(+10.9)#79 |
| 81. | Echelon | 11.73% | 2.97%(+8.76)#26 | 0.83%(+10.9)#80 |
| 82. | Voorhees | 11.68% | 2.97%(+8.71)#27 | 0.83%(+10.9)#81 |
| 83. | Princeton Junction | 11.62% | 2.97%(+8.65)#28 | 0.83%(+10.8)#82 |
| 84. | Hicksville | 11.59% | 0.79%(+10.8)#1 | 0.83%(+10.8)#83 |
| 85. | Audubon | 11.55% | 0.77%(+10.8)#3 | 0.83%(+10.7)#84 |
| 86. | Oak Grove | 11.53% | 1.13%(+10.4)#11 | 0.83%(+10.7)#85 |
| 87. | Herricks | 11.48% | 0.79%(+10.7)#2 | 0.83%(+10.7)#86 |
| 88. | Avenel | 11.47% | 2.97%(+8.50)#29 | 0.83%(+10.6)#87 |
| 89. | Sammamish | 11.37% | 1.32%(+10.1)#3 | 0.83%(+10.5)#88 |
| 90. | North New Hyde Park | 11.33% | 0.79%(+10.5)#3 | 0.83%(+10.5)#89 |
| 91. | Sierra Ridge | 11.29% | 0.38%(+10.9)#0 | 0.83%(+10.5)#90 |
| 92. | Muttontown | 11.20% | 0.79%(+10.4)#4 | 0.83%(+10.4)#91 |
| 93. | South Riding | 11.00% | 1.13%(+9.87)#12 | 0.83%(+10.2)#92 |
| 94. | Garden City Park | 10.97% | 0.79%(+10.2)#5 | 0.83%(+10.1)#93 |
| 95. | Pimmit Hills | 10.89% | 1.13%(+9.76)#13 | 0.83%(+10.1)#94 |
| 96. | Blackwells Mills | 10.84% | 2.97%(+7.87)#30 | 0.83%(+10.0)#95 |
| 97. | Ellenton | 10.81% | 0.96%(+9.85)#2 | 0.83%(+9.99)#96 |
| 98. | Foster City | 10.81% | 1.37%(+9.44)#11 | 0.83%(+9.98)#97 |
| 99. | Greenville | 10.80% | 1.14%(+9.66)#-1 | 0.83%(+9.97)#98 |
| 100. | Frisco | 10.78% | 1.05%(+9.74)#2 | 0.83%(+9.96)#99 |
Common Questions
What are the Top 10 Cities with the Highest Percentage of Immigrants from India in the United States?
Top 10 Cities with the Highest Percentage of Immigrants from India in the United States are:
#1
36.72%
#2
36.41%
#3
34.84%
#4
33.85%
#5
32.07%
#6
31.09%
#7
29.98%
#8
29.97%
#9
29.95%
#10
29.66%
What city has the Highest Percentage of Immigrants from India in the United States?
Hurstbourne Acres has the Highest Percentage of Immigrants from India in the United States with 36.72%.
What is the Percentage of Immigrants from India in the United States?
Percentage of Immigrants from India in the United States is 0.83%.