Colleton County, SC Map & Demographics
Colleton County Map
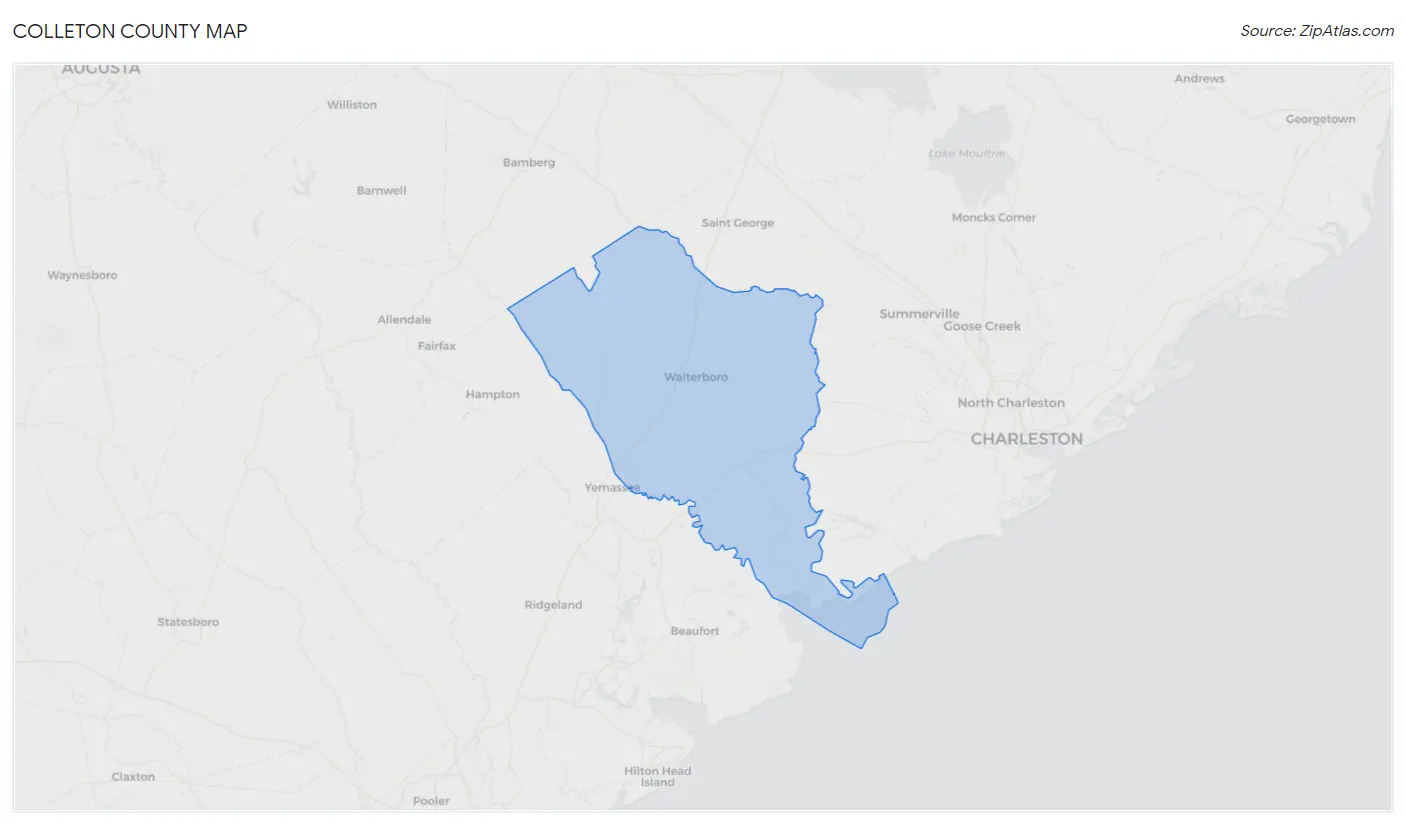
Colleton County Overview
$26,253
PER CAPITA INCOME
$58,559
AVG FAMILY INCOME
$46,795
AVG HOUSEHOLD INCOME
14.6%
WAGE / INCOME GAP [ % ]
85.4¢/ $1
WAGE / INCOME GAP [ $ ]
$12,292
FAMILY INCOME DEFICIT
0.46
INEQUALITY / GINI INDEX
38,561
TOTAL POPULATION
18,675
MALE POPULATION
19,886
FEMALE POPULATION
93.91
MALES / 100 FEMALES
106.48
FEMALES / 100 MALES
41.6
MEDIAN AGE
3.1
AVG FAMILY SIZE
2.4
AVG HOUSEHOLD SIZE
17,214
LABOR FORCE [ PEOPLE ]
55.7%
PERCENT IN LABOR FORCE
8.6%
UNEMPLOYMENT RATE
Colleton County Area Codes
Income in Colleton County
Income Overview in Colleton County
Per Capita Income in Colleton County is $26,253, while median incomes of families and households are $58,559 and $46,795 respectively.
| Characteristic | Number | Measure |
| Per Capita Income | 38,561 | $26,253 |
| Median Family Income | 9,692 | $58,559 |
| Mean Family Income | 9,692 | $76,457 |
| Median Household Income | 15,656 | $46,795 |
| Mean Household Income | 15,656 | $64,470 |
| Income Deficit | 9,692 | $12,292 |
| Wage / Income Gap (%) | 38,561 | 14.63% |
| Wage / Income Gap ($) | 38,561 | 85.37¢ per $1 |
| Gini / Inequality Index | 38,561 | 0.46 |
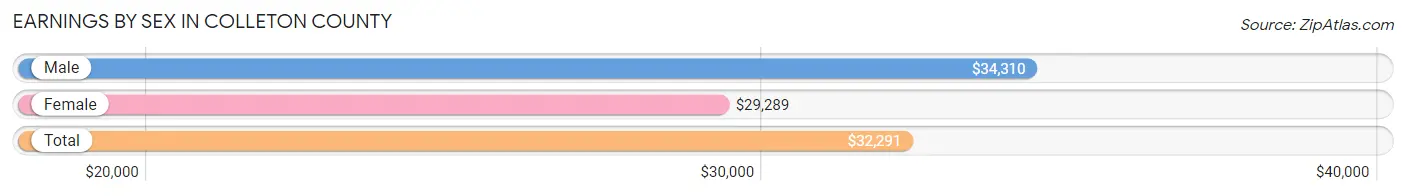
Earnings by Sex in Colleton County
Average Earnings in Colleton County are $32,291, $34,310 for men and $29,289 for women, a difference of 14.6%.
| Sex | Number | Average Earnings |
| Male | 9,043 (51.7%) | $34,310 |
| Female | 8,453 (48.3%) | $29,289 |
| Total | 17,496 (100.0%) | $32,291 |
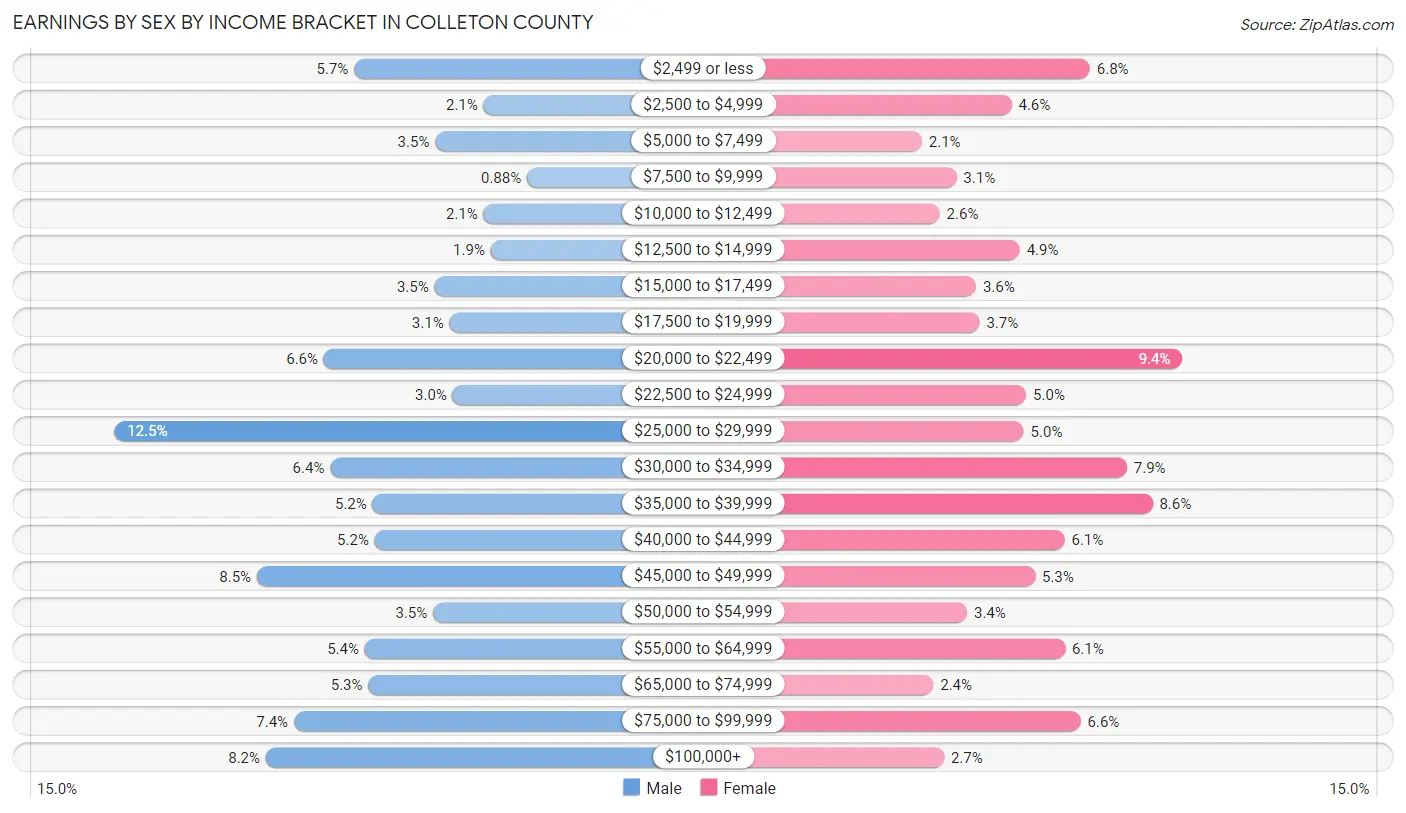
Earnings by Sex by Income Bracket in Colleton County
The most common earnings brackets in Colleton County are $25,000 to $29,999 for men (1,129 | 12.5%) and $20,000 to $22,499 for women (797 | 9.4%).
| Income | Male | Female |
| $2,499 or less | 519 (5.7%) | 577 (6.8%) |
| $2,500 to $4,999 | 190 (2.1%) | 391 (4.6%) |
| $5,000 to $7,499 | 313 (3.5%) | 178 (2.1%) |
| $7,500 to $9,999 | 80 (0.9%) | 260 (3.1%) |
| $10,000 to $12,499 | 190 (2.1%) | 221 (2.6%) |
| $12,500 to $14,999 | 172 (1.9%) | 411 (4.9%) |
| $15,000 to $17,499 | 315 (3.5%) | 307 (3.6%) |
| $17,500 to $19,999 | 277 (3.1%) | 315 (3.7%) |
| $20,000 to $22,499 | 596 (6.6%) | 797 (9.4%) |
| $22,500 to $24,999 | 269 (3.0%) | 426 (5.0%) |
| $25,000 to $29,999 | 1,129 (12.5%) | 420 (5.0%) |
| $30,000 to $34,999 | 580 (6.4%) | 665 (7.9%) |
| $35,000 to $39,999 | 472 (5.2%) | 726 (8.6%) |
| $40,000 to $44,999 | 467 (5.2%) | 517 (6.1%) |
| $45,000 to $49,999 | 766 (8.5%) | 447 (5.3%) |
| $50,000 to $54,999 | 318 (3.5%) | 286 (3.4%) |
| $55,000 to $64,999 | 492 (5.4%) | 518 (6.1%) |
| $65,000 to $74,999 | 483 (5.3%) | 205 (2.4%) |
| $75,000 to $99,999 | 672 (7.4%) | 555 (6.6%) |
| $100,000+ | 743 (8.2%) | 231 (2.7%) |
| Total | 9,043 (100.0%) | 8,453 (100.0%) |
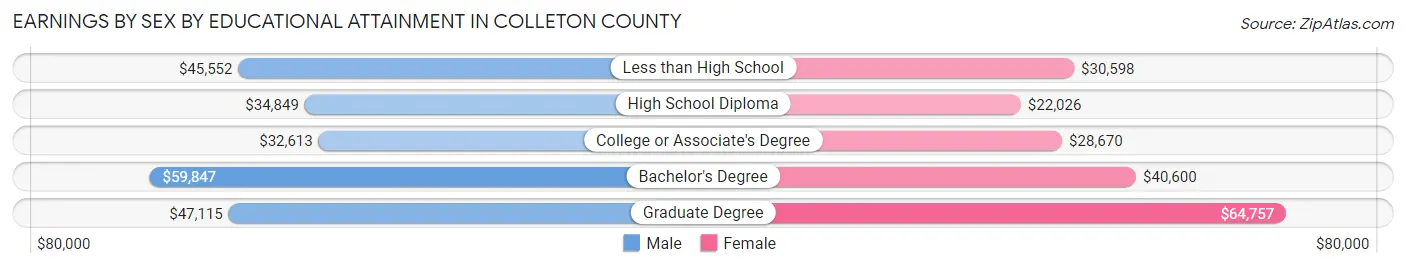
Earnings by Sex by Educational Attainment in Colleton County
Average earnings in Colleton County are $37,160 for men and $31,634 for women, a difference of 14.9%. Men with an educational attainment of bachelor's degree enjoy the highest average annual earnings of $59,847, while those with college or associate's degree education earn the least with $32,613. Women with an educational attainment of graduate degree earn the most with the average annual earnings of $64,757, while those with high school diploma education have the smallest earnings of $22,026.
| Educational Attainment | Male Income | Female Income |
| Less than High School | $45,552 | $30,598 |
| High School Diploma | $34,849 | $22,026 |
| College or Associate's Degree | $32,613 | $28,670 |
| Bachelor's Degree | $59,847 | $40,600 |
| Graduate Degree | $47,115 | $64,757 |
| Total | $37,160 | $31,634 |
Family Income in Colleton County
Family Income Brackets in Colleton County
According to the Colleton County family income data, there are 1,783 families falling into the $50,000 to $74,999 income range, which is the most common income bracket and makes up 18.4% of all families. Conversely, the $150,000 to $199,999 income bracket is the least frequent group with only 320 families (3.3%) belonging to this category.
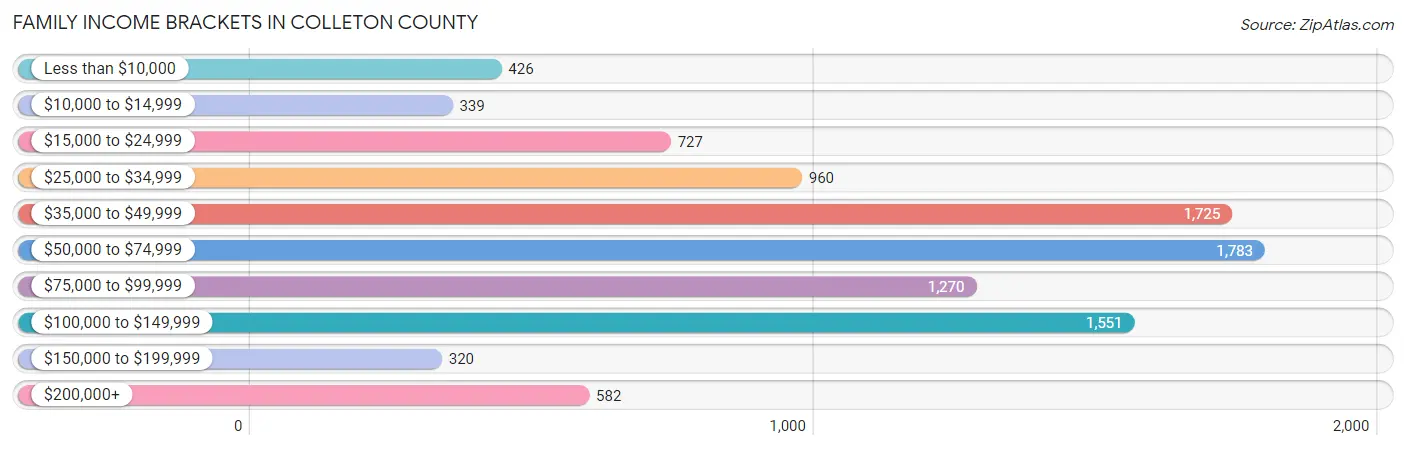
| Income Bracket | # Families | % Families |
| Less than $10,000 | 426 | 4.4% |
| $10,000 to $14,999 | 339 | 3.5% |
| $15,000 to $24,999 | 727 | 7.5% |
| $25,000 to $34,999 | 960 | 9.9% |
| $35,000 to $49,999 | 1,725 | 17.8% |
| $50,000 to $74,999 | 1,783 | 18.4% |
| $75,000 to $99,999 | 1,270 | 13.1% |
| $100,000 to $149,999 | 1,551 | 16.0% |
| $150,000 to $199,999 | 320 | 3.3% |
| $200,000+ | 582 | 6.0% |
Family Income by Famaliy Size in Colleton County
6-person families (217 | 2.2%) account for the highest median family income in Colleton County with $81,521 per family, while 2-person families (5,069 | 52.3%) have the highest median income of $25,879 per family member.
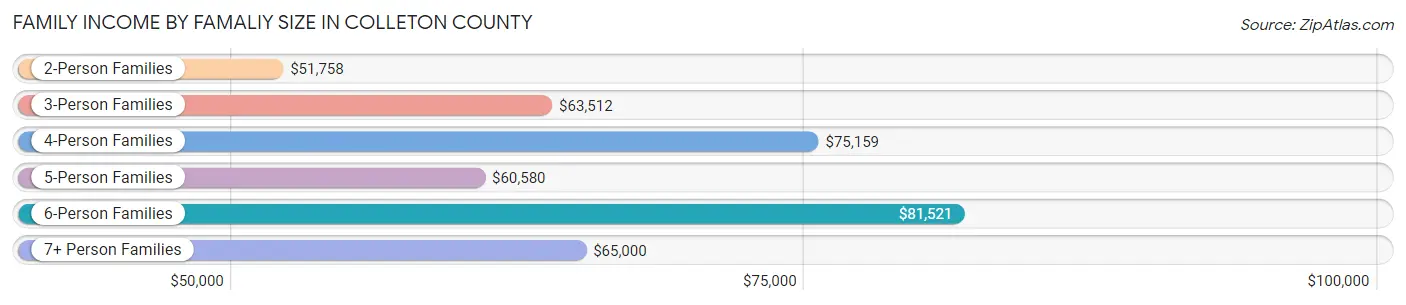
| Income Bracket | # Families | Median Income |
| 2-Person Families | 5,069 (52.3%) | $51,758 |
| 3-Person Families | 2,435 (25.1%) | $63,512 |
| 4-Person Families | 1,064 (11.0%) | $75,159 |
| 5-Person Families | 645 (6.7%) | $60,580 |
| 6-Person Families | 217 (2.2%) | $81,521 |
| 7+ Person Families | 262 (2.7%) | $65,000 |
| Total | 9,692 (100.0%) | $58,559 |
Family Income by Number of Earners in Colleton County
The median family income in Colleton County is $58,559, with families comprising 3+ earners (834) having the highest median family income of $94,939, while families with no earners (2,172) have the lowest median family income of $30,583, accounting for 8.6% and 22.4% of families, respectively.
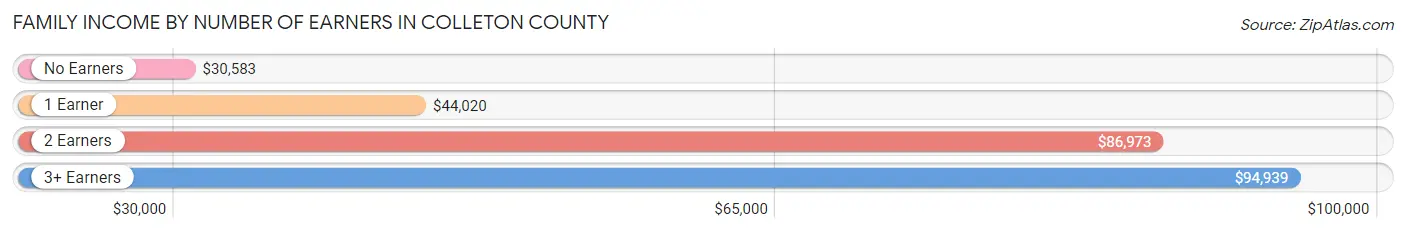
| Number of Earners | # Families | Median Income |
| No Earners | 2,172 (22.4%) | $30,583 |
| 1 Earner | 3,140 (32.4%) | $44,020 |
| 2 Earners | 3,546 (36.6%) | $86,973 |
| 3+ Earners | 834 (8.6%) | $94,939 |
| Total | 9,692 (100.0%) | $58,559 |
Household Income in Colleton County
Household Income Brackets in Colleton County
With 2,677 households falling in the category, the $35,000 to $49,999 income range is the most frequent in Colleton County, accounting for 17.1% of all households. In contrast, only 454 households (2.9%) fall into the $150,000 to $199,999 income bracket, making it the least populous group.
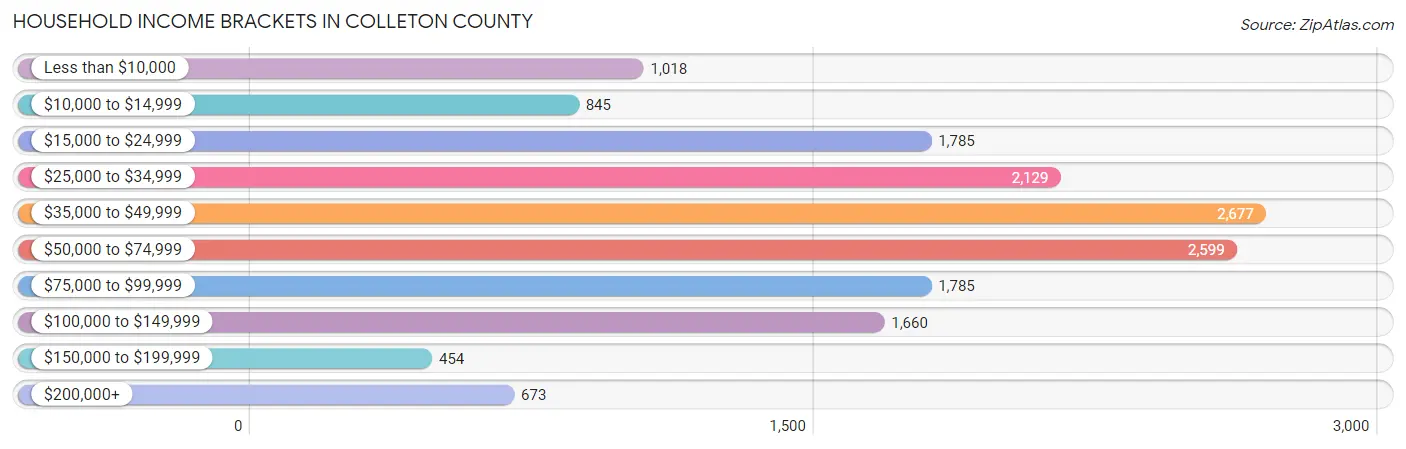
| Income Bracket | # Households | % Households |
| Less than $10,000 | 1,018 | 6.5% |
| $10,000 to $14,999 | 845 | 5.4% |
| $15,000 to $24,999 | 1,785 | 11.4% |
| $25,000 to $34,999 | 2,129 | 13.6% |
| $35,000 to $49,999 | 2,677 | 17.1% |
| $50,000 to $74,999 | 2,599 | 16.6% |
| $75,000 to $99,999 | 1,785 | 11.4% |
| $100,000 to $149,999 | 1,660 | 10.6% |
| $150,000 to $199,999 | 454 | 2.9% |
| $200,000+ | 673 | 4.3% |
Household Income by Householder Age in Colleton County
The median household income in Colleton County is $46,795, with the highest median household income of $53,519 found in the 25 to 44 years age bracket for the primary householder. A total of 4,000 households (25.6%) fall into this category. Meanwhile, the 15 to 24 years age bracket for the primary householder has the lowest median household income of $0, with 483 households (3.1%) in this group.
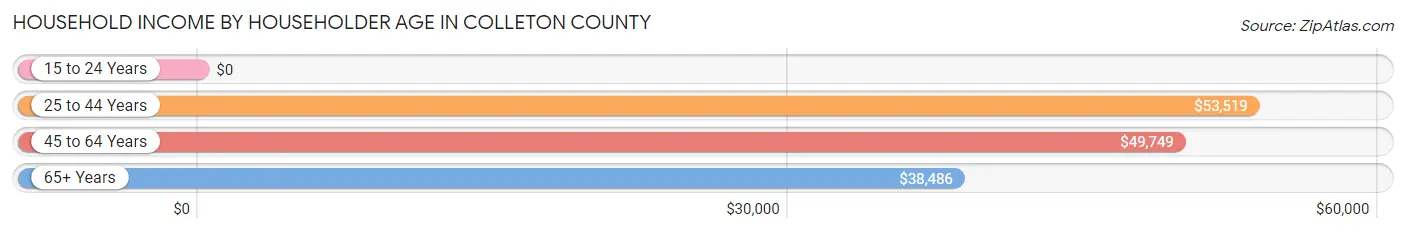
| Income Bracket | # Households | Median Income |
| 15 to 24 Years | 483 (3.1%) | $0 |
| 25 to 44 Years | 4,000 (25.6%) | $53,519 |
| 45 to 64 Years | 6,391 (40.8%) | $49,749 |
| 65+ Years | 4,782 (30.5%) | $38,486 |
| Total | 15,656 (100.0%) | $46,795 |
Poverty in Colleton County
Income Below Poverty by Sex and Age in Colleton County
With 14.0% poverty level for males and 19.0% for females among the residents of Colleton County, 18 to 24 year old males and 5 year old females are the most vulnerable to poverty, with 351 males (23.6%) and 138 females (46.0%) in their respective age groups living below the poverty level.

| Age Bracket | Male | Female |
| Under 5 Years | 31 (3.1%) | 369 (35.4%) |
| 5 Years | 34 (20.5%) | 138 (46.0%) |
| 6 to 11 Years | 316 (23.1%) | 439 (25.0%) |
| 12 to 14 Years | 91 (11.9%) | 147 (32.9%) |
| 15 Years | 34 (14.5%) | 67 (26.1%) |
| 16 and 17 Years | 69 (12.8%) | 99 (22.6%) |
| 18 to 24 Years | 351 (23.6%) | 238 (15.9%) |
| 25 to 34 Years | 227 (9.4%) | 448 (19.3%) |
| 35 to 44 Years | 198 (9.6%) | 362 (16.4%) |
| 45 to 54 Years | 421 (19.4%) | 360 (14.7%) |
| 55 to 64 Years | 527 (19.6%) | 536 (18.3%) |
| 65 to 74 Years | 137 (6.7%) | 247 (10.1%) |
| 75 Years and over | 67 (7.1%) | 306 (18.4%) |
| Total | 2,503 (14.0%) | 3,756 (19.0%) |
Income Above Poverty by Sex and Age in Colleton County
According to the poverty statistics in Colleton County, males aged under 5 years and females aged 65 to 74 years are the age groups that are most secure financially, with 96.9% of males and 89.9% of females in these age groups living above the poverty line.
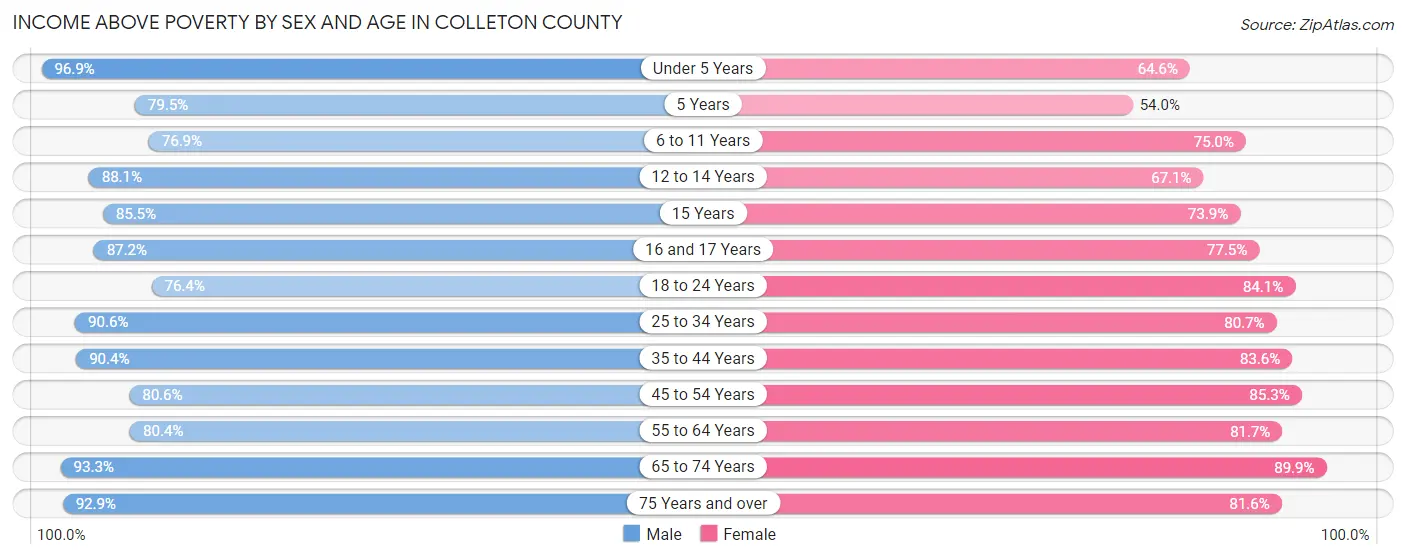
| Age Bracket | Male | Female |
| Under 5 Years | 959 (96.9%) | 673 (64.6%) |
| 5 Years | 132 (79.5%) | 162 (54.0%) |
| 6 to 11 Years | 1,054 (76.9%) | 1,316 (75.0%) |
| 12 to 14 Years | 672 (88.1%) | 300 (67.1%) |
| 15 Years | 200 (85.5%) | 190 (73.9%) |
| 16 and 17 Years | 469 (87.2%) | 340 (77.4%) |
| 18 to 24 Years | 1,138 (76.4%) | 1,261 (84.1%) |
| 25 to 34 Years | 2,191 (90.6%) | 1,868 (80.7%) |
| 35 to 44 Years | 1,867 (90.4%) | 1,840 (83.6%) |
| 45 to 54 Years | 1,745 (80.6%) | 2,095 (85.3%) |
| 55 to 64 Years | 2,162 (80.4%) | 2,400 (81.7%) |
| 65 to 74 Years | 1,907 (93.3%) | 2,207 (89.9%) |
| 75 Years and over | 879 (92.9%) | 1,359 (81.6%) |
| Total | 15,375 (86.0%) | 16,011 (81.0%) |
Income Below Poverty Among Married-Couple Families in Colleton County
The poverty statistics for married-couple families in Colleton County show that 7.2% or 458 of the total 6,397 families live below the poverty line. Families with 5 or more children have the highest poverty rate of 72.4%, comprising of 63 families. On the other hand, families with 1 or 2 children have the lowest poverty rate of 4.1%, which includes 69 families.
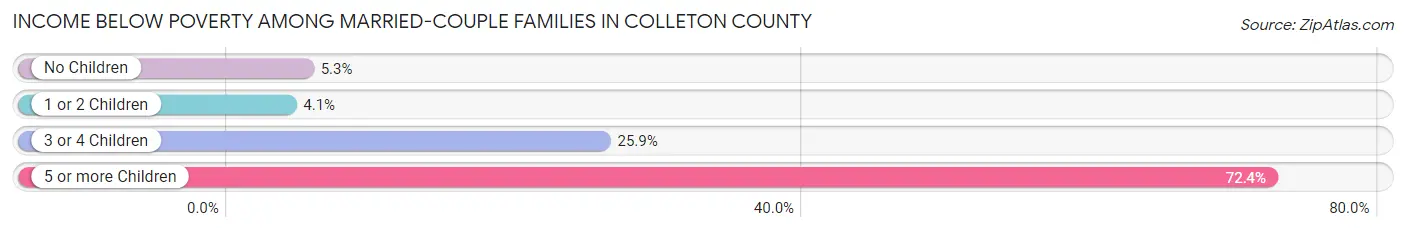
| Children | Above Poverty | Below Poverty |
| No Children | 3,987 (94.7%) | 222 (5.3%) |
| 1 or 2 Children | 1,631 (95.9%) | 69 (4.1%) |
| 3 or 4 Children | 297 (74.1%) | 104 (25.9%) |
| 5 or more Children | 24 (27.6%) | 63 (72.4%) |
| Total | 5,939 (92.8%) | 458 (7.2%) |
Income Below Poverty Among Single-Parent Households in Colleton County
According to the poverty data in Colleton County, 21.0% or 177 single-father households and 25.7% or 629 single-mother households are living below the poverty line. Among single-father households, those with no children have the highest poverty rate, with 139 households (27.7%) experiencing poverty. Likewise, among single-mother households, those with 5 or more children have the highest poverty rate, with 43 households (78.2%) falling below the poverty line.
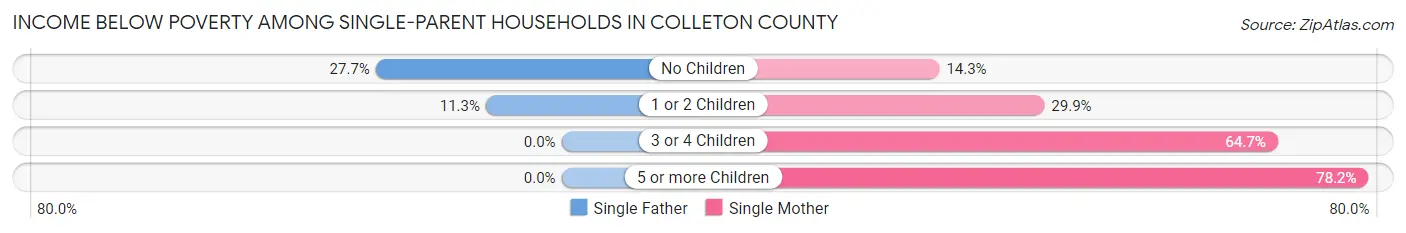
| Children | Single Father | Single Mother |
| No Children | 139 (27.7%) | 156 (14.3%) |
| 1 or 2 Children | 38 (11.3%) | 355 (29.9%) |
| 3 or 4 Children | 0 (0.0%) | 75 (64.7%) |
| 5 or more Children | 0 (0.0%) | 43 (78.2%) |
| Total | 177 (21.0%) | 629 (25.7%) |
Income Below Poverty Among Married-Couple vs Single-Parent Households in Colleton County
The poverty data for Colleton County shows that 458 of the married-couple family households (7.2%) and 806 of the single-parent households (24.5%) are living below the poverty level. Within the married-couple family households, those with 5 or more children have the highest poverty rate, with 63 households (72.4%) falling below the poverty line. Among the single-parent households, those with 5 or more children have the highest poverty rate, with 43 household (78.2%) living below poverty.
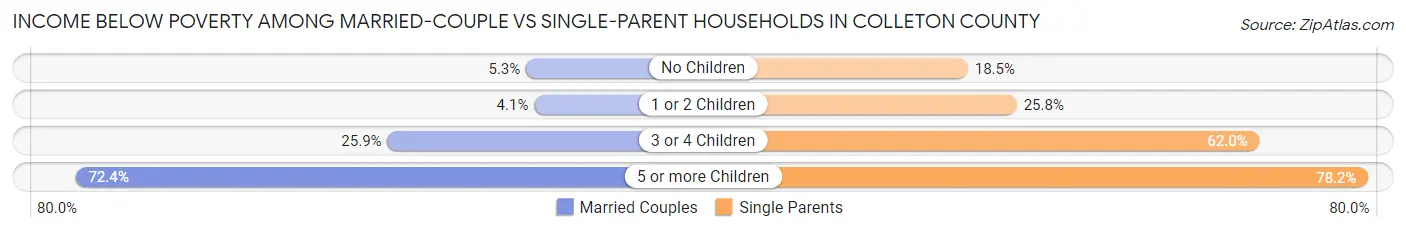
| Children | Married-Couple Families | Single-Parent Households |
| No Children | 222 (5.3%) | 295 (18.5%) |
| 1 or 2 Children | 69 (4.1%) | 393 (25.8%) |
| 3 or 4 Children | 104 (25.9%) | 75 (62.0%) |
| 5 or more Children | 63 (72.4%) | 43 (78.2%) |
| Total | 458 (7.2%) | 806 (24.5%) |
Race in Colleton County
The most populous races in Colleton County are White / Caucasian (22,245 | 57.7%), Black / African American (13,432 | 34.8%), and Two or more Races (1,620 | 4.2%).
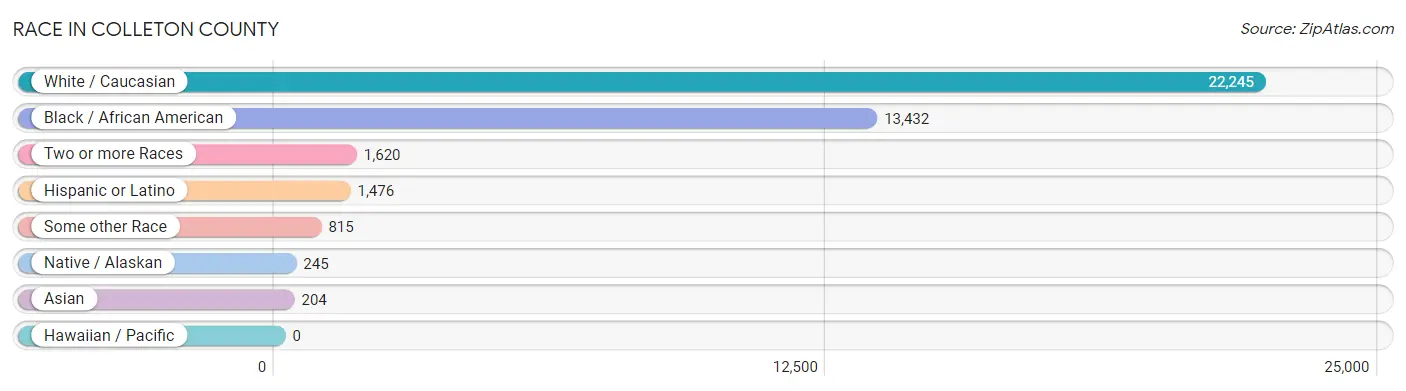
| Race | # Population | % Population |
| Asian | 204 | 0.5% |
| Black / African American | 13,432 | 34.8% |
| Hawaiian / Pacific | 0 | 0.0% |
| Hispanic or Latino | 1,476 | 3.8% |
| Native / Alaskan | 245 | 0.6% |
| White / Caucasian | 22,245 | 57.7% |
| Two or more Races | 1,620 | 4.2% |
| Some other Race | 815 | 2.1% |
| Total | 38,561 | 100.0% |
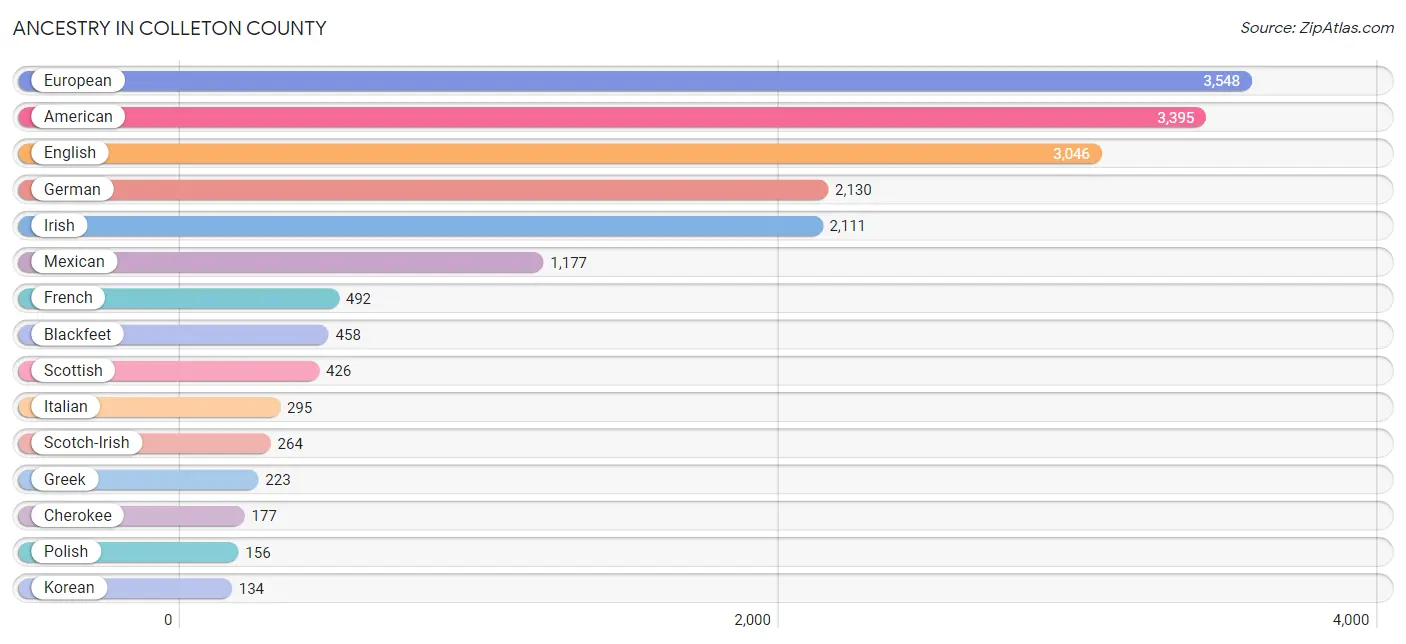
Ancestry in Colleton County
The most populous ancestries reported in Colleton County are European (3,548 | 9.2%), American (3,395 | 8.8%), English (3,046 | 7.9%), German (2,130 | 5.5%), and Irish (2,111 | 5.5%), together accounting for 36.9% of all Colleton County residents.
| Ancestry | # Population | % Population |
| African | 47 | 0.1% |
| American | 3,395 | 8.8% |
| Arab | 44 | 0.1% |
| Argentinean | 1 | 0.0% |
| Austrian | 49 | 0.1% |
| Basque | 1 | 0.0% |
| Belgian | 4 | 0.0% |
| Blackfeet | 458 | 1.2% |
| British | 40 | 0.1% |
| Burmese | 10 | 0.0% |
| Canadian | 23 | 0.1% |
| Celtic | 37 | 0.1% |
| Cherokee | 177 | 0.5% |
| Chickasaw | 27 | 0.1% |
| Chippewa | 8 | 0.0% |
| Creek | 33 | 0.1% |
| Croatian | 8 | 0.0% |
| Cuban | 1 | 0.0% |
| Czech | 51 | 0.1% |
| Czechoslovakian | 8 | 0.0% |
| Danish | 17 | 0.0% |
| Dutch | 108 | 0.3% |
| Eastern European | 21 | 0.1% |
| English | 3,046 | 7.9% |
| European | 3,548 | 9.2% |
| Finnish | 2 | 0.0% |
| French | 492 | 1.3% |
| French Canadian | 15 | 0.0% |
| German | 2,130 | 5.5% |
| Greek | 223 | 0.6% |
| Hungarian | 45 | 0.1% |
| Icelander | 72 | 0.2% |
| Irish | 2,111 | 5.5% |
| Italian | 295 | 0.8% |
| Jamaican | 2 | 0.0% |
| Korean | 134 | 0.4% |
| Lithuanian | 6 | 0.0% |
| Mexican | 1,177 | 3.0% |
| Mexican American Indian | 17 | 0.0% |
| Native Hawaiian | 50 | 0.1% |
| Northern European | 4 | 0.0% |
| Norwegian | 56 | 0.2% |
| Polish | 156 | 0.4% |
| Portuguese | 120 | 0.3% |
| Puerto Rican | 86 | 0.2% |
| Russian | 13 | 0.0% |
| Scandinavian | 9 | 0.0% |
| Scotch-Irish | 264 | 0.7% |
| Scottish | 426 | 1.1% |
| Slavic | 1 | 0.0% |
| Slovak | 7 | 0.0% |
| South American | 1 | 0.0% |
| Spaniard | 22 | 0.1% |
| Spanish | 6 | 0.0% |
| Sri Lankan | 26 | 0.1% |
| Subsaharan African | 49 | 0.1% |
| Swedish | 13 | 0.0% |
| Swiss | 53 | 0.1% |
| Syrian | 44 | 0.1% |
| Thai | 75 | 0.2% |
| Ukrainian | 9 | 0.0% |
| Welsh | 8 | 0.0% | View All 62 Rows |
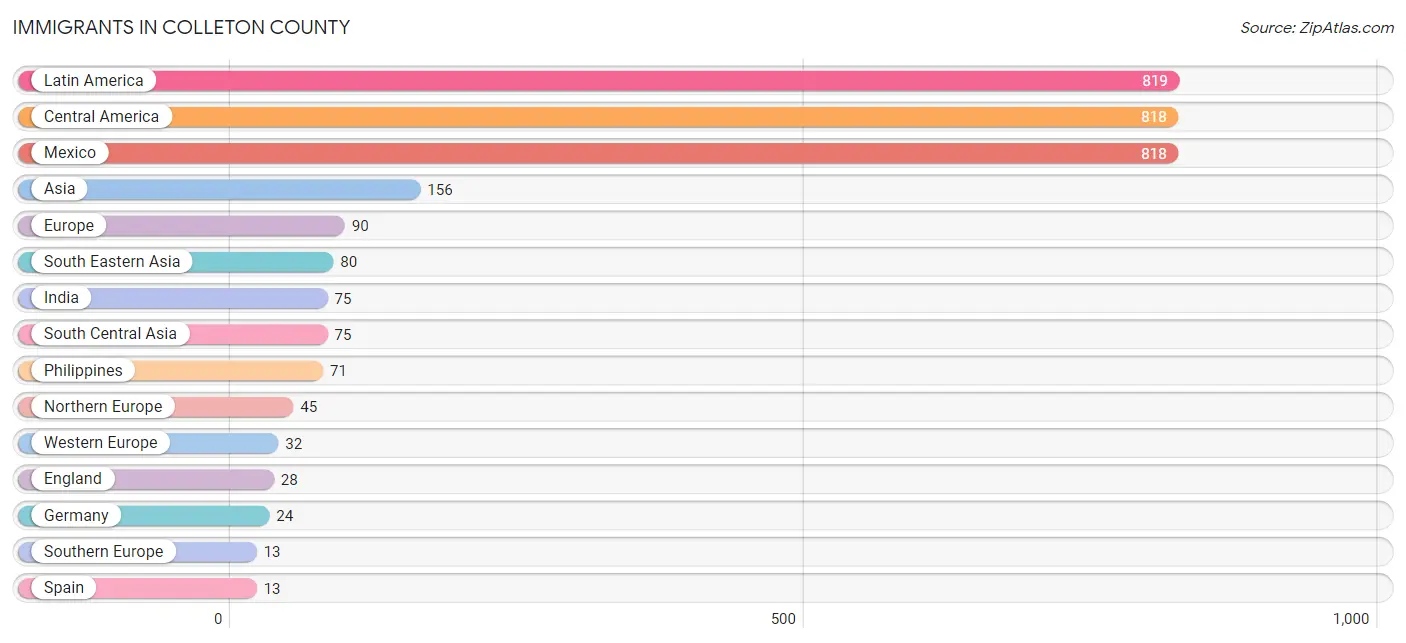
Immigrants in Colleton County
The most numerous immigrant groups reported in Colleton County came from Latin America (819 | 2.1%), Central America (818 | 2.1%), Mexico (818 | 2.1%), Asia (156 | 0.4%), and Europe (90 | 0.2%), together accounting for 7.0% of all Colleton County residents.
| Immigration Origin | # Population | % Population |
| Argentina | 1 | 0.0% |
| Asia | 156 | 0.4% |
| Australia | 11 | 0.0% |
| Canada | 2 | 0.0% |
| Central America | 818 | 2.1% |
| China | 1 | 0.0% |
| Eastern Asia | 1 | 0.0% |
| England | 28 | 0.1% |
| Europe | 90 | 0.2% |
| Germany | 24 | 0.1% |
| Hong Kong | 1 | 0.0% |
| India | 75 | 0.2% |
| Ireland | 9 | 0.0% |
| Latin America | 819 | 2.1% |
| Mexico | 818 | 2.1% |
| Netherlands | 8 | 0.0% |
| Northern Europe | 45 | 0.1% |
| Oceania | 11 | 0.0% |
| Philippines | 71 | 0.2% |
| Scotland | 3 | 0.0% |
| South America | 1 | 0.0% |
| South Central Asia | 75 | 0.2% |
| South Eastern Asia | 80 | 0.2% |
| Southern Europe | 13 | 0.0% |
| Spain | 13 | 0.0% |
| Vietnam | 9 | 0.0% |
| Western Europe | 32 | 0.1% | View All 27 Rows |
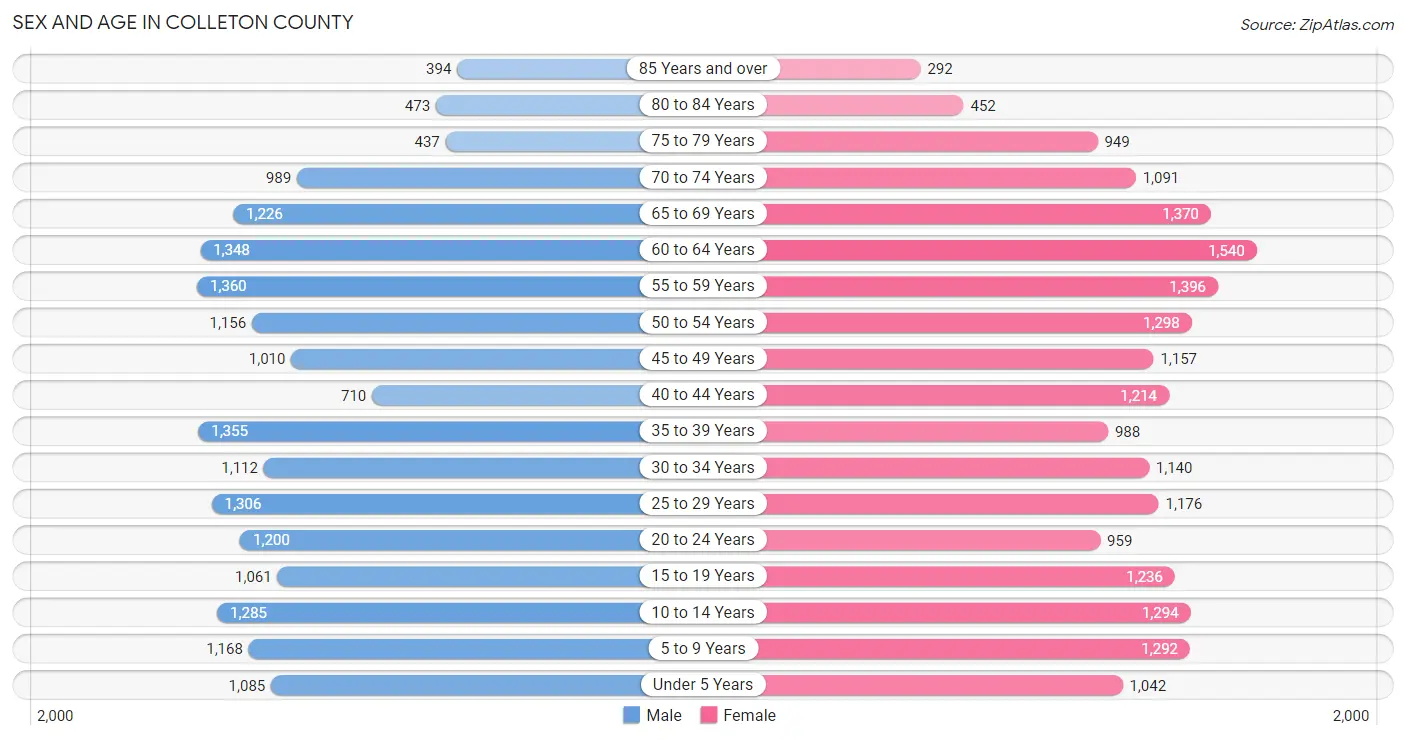
Sex and Age in Colleton County
Sex and Age in Colleton County
The most populous age groups in Colleton County are 55 to 59 Years (1,360 | 7.3%) for men and 60 to 64 Years (1,540 | 7.7%) for women.
| Age Bracket | Male | Female |
| Under 5 Years | 1,085 (5.8%) | 1,042 (5.2%) |
| 5 to 9 Years | 1,168 (6.2%) | 1,292 (6.5%) |
| 10 to 14 Years | 1,285 (6.9%) | 1,294 (6.5%) |
| 15 to 19 Years | 1,061 (5.7%) | 1,236 (6.2%) |
| 20 to 24 Years | 1,200 (6.4%) | 959 (4.8%) |
| 25 to 29 Years | 1,306 (7.0%) | 1,176 (5.9%) |
| 30 to 34 Years | 1,112 (5.9%) | 1,140 (5.7%) |
| 35 to 39 Years | 1,355 (7.3%) | 988 (5.0%) |
| 40 to 44 Years | 710 (3.8%) | 1,214 (6.1%) |
| 45 to 49 Years | 1,010 (5.4%) | 1,157 (5.8%) |
| 50 to 54 Years | 1,156 (6.2%) | 1,298 (6.5%) |
| 55 to 59 Years | 1,360 (7.3%) | 1,396 (7.0%) |
| 60 to 64 Years | 1,348 (7.2%) | 1,540 (7.7%) |
| 65 to 69 Years | 1,226 (6.6%) | 1,370 (6.9%) |
| 70 to 74 Years | 989 (5.3%) | 1,091 (5.5%) |
| 75 to 79 Years | 437 (2.3%) | 949 (4.8%) |
| 80 to 84 Years | 473 (2.5%) | 452 (2.3%) |
| 85 Years and over | 394 (2.1%) | 292 (1.5%) |
| Total | 18,675 (100.0%) | 19,886 (100.0%) |
Families and Households in Colleton County
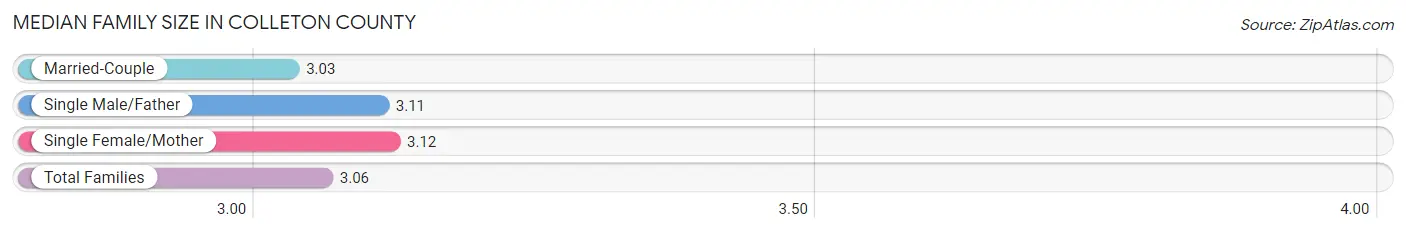
Median Family Size in Colleton County
The median family size in Colleton County is 3.06 persons per family, with single female/mother families (2,451 | 25.3%) accounting for the largest median family size of 3.12 persons per family. On the other hand, married-couple families (6,397 | 66.0%) represent the smallest median family size with 3.03 persons per family.
| Family Type | # Families | Family Size |
| Married-Couple | 6,397 (66.0%) | 3.03 |
| Single Male/Father | 844 (8.7%) | 3.11 |
| Single Female/Mother | 2,451 (25.3%) | 3.12 |
| Total Families | 9,692 (100.0%) | 3.06 |
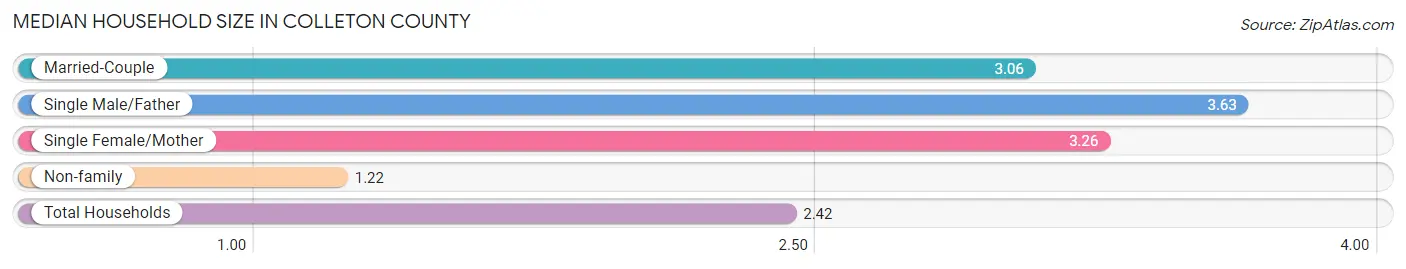
Median Household Size in Colleton County
The median household size in Colleton County is 2.42 persons per household, with single male/father households (844 | 5.4%) accounting for the largest median household size of 3.63 persons per household. non-family households (5,964 | 38.1%) represent the smallest median household size with 1.22 persons per household.
| Household Type | # Households | Household Size |
| Married-Couple | 6,397 (40.9%) | 3.06 |
| Single Male/Father | 844 (5.4%) | 3.63 |
| Single Female/Mother | 2,451 (15.7%) | 3.26 |
| Non-family | 5,964 (38.1%) | 1.22 |
| Total Households | 15,656 (100.0%) | 2.42 |
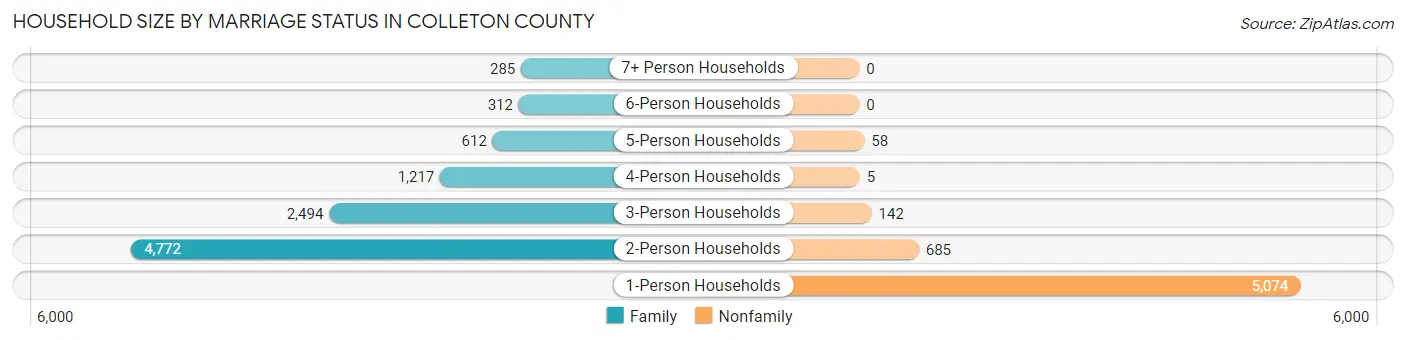
Household Size by Marriage Status in Colleton County
Out of a total of 15,656 households in Colleton County, 9,692 (61.9%) are family households, while 5,964 (38.1%) are nonfamily households. The most numerous type of family households are 2-person households, comprising 4,772, and the most common type of nonfamily households are 1-person households, comprising 5,074.
| Household Size | Family Households | Nonfamily Households |
| 1-Person Households | - | 5,074 (32.4%) |
| 2-Person Households | 4,772 (30.5%) | 685 (4.4%) |
| 3-Person Households | 2,494 (15.9%) | 142 (0.9%) |
| 4-Person Households | 1,217 (7.8%) | 5 (0.0%) |
| 5-Person Households | 612 (3.9%) | 58 (0.4%) |
| 6-Person Households | 312 (2.0%) | 0 (0.0%) |
| 7+ Person Households | 285 (1.8%) | 0 (0.0%) |
| Total | 9,692 (61.9%) | 5,964 (38.1%) |
Female Fertility in Colleton County
Fertility by Age in Colleton County
Average fertility rate in Colleton County is 54.0 births per 1,000 women. Women in the age bracket of 20 to 34 years have the highest fertility rate with 114.0 births per 1,000 women. Women in the age bracket of 20 to 34 years acount for 86.3% of all women with births.
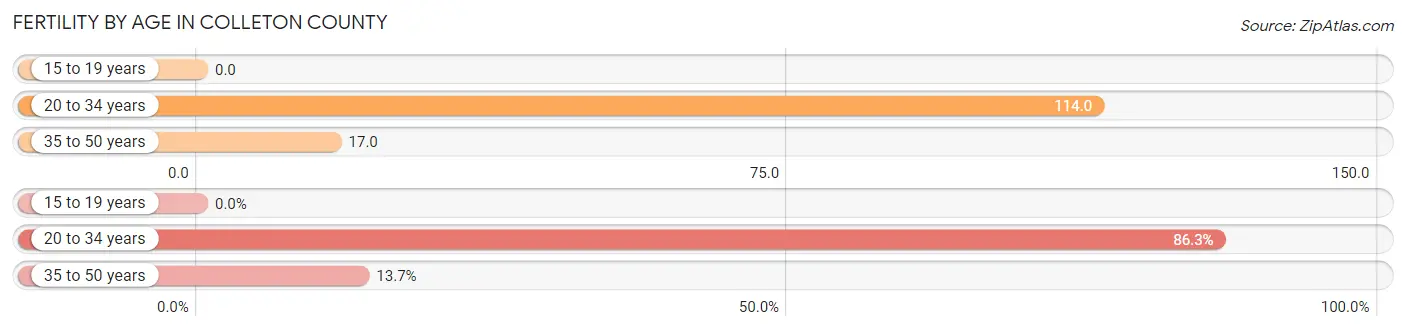
| Age Bracket | Women with Births | Births / 1,000 Women |
| 15 to 19 years | 0 (0.0%) | 0.0 |
| 20 to 34 years | 372 (86.3%) | 114.0 |
| 35 to 50 years | 59 (13.7%) | 17.0 |
| Total | 431 (100.0%) | 54.0 |
Fertility by Age by Marriage Status in Colleton County
51.5% of women with births (431) in Colleton County are married. The highest percentage of unmarried women with births falls into 20 to 34 years age bracket with 56.2% of them unmarried at the time of birth, while the lowest percentage of unmarried women with births belong to 35 to 50 years age bracket with 0.0% of them unmarried.
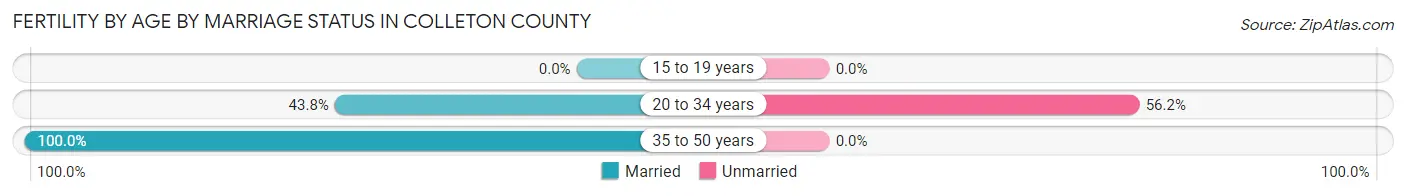
| Age Bracket | Married | Unmarried |
| 15 to 19 years | 0 (0.0%) | 0 (0.0%) |
| 20 to 34 years | 163 (43.8%) | 209 (56.2%) |
| 35 to 50 years | 59 (100.0%) | 0 (0.0%) |
| Total | 222 (51.5%) | 209 (48.5%) |
Fertility by Education in Colleton County
Average fertility rate in Colleton County is 54.0 births per 1,000 women. Women with the education attainment of bachelor's degree have the highest fertility rate of 171.0 births per 1,000 women, while women with the education attainment of graduate degree have the lowest fertility at 14.0 births per 1,000 women. Women with the education attainment of high school diploma represent 34.3% of all women with births.
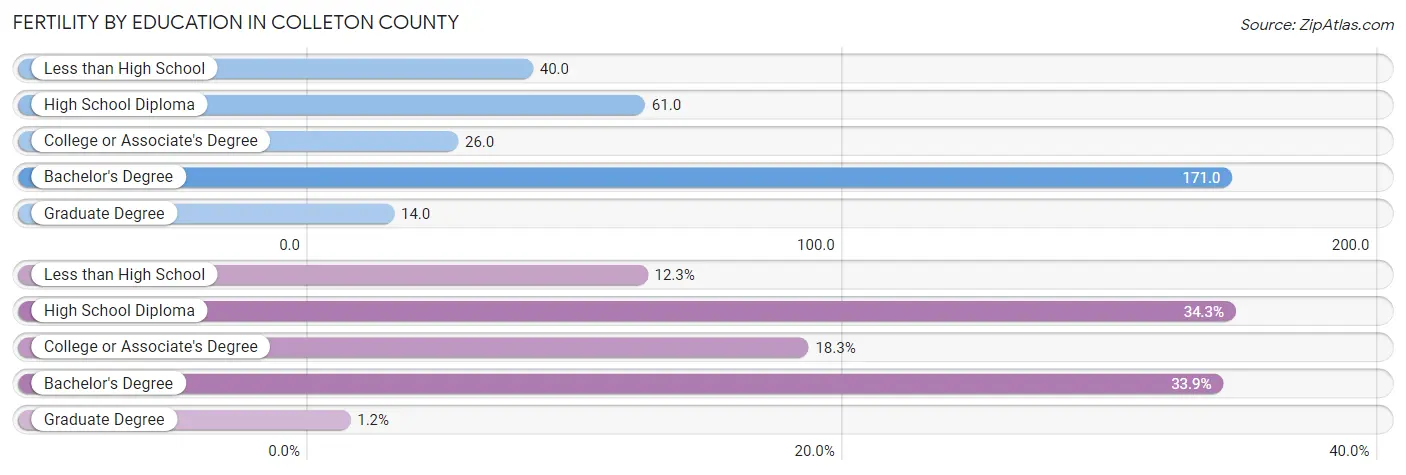
| Educational Attainment | Women with Births | Births / 1,000 Women |
| Less than High School | 53 (12.3%) | 40.0 |
| High School Diploma | 148 (34.3%) | 61.0 |
| College or Associate's Degree | 79 (18.3%) | 26.0 |
| Bachelor's Degree | 146 (33.9%) | 171.0 |
| Graduate Degree | 5 (1.2%) | 14.0 |
| Total | 431 (100.0%) | 54.0 |
Fertility by Education by Marriage Status in Colleton County
48.5% of women with births in Colleton County are unmarried. Women with the educational attainment of bachelor's degree are most likely to be married with 100.0% of them married at childbirth, while women with the educational attainment of less than high school are least likely to be married with 100.0% of them unmarried at childbirth.
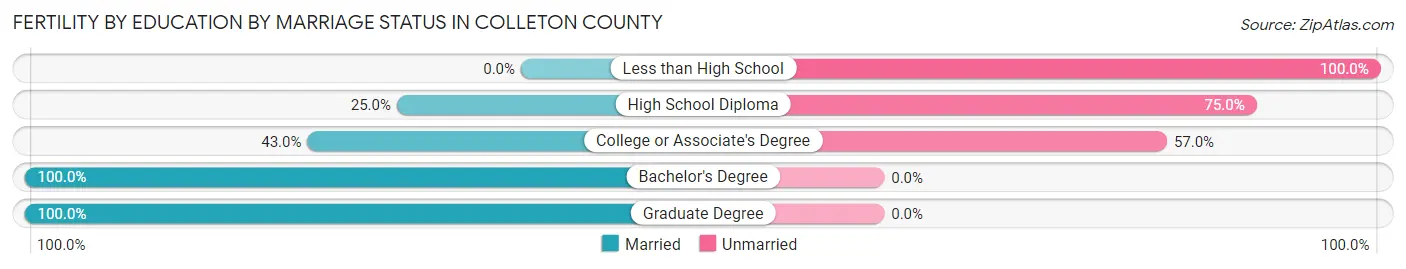
| Educational Attainment | Married | Unmarried |
| Less than High School | 0 (0.0%) | 53 (100.0%) |
| High School Diploma | 37 (25.0%) | 111 (75.0%) |
| College or Associate's Degree | 34 (43.0%) | 45 (57.0%) |
| Bachelor's Degree | 146 (100.0%) | 0 (0.0%) |
| Graduate Degree | 5 (100.0%) | 0 (0.0%) |
| Total | 222 (51.5%) | 209 (48.5%) |
Employment Characteristics in Colleton County
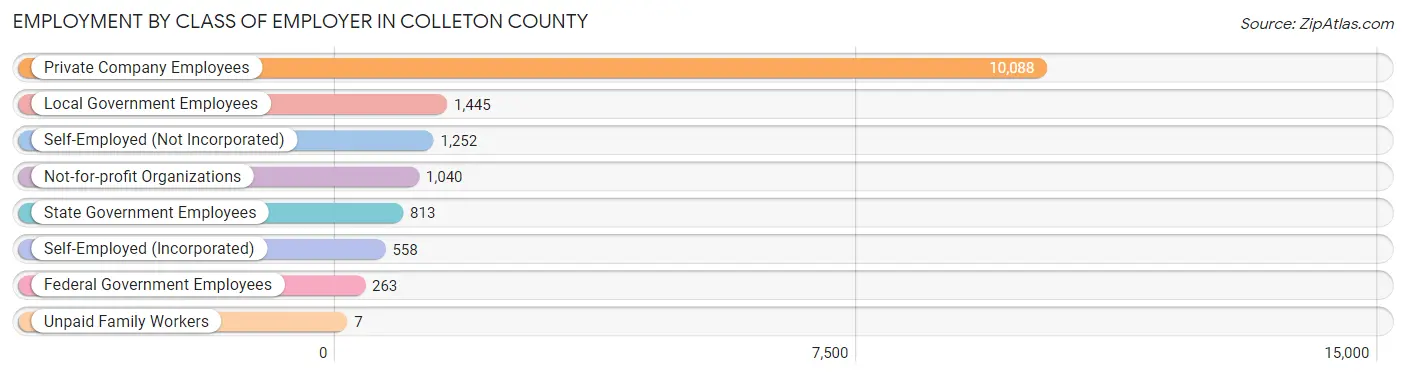
Employment by Class of Employer in Colleton County
Among the 15,466 employed individuals in Colleton County, private company employees (10,088 | 65.2%), local government employees (1,445 | 9.3%), and self-employed (not incorporated) (1,252 | 8.1%) make up the most common classes of employment.
| Employer Class | # Employees | % Employees |
| Private Company Employees | 10,088 | 65.2% |
| Self-Employed (Incorporated) | 558 | 3.6% |
| Self-Employed (Not Incorporated) | 1,252 | 8.1% |
| Not-for-profit Organizations | 1,040 | 6.7% |
| Local Government Employees | 1,445 | 9.3% |
| State Government Employees | 813 | 5.3% |
| Federal Government Employees | 263 | 1.7% |
| Unpaid Family Workers | 7 | 0.1% |
| Total | 15,466 | 100.0% |
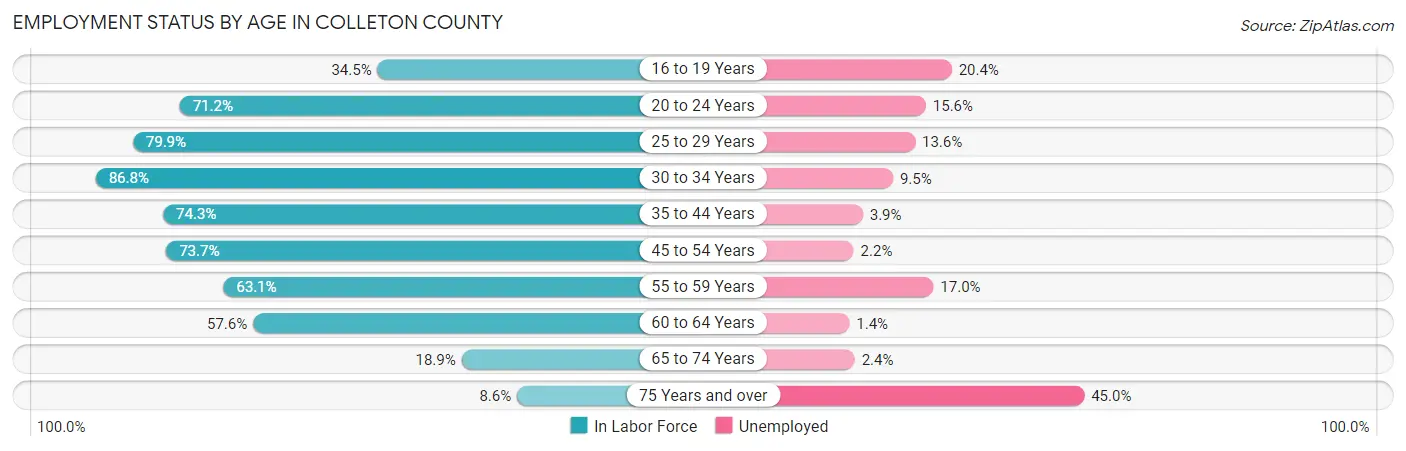
Employment Status by Age in Colleton County
According to the labor force statistics for Colleton County, out of the total population over 16 years of age (30,904), 55.7% or 17,214 individuals are in the labor force, with 8.6% or 1,480 of them unemployed. The age group with the highest labor force participation rate is 30 to 34 years, with 86.8% or 1,955 individuals in the labor force. Within the labor force, the 75 years and over age range has the highest percentage of unemployed individuals, with 45.0% or 116 of them being unemployed.
| Age Bracket | In Labor Force | Unemployed |
| 16 to 19 Years | 623 (34.5%) | 127 (20.4%) |
| 20 to 24 Years | 1,537 (71.2%) | 240 (15.6%) |
| 25 to 29 Years | 1,983 (79.9%) | 270 (13.6%) |
| 30 to 34 Years | 1,955 (86.8%) | 186 (9.5%) |
| 35 to 44 Years | 3,170 (74.3%) | 124 (3.9%) |
| 45 to 54 Years | 3,406 (73.7%) | 75 (2.2%) |
| 55 to 59 Years | 1,739 (63.1%) | 296 (17.0%) |
| 60 to 64 Years | 1,663 (57.6%) | 23 (1.4%) |
| 65 to 74 Years | 884 (18.9%) | 21 (2.4%) |
| 75 Years and over | 258 (8.6%) | 116 (45.0%) |
| Total | 17,214 (55.7%) | 1,480 (8.6%) |
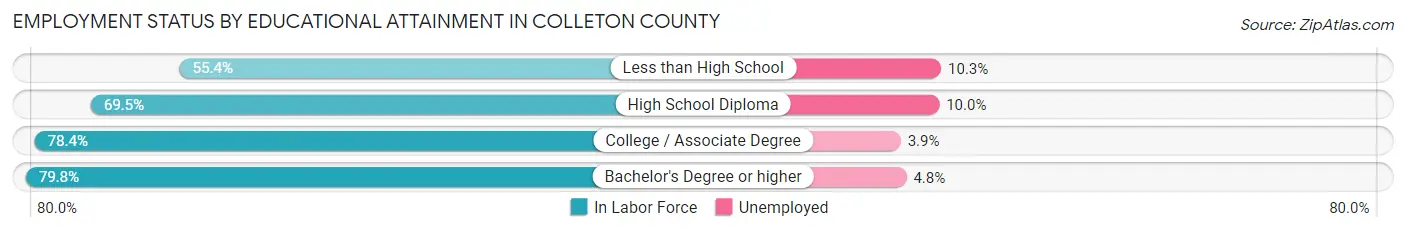
Employment Status by Educational Attainment in Colleton County
According to labor force statistics for Colleton County, 72.2% of individuals (13,910) out of the total population between 25 and 64 years of age (19,266) are in the labor force, with 7.0% or 974 of them being unemployed. The group with the highest labor force participation rate are those with the educational attainment of bachelor's degree or higher, with 79.8% or 2,362 individuals in the labor force. Within the labor force, individuals with less than high school education have the highest percentage of unemployment, with 10.3% or 138 of them being unemployed.
| Educational Attainment | In Labor Force | Unemployed |
| Less than High School | 1,335 (55.4%) | 248 (10.3%) |
| High School Diploma | 5,304 (69.5%) | 763 (10.0%) |
| College / Associate Degree | 4,911 (78.4%) | 244 (3.9%) |
| Bachelor's Degree or higher | 2,362 (79.8%) | 142 (4.8%) |
| Total | 13,910 (72.2%) | 1,349 (7.0%) |
Employment Occupations by Sex in Colleton County
Management, Business, Science and Arts Occupations
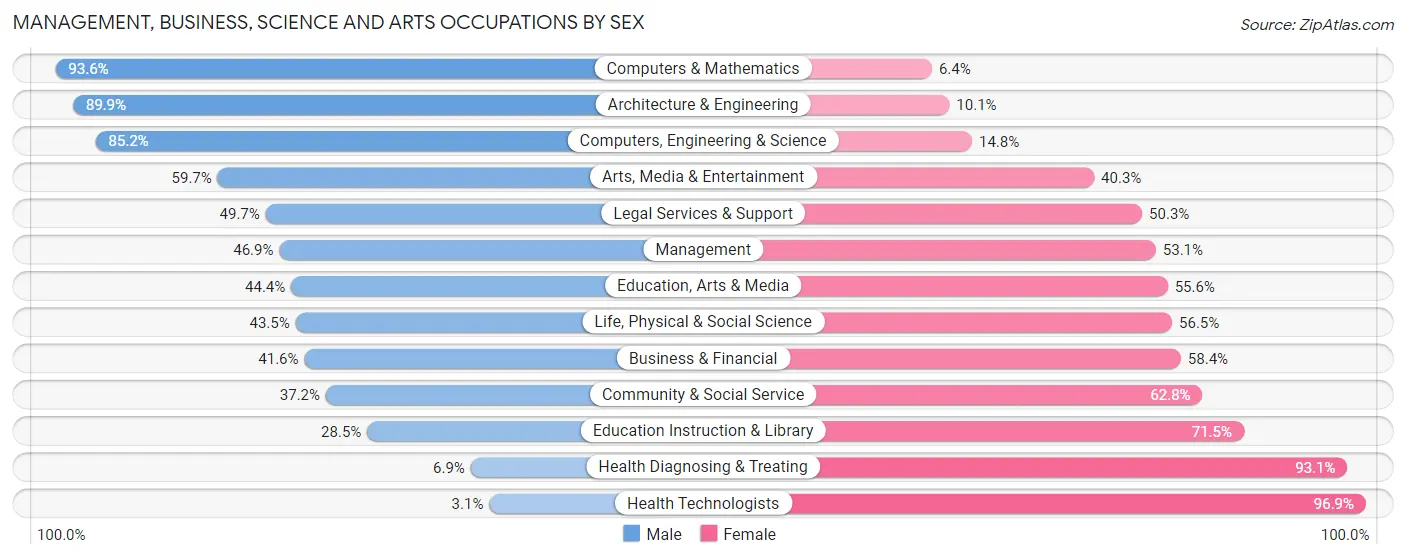
The most common Management, Business, Science and Arts occupations in Colleton County are Community & Social Service (1,456 | 9.3%), Management (1,229 | 7.9%), Education Instruction & Library (876 | 5.6%), Health Diagnosing & Treating (836 | 5.3%), and Health Technologists (522 | 3.3%).
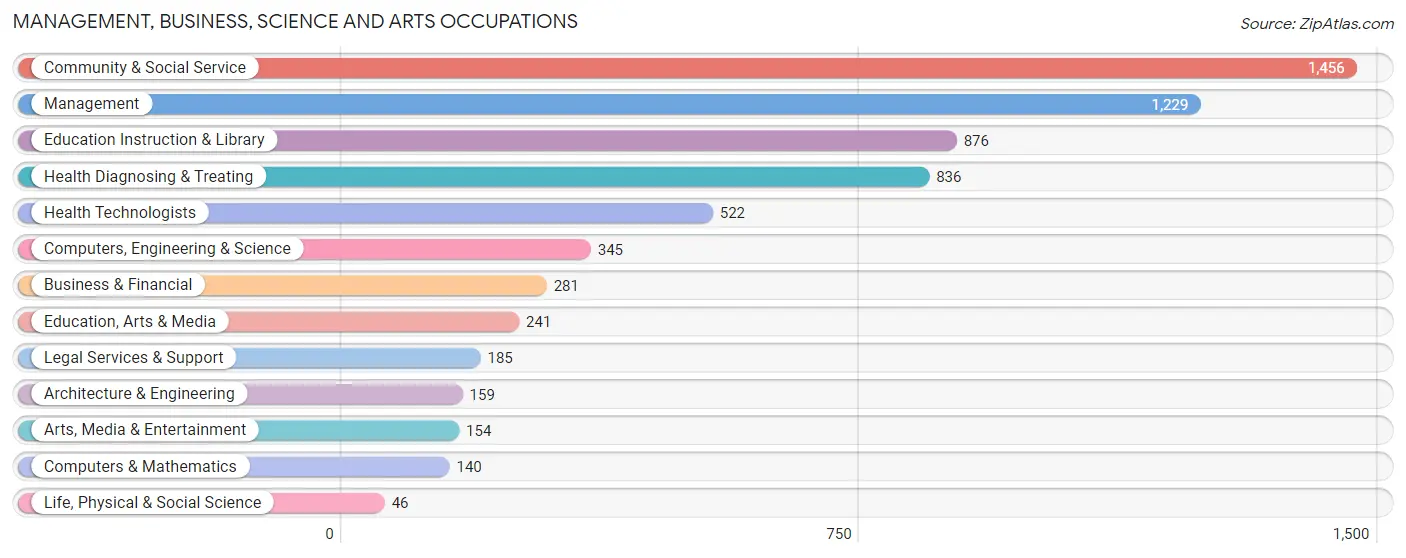
Management, Business, Science and Arts Occupations by Sex
Within the Management, Business, Science and Arts occupations in Colleton County, the most male-oriented occupations are Computers & Mathematics (93.6%), Architecture & Engineering (89.9%), and Computers, Engineering & Science (85.2%), while the most female-oriented occupations are Health Technologists (96.9%), Health Diagnosing & Treating (93.1%), and Education Instruction & Library (71.5%).
| Occupation | Male | Female |
| Management | 576 (46.9%) | 653 (53.1%) |
| Business & Financial | 117 (41.6%) | 164 (58.4%) |
| Computers, Engineering & Science | 294 (85.2%) | 51 (14.8%) |
| Computers & Mathematics | 131 (93.6%) | 9 (6.4%) |
| Architecture & Engineering | 143 (89.9%) | 16 (10.1%) |
| Life, Physical & Social Science | 20 (43.5%) | 26 (56.5%) |
| Community & Social Service | 541 (37.2%) | 915 (62.8%) |
| Education, Arts & Media | 107 (44.4%) | 134 (55.6%) |
| Legal Services & Support | 92 (49.7%) | 93 (50.3%) |
| Education Instruction & Library | 250 (28.5%) | 626 (71.5%) |
| Arts, Media & Entertainment | 92 (59.7%) | 62 (40.3%) |
| Health Diagnosing & Treating | 58 (6.9%) | 778 (93.1%) |
| Health Technologists | 16 (3.1%) | 506 (96.9%) |
| Total (Category) | 1,586 (38.2%) | 2,561 (61.8%) |
| Total (Overall) | 8,176 (52.2%) | 7,483 (47.8%) |
Services Occupations
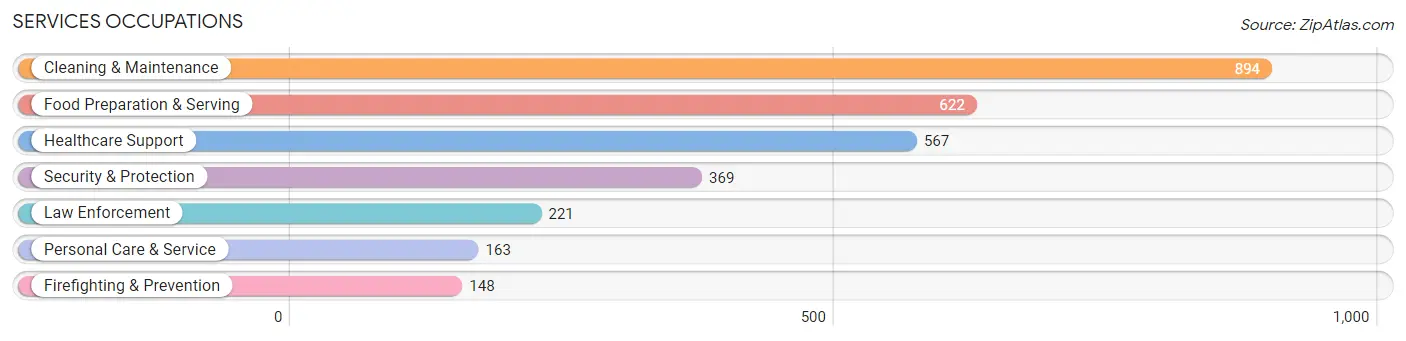
The most common Services occupations in Colleton County are Cleaning & Maintenance (894 | 5.7%), Food Preparation & Serving (622 | 4.0%), Healthcare Support (567 | 3.6%), Security & Protection (369 | 2.4%), and Law Enforcement (221 | 1.4%).
Services Occupations by Sex
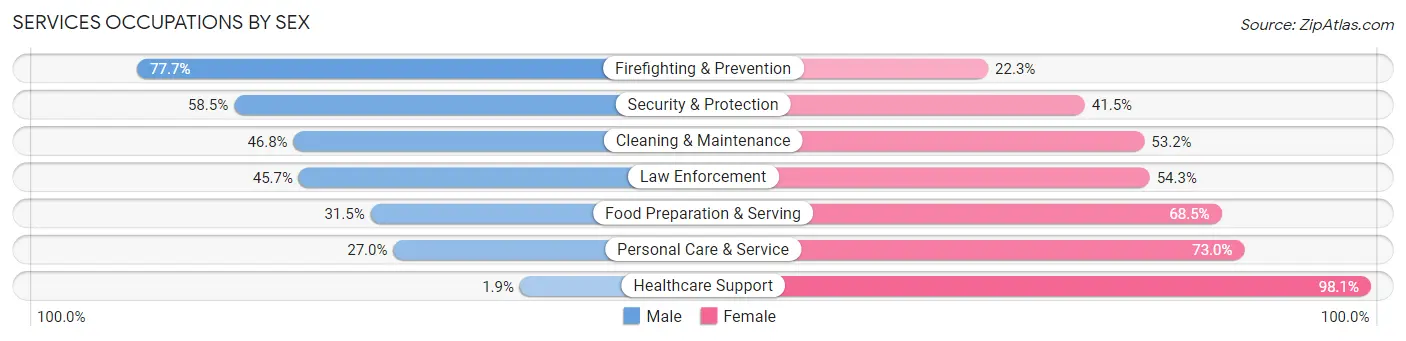
Within the Services occupations in Colleton County, the most male-oriented occupations are Firefighting & Prevention (77.7%), Security & Protection (58.5%), and Cleaning & Maintenance (46.8%), while the most female-oriented occupations are Healthcare Support (98.1%), Personal Care & Service (73.0%), and Food Preparation & Serving (68.5%).
| Occupation | Male | Female |
| Healthcare Support | 11 (1.9%) | 556 (98.1%) |
| Security & Protection | 216 (58.5%) | 153 (41.5%) |
| Firefighting & Prevention | 115 (77.7%) | 33 (22.3%) |
| Law Enforcement | 101 (45.7%) | 120 (54.3%) |
| Food Preparation & Serving | 196 (31.5%) | 426 (68.5%) |
| Cleaning & Maintenance | 418 (46.8%) | 476 (53.2%) |
| Personal Care & Service | 44 (27.0%) | 119 (73.0%) |
| Total (Category) | 885 (33.8%) | 1,730 (66.2%) |
| Total (Overall) | 8,176 (52.2%) | 7,483 (47.8%) |
Sales and Office Occupations
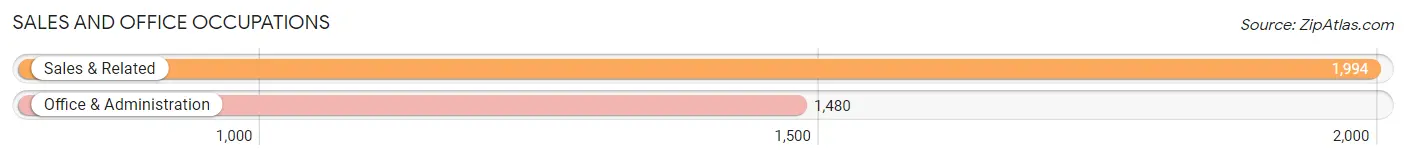
The most common Sales and Office occupations in Colleton County are Sales & Related (1,994 | 12.7%), and Office & Administration (1,480 | 9.5%).
Sales and Office Occupations by Sex
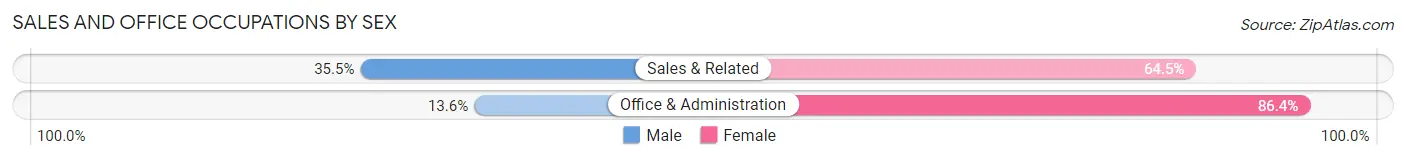
| Occupation | Male | Female |
| Sales & Related | 707 (35.5%) | 1,287 (64.5%) |
| Office & Administration | 201 (13.6%) | 1,279 (86.4%) |
| Total (Category) | 908 (26.1%) | 2,566 (73.9%) |
| Total (Overall) | 8,176 (52.2%) | 7,483 (47.8%) |
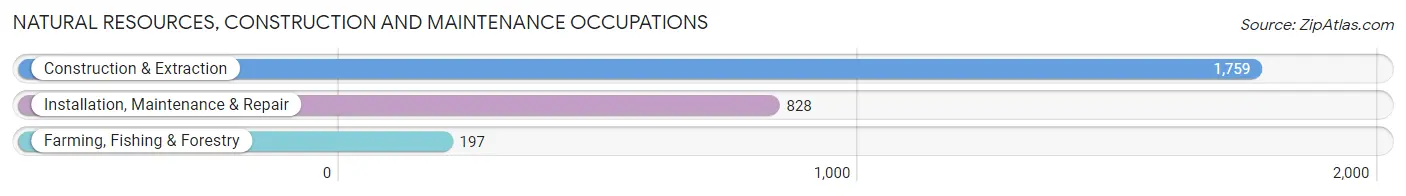
Natural Resources, Construction and Maintenance Occupations
The most common Natural Resources, Construction and Maintenance occupations in Colleton County are Construction & Extraction (1,759 | 11.2%), Installation, Maintenance & Repair (828 | 5.3%), and Farming, Fishing & Forestry (197 | 1.3%).
Natural Resources, Construction and Maintenance Occupations by Sex
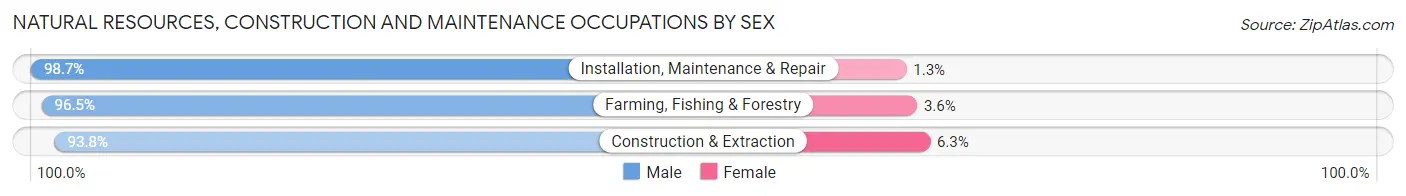
| Occupation | Male | Female |
| Farming, Fishing & Forestry | 190 (96.5%) | 7 (3.5%) |
| Construction & Extraction | 1,649 (93.8%) | 110 (6.2%) |
| Installation, Maintenance & Repair | 817 (98.7%) | 11 (1.3%) |
| Total (Category) | 2,656 (95.4%) | 128 (4.6%) |
| Total (Overall) | 8,176 (52.2%) | 7,483 (47.8%) |
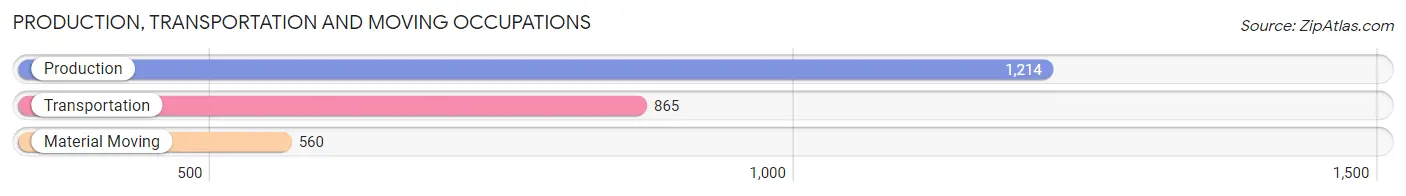
Production, Transportation and Moving Occupations
The most common Production, Transportation and Moving occupations in Colleton County are Production (1,214 | 7.7%), Transportation (865 | 5.5%), and Material Moving (560 | 3.6%).
Production, Transportation and Moving Occupations by Sex
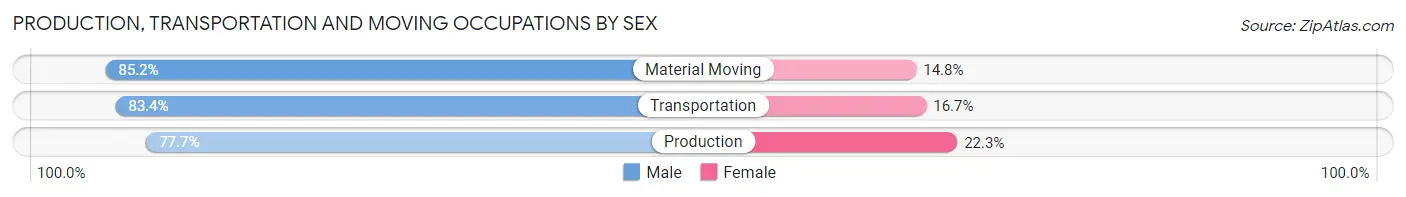
| Occupation | Male | Female |
| Production | 943 (77.7%) | 271 (22.3%) |
| Transportation | 721 (83.4%) | 144 (16.7%) |
| Material Moving | 477 (85.2%) | 83 (14.8%) |
| Total (Category) | 2,141 (81.1%) | 498 (18.9%) |
| Total (Overall) | 8,176 (52.2%) | 7,483 (47.8%) |
Employment Industries by Sex in Colleton County
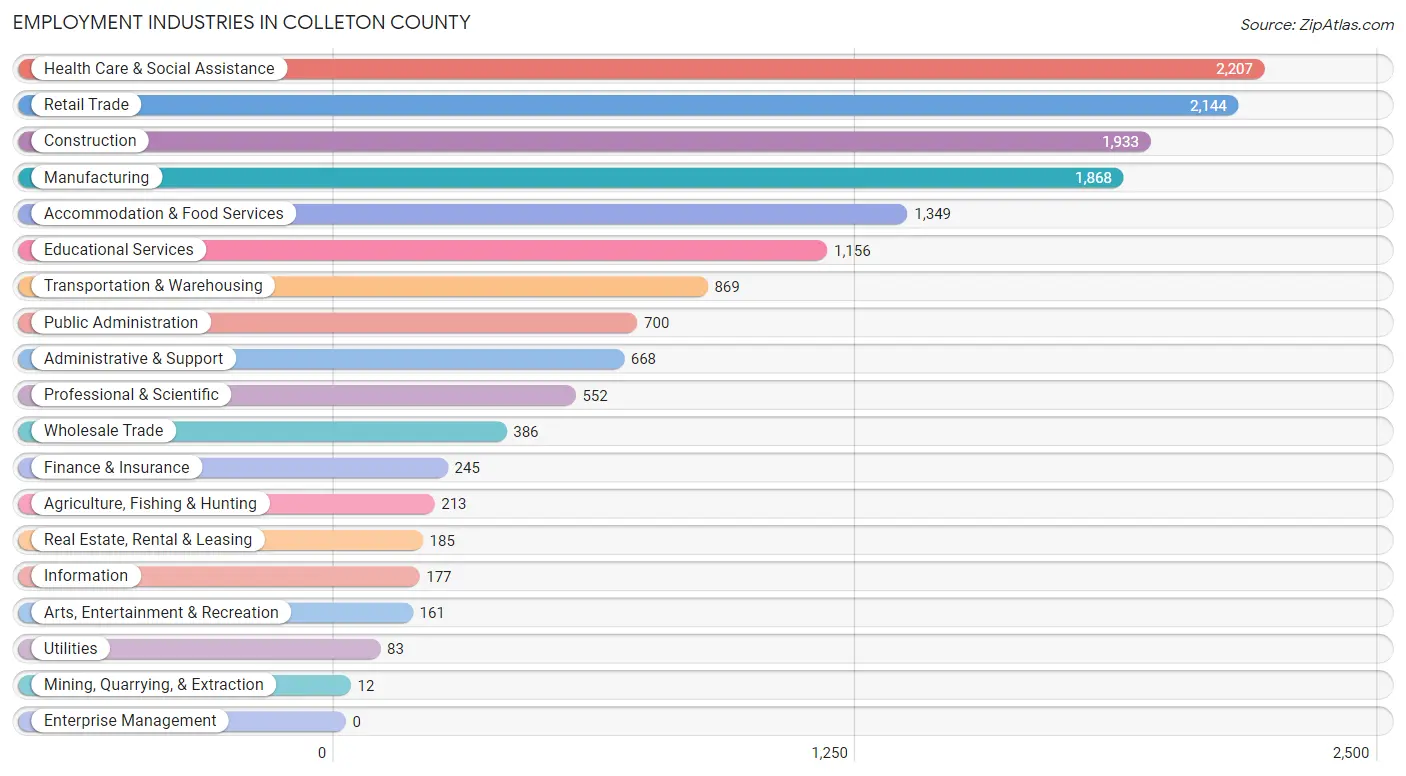
Employment Industries in Colleton County
The major employment industries in Colleton County include Health Care & Social Assistance (2,207 | 14.1%), Retail Trade (2,144 | 13.7%), Construction (1,933 | 12.3%), Manufacturing (1,868 | 11.9%), and Accommodation & Food Services (1,349 | 8.6%).
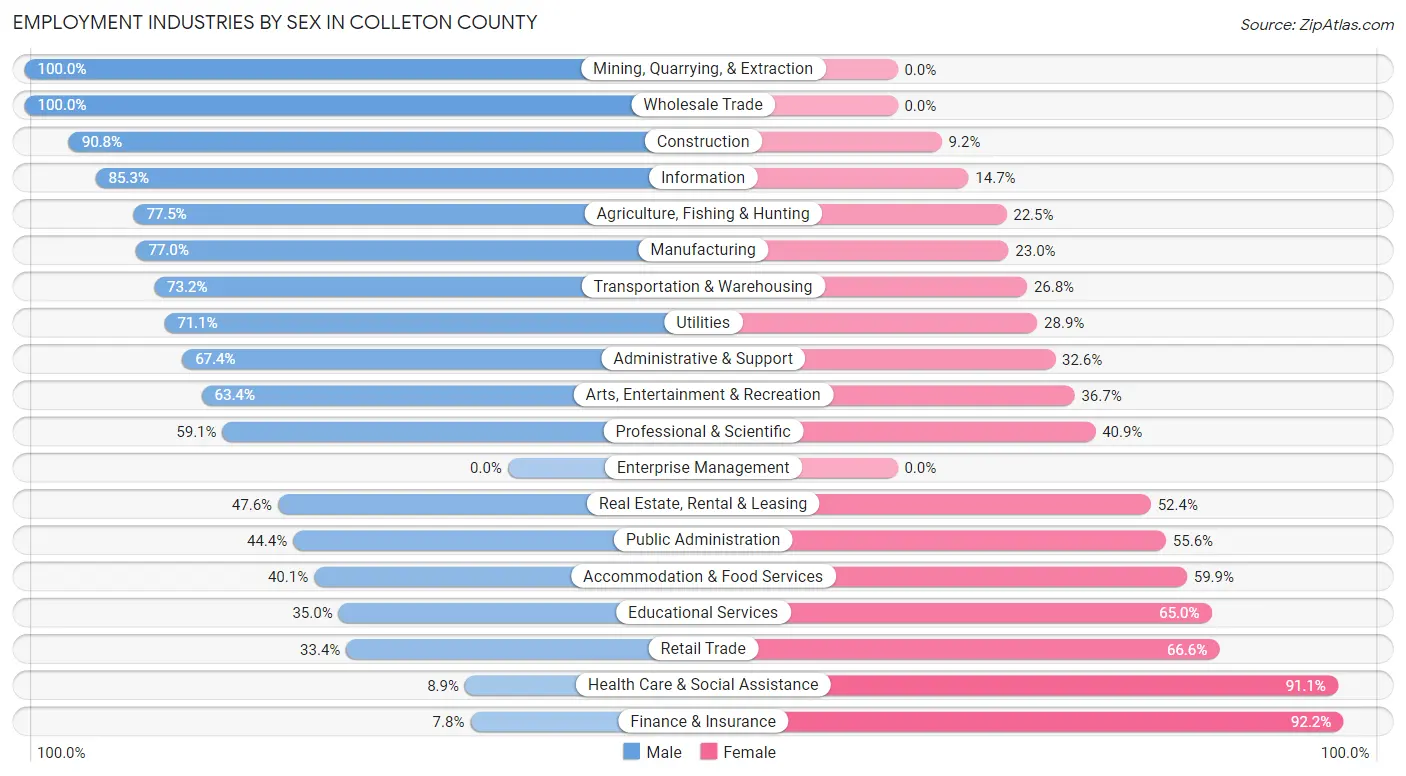
Employment Industries by Sex in Colleton County
The Colleton County industries that see more men than women are Mining, Quarrying, & Extraction (100.0%), Wholesale Trade (100.0%), and Construction (90.8%), whereas the industries that tend to have a higher number of women are Finance & Insurance (92.2%), Health Care & Social Assistance (91.1%), and Retail Trade (66.6%).
| Industry | Male | Female |
| Agriculture, Fishing & Hunting | 165 (77.5%) | 48 (22.5%) |
| Mining, Quarrying, & Extraction | 12 (100.0%) | 0 (0.0%) |
| Construction | 1,756 (90.8%) | 177 (9.2%) |
| Manufacturing | 1,439 (77.0%) | 429 (23.0%) |
| Wholesale Trade | 386 (100.0%) | 0 (0.0%) |
| Retail Trade | 717 (33.4%) | 1,427 (66.6%) |
| Transportation & Warehousing | 636 (73.2%) | 233 (26.8%) |
| Utilities | 59 (71.1%) | 24 (28.9%) |
| Information | 151 (85.3%) | 26 (14.7%) |
| Finance & Insurance | 19 (7.8%) | 226 (92.2%) |
| Real Estate, Rental & Leasing | 88 (47.6%) | 97 (52.4%) |
| Professional & Scientific | 326 (59.1%) | 226 (40.9%) |
| Enterprise Management | 0 (0.0%) | 0 (0.0%) |
| Administrative & Support | 450 (67.4%) | 218 (32.6%) |
| Educational Services | 405 (35.0%) | 751 (65.0%) |
| Health Care & Social Assistance | 196 (8.9%) | 2,011 (91.1%) |
| Arts, Entertainment & Recreation | 102 (63.3%) | 59 (36.6%) |
| Accommodation & Food Services | 541 (40.1%) | 808 (59.9%) |
| Public Administration | 311 (44.4%) | 389 (55.6%) |
| Total | 8,176 (52.2%) | 7,483 (47.8%) |
Education in Colleton County
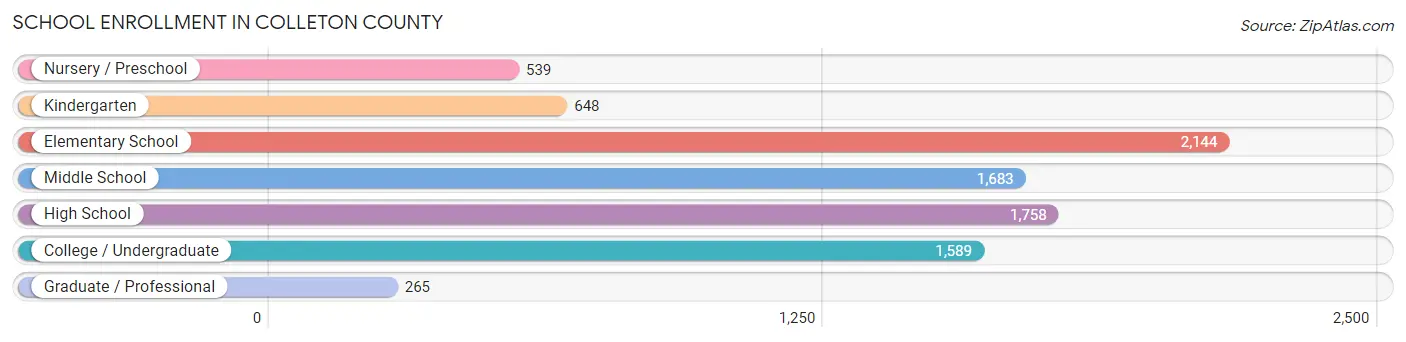
School Enrollment in Colleton County
The most common levels of schooling among the 8,626 students in Colleton County are elementary school (2,144 | 24.9%), high school (1,758 | 20.4%), and middle school (1,683 | 19.5%).
| School Level | # Students | % Students |
| Nursery / Preschool | 539 | 6.2% |
| Kindergarten | 648 | 7.5% |
| Elementary School | 2,144 | 24.9% |
| Middle School | 1,683 | 19.5% |
| High School | 1,758 | 20.4% |
| College / Undergraduate | 1,589 | 18.4% |
| Graduate / Professional | 265 | 3.1% |
| Total | 8,626 | 100.0% |
School Enrollment by Age by Funding Source in Colleton County
Out of a total of 8,626 students who are enrolled in schools in Colleton County, 673 (7.8%) attend a private institution, while the remaining 7,953 (92.2%) are enrolled in public schools. The age group of 20 to 24 year olds has the highest likelihood of being enrolled in private schools, with 81 (19.4% in the age bracket) enrolled. Conversely, the age group of 18 to 19 year olds has the lowest likelihood of being enrolled in a private school, with 595 (97.9% in the age bracket) attending a public institution.
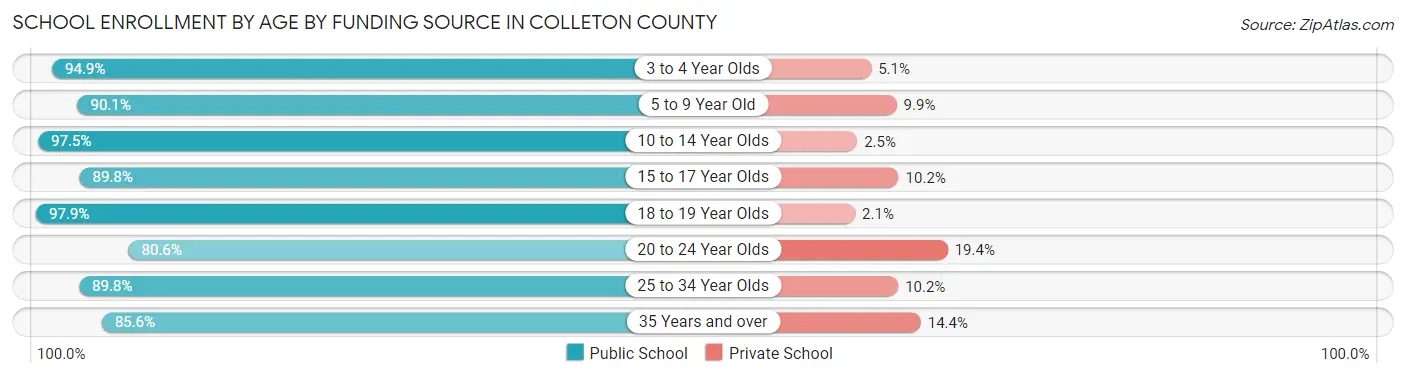
| Age Bracket | Public School | Private School |
| 3 to 4 Year Olds | 370 (94.9%) | 20 (5.1%) |
| 5 to 9 Year Old | 2,118 (90.1%) | 232 (9.9%) |
| 10 to 14 Year Olds | 2,402 (97.5%) | 62 (2.5%) |
| 15 to 17 Year Olds | 1,254 (89.8%) | 143 (10.2%) |
| 18 to 19 Year Olds | 595 (97.9%) | 13 (2.1%) |
| 20 to 24 Year Olds | 337 (80.6%) | 81 (19.4%) |
| 25 to 34 Year Olds | 460 (89.8%) | 52 (10.2%) |
| 35 Years and over | 417 (85.6%) | 70 (14.4%) |
| Total | 7,953 (92.2%) | 673 (7.8%) |
Educational Attainment by Field of Study in Colleton County
Education (1,133 | 25.7%), business (1,059 | 24.0%), science & technology (478 | 10.8%), social sciences (289 | 6.6%), and bio, nature & agricultural (286 | 6.5%) are the most common fields of study among 4,411 individuals in Colleton County who have obtained a bachelor's degree or higher.
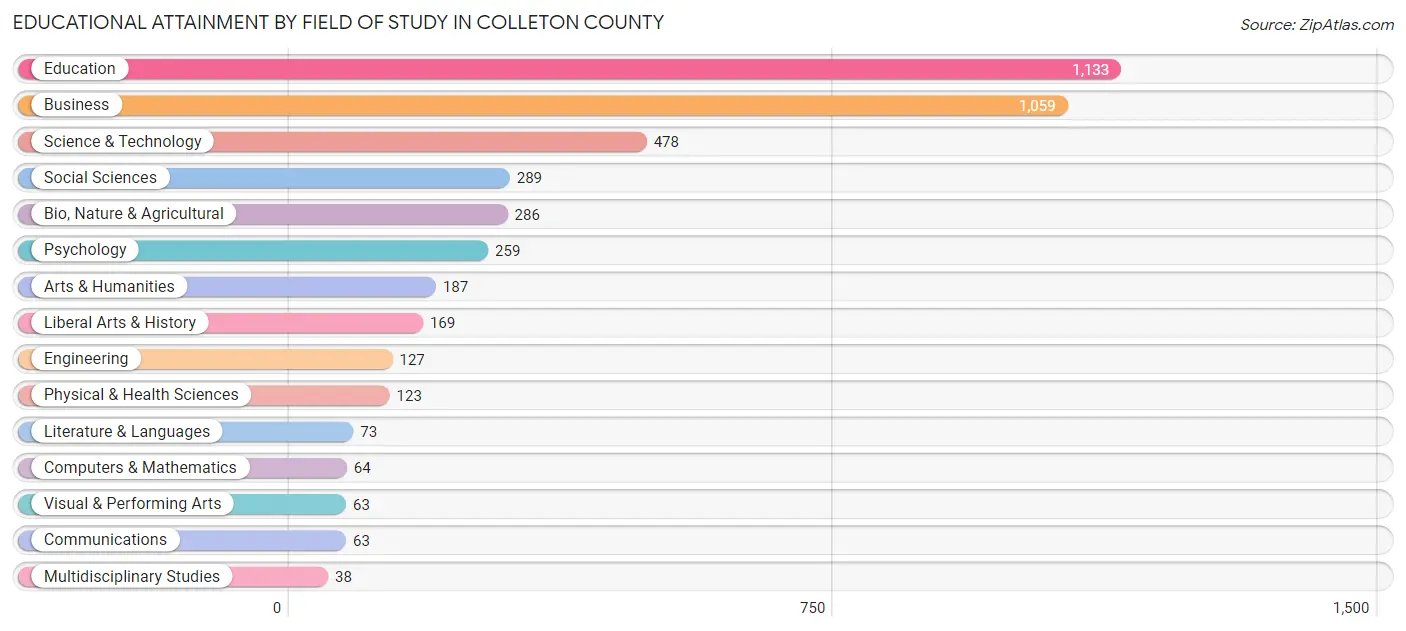
| Field of Study | # Graduates | % Graduates |
| Computers & Mathematics | 64 | 1.5% |
| Bio, Nature & Agricultural | 286 | 6.5% |
| Physical & Health Sciences | 123 | 2.8% |
| Psychology | 259 | 5.9% |
| Social Sciences | 289 | 6.6% |
| Engineering | 127 | 2.9% |
| Multidisciplinary Studies | 38 | 0.9% |
| Science & Technology | 478 | 10.8% |
| Business | 1,059 | 24.0% |
| Education | 1,133 | 25.7% |
| Literature & Languages | 73 | 1.7% |
| Liberal Arts & History | 169 | 3.8% |
| Visual & Performing Arts | 63 | 1.4% |
| Communications | 63 | 1.4% |
| Arts & Humanities | 187 | 4.2% |
| Total | 4,411 | 100.0% |
Transportation & Commute in Colleton County
Vehicle Availability by Sex in Colleton County
The most prevalent vehicle ownership categories in Colleton County are males with 2 vehicles (2,960, accounting for 36.6%) and females with 2 vehicles (2,540, making up 40.2%).
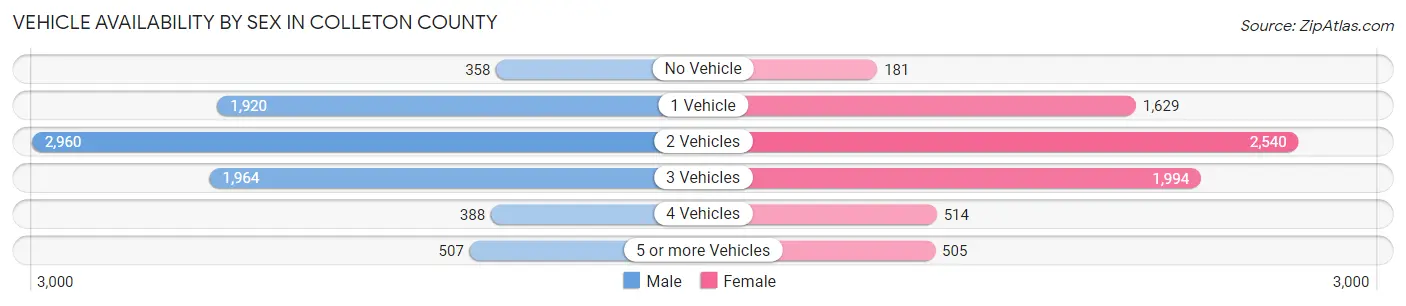
| Vehicles Available | Male | Female |
| No Vehicle | 358 (4.4%) | 181 (2.5%) |
| 1 Vehicle | 1,920 (23.7%) | 1,629 (22.1%) |
| 2 Vehicles | 2,960 (36.6%) | 2,540 (34.5%) |
| 3 Vehicles | 1,964 (24.3%) | 1,994 (27.1%) |
| 4 Vehicles | 388 (4.8%) | 514 (7.0%) |
| 5 or more Vehicles | 507 (6.3%) | 505 (6.9%) |
| Total | 8,097 (100.0%) | 7,363 (100.0%) |
Commute Time in Colleton County
The most frequently occuring commute durations in Colleton County are 30 to 34 minutes (2,860 commuters, 19.3%), 60 to 89 minutes (2,194 commuters, 14.8%), and 20 to 24 minutes (2,091 commuters, 14.1%).
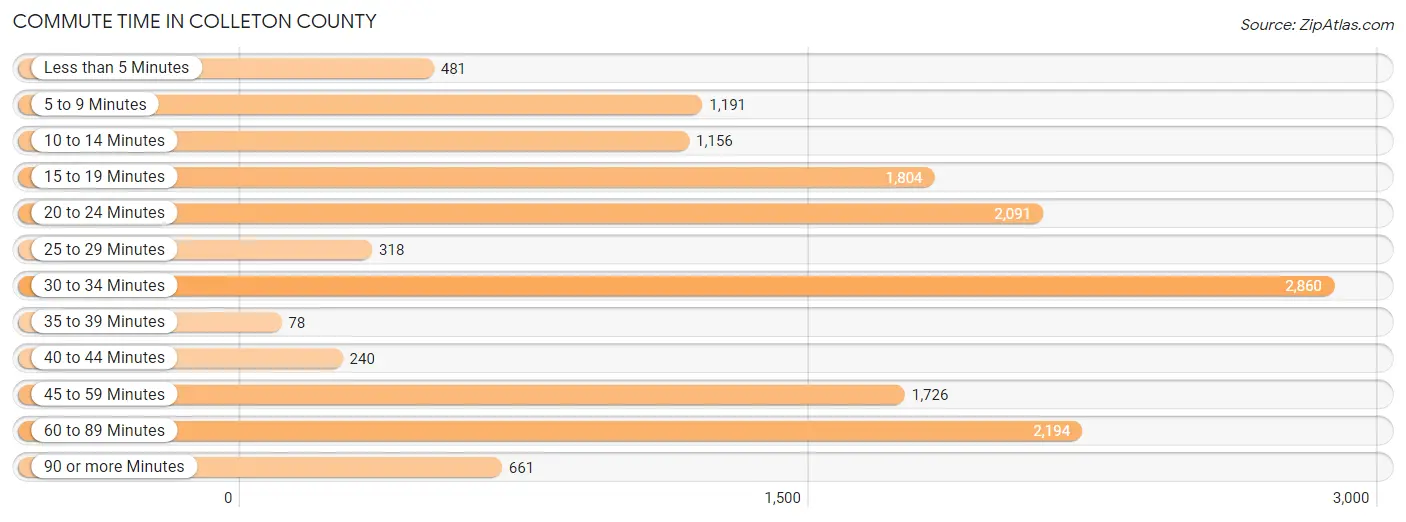
| Commute Time | # Commuters | % Commuters |
| Less than 5 Minutes | 481 | 3.3% |
| 5 to 9 Minutes | 1,191 | 8.1% |
| 10 to 14 Minutes | 1,156 | 7.8% |
| 15 to 19 Minutes | 1,804 | 12.2% |
| 20 to 24 Minutes | 2,091 | 14.1% |
| 25 to 29 Minutes | 318 | 2.1% |
| 30 to 34 Minutes | 2,860 | 19.3% |
| 35 to 39 Minutes | 78 | 0.5% |
| 40 to 44 Minutes | 240 | 1.6% |
| 45 to 59 Minutes | 1,726 | 11.7% |
| 60 to 89 Minutes | 2,194 | 14.8% |
| 90 or more Minutes | 661 | 4.5% |
Commute Time by Sex in Colleton County
The most common commute times in Colleton County are 30 to 34 minutes (1,479 commuters, 18.9%) for males and 30 to 34 minutes (1,381 commuters, 19.8%) for females.
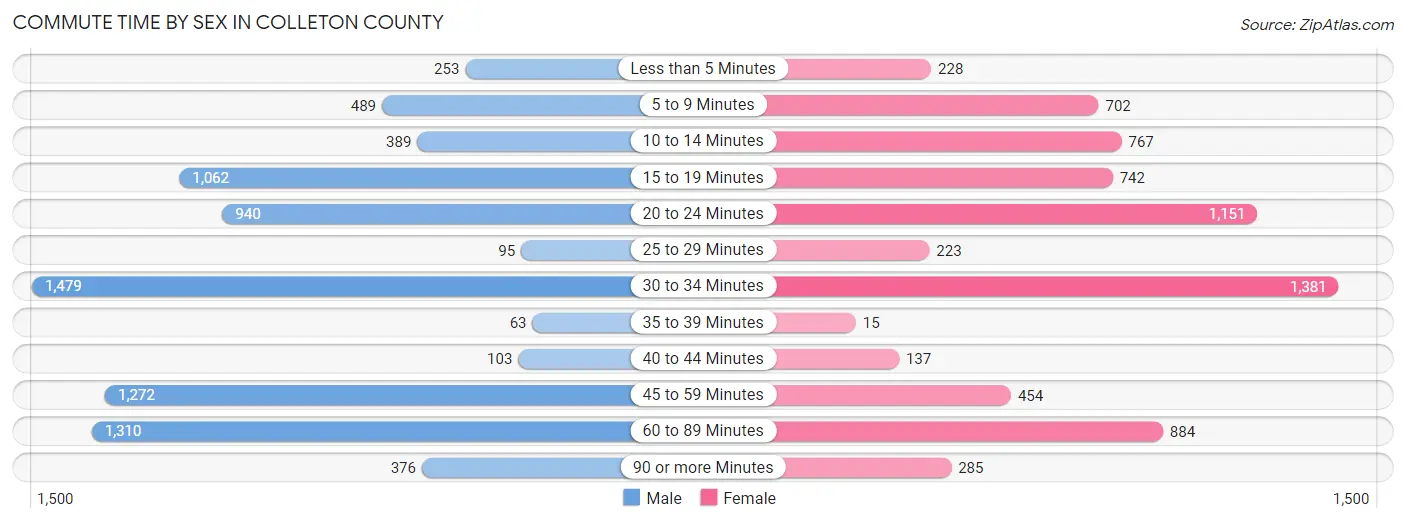
| Commute Time | Male | Female |
| Less than 5 Minutes | 253 (3.2%) | 228 (3.3%) |
| 5 to 9 Minutes | 489 (6.2%) | 702 (10.1%) |
| 10 to 14 Minutes | 389 (5.0%) | 767 (11.0%) |
| 15 to 19 Minutes | 1,062 (13.6%) | 742 (10.6%) |
| 20 to 24 Minutes | 940 (12.0%) | 1,151 (16.5%) |
| 25 to 29 Minutes | 95 (1.2%) | 223 (3.2%) |
| 30 to 34 Minutes | 1,479 (18.9%) | 1,381 (19.8%) |
| 35 to 39 Minutes | 63 (0.8%) | 15 (0.2%) |
| 40 to 44 Minutes | 103 (1.3%) | 137 (2.0%) |
| 45 to 59 Minutes | 1,272 (16.2%) | 454 (6.5%) |
| 60 to 89 Minutes | 1,310 (16.7%) | 884 (12.7%) |
| 90 or more Minutes | 376 (4.8%) | 285 (4.1%) |
Time of Departure to Work by Sex in Colleton County
The most frequent times of departure to work in Colleton County are 7:30 AM to 7:59 AM (1,235, 15.8%) for males and 7:30 AM to 7:59 AM (1,519, 21.8%) for females.
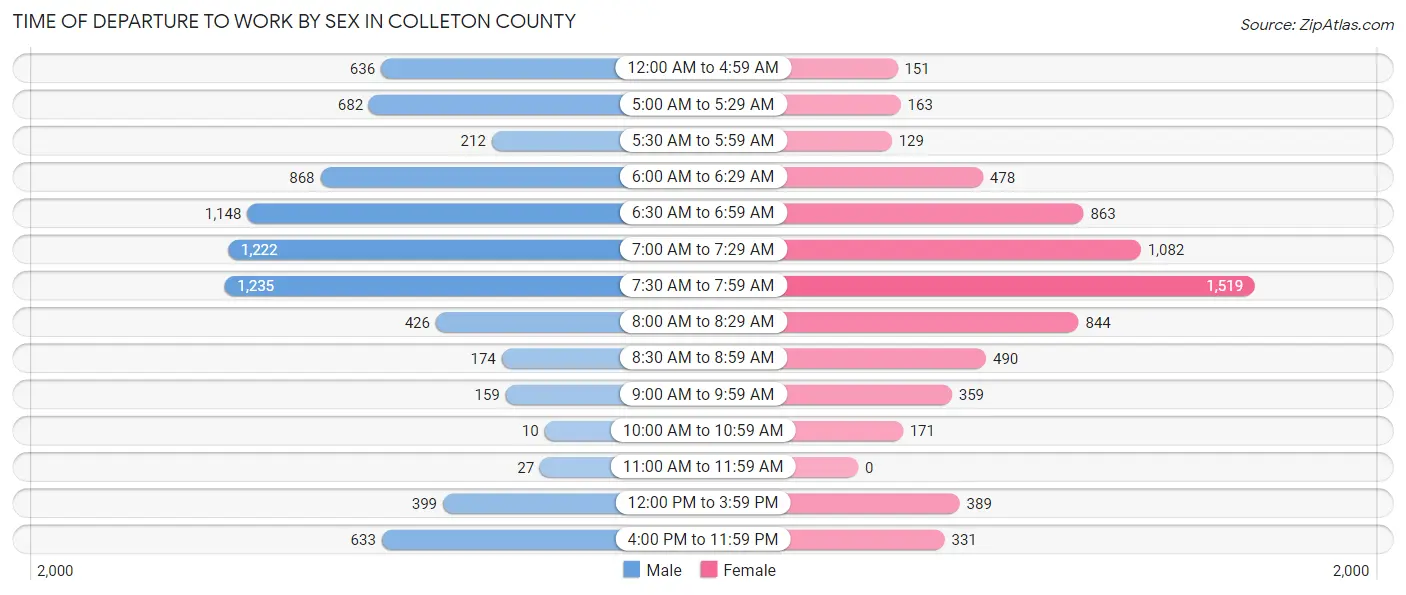
| Time of Departure | Male | Female |
| 12:00 AM to 4:59 AM | 636 (8.1%) | 151 (2.2%) |
| 5:00 AM to 5:29 AM | 682 (8.7%) | 163 (2.3%) |
| 5:30 AM to 5:59 AM | 212 (2.7%) | 129 (1.8%) |
| 6:00 AM to 6:29 AM | 868 (11.1%) | 478 (6.9%) |
| 6:30 AM to 6:59 AM | 1,148 (14.7%) | 863 (12.4%) |
| 7:00 AM to 7:29 AM | 1,222 (15.6%) | 1,082 (15.5%) |
| 7:30 AM to 7:59 AM | 1,235 (15.8%) | 1,519 (21.8%) |
| 8:00 AM to 8:29 AM | 426 (5.4%) | 844 (12.1%) |
| 8:30 AM to 8:59 AM | 174 (2.2%) | 490 (7.0%) |
| 9:00 AM to 9:59 AM | 159 (2.0%) | 359 (5.1%) |
| 10:00 AM to 10:59 AM | 10 (0.1%) | 171 (2.5%) |
| 11:00 AM to 11:59 AM | 27 (0.3%) | 0 (0.0%) |
| 12:00 PM to 3:59 PM | 399 (5.1%) | 389 (5.6%) |
| 4:00 PM to 11:59 PM | 633 (8.1%) | 331 (4.8%) |
| Total | 7,831 (100.0%) | 6,969 (100.0%) |
Housing Occupancy in Colleton County
Occupancy by Ownership in Colleton County
Of the total 15,656 dwellings in Colleton County, owner-occupied units account for 11,382 (72.7%), while renter-occupied units make up 4,274 (27.3%).
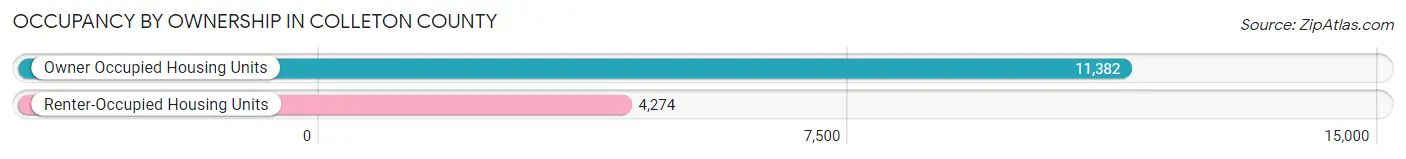
| Occupancy | # Housing Units | % Housing Units |
| Owner Occupied Housing Units | 11,382 | 72.7% |
| Renter-Occupied Housing Units | 4,274 | 27.3% |
| Total Occupied Housing Units | 15,656 | 100.0% |
Occupancy by Household Size in Colleton County
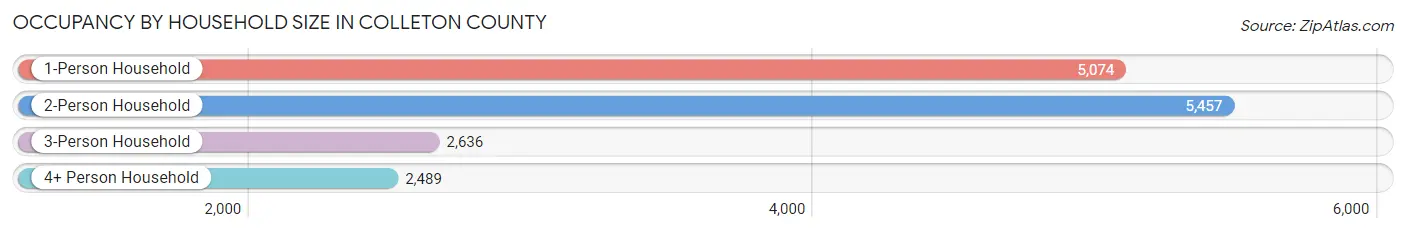
| Household Size | # Housing Units | % Housing Units |
| 1-Person Household | 5,074 | 32.4% |
| 2-Person Household | 5,457 | 34.9% |
| 3-Person Household | 2,636 | 16.8% |
| 4+ Person Household | 2,489 | 15.9% |
| Total Housing Units | 15,656 | 100.0% |
Occupancy by Ownership by Household Size in Colleton County
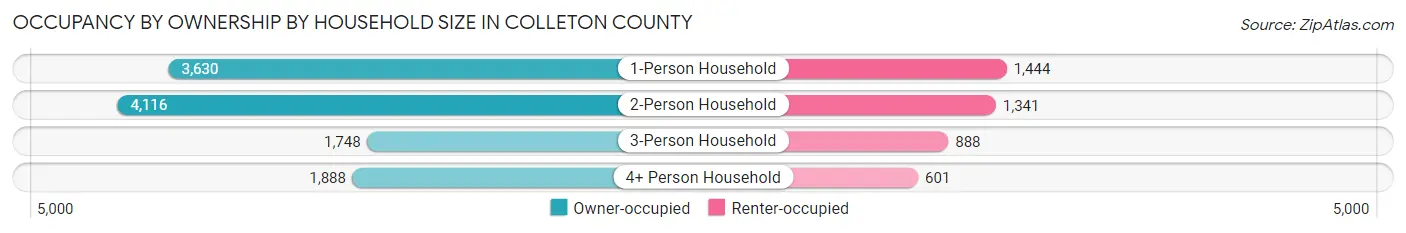
| Household Size | Owner-occupied | Renter-occupied |
| 1-Person Household | 3,630 (71.5%) | 1,444 (28.5%) |
| 2-Person Household | 4,116 (75.4%) | 1,341 (24.6%) |
| 3-Person Household | 1,748 (66.3%) | 888 (33.7%) |
| 4+ Person Household | 1,888 (75.8%) | 601 (24.1%) |
| Total Housing Units | 11,382 (72.7%) | 4,274 (27.3%) |
Occupancy by Educational Attainment in Colleton County
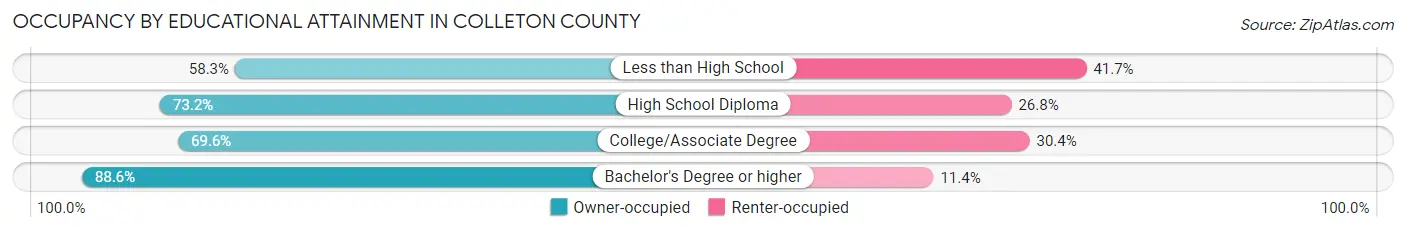
| Household Size | Owner-occupied | Renter-occupied |
| Less than High School | 1,252 (58.3%) | 895 (41.7%) |
| High School Diploma | 4,377 (73.2%) | 1,605 (26.8%) |
| College/Associate Degree | 3,357 (69.6%) | 1,467 (30.4%) |
| Bachelor's Degree or higher | 2,396 (88.6%) | 307 (11.4%) |
Occupancy by Age of Householder in Colleton County
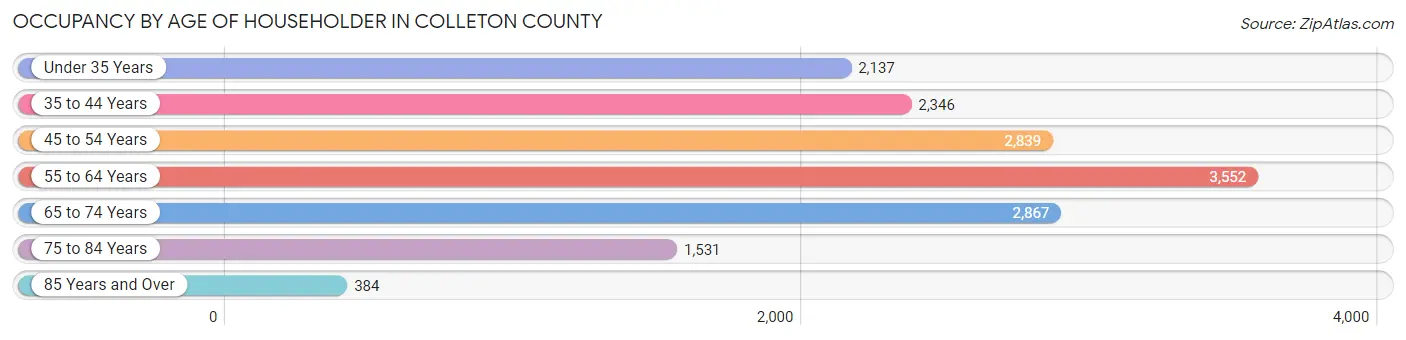
| Age Bracket | # Households | % Households |
| Under 35 Years | 2,137 | 13.7% |
| 35 to 44 Years | 2,346 | 15.0% |
| 45 to 54 Years | 2,839 | 18.1% |
| 55 to 64 Years | 3,552 | 22.7% |
| 65 to 74 Years | 2,867 | 18.3% |
| 75 to 84 Years | 1,531 | 9.8% |
| 85 Years and Over | 384 | 2.5% |
| Total | 15,656 | 100.0% |
Housing Finances in Colleton County
Median Income by Occupancy in Colleton County
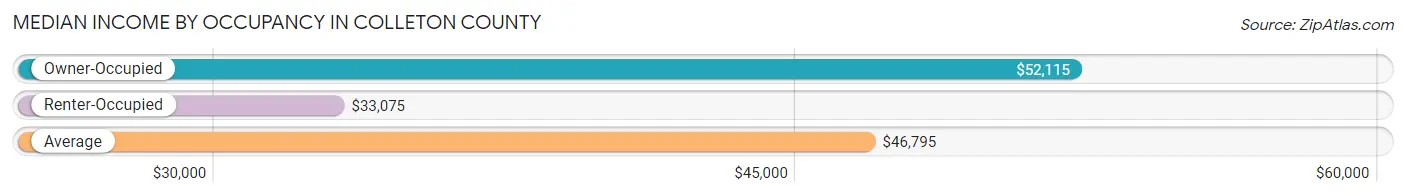
| Occupancy Type | # Households | Median Income |
| Owner-Occupied | 11,382 (72.7%) | $52,115 |
| Renter-Occupied | 4,274 (27.3%) | $33,075 |
| Average | 15,656 (100.0%) | $46,795 |
Occupancy by Householder Income Bracket in Colleton County
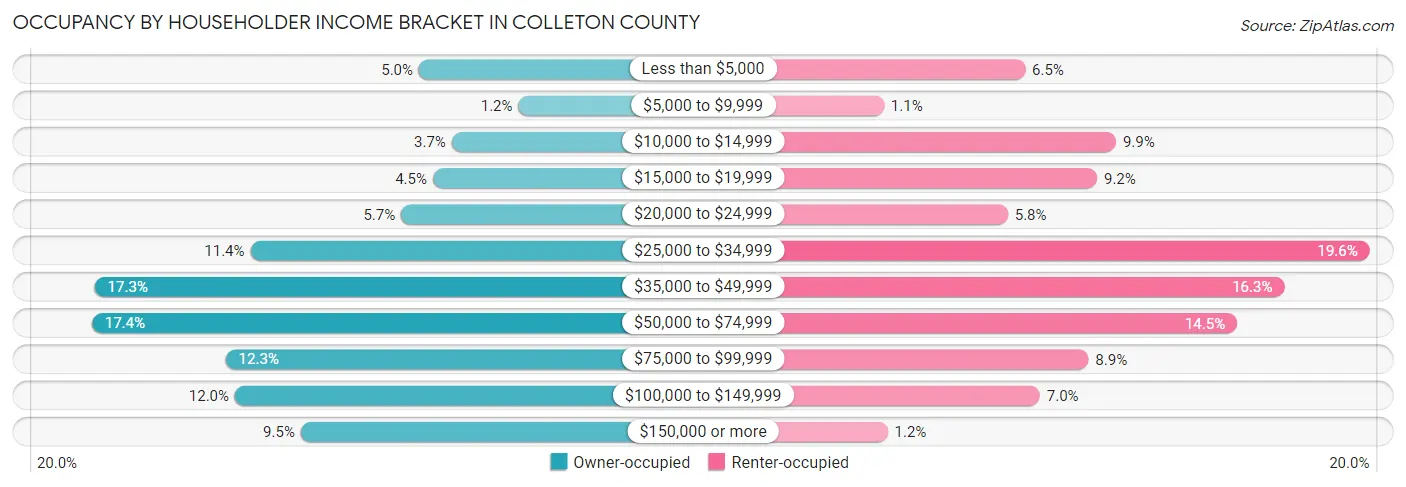
| Income Bracket | Owner-occupied | Renter-occupied |
| Less than $5,000 | 567 (5.0%) | 276 (6.5%) |
| $5,000 to $9,999 | 136 (1.2%) | 46 (1.1%) |
| $10,000 to $14,999 | 424 (3.7%) | 424 (9.9%) |
| $15,000 to $19,999 | 506 (4.4%) | 393 (9.2%) |
| $20,000 to $24,999 | 644 (5.7%) | 248 (5.8%) |
| $25,000 to $34,999 | 1,298 (11.4%) | 837 (19.6%) |
| $35,000 to $49,999 | 1,973 (17.3%) | 698 (16.3%) |
| $50,000 to $74,999 | 1,985 (17.4%) | 621 (14.5%) |
| $75,000 to $99,999 | 1,405 (12.3%) | 379 (8.9%) |
| $100,000 to $149,999 | 1,365 (12.0%) | 300 (7.0%) |
| $150,000 or more | 1,079 (9.5%) | 52 (1.2%) |
| Total | 11,382 (100.0%) | 4,274 (100.0%) |
Monthly Housing Cost Tiers in Colleton County
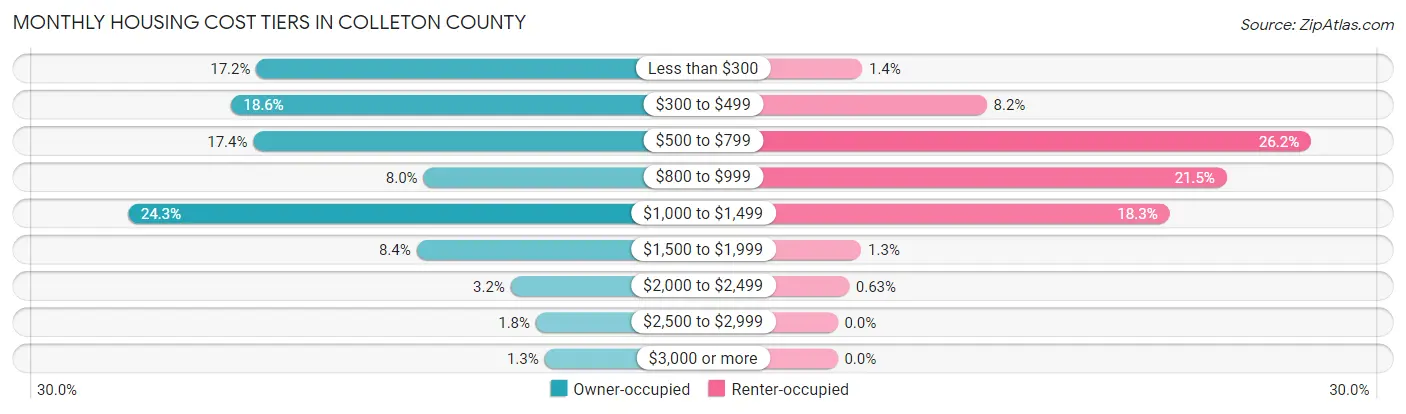
| Monthly Cost | Owner-occupied | Renter-occupied |
| Less than $300 | 1,958 (17.2%) | 58 (1.4%) |
| $300 to $499 | 2,120 (18.6%) | 352 (8.2%) |
| $500 to $799 | 1,977 (17.4%) | 1,118 (26.2%) |
| $800 to $999 | 907 (8.0%) | 919 (21.5%) |
| $1,000 to $1,499 | 2,766 (24.3%) | 784 (18.3%) |
| $1,500 to $1,999 | 950 (8.4%) | 56 (1.3%) |
| $2,000 to $2,499 | 358 (3.2%) | 27 (0.6%) |
| $2,500 to $2,999 | 200 (1.8%) | 0 (0.0%) |
| $3,000 or more | 146 (1.3%) | 0 (0.0%) |
| Total | 11,382 (100.0%) | 4,274 (100.0%) |
Physical Housing Characteristics in Colleton County
Housing Structures in Colleton County
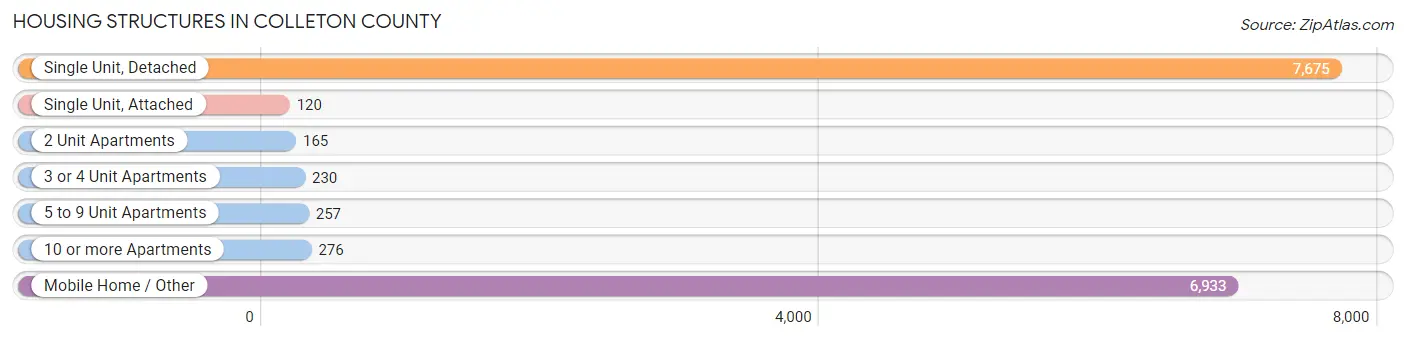
| Structure Type | # Housing Units | % Housing Units |
| Single Unit, Detached | 7,675 | 49.0% |
| Single Unit, Attached | 120 | 0.8% |
| 2 Unit Apartments | 165 | 1.1% |
| 3 or 4 Unit Apartments | 230 | 1.5% |
| 5 to 9 Unit Apartments | 257 | 1.6% |
| 10 or more Apartments | 276 | 1.8% |
| Mobile Home / Other | 6,933 | 44.3% |
| Total | 15,656 | 100.0% |
Housing Structures by Occupancy in Colleton County
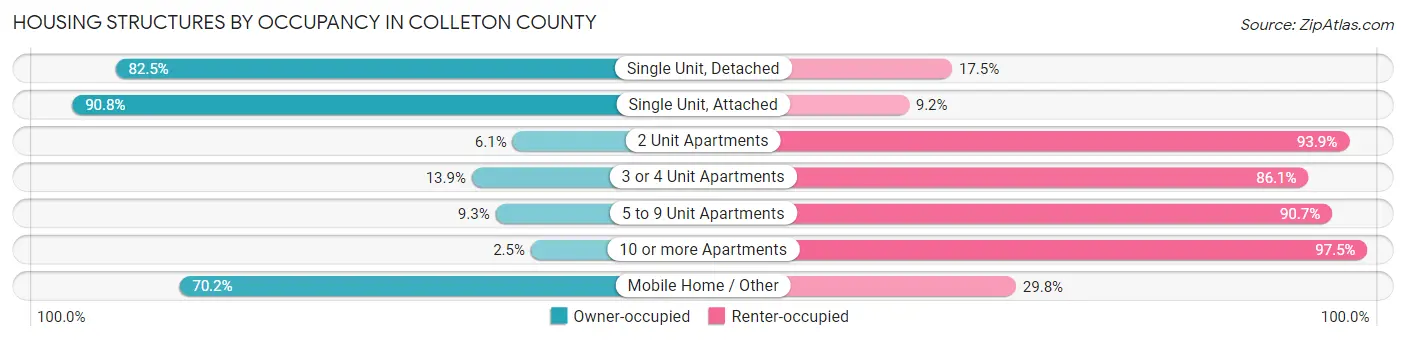
| Structure Type | Owner-occupied | Renter-occupied |
| Single Unit, Detached | 6,332 (82.5%) | 1,343 (17.5%) |
| Single Unit, Attached | 109 (90.8%) | 11 (9.2%) |
| 2 Unit Apartments | 10 (6.1%) | 155 (93.9%) |
| 3 or 4 Unit Apartments | 32 (13.9%) | 198 (86.1%) |
| 5 to 9 Unit Apartments | 24 (9.3%) | 233 (90.7%) |
| 10 or more Apartments | 7 (2.5%) | 269 (97.5%) |
| Mobile Home / Other | 4,868 (70.2%) | 2,065 (29.8%) |
| Total | 11,382 (72.7%) | 4,274 (27.3%) |
Housing Structures by Number of Rooms in Colleton County
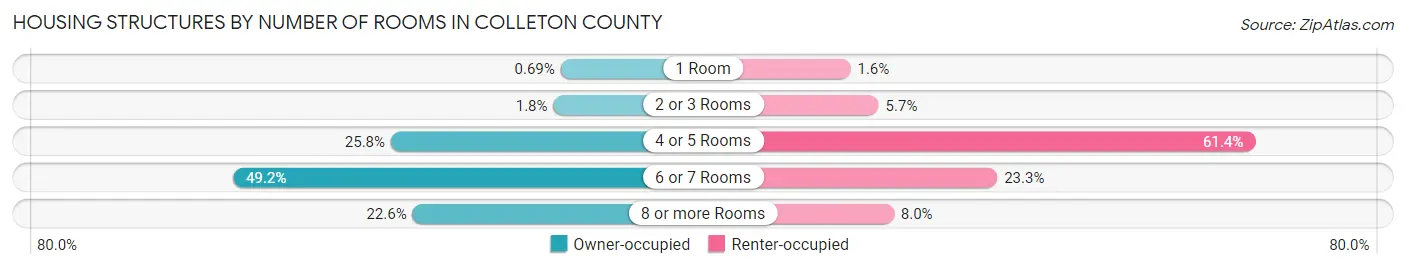
| Number of Rooms | Owner-occupied | Renter-occupied |
| 1 Room | 79 (0.7%) | 67 (1.6%) |
| 2 or 3 Rooms | 200 (1.8%) | 245 (5.7%) |
| 4 or 5 Rooms | 2,936 (25.8%) | 2,626 (61.4%) |
| 6 or 7 Rooms | 5,595 (49.2%) | 995 (23.3%) |
| 8 or more Rooms | 2,572 (22.6%) | 341 (8.0%) |
| Total | 11,382 (100.0%) | 4,274 (100.0%) |
Housing Structure by Heating Type in Colleton County
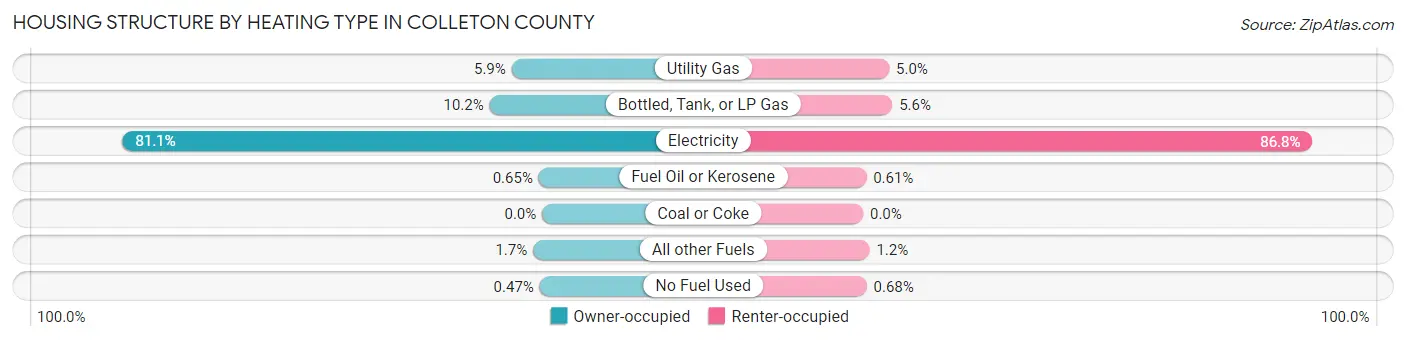
| Heating Type | Owner-occupied | Renter-occupied |
| Utility Gas | 670 (5.9%) | 215 (5.0%) |
| Bottled, Tank, or LP Gas | 1,155 (10.2%) | 241 (5.6%) |
| Electricity | 9,231 (81.1%) | 3,710 (86.8%) |
| Fuel Oil or Kerosene | 74 (0.6%) | 26 (0.6%) |
| Coal or Coke | 0 (0.0%) | 0 (0.0%) |
| All other Fuels | 198 (1.7%) | 53 (1.2%) |
| No Fuel Used | 54 (0.5%) | 29 (0.7%) |
| Total | 11,382 (100.0%) | 4,274 (100.0%) |
Household Vehicle Usage in Colleton County
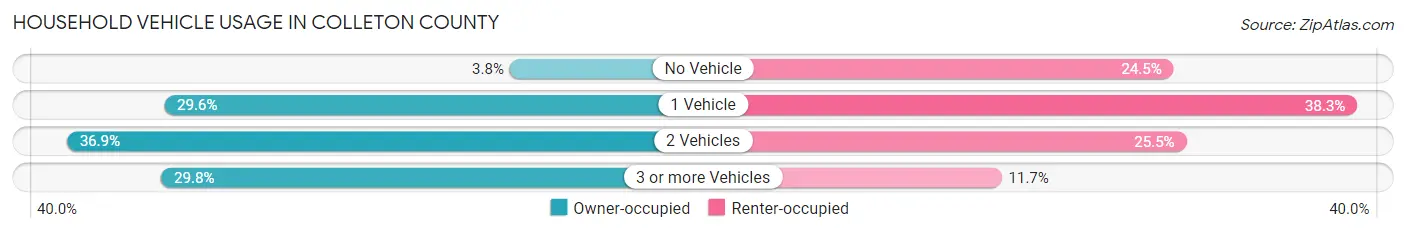
| Vehicles per Household | Owner-occupied | Renter-occupied |
| No Vehicle | 429 (3.8%) | 1,049 (24.5%) |
| 1 Vehicle | 3,367 (29.6%) | 1,635 (38.3%) |
| 2 Vehicles | 4,194 (36.8%) | 1,090 (25.5%) |
| 3 or more Vehicles | 3,392 (29.8%) | 500 (11.7%) |
| Total | 11,382 (100.0%) | 4,274 (100.0%) |
Real Estate & Mortgages in Colleton County
Real Estate and Mortgage Overview in Colleton County
| Characteristic | Without Mortgage | With Mortgage |
| Housing Units | 6,051 | 5,331 |
| Median Property Value | $89,500 | $168,300 |
| Median Household Income | $39,790 | $819 |
| Monthly Housing Costs | $413 | $146 |
| Real Estate Taxes | $536 | $186 |
Property Value by Mortgage Status in Colleton County
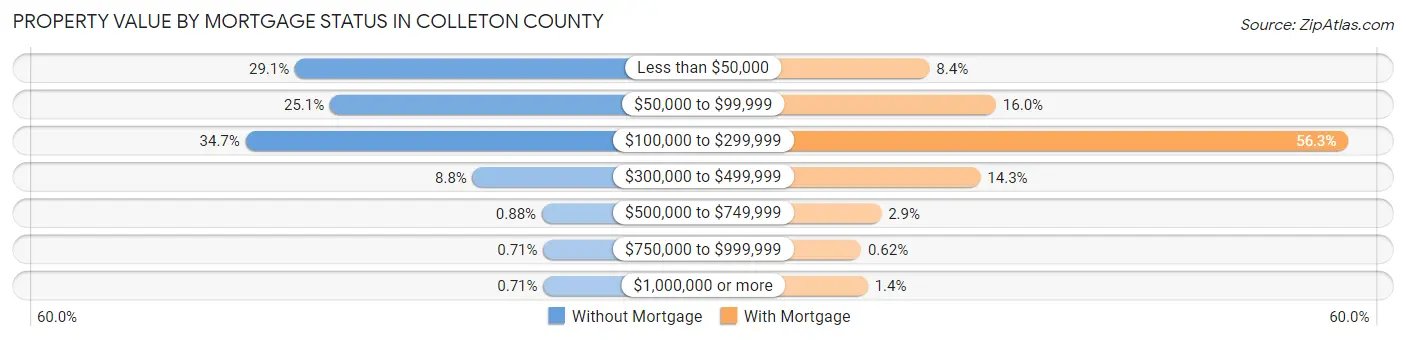
| Property Value | Without Mortgage | With Mortgage |
| Less than $50,000 | 1,760 (29.1%) | 450 (8.4%) |
| $50,000 to $99,999 | 1,518 (25.1%) | 855 (16.0%) |
| $100,000 to $299,999 | 2,102 (34.7%) | 3,002 (56.3%) |
| $300,000 to $499,999 | 532 (8.8%) | 761 (14.3%) |
| $500,000 to $749,999 | 53 (0.9%) | 156 (2.9%) |
| $750,000 to $999,999 | 43 (0.7%) | 33 (0.6%) |
| $1,000,000 or more | 43 (0.7%) | 74 (1.4%) |
| Total | 6,051 (100.0%) | 5,331 (100.0%) |
Household Income by Mortgage Status in Colleton County
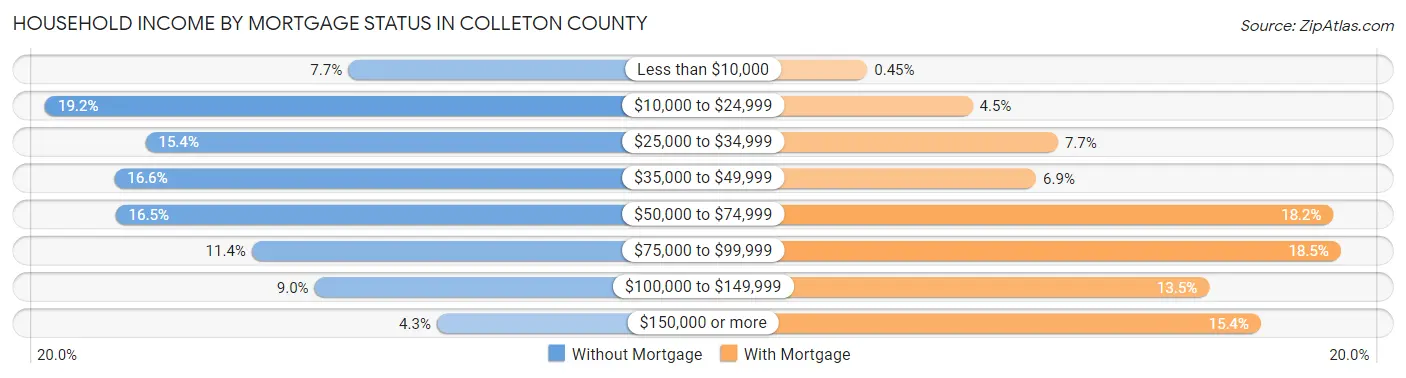
| Household Income | Without Mortgage | With Mortgage |
| Less than $10,000 | 465 (7.7%) | 24 (0.4%) |
| $10,000 to $24,999 | 1,163 (19.2%) | 238 (4.5%) |
| $25,000 to $34,999 | 931 (15.4%) | 411 (7.7%) |
| $35,000 to $49,999 | 1,003 (16.6%) | 367 (6.9%) |
| $50,000 to $74,999 | 1,000 (16.5%) | 970 (18.2%) |
| $75,000 to $99,999 | 687 (11.4%) | 985 (18.5%) |
| $100,000 to $149,999 | 542 (9.0%) | 718 (13.5%) |
| $150,000 or more | 260 (4.3%) | 823 (15.4%) |
| Total | 6,051 (100.0%) | 5,331 (100.0%) |
Property Value to Household Income Ratio in Colleton County
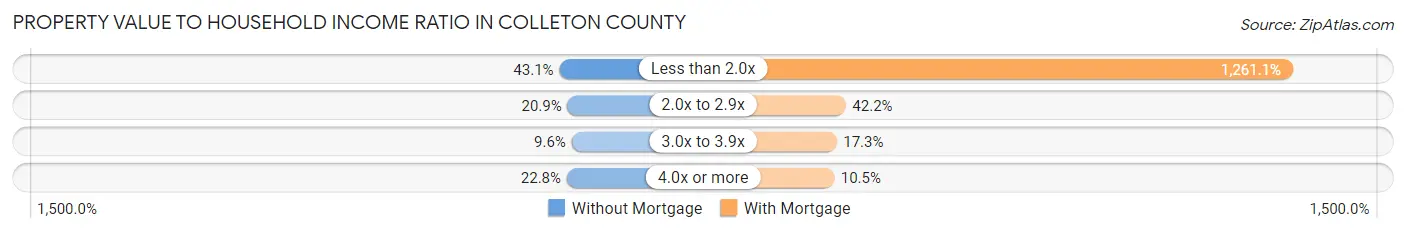
| Value-to-Income Ratio | Without Mortgage | With Mortgage |
| Less than 2.0x | 2,608 (43.1%) | 67,230 (1,261.1%) |
| 2.0x to 2.9x | 1,263 (20.9%) | 2,252 (42.2%) |
| 3.0x to 3.9x | 581 (9.6%) | 924 (17.3%) |
| 4.0x or more | 1,381 (22.8%) | 562 (10.5%) |
| Total | 6,051 (100.0%) | 5,331 (100.0%) |
Real Estate Taxes by Mortgage Status in Colleton County
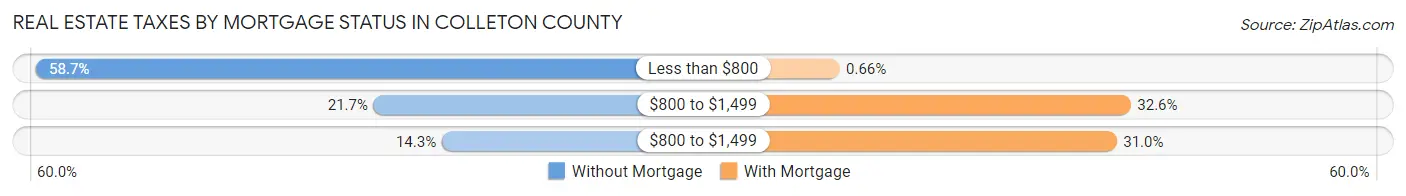
| Property Taxes | Without Mortgage | With Mortgage |
| Less than $800 | 3,554 (58.7%) | 35 (0.7%) |
| $800 to $1,499 | 1,315 (21.7%) | 1,737 (32.6%) |
| $800 to $1,499 | 863 (14.3%) | 1,655 (31.0%) |
| Total | 6,051 (100.0%) | 5,331 (100.0%) |
Health & Disability in Colleton County
Health Insurance Coverage by Age in Colleton County
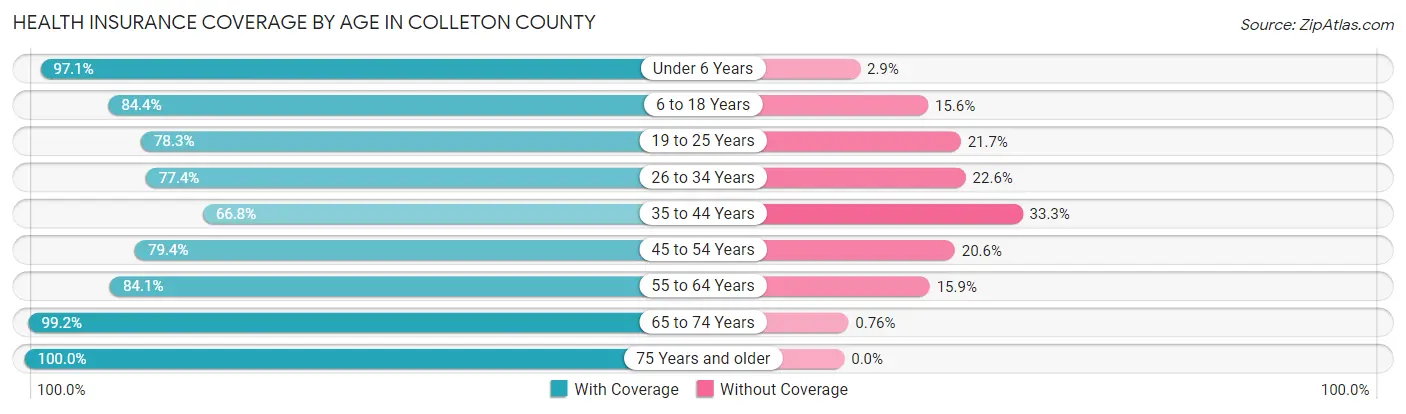
| Age Bracket | With Coverage | Without Coverage |
| Under 6 Years | 2,517 (97.1%) | 76 (2.9%) |
| 6 to 18 Years | 5,553 (84.4%) | 1,028 (15.6%) |
| 19 to 25 Years | 2,167 (78.3%) | 601 (21.7%) |
| 26 to 34 Years | 3,385 (77.4%) | 990 (22.6%) |
| 35 to 44 Years | 2,840 (66.7%) | 1,415 (33.3%) |
| 45 to 54 Years | 3,636 (79.4%) | 944 (20.6%) |
| 55 to 64 Years | 4,729 (84.1%) | 896 (15.9%) |
| 65 to 74 Years | 4,464 (99.2%) | 34 (0.8%) |
| 75 Years and older | 2,611 (100.0%) | 0 (0.0%) |
| Total | 31,902 (84.2%) | 5,984 (15.8%) |
Health Insurance Coverage by Citizenship Status in Colleton County
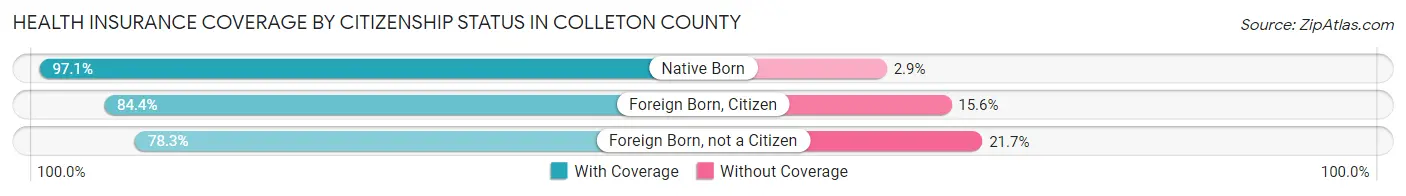
| Citizenship Status | With Coverage | Without Coverage |
| Native Born | 2,517 (97.1%) | 76 (2.9%) |
| Foreign Born, Citizen | 5,553 (84.4%) | 1,028 (15.6%) |
| Foreign Born, not a Citizen | 2,167 (78.3%) | 601 (21.7%) |
Health Insurance Coverage by Household Income in Colleton County
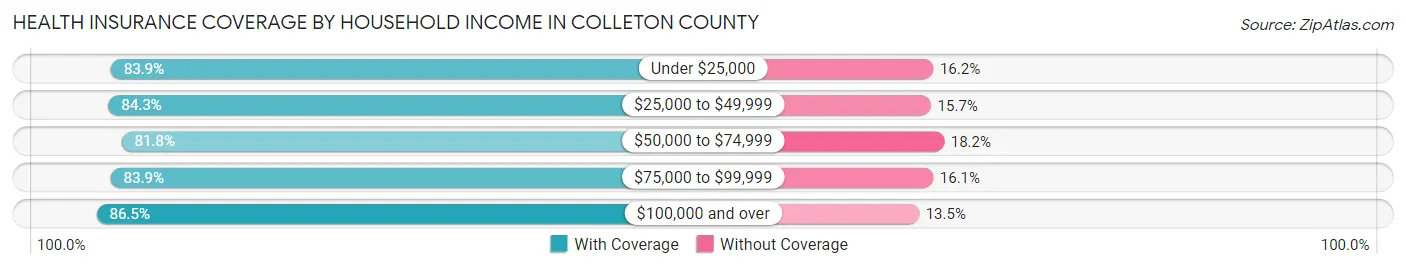
| Household Income | With Coverage | Without Coverage |
| Under $25,000 | 4,994 (83.9%) | 962 (16.2%) |
| $25,000 to $49,999 | 9,069 (84.3%) | 1,690 (15.7%) |
| $50,000 to $74,999 | 6,029 (81.8%) | 1,339 (18.2%) |
| $75,000 to $99,999 | 4,382 (83.9%) | 842 (16.1%) |
| $100,000 and over | 7,375 (86.5%) | 1,149 (13.5%) |
Public vs Private Health Insurance Coverage by Age in Colleton County
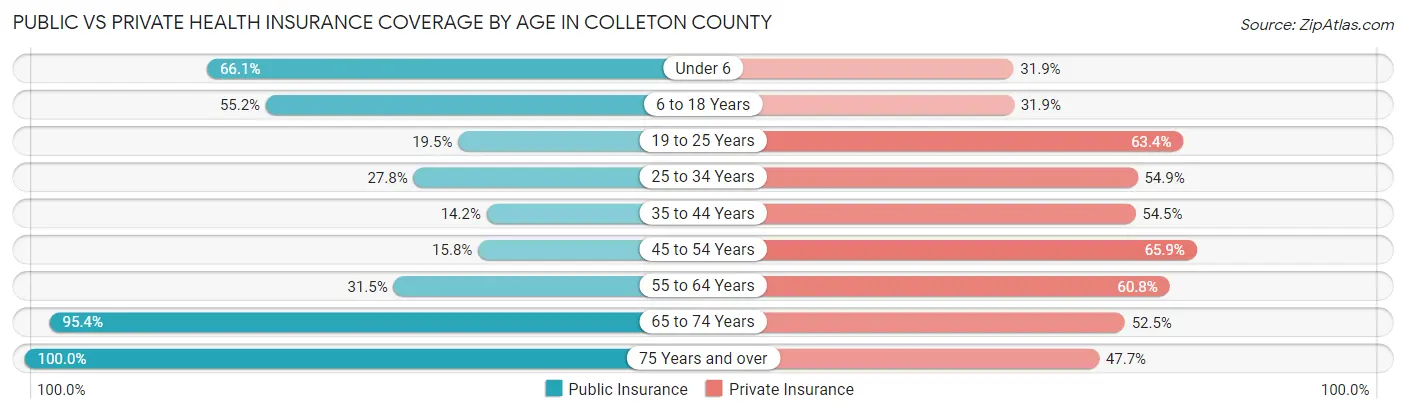
| Age Bracket | Public Insurance | Private Insurance |
| Under 6 | 1,715 (66.1%) | 826 (31.9%) |
| 6 to 18 Years | 3,633 (55.2%) | 2,100 (31.9%) |
| 19 to 25 Years | 540 (19.5%) | 1,754 (63.4%) |
| 25 to 34 Years | 1,217 (27.8%) | 2,401 (54.9%) |
| 35 to 44 Years | 605 (14.2%) | 2,318 (54.5%) |
| 45 to 54 Years | 724 (15.8%) | 3,017 (65.9%) |
| 55 to 64 Years | 1,773 (31.5%) | 3,422 (60.8%) |
| 65 to 74 Years | 4,289 (95.4%) | 2,362 (52.5%) |
| 75 Years and over | 2,611 (100.0%) | 1,246 (47.7%) |
| Total | 17,107 (45.2%) | 19,446 (51.3%) |
Disability Status by Sex by Age in Colleton County
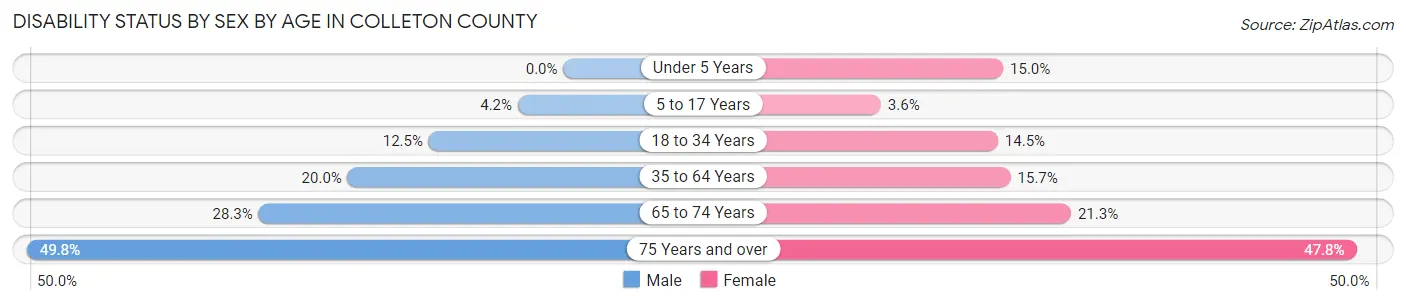
| Age Bracket | Male | Female |
| Under 5 Years | 0 (0.0%) | 156 (15.0%) |
| 5 to 17 Years | 136 (4.2%) | 119 (3.6%) |
| 18 to 34 Years | 488 (12.5%) | 547 (14.5%) |
| 35 to 64 Years | 1,375 (20.0%) | 1,190 (15.7%) |
| 65 to 74 Years | 578 (28.3%) | 522 (21.3%) |
| 75 Years and over | 471 (49.8%) | 795 (47.7%) |
Disability Class by Sex by Age in Colleton County
Disability Class: Hearing Difficulty
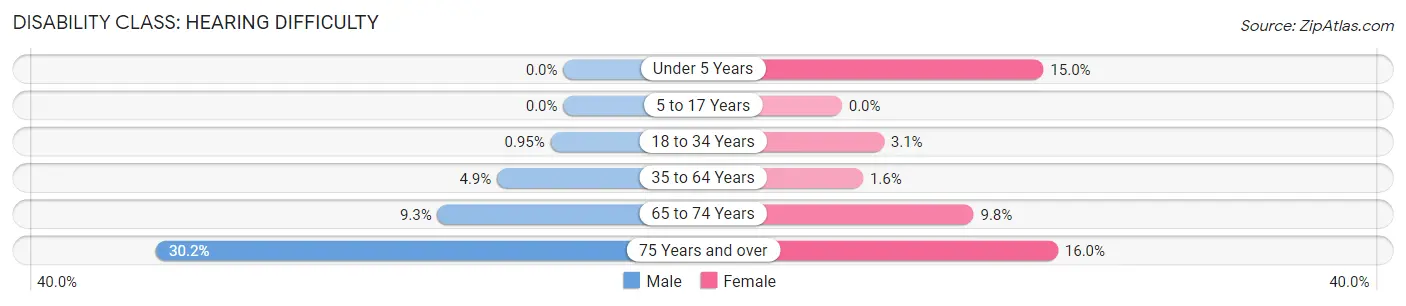
| Age Bracket | Male | Female |
| Under 5 Years | 0 (0.0%) | 156 (15.0%) |
| 5 to 17 Years | 0 (0.0%) | 0 (0.0%) |
| 18 to 34 Years | 37 (0.9%) | 118 (3.1%) |
| 35 to 64 Years | 338 (4.9%) | 119 (1.6%) |
| 65 to 74 Years | 191 (9.3%) | 240 (9.8%) |
| 75 Years and over | 286 (30.2%) | 267 (16.0%) |
Disability Class: Vision Difficulty
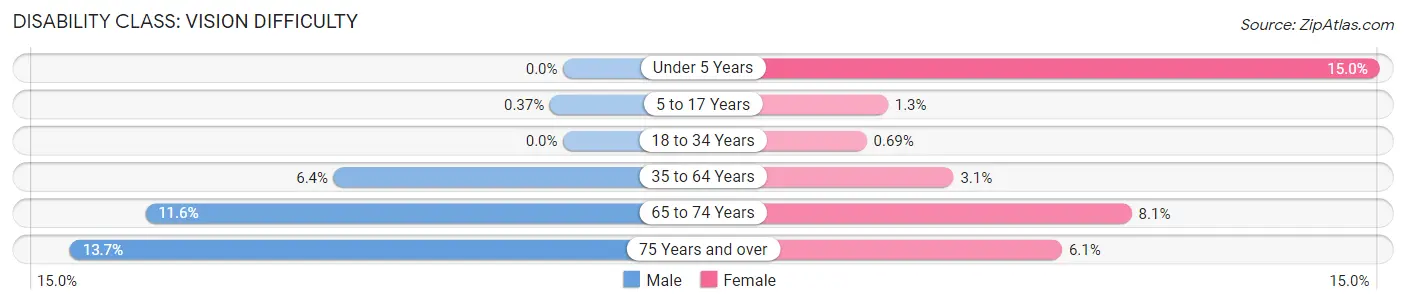
| Age Bracket | Male | Female |
| Under 5 Years | 0 (0.0%) | 156 (15.0%) |
| 5 to 17 Years | 12 (0.4%) | 42 (1.3%) |
| 18 to 34 Years | 0 (0.0%) | 26 (0.7%) |
| 35 to 64 Years | 439 (6.4%) | 236 (3.1%) |
| 65 to 74 Years | 238 (11.6%) | 198 (8.1%) |
| 75 Years and over | 130 (13.7%) | 102 (6.1%) |
Disability Class: Cognitive Difficulty
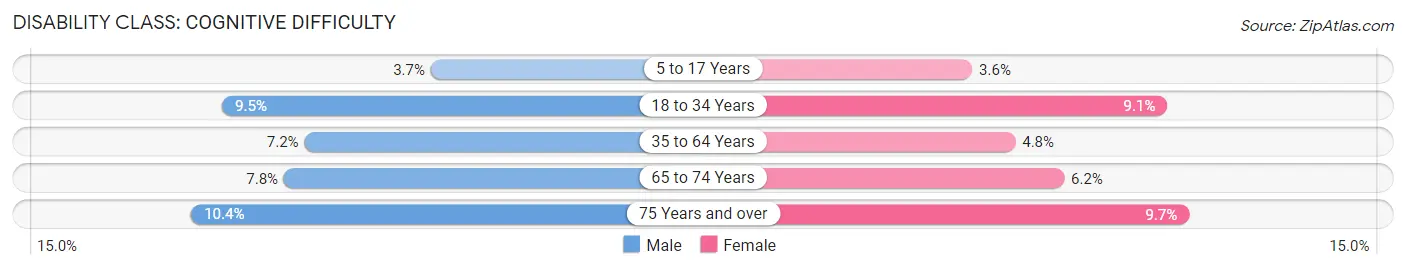
| Age Bracket | Male | Female |
| 5 to 17 Years | 119 (3.7%) | 119 (3.6%) |
| 18 to 34 Years | 371 (9.5%) | 342 (9.1%) |
| 35 to 64 Years | 495 (7.2%) | 367 (4.8%) |
| 65 to 74 Years | 159 (7.8%) | 152 (6.2%) |
| 75 Years and over | 98 (10.4%) | 161 (9.7%) |
Disability Class: Ambulatory Difficulty
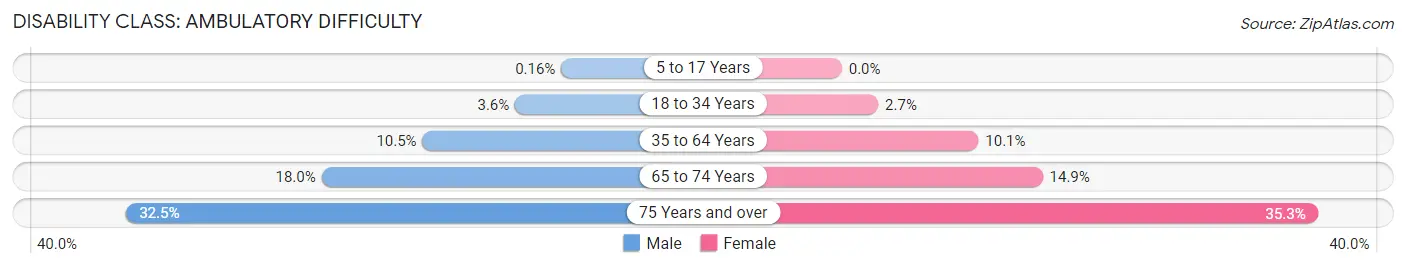
| Age Bracket | Male | Female |
| 5 to 17 Years | 5 (0.2%) | 0 (0.0%) |
| 18 to 34 Years | 140 (3.6%) | 102 (2.7%) |
| 35 to 64 Years | 718 (10.5%) | 770 (10.1%) |
| 65 to 74 Years | 367 (17.9%) | 366 (14.9%) |
| 75 Years and over | 307 (32.5%) | 588 (35.3%) |
Disability Class: Self-Care Difficulty
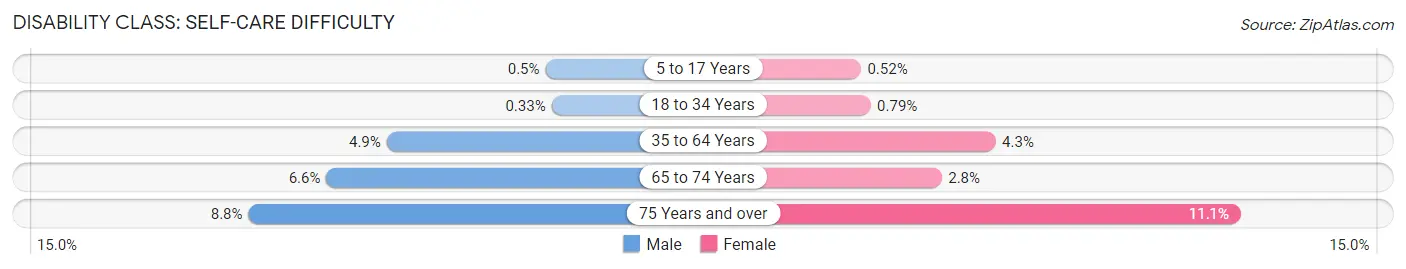
| Age Bracket | Male | Female |
| 5 to 17 Years | 16 (0.5%) | 17 (0.5%) |
| 18 to 34 Years | 13 (0.3%) | 30 (0.8%) |
| 35 to 64 Years | 338 (4.9%) | 324 (4.3%) |
| 65 to 74 Years | 135 (6.6%) | 68 (2.8%) |
| 75 Years and over | 83 (8.8%) | 185 (11.1%) |
Technology Access in Colleton County
Computing Device Access in Colleton County
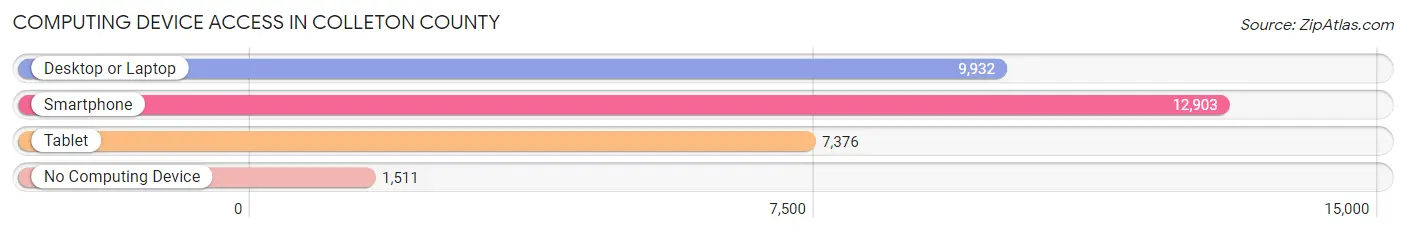
| Device Type | # Households | % Households |
| Desktop or Laptop | 9,932 | 63.4% |
| Smartphone | 12,903 | 82.4% |
| Tablet | 7,376 | 47.1% |
| No Computing Device | 1,511 | 9.7% |
| Total | 15,656 | 100.0% |
Internet Access in Colleton County
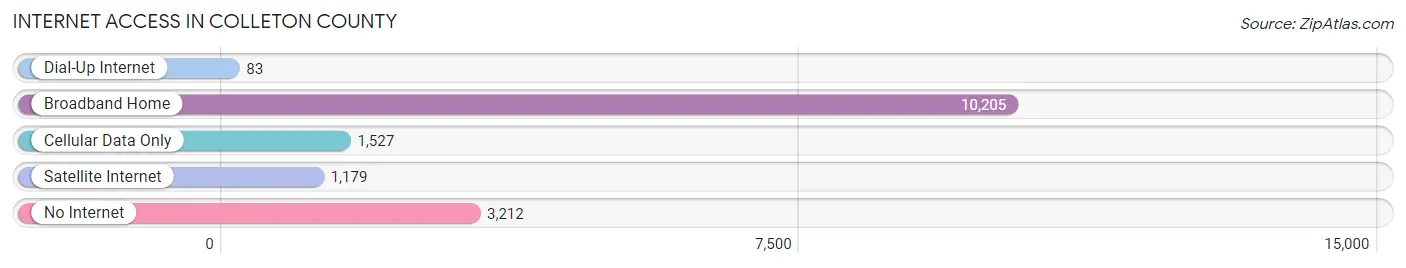
| Internet Type | # Households | % Households |
| Dial-Up Internet | 83 | 0.5% |
| Broadband Home | 10,205 | 65.2% |
| Cellular Data Only | 1,527 | 9.8% |
| Satellite Internet | 1,179 | 7.5% |
| No Internet | 3,212 | 20.5% |
| Total | 15,656 | 100.0% |
Colleton County Summary
Colleton County, South Carolina is located in the Lowcountry region of the state and is part of the Charleston-North Charleston-Summerville Metropolitan Statistical Area. The county was established in 1798 and is named after Sir John Colleton, one of the eight Lords Proprietors of the Province of Carolina. The county seat is Walterboro, and the population was estimated to be 38,892 in 2019.
Geography
Colleton County is located in the southeastern corner of South Carolina, bordered by Charleston County to the north, Dorchester County to the east, Beaufort County to the south, and Hampton County to the west. The county covers an area of 837 square miles, of which 819 square miles is land and 18 square miles is water. The county is mostly flat, with the highest point being the summit of Pine Hill at an elevation of 200 feet. The Edisto River forms the western border of the county, and the Combahee River forms the eastern border.
The county is home to several state parks, including Edisto Beach State Park, Colleton State Park, and the ACE Basin National Wildlife Refuge. The ACE Basin is a large estuarine system that includes the Ashepoo, Combahee, and Edisto Rivers and their tributaries. It is one of the largest undeveloped estuarine systems in the United States and is home to a variety of wildlife, including bald eagles, ospreys, and alligators.
Economy
The economy of Colleton County is largely based on agriculture, forestry, and tourism. The county is home to several large farms, including the Edisto Farm, which produces cotton, soybeans, and peanuts. The county is also home to several timber companies, including the Colleton Timber Company, which produces lumber and other wood products.
Tourism is an important part of the county’s economy, with visitors coming to enjoy the beaches, state parks, and wildlife refuges. The county is also home to several historic sites, including the Colleton County Courthouse, which was built in 1820 and is listed on the National Register of Historic Places.
Demographics
As of the 2010 census, the population of Colleton County was 38,892, with a population density of 47 people per square mile. The racial makeup of the county was 68.3% White, 28.2% African American, 0.5% Native American, 0.7% Asian, 0.1% Pacific Islander, 0.7% from other races, and 1.5% from two or more races. Hispanic or Latino of any race were 2.2% of the population.
The median income for a household in the county was $37,845, and the median income for a family was $45,945. The per capita income for the county was $19,845. About 17.2% of the population was below the poverty line.
Conclusion
Colleton County, South Carolina is a rural county located in the Lowcountry region of the state. The county is home to several state parks, timber companies, and farms, and is a popular destination for tourists. The population of the county is largely white, with a significant African American population. The economy of the county is largely based on agriculture, forestry, and tourism, and the median income for a household is slightly below the state average.
Common Questions
What is Per Capita Income in Colleton County?
Per Capita income in Colleton County is $26,253.
What is the Median Family Income in Colleton County?
Median Family Income in Colleton County is $58,559.
What is the Median Household income in Colleton County?
Median Household Income in Colleton County is $46,795.
What is Income or Wage Gap in Colleton County?
Income or Wage Gap in Colleton County is 14.6%.
Women in Colleton County earn 85.4 cents for every dollar earned by a man.
What is Family Income Deficit in Colleton County?
Family Income Deficit in Colleton County is $12,292.
Families that are below poverty line in Colleton County earn $12,292 less on average than the poverty threshold level.
What is Inequality or Gini Index in Colleton County?
Inequality or Gini Index in Colleton County is 0.46.
What is the Total Population of Colleton County?
Total Population of Colleton County is 38,561.
What is the Total Male Population of Colleton County?
Total Male Population of Colleton County is 18,675.
What is the Total Female Population of Colleton County?
Total Female Population of Colleton County is 19,886.
What is the Ratio of Males per 100 Females in Colleton County?
There are 93.91 Males per 100 Females in Colleton County.
What is the Ratio of Females per 100 Males in Colleton County?
There are 106.48 Females per 100 Males in Colleton County.
What is the Median Population Age in Colleton County?
Median Population Age in Colleton County is 41.6 Years.
What is the Average Family Size in Colleton County
Average Family Size in Colleton County is 3.1 People.
What is the Average Household Size in Colleton County
Average Household Size in Colleton County is 2.4 People.
How Large is the Labor Force in Colleton County?
There are 17,214 People in the Labor Forcein in Colleton County.
What is the Percentage of People in the Labor Force in Colleton County?
55.7% of People are in the Labor Force in Colleton County.
What is the Unemployment Rate in Colleton County?
Unemployment Rate in Colleton County is 8.6%.