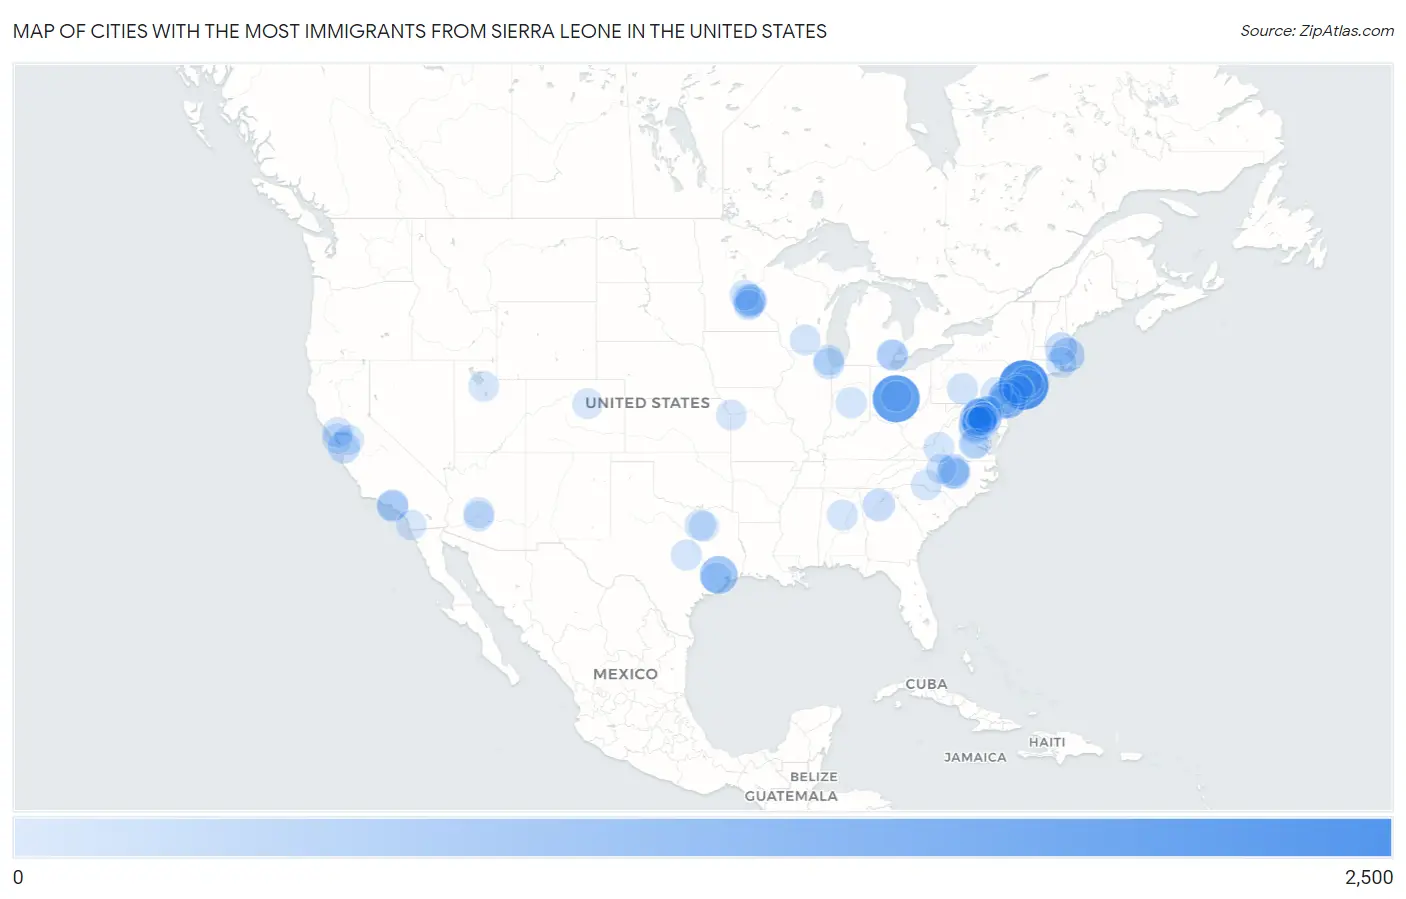
Cities with the Most Immigrants from Sierra Leone in the United States
RELATED REPORTS & OPTIONS
Sierra Leone
United States
Compare Cities
Map of Cities with the Most Immigrants from Sierra Leone in the United States
0
2,500
Cities with the Most Immigrants from Sierra Leone in the United States
| City | Sierra Leone | vs State | vs National | |
| 1. | New York | 2,399 | 3,296(72.79%)#1 | 47,598(5.04%)#1 |
| 2. | Columbus | 2,093 | 2,658(78.74%)#1 | 47,598(4.40%)#2 |
| 3. | Philadelphia | 1,111 | 3,949(28.13%)#1 | 47,598(2.33%)#3 |
| 4. | Houston | 979 | 3,468(28.23%)#1 | 47,598(2.06%)#4 |
| 5. | Alexandria | 842 | 6,458(13.04%)#1 | 47,598(1.77%)#5 |
| 6. | Seabrook | 696 | 10,233(6.80%)#1 | 47,598(1.46%)#6 |
| 7. | Dale City | 605 | 6,458(9.37%)#2 | 47,598(1.27%)#7 |
| 8. | Boston | 551 | 1,538(35.83%)#1 | 47,598(1.16%)#8 |
| 9. | Bowie | 475 | 10,233(4.64%)#2 | 47,598(1.00%)#9 |
| 10. | Columbia | 465 | 10,233(4.54%)#3 | 47,598(0.98%)#10 |
| 11. | Hybla Valley | 431 | 6,458(6.67%)#3 | 47,598(0.91%)#11 |
| 12. | Fairland | 419 | 10,233(4.09%)#4 | 47,598(0.88%)#12 |
| 13. | Beltsville | 404 | 10,233(3.95%)#5 | 47,598(0.85%)#13 |
| 14. | Aspen Hill | 394 | 10,233(3.85%)#6 | 47,598(0.83%)#14 |
| 15. | Lowell | 362 | 1,538(23.54%)#2 | 47,598(0.76%)#15 |
| 16. | Lake Arbor | 334 | 10,233(3.26%)#7 | 47,598(0.70%)#16 |
| 17. | Brooklyn Park | 326 | 1,385(23.54%)#1 | 47,598(0.68%)#17 |
| 18. | Chapel Hill | 316 | 1,485(21.28%)#1 | 47,598(0.66%)#18 |
| 19. | Lincolnia | 316 | 6,458(4.89%)#4 | 47,598(0.66%)#19 |
| 20. | Landover | 313 | 10,233(3.06%)#8 | 47,598(0.66%)#20 |
| 21. | Johns Creek | 311 | 1,754(17.73%)#1 | 47,598(0.65%)#21 |
| 22. | Stafford Courthouse | 310 | 6,458(4.80%)#5 | 47,598(0.65%)#22 |
| 23. | San Jose | 306 | 2,618(11.69%)#1 | 47,598(0.64%)#23 |
| 24. | Reston | 296 | 6,458(4.58%)#6 | 47,598(0.62%)#24 |
| 25. | Durham | 295 | 1,485(19.87%)#2 | 47,598(0.62%)#25 |
| 26. | Washington | 291 | 291(100.00%)#1 | 47,598(0.61%)#26 |
| 27. | Greenbelt | 288 | 10,233(2.81%)#9 | 47,598(0.61%)#27 |
| 28. | Chillum | 271 | 10,233(2.65%)#10 | 47,598(0.57%)#28 |
| 29. | Waldorf | 260 | 10,233(2.54%)#11 | 47,598(0.55%)#29 |
| 30. | Woodbridge | 254 | 6,458(3.93%)#7 | 47,598(0.53%)#30 |
| 31. | Minneapolis | 251 | 1,385(18.12%)#2 | 47,598(0.53%)#31 |
| 32. | Yeadon Borough | 245 | 3,949(6.20%)#2 | 47,598(0.51%)#32 |
| 33. | South Laurel | 243 | 10,233(2.37%)#12 | 47,598(0.51%)#33 |
| 34. | White Oak | 243 | 10,233(2.37%)#13 | 47,598(0.51%)#34 |
| 35. | Los Angeles | 234 | 2,618(8.94%)#2 | 47,598(0.49%)#35 |
| 36. | Bladensburg | 231 | 10,233(2.26%)#14 | 47,598(0.49%)#36 |
| 37. | Sharon Hill Borough | 228 | 3,949(5.77%)#3 | 47,598(0.48%)#37 |
| 38. | Hawthorne | 217 | 2,618(8.29%)#3 | 47,598(0.46%)#38 |
| 39. | New Brighton | 216 | 1,385(15.60%)#3 | 47,598(0.45%)#39 |
| 40. | Dearborn Heights | 202 | 861(23.46%)#1 | 47,598(0.42%)#40 |
| 41. | Lorton | 202 | 6,458(3.13%)#8 | 47,598(0.42%)#41 |
| 42. | Hempstead | 191 | 3,296(5.79%)#2 | 47,598(0.40%)#42 |
| 43. | Greenwood | 191 | 3,949(4.84%)#4 | 47,598(0.40%)#43 |
| 44. | North Laurel | 190 | 10,233(1.86%)#15 | 47,598(0.40%)#44 |
| 45. | Marlboro Village | 188 | 10,233(1.84%)#16 | 47,598(0.39%)#45 |
| 46. | Clinton | 186 | 10,233(1.82%)#17 | 47,598(0.39%)#46 |
| 47. | Wilmington | 185 | 399(46.37%)#1 | 47,598(0.39%)#47 |
| 48. | Bailey S Crossroads | 185 | 6,458(2.86%)#9 | 47,598(0.39%)#48 |
| 49. | Chicago | 179 | 335(53.43%)#1 | 47,598(0.38%)#49 |
| 50. | Dallas | 177 | 3,468(5.10%)#2 | 47,598(0.37%)#50 |
| 51. | Yonkers | 176 | 3,296(5.34%)#3 | 47,598(0.37%)#51 |
| 52. | Old Bridge | 176 | 2,373(7.42%)#1 | 47,598(0.37%)#52 |
| 53. | Highland Springs | 175 | 6,458(2.71%)#10 | 47,598(0.37%)#53 |
| 54. | Glenmont | 174 | 10,233(1.70%)#18 | 47,598(0.37%)#54 |
| 55. | Indianapolis | 170 | 395(43.04%)#1 | 47,598(0.36%)#55 |
| 56. | Morrisville | 169 | 1,485(11.38%)#3 | 47,598(0.36%)#56 |
| 57. | Centreville | 166 | 6,458(2.57%)#11 | 47,598(0.35%)#57 |
| 58. | Largo | 164 | 10,233(1.60%)#19 | 47,598(0.34%)#58 |
| 59. | Killeen | 162 | 3,468(4.67%)#3 | 47,598(0.34%)#59 |
| 60. | Pawtucket | 160 | 172(93.02%)#1 | 47,598(0.34%)#60 |
| 61. | Westerville | 158 | 2,658(5.94%)#2 | 47,598(0.33%)#61 |
| 62. | Glen Burnie | 157 | 10,233(1.53%)#20 | 47,598(0.33%)#62 |
| 63. | Vestavia Hills | 157 | 219(71.69%)#1 | 47,598(0.33%)#63 |
| 64. | Roanoke | 154 | 6,458(2.38%)#12 | 47,598(0.32%)#64 |
| 65. | Reading | 151 | 3,949(3.82%)#5 | 47,598(0.32%)#65 |
| 66. | Evanston | 151 | 335(45.07%)#2 | 47,598(0.32%)#66 |
| 67. | Drexel Hill | 148 | 3,949(3.75%)#6 | 47,598(0.31%)#67 |
| 68. | Mission Bend | 147 | 3,468(4.24%)#4 | 47,598(0.31%)#68 |
| 69. | Charlotte | 143 | 1,485(9.63%)#4 | 47,598(0.30%)#69 |
| 70. | Glenn Dale | 142 | 10,233(1.39%)#21 | 47,598(0.30%)#70 |
| 71. | Madison | 140 | 247(56.68%)#1 | 47,598(0.29%)#71 |
| 72. | Calverton | 140 | 10,233(1.37%)#22 | 47,598(0.29%)#72 |
| 73. | Baltimore | 139 | 10,233(1.36%)#23 | 47,598(0.29%)#73 |
| 74. | Dearborn | 138 | 861(16.03%)#2 | 47,598(0.29%)#74 |
| 75. | Kansas City | 137 | 329(41.64%)#1 | 47,598(0.29%)#75 |
| 76. | Germantown | 136 | 10,233(1.33%)#24 | 47,598(0.29%)#76 |
| 77. | Oakland | 132 | 2,618(5.04%)#4 | 47,598(0.28%)#77 |
| 78. | Glendale | 132 | 503(26.24%)#1 | 47,598(0.28%)#78 |
| 79. | Essex | 132 | 10,233(1.29%)#25 | 47,598(0.28%)#79 |
| 80. | Elk River | 131 | 1,385(9.46%)#4 | 47,598(0.28%)#80 |
| 81. | Montgomery Village | 129 | 10,233(1.26%)#26 | 47,598(0.27%)#81 |
| 82. | New Carrollton | 127 | 10,233(1.24%)#27 | 47,598(0.27%)#82 |
| 83. | Lake Ridge | 126 | 6,458(1.95%)#13 | 47,598(0.26%)#83 |
| 84. | Travis Ranch | 126 | 3,468(3.63%)#5 | 47,598(0.26%)#84 |
| 85. | West Valley City | 124 | 162(76.54%)#1 | 47,598(0.26%)#85 |
| 86. | Greensboro | 123 | 1,485(8.28%)#5 | 47,598(0.26%)#86 |
| 87. | Bloomington | 121 | 1,385(8.74%)#5 | 47,598(0.25%)#87 |
| 88. | Aurora | 120 | 207(57.97%)#1 | 47,598(0.25%)#88 |
| 89. | Glenarden | 118 | 10,233(1.15%)#28 | 47,598(0.25%)#89 |
| 90. | Newington Forest | 117 | 6,458(1.81%)#14 | 47,598(0.25%)#90 |
| 91. | Lansdowne Borough | 116 | 3,949(2.94%)#7 | 47,598(0.24%)#91 |
| 92. | Vallejo | 114 | 2,618(4.35%)#5 | 47,598(0.24%)#92 |
| 93. | Woodlawn Cdp Prince George S County | 114 | 10,233(1.11%)#29 | 47,598(0.24%)#93 |
| 94. | Richmond | 113 | 6,458(1.75%)#15 | 47,598(0.24%)#94 |
| 95. | Tracy | 113 | 2,618(4.32%)#6 | 47,598(0.24%)#95 |
| 96. | Avondale | 113 | 503(22.47%)#2 | 47,598(0.24%)#96 |
| 97. | Camp Springs | 112 | 10,233(1.09%)#30 | 47,598(0.24%)#97 |
| 98. | San Diego | 110 | 2,618(4.20%)#7 | 47,598(0.23%)#98 |
| 99. | East Franklin | 110 | 2,373(4.64%)#2 | 47,598(0.23%)#99 |
| 100. | Fort Washington | 109 | 10,233(1.07%)#31 | 47,598(0.23%)#100 |
Common Questions
What are the Top 10 Cities with the Most Immigrants from Sierra Leone in the United States?
Top 10 Cities with the Most Immigrants from Sierra Leone in the United States are:
What city has the Most Immigrants from Sierra Leone in the United States?
New York has the Most Immigrants from Sierra Leone in the United States with 2,399.
What is the Total Immigrants from Sierra Leone in the United States?
Total Immigrants from Sierra Leone in the United States is 47,598.