Lexington, SC Map & Demographics
Lexington Map
Lexington Overview
$38,796
PER CAPITA INCOME
$94,306
AVG FAMILY INCOME
$78,164
AVG HOUSEHOLD INCOME
33.2%
WAGE / INCOME GAP [ % ]
66.8¢/ $1
WAGE / INCOME GAP [ $ ]
0.40
INEQUALITY / GINI INDEX
23,665
TOTAL POPULATION
11,445
MALE POPULATION
12,220
FEMALE POPULATION
93.66
MALES / 100 FEMALES
106.77
FEMALES / 100 MALES
38.8
MEDIAN AGE
3.0
AVG FAMILY SIZE
2.4
AVG HOUSEHOLD SIZE
11,599
LABOR FORCE [ PEOPLE ]
62.4%
PERCENT IN LABOR FORCE
3.6%
UNEMPLOYMENT RATE
Lexington Area Codes
Income in Lexington
Income Overview in Lexington
Per Capita Income in Lexington is $38,796, while median incomes of families and households are $94,306 and $78,164 respectively.
| Characteristic | Number | Measure |
| Per Capita Income | 23,665 | $38,796 |
| Median Family Income | 6,188 | $94,306 |
| Mean Family Income | 6,188 | $112,763 |
| Median Household Income | 9,274 | $78,164 |
| Mean Household Income | 9,274 | $97,369 |
| Income Deficit | 6,188 | $0 |
| Wage / Income Gap (%) | 23,665 | 33.23% |
| Wage / Income Gap ($) | 23,665 | 66.77¢ per $1 |
| Gini / Inequality Index | 23,665 | 0.40 |
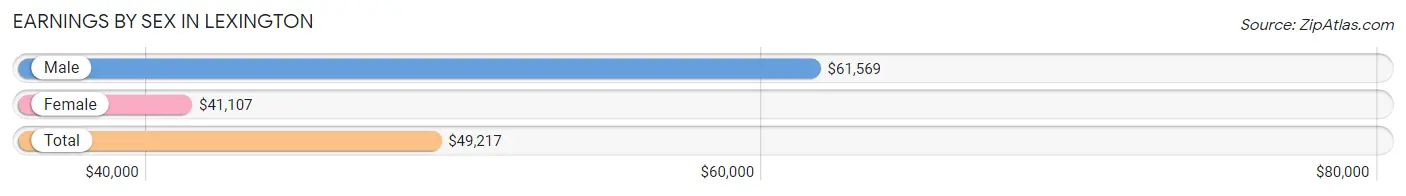
Earnings by Sex in Lexington
Average Earnings in Lexington are $49,217, $61,569 for men and $41,107 for women, a difference of 33.2%.
| Sex | Number | Average Earnings |
| Male | 6,315 (51.5%) | $61,569 |
| Female | 5,947 (48.5%) | $41,107 |
| Total | 12,262 (100.0%) | $49,217 |
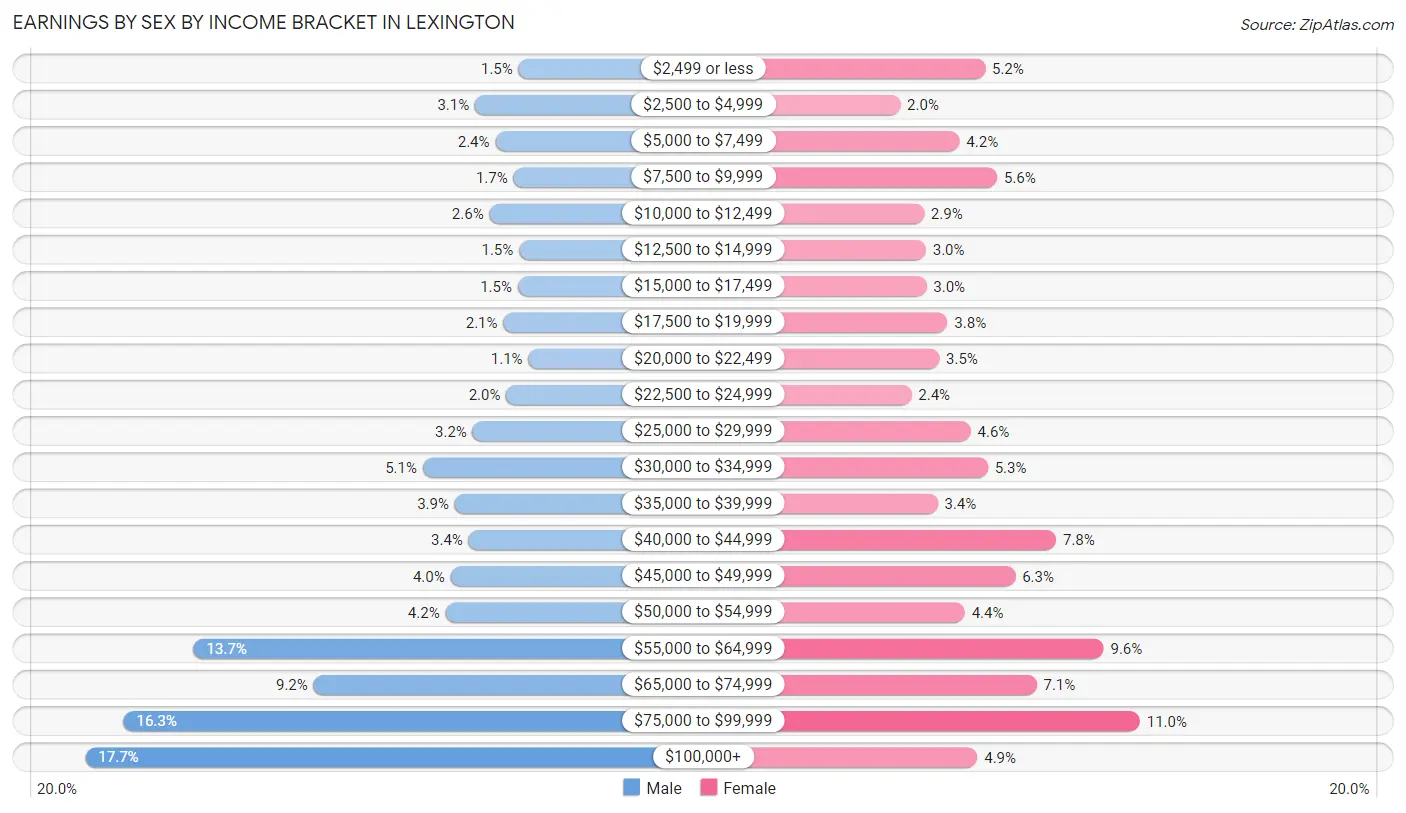
Earnings by Sex by Income Bracket in Lexington
The most common earnings brackets in Lexington are $100,000+ for men (1,119 | 17.7%) and $75,000 to $99,999 for women (653 | 11.0%).
| Income | Male | Female |
| $2,499 or less | 94 (1.5%) | 308 (5.2%) |
| $2,500 to $4,999 | 197 (3.1%) | 119 (2.0%) |
| $5,000 to $7,499 | 149 (2.4%) | 251 (4.2%) |
| $7,500 to $9,999 | 106 (1.7%) | 335 (5.6%) |
| $10,000 to $12,499 | 163 (2.6%) | 172 (2.9%) |
| $12,500 to $14,999 | 93 (1.5%) | 176 (3.0%) |
| $15,000 to $17,499 | 96 (1.5%) | 177 (3.0%) |
| $17,500 to $19,999 | 130 (2.1%) | 224 (3.8%) |
| $20,000 to $22,499 | 71 (1.1%) | 206 (3.5%) |
| $22,500 to $24,999 | 123 (1.9%) | 144 (2.4%) |
| $25,000 to $29,999 | 203 (3.2%) | 276 (4.6%) |
| $30,000 to $34,999 | 321 (5.1%) | 314 (5.3%) |
| $35,000 to $39,999 | 245 (3.9%) | 202 (3.4%) |
| $40,000 to $44,999 | 212 (3.4%) | 466 (7.8%) |
| $45,000 to $49,999 | 255 (4.0%) | 375 (6.3%) |
| $50,000 to $54,999 | 267 (4.2%) | 263 (4.4%) |
| $55,000 to $64,999 | 863 (13.7%) | 572 (9.6%) |
| $65,000 to $74,999 | 579 (9.2%) | 423 (7.1%) |
| $75,000 to $99,999 | 1,029 (16.3%) | 653 (11.0%) |
| $100,000+ | 1,119 (17.7%) | 291 (4.9%) |
| Total | 6,315 (100.0%) | 5,947 (100.0%) |
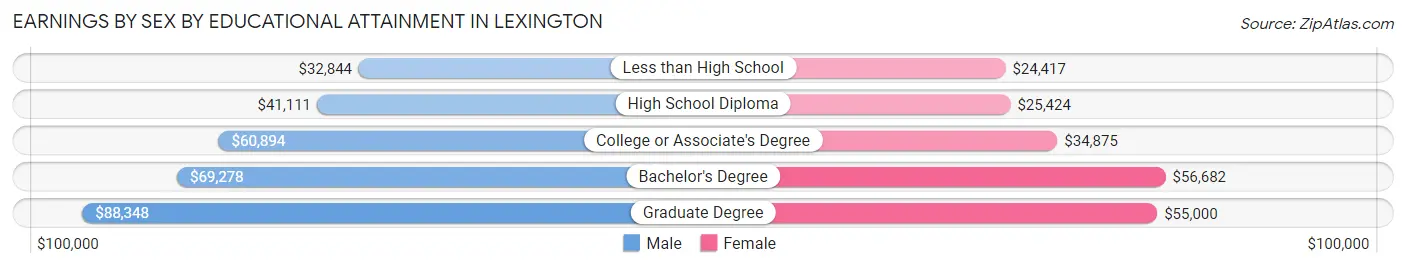
Earnings by Sex by Educational Attainment in Lexington
Average earnings in Lexington are $63,389 for men and $44,648 for women, a difference of 29.6%. Men with an educational attainment of graduate degree enjoy the highest average annual earnings of $88,348, while those with less than high school education earn the least with $32,844. Women with an educational attainment of bachelor's degree earn the most with the average annual earnings of $56,682, while those with less than high school education have the smallest earnings of $24,417.
| Educational Attainment | Male Income | Female Income |
| Less than High School | $32,844 | $24,417 |
| High School Diploma | $41,111 | $25,424 |
| College or Associate's Degree | $60,894 | $34,875 |
| Bachelor's Degree | $69,278 | $56,682 |
| Graduate Degree | $88,348 | $55,000 |
| Total | $63,389 | $44,648 |
Family Income in Lexington
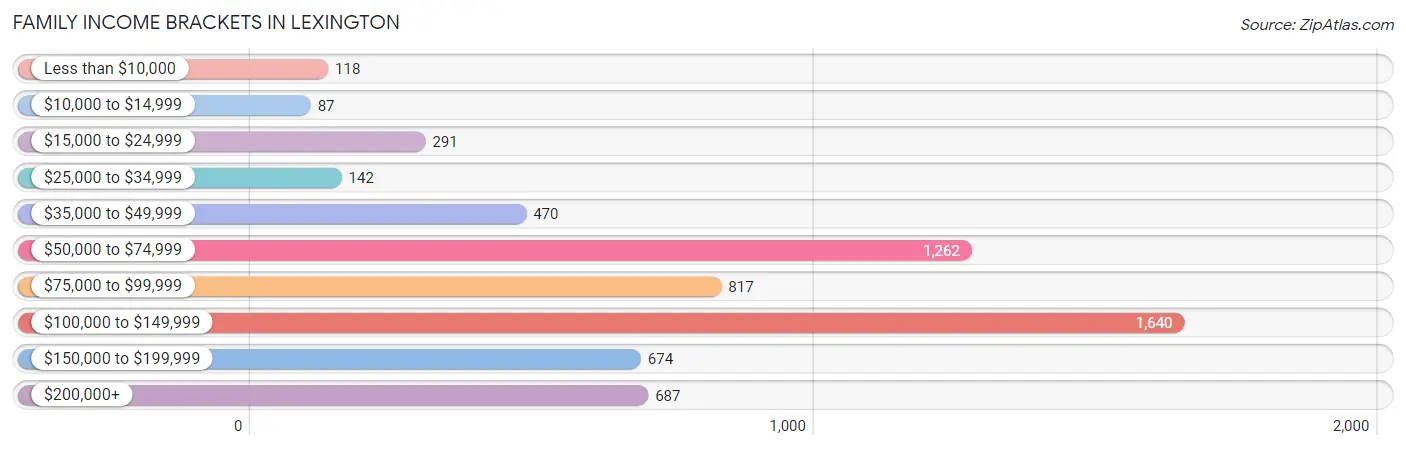
Family Income Brackets in Lexington
According to the Lexington family income data, there are 1,640 families falling into the $100,000 to $149,999 income range, which is the most common income bracket and makes up 26.5% of all families. Conversely, the $10,000 to $14,999 income bracket is the least frequent group with only 87 families (1.4%) belonging to this category.
| Income Bracket | # Families | % Families |
| Less than $10,000 | 118 | 1.9% |
| $10,000 to $14,999 | 87 | 1.4% |
| $15,000 to $24,999 | 291 | 4.7% |
| $25,000 to $34,999 | 142 | 2.3% |
| $35,000 to $49,999 | 470 | 7.6% |
| $50,000 to $74,999 | 1,262 | 20.4% |
| $75,000 to $99,999 | 817 | 13.2% |
| $100,000 to $149,999 | 1,640 | 26.5% |
| $150,000 to $199,999 | 674 | 10.9% |
| $200,000+ | 687 | 11.1% |
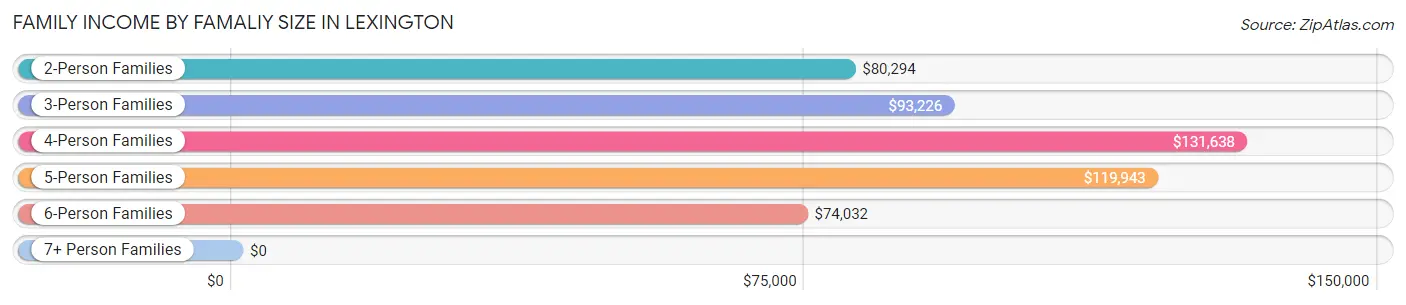
Family Income by Famaliy Size in Lexington
4-person families (1,110 | 17.9%) account for the highest median family income in Lexington with $131,638 per family, while 2-person families (2,908 | 47.0%) have the highest median income of $40,147 per family member.
| Income Bracket | # Families | Median Income |
| 2-Person Families | 2,908 (47.0%) | $80,294 |
| 3-Person Families | 1,390 (22.5%) | $93,226 |
| 4-Person Families | 1,110 (17.9%) | $131,638 |
| 5-Person Families | 460 (7.4%) | $119,943 |
| 6-Person Families | 304 (4.9%) | $74,032 |
| 7+ Person Families | 16 (0.3%) | $0 |
| Total | 6,188 (100.0%) | $94,306 |
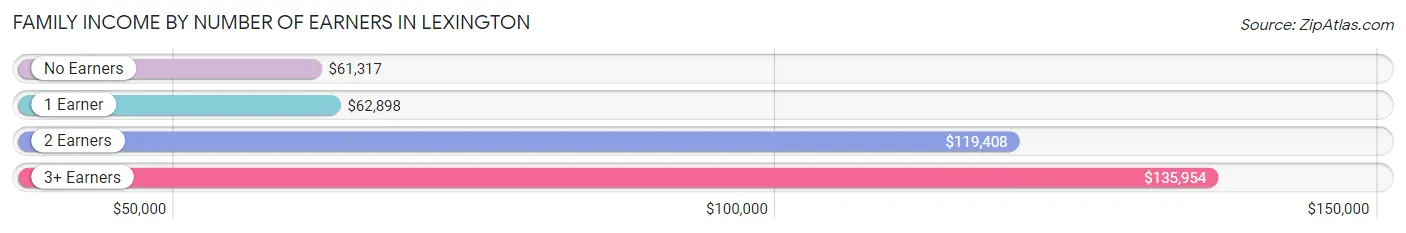
Family Income by Number of Earners in Lexington
The median family income in Lexington is $94,306, with families comprising 3+ earners (484) having the highest median family income of $135,954, while families with no earners (851) have the lowest median family income of $61,317, accounting for 7.8% and 13.8% of families, respectively.
| Number of Earners | # Families | Median Income |
| No Earners | 851 (13.8%) | $61,317 |
| 1 Earner | 1,858 (30.0%) | $62,898 |
| 2 Earners | 2,995 (48.4%) | $119,408 |
| 3+ Earners | 484 (7.8%) | $135,954 |
| Total | 6,188 (100.0%) | $94,306 |
Household Income in Lexington
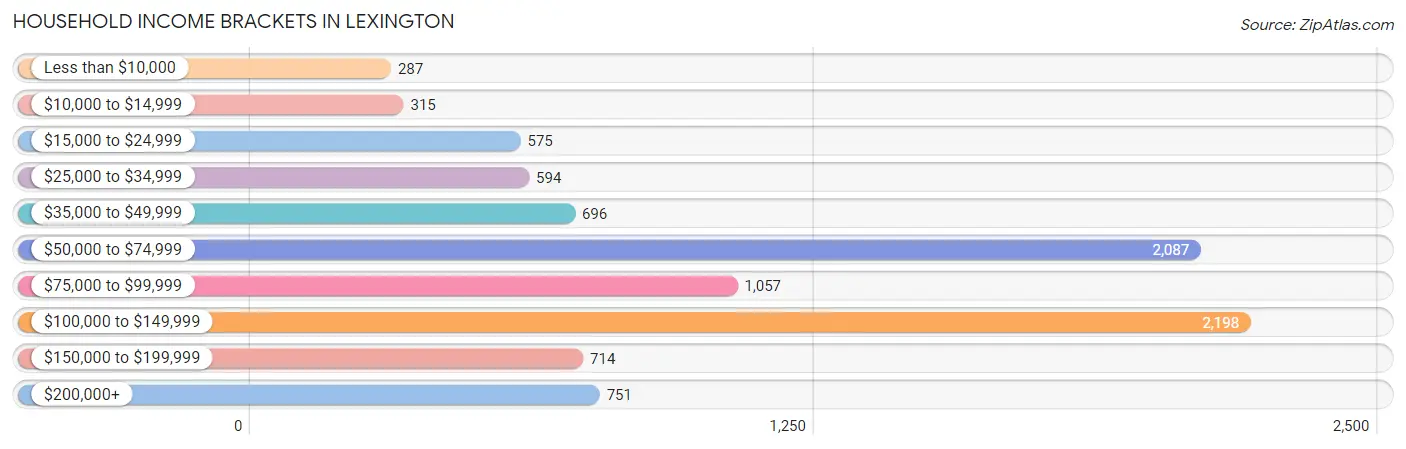
Household Income Brackets in Lexington
With 2,198 households falling in the category, the $100,000 to $149,999 income range is the most frequent in Lexington, accounting for 23.7% of all households. In contrast, only 287 households (3.1%) fall into the less than $10,000 income bracket, making it the least populous group.
| Income Bracket | # Households | % Households |
| Less than $10,000 | 287 | 3.1% |
| $10,000 to $14,999 | 315 | 3.4% |
| $15,000 to $24,999 | 575 | 6.2% |
| $25,000 to $34,999 | 594 | 6.4% |
| $35,000 to $49,999 | 696 | 7.5% |
| $50,000 to $74,999 | 2,087 | 22.5% |
| $75,000 to $99,999 | 1,057 | 11.4% |
| $100,000 to $149,999 | 2,198 | 23.7% |
| $150,000 to $199,999 | 714 | 7.7% |
| $200,000+ | 751 | 8.1% |
Household Income by Householder Age in Lexington
The median household income in Lexington is $78,164, with the highest median household income of $92,808 found in the 45 to 64 years age bracket for the primary householder. A total of 3,456 households (37.3%) fall into this category. Meanwhile, the 15 to 24 years age bracket for the primary householder has the lowest median household income of $46,786, with 226 households (2.4%) in this group.
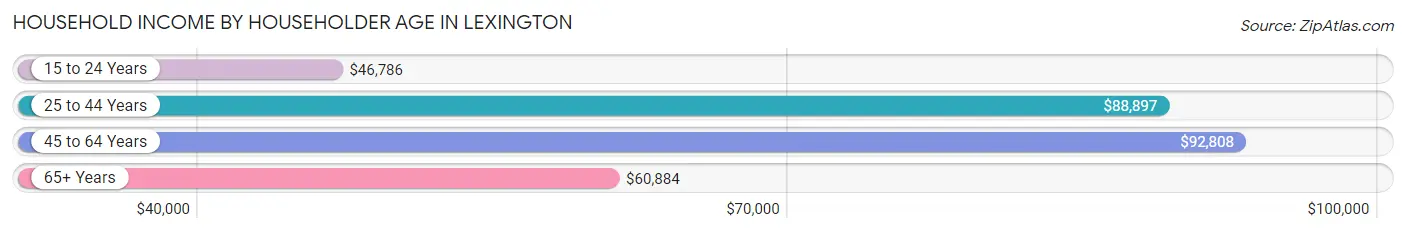
| Income Bracket | # Households | Median Income |
| 15 to 24 Years | 226 (2.4%) | $46,786 |
| 25 to 44 Years | 3,324 (35.8%) | $88,897 |
| 45 to 64 Years | 3,456 (37.3%) | $92,808 |
| 65+ Years | 2,268 (24.5%) | $60,884 |
| Total | 9,274 (100.0%) | $78,164 |
Poverty in Lexington
Income Below Poverty by Sex and Age in Lexington
With 6.4% poverty level for males and 9.9% for females among the residents of Lexington, under 5 year old males and 18 to 24 year old females are the most vulnerable to poverty, with 111 males (11.2%) and 217 females (22.4%) in their respective age groups living below the poverty level.
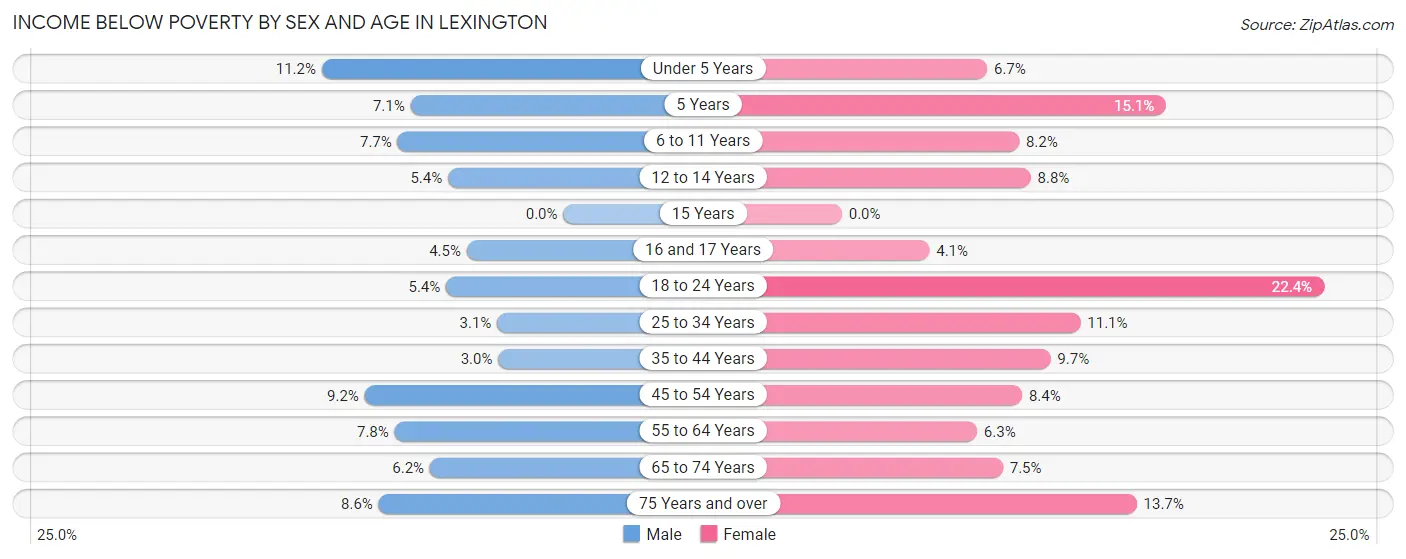
| Age Bracket | Male | Female |
| Under 5 Years | 111 (11.2%) | 41 (6.7%) |
| 5 Years | 10 (7.1%) | 14 (15.0%) |
| 6 to 11 Years | 58 (7.7%) | 87 (8.2%) |
| 12 to 14 Years | 35 (5.3%) | 39 (8.8%) |
| 15 Years | 0 (0.0%) | 0 (0.0%) |
| 16 and 17 Years | 10 (4.5%) | 14 (4.1%) |
| 18 to 24 Years | 31 (5.4%) | 217 (22.4%) |
| 25 to 34 Years | 41 (3.1%) | 163 (11.1%) |
| 35 to 44 Years | 52 (3.0%) | 179 (9.7%) |
| 45 to 54 Years | 116 (9.2%) | 126 (8.4%) |
| 55 to 64 Years | 103 (7.8%) | 100 (6.3%) |
| 65 to 74 Years | 42 (6.2%) | 68 (7.5%) |
| 75 Years and over | 66 (8.6%) | 149 (13.7%) |
| Total | 675 (6.4%) | 1,197 (9.9%) |
Income Above Poverty by Sex and Age in Lexington
According to the poverty statistics in Lexington, males aged 15 years and females aged 15 years are the age groups that are most secure financially, with 100.0% of males and 100.0% of females in these age groups living above the poverty line.
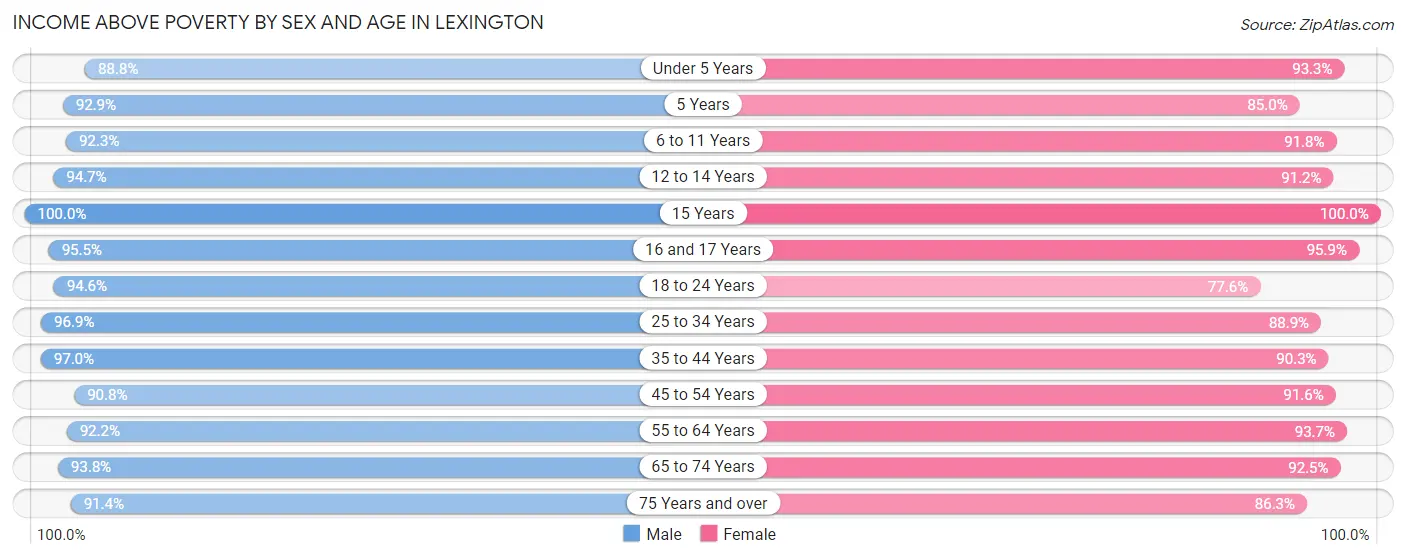
| Age Bracket | Male | Female |
| Under 5 Years | 879 (88.8%) | 567 (93.3%) |
| 5 Years | 131 (92.9%) | 79 (85.0%) |
| 6 to 11 Years | 696 (92.3%) | 972 (91.8%) |
| 12 to 14 Years | 619 (94.7%) | 406 (91.2%) |
| 15 Years | 167 (100.0%) | 112 (100.0%) |
| 16 and 17 Years | 213 (95.5%) | 331 (95.9%) |
| 18 to 24 Years | 539 (94.6%) | 753 (77.6%) |
| 25 to 34 Years | 1,296 (96.9%) | 1,309 (88.9%) |
| 35 to 44 Years | 1,669 (97.0%) | 1,671 (90.3%) |
| 45 to 54 Years | 1,142 (90.8%) | 1,382 (91.6%) |
| 55 to 64 Years | 1,212 (92.2%) | 1,496 (93.7%) |
| 65 to 74 Years | 636 (93.8%) | 842 (92.5%) |
| 75 Years and over | 704 (91.4%) | 940 (86.3%) |
| Total | 9,903 (93.6%) | 10,860 (90.1%) |
Income Below Poverty Among Married-Couple Families in Lexington
The poverty statistics for married-couple families in Lexington show that 2.5% or 125 of the total 4,967 families live below the poverty line. Families with 3 or 4 children have the highest poverty rate of 5.7%, comprising of 34 families. On the other hand, families with 5 or more children have the lowest poverty rate of 0.0%, which includes 0 families.
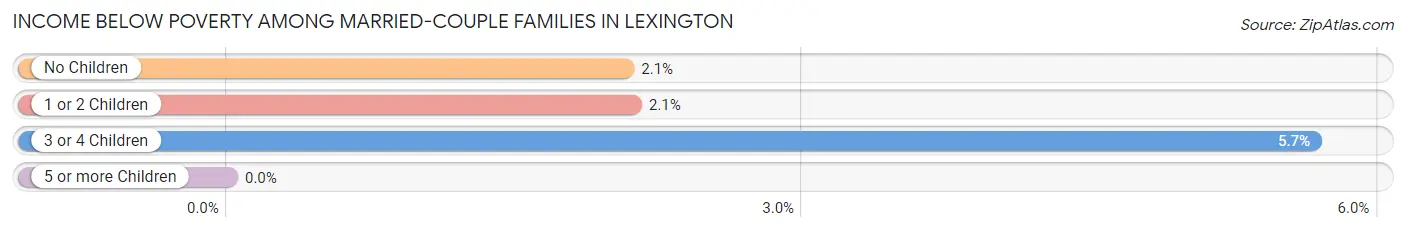
| Children | Above Poverty | Below Poverty |
| No Children | 2,370 (97.9%) | 50 (2.1%) |
| 1 or 2 Children | 1,898 (97.9%) | 41 (2.1%) |
| 3 or 4 Children | 567 (94.3%) | 34 (5.7%) |
| 5 or more Children | 7 (100.0%) | 0 (0.0%) |
| Total | 4,842 (97.5%) | 125 (2.5%) |
Income Below Poverty Among Single-Parent Households in Lexington
According to the poverty data in Lexington, 15.8% or 61 single-father households and 21.4% or 179 single-mother households are living below the poverty line. Among single-father households, those with no children have the highest poverty rate, with 27 households (23.1%) experiencing poverty. Likewise, among single-mother households, those with 1 or 2 children have the highest poverty rate, with 173 households (28.9%) falling below the poverty line.
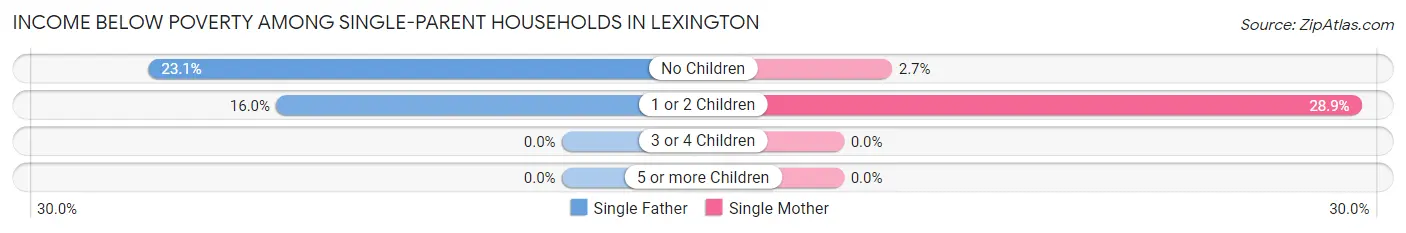
| Children | Single Father | Single Mother |
| No Children | 27 (23.1%) | 6 (2.7%) |
| 1 or 2 Children | 34 (16.0%) | 173 (28.9%) |
| 3 or 4 Children | 0 (0.0%) | 0 (0.0%) |
| 5 or more Children | 0 (0.0%) | 0 (0.0%) |
| Total | 61 (15.8%) | 179 (21.4%) |
Income Below Poverty Among Married-Couple vs Single-Parent Households in Lexington
The poverty data for Lexington shows that 125 of the married-couple family households (2.5%) and 240 of the single-parent households (19.7%) are living below the poverty level. Within the married-couple family households, those with 3 or 4 children have the highest poverty rate, with 34 households (5.7%) falling below the poverty line. Among the single-parent households, those with 1 or 2 children have the highest poverty rate, with 207 household (25.5%) living below poverty.
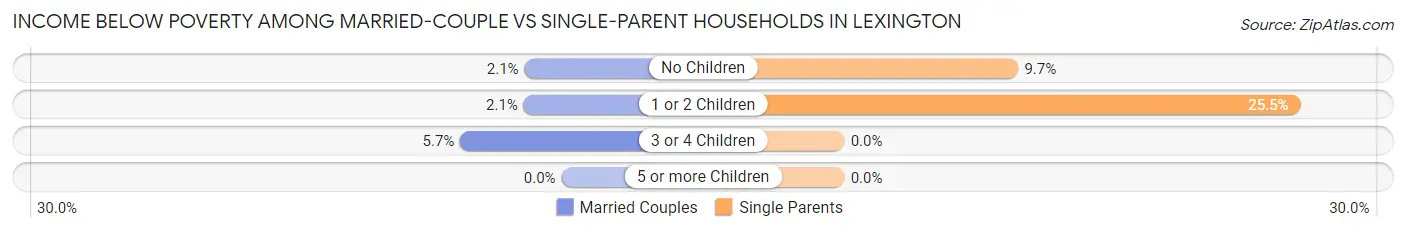
| Children | Married-Couple Families | Single-Parent Households |
| No Children | 50 (2.1%) | 33 (9.7%) |
| 1 or 2 Children | 41 (2.1%) | 207 (25.5%) |
| 3 or 4 Children | 34 (5.7%) | 0 (0.0%) |
| 5 or more Children | 0 (0.0%) | 0 (0.0%) |
| Total | 125 (2.5%) | 240 (19.7%) |
Race in Lexington
The most populous races in Lexington are White / Caucasian (18,338 | 77.5%), Black / African American (2,438 | 10.3%), and Asian (1,307 | 5.5%).
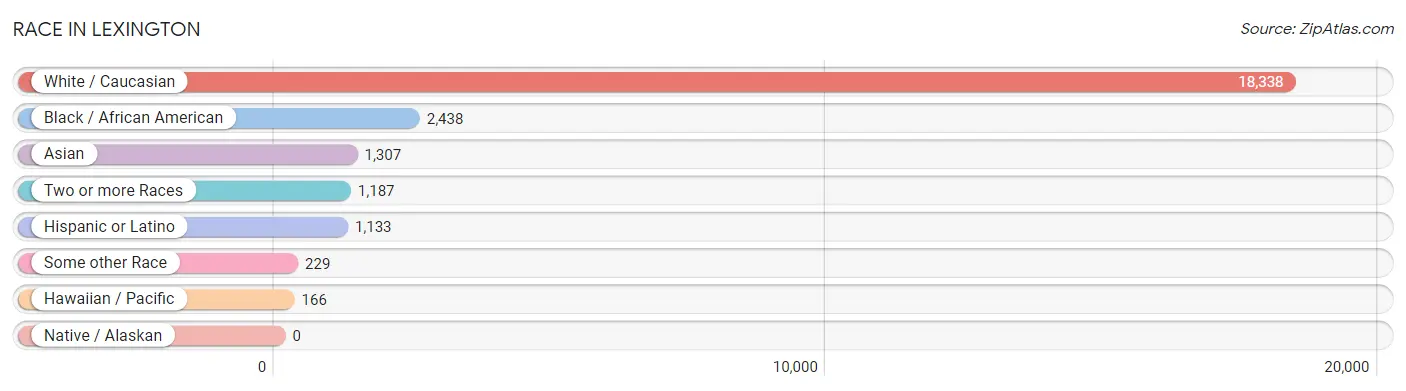
| Race | # Population | % Population |
| Asian | 1,307 | 5.5% |
| Black / African American | 2,438 | 10.3% |
| Hawaiian / Pacific | 166 | 0.7% |
| Hispanic or Latino | 1,133 | 4.8% |
| Native / Alaskan | 0 | 0.0% |
| White / Caucasian | 18,338 | 77.5% |
| Two or more Races | 1,187 | 5.0% |
| Some other Race | 229 | 1.0% |
| Total | 23,665 | 100.0% |
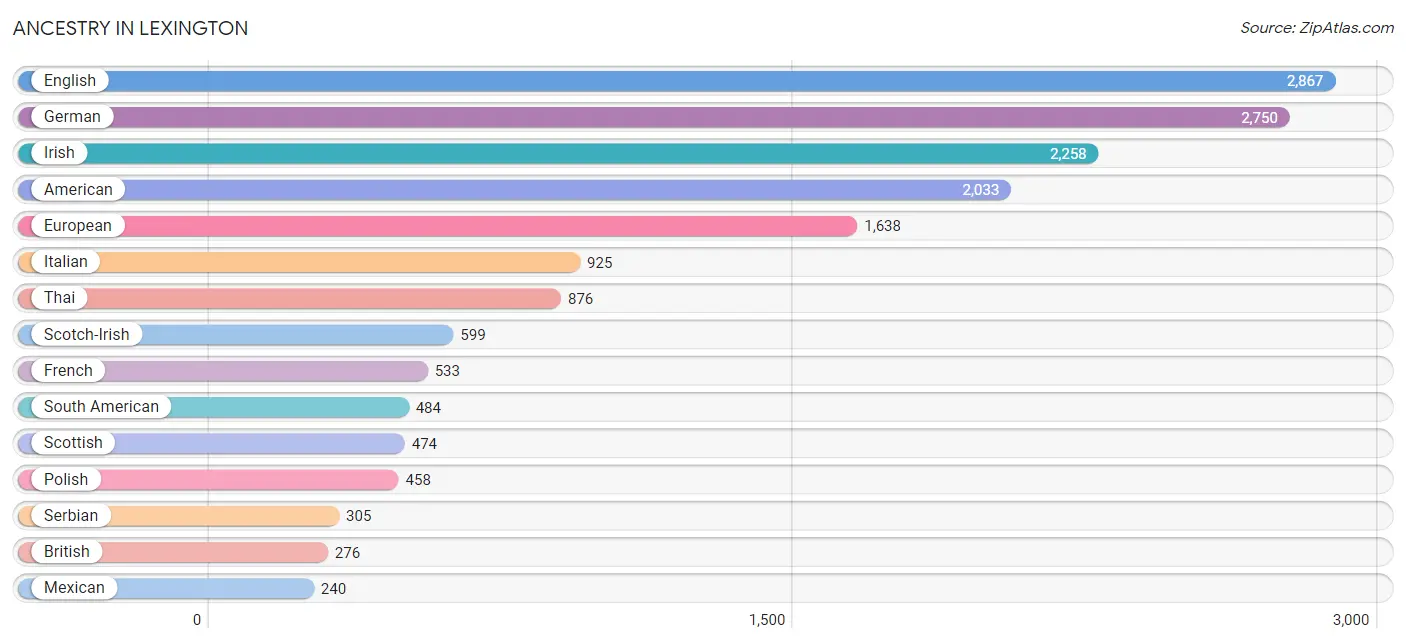
Ancestry in Lexington
The most populous ancestries reported in Lexington are English (2,867 | 12.1%), German (2,750 | 11.6%), Irish (2,258 | 9.5%), American (2,033 | 8.6%), and European (1,638 | 6.9%), together accounting for 48.8% of all Lexington residents.
| Ancestry | # Population | % Population |
| African | 149 | 0.6% |
| American | 2,033 | 8.6% |
| Arab | 155 | 0.6% |
| Austrian | 6 | 0.0% |
| Belgian | 48 | 0.2% |
| Bhutanese | 9 | 0.0% |
| Blackfeet | 7 | 0.0% |
| Brazilian | 29 | 0.1% |
| British | 276 | 1.2% |
| Burmese | 126 | 0.5% |
| Canadian | 27 | 0.1% |
| Central American | 47 | 0.2% |
| Central American Indian | 25 | 0.1% |
| Cherokee | 77 | 0.3% |
| Chippewa | 11 | 0.1% |
| Choctaw | 6 | 0.0% |
| Colombian | 178 | 0.7% |
| Cuban | 149 | 0.6% |
| Czech | 21 | 0.1% |
| Dominican | 21 | 0.1% |
| Dutch | 152 | 0.6% |
| Eastern European | 8 | 0.0% |
| English | 2,867 | 12.1% |
| European | 1,638 | 6.9% |
| Filipino | 19 | 0.1% |
| Finnish | 56 | 0.2% |
| French | 533 | 2.2% |
| French Canadian | 83 | 0.4% |
| German | 2,750 | 11.6% |
| Greek | 10 | 0.0% |
| Guatemalan | 8 | 0.0% |
| Honduran | 23 | 0.1% |
| Hungarian | 122 | 0.5% |
| Indian (Asian) | 153 | 0.6% |
| Irish | 2,258 | 9.5% |
| Italian | 925 | 3.9% |
| Jamaican | 10 | 0.0% |
| Korean | 117 | 0.5% |
| Latvian | 16 | 0.1% |
| Lebanese | 117 | 0.5% |
| Lithuanian | 22 | 0.1% |
| Lumbee | 48 | 0.2% |
| Luxembourger | 8 | 0.0% |
| Mexican | 240 | 1.0% |
| Native Hawaiian | 166 | 0.7% |
| Nicaraguan | 8 | 0.0% |
| Northern European | 14 | 0.1% |
| Norwegian | 142 | 0.6% |
| Pakistani | 123 | 0.5% |
| Peruvian | 124 | 0.5% |
| Polish | 458 | 1.9% |
| Portuguese | 37 | 0.2% |
| Puerto Rican | 127 | 0.5% |
| Romanian | 66 | 0.3% |
| Russian | 60 | 0.3% |
| Salvadoran | 8 | 0.0% |
| Scandinavian | 86 | 0.4% |
| Scotch-Irish | 599 | 2.5% |
| Scottish | 474 | 2.0% |
| Serbian | 305 | 1.3% |
| South American | 484 | 2.1% |
| Spanish | 46 | 0.2% |
| Sri Lankan | 44 | 0.2% |
| Subsaharan African | 149 | 0.6% |
| Swedish | 127 | 0.5% |
| Swiss | 80 | 0.3% |
| Syrian | 29 | 0.1% |
| Thai | 876 | 3.7% |
| Turkish | 54 | 0.2% |
| Ukrainian | 36 | 0.2% |
| Venezuelan | 182 | 0.8% |
| Welsh | 69 | 0.3% |
| Yugoslavian | 69 | 0.3% | View All 73 Rows |
Immigrants in Lexington
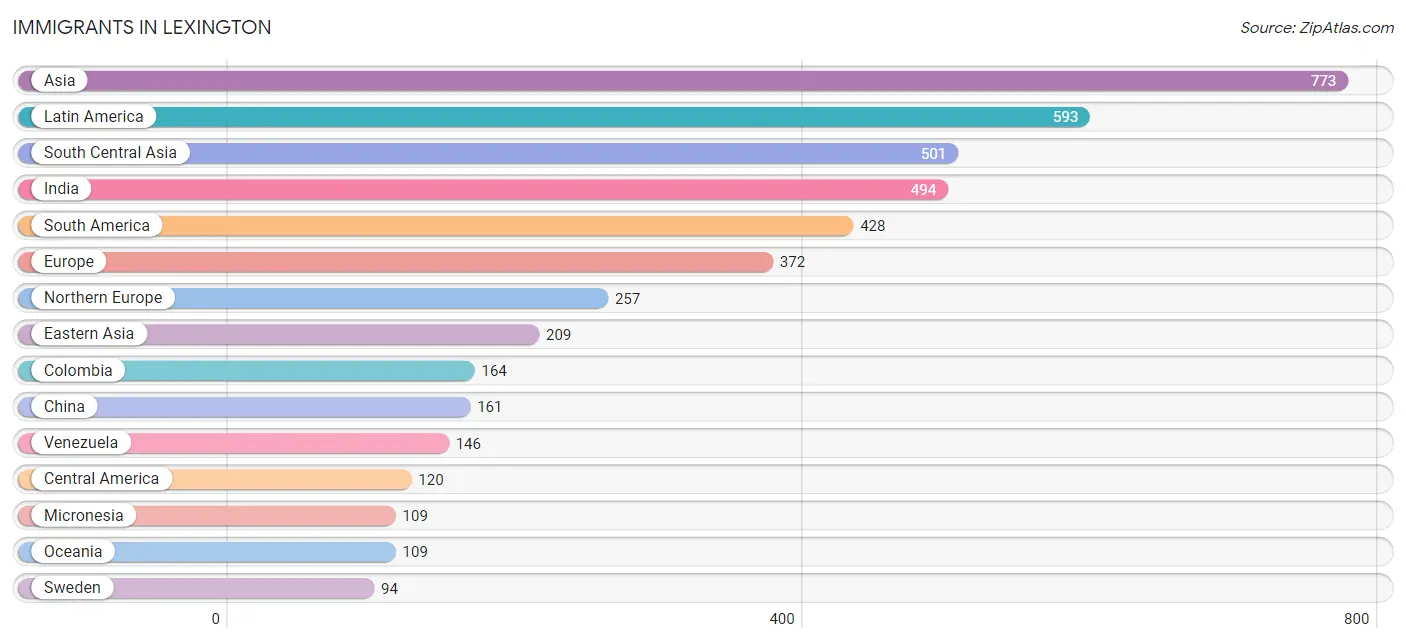
The most numerous immigrant groups reported in Lexington came from Asia (773 | 3.3%), Latin America (593 | 2.5%), South Central Asia (501 | 2.1%), India (494 | 2.1%), and South America (428 | 1.8%), together accounting for 11.8% of all Lexington residents.
| Immigration Origin | # Population | % Population |
| Asia | 773 | 3.3% |
| Brazil | 29 | 0.1% |
| Canada | 27 | 0.1% |
| Caribbean | 45 | 0.2% |
| Central America | 120 | 0.5% |
| China | 161 | 0.7% |
| Colombia | 164 | 0.7% |
| Cuba | 35 | 0.2% |
| Eastern Asia | 209 | 0.9% |
| Eastern Europe | 25 | 0.1% |
| England | 60 | 0.3% |
| Europe | 372 | 1.6% |
| France | 56 | 0.2% |
| Germany | 15 | 0.1% |
| Guatemala | 8 | 0.0% |
| Honduras | 23 | 0.1% |
| Hong Kong | 7 | 0.0% |
| India | 494 | 2.1% |
| Ireland | 36 | 0.2% |
| Italy | 10 | 0.0% |
| Jamaica | 10 | 0.0% |
| Japan | 9 | 0.0% |
| Korea | 39 | 0.2% |
| Latin America | 593 | 2.5% |
| Mexico | 81 | 0.3% |
| Micronesia | 109 | 0.5% |
| Nicaragua | 8 | 0.0% |
| Northern Europe | 257 | 1.1% |
| Oceania | 109 | 0.5% |
| Peru | 89 | 0.4% |
| Philippines | 6 | 0.0% |
| Romania | 25 | 0.1% |
| Scotland | 33 | 0.1% |
| South America | 428 | 1.8% |
| South Central Asia | 501 | 2.1% |
| South Eastern Asia | 44 | 0.2% |
| Southern Europe | 19 | 0.1% |
| Spain | 9 | 0.0% |
| Sri Lanka | 7 | 0.0% |
| Sweden | 94 | 0.4% |
| Taiwan | 19 | 0.1% |
| Thailand | 14 | 0.1% |
| Turkey | 12 | 0.1% |
| Venezuela | 146 | 0.6% |
| Vietnam | 24 | 0.1% |
| Western Asia | 19 | 0.1% |
| Western Europe | 71 | 0.3% | View All 47 Rows |
Sex and Age in Lexington
Sex and Age in Lexington
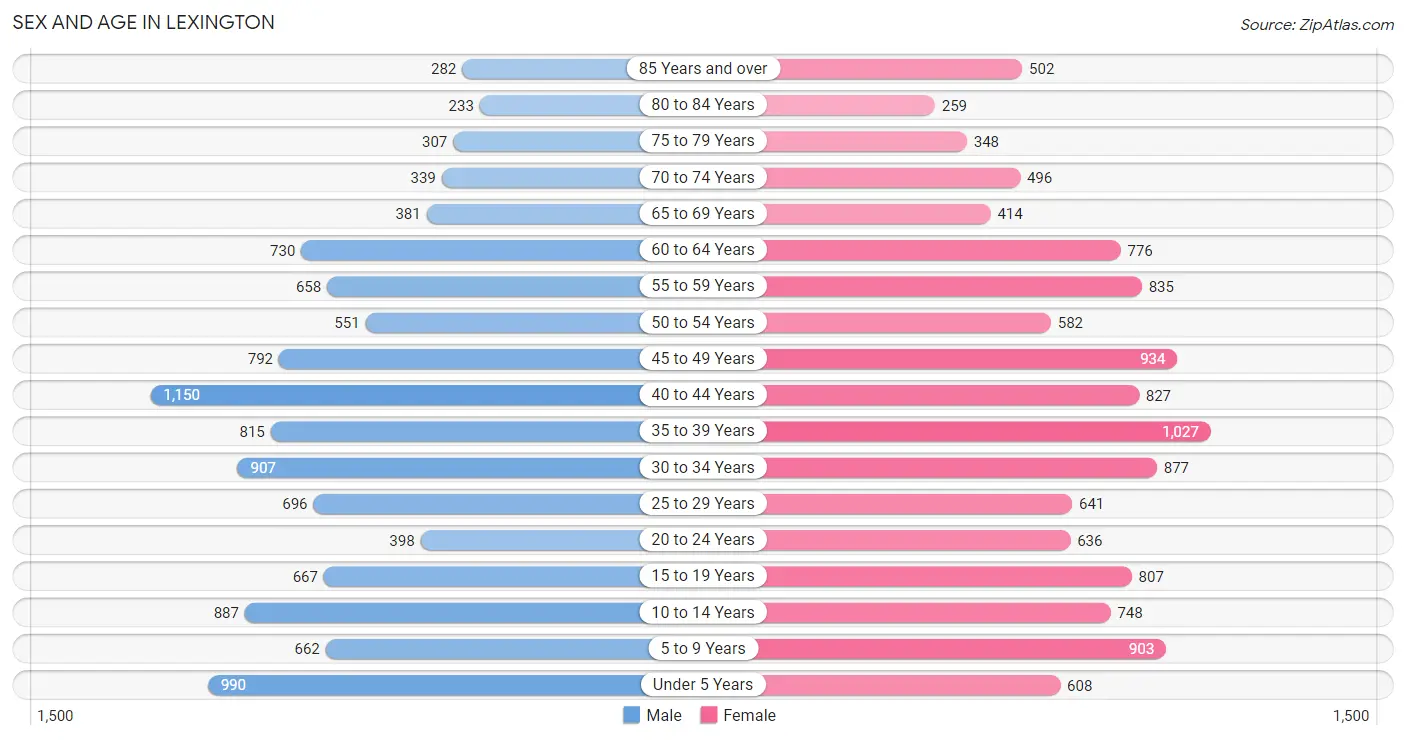
The most populous age groups in Lexington are 40 to 44 Years (1,150 | 10.1%) for men and 35 to 39 Years (1,027 | 8.4%) for women.
| Age Bracket | Male | Female |
| Under 5 Years | 990 (8.6%) | 608 (5.0%) |
| 5 to 9 Years | 662 (5.8%) | 903 (7.4%) |
| 10 to 14 Years | 887 (7.7%) | 748 (6.1%) |
| 15 to 19 Years | 667 (5.8%) | 807 (6.6%) |
| 20 to 24 Years | 398 (3.5%) | 636 (5.2%) |
| 25 to 29 Years | 696 (6.1%) | 641 (5.2%) |
| 30 to 34 Years | 907 (7.9%) | 877 (7.2%) |
| 35 to 39 Years | 815 (7.1%) | 1,027 (8.4%) |
| 40 to 44 Years | 1,150 (10.1%) | 827 (6.8%) |
| 45 to 49 Years | 792 (6.9%) | 934 (7.6%) |
| 50 to 54 Years | 551 (4.8%) | 582 (4.8%) |
| 55 to 59 Years | 658 (5.8%) | 835 (6.8%) |
| 60 to 64 Years | 730 (6.4%) | 776 (6.4%) |
| 65 to 69 Years | 381 (3.3%) | 414 (3.4%) |
| 70 to 74 Years | 339 (3.0%) | 496 (4.1%) |
| 75 to 79 Years | 307 (2.7%) | 348 (2.9%) |
| 80 to 84 Years | 233 (2.0%) | 259 (2.1%) |
| 85 Years and over | 282 (2.5%) | 502 (4.1%) |
| Total | 11,445 (100.0%) | 12,220 (100.0%) |
Families and Households in Lexington
Median Family Size in Lexington
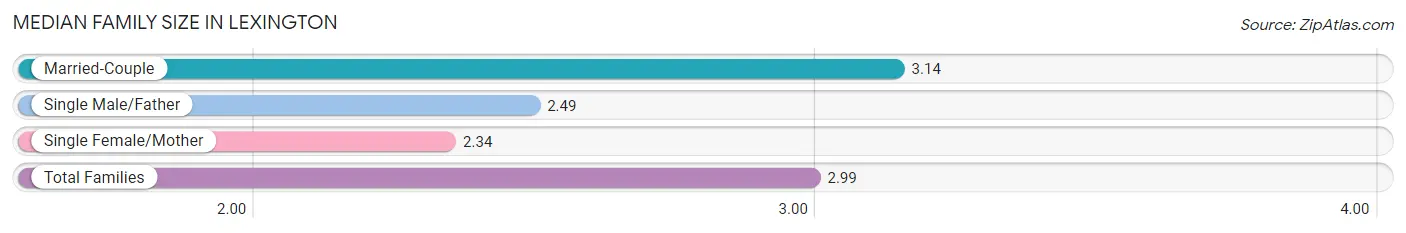
The median family size in Lexington is 2.99 persons per family, with married-couple families (4,967 | 80.3%) accounting for the largest median family size of 3.14 persons per family. On the other hand, single female/mother families (836 | 13.5%) represent the smallest median family size with 2.34 persons per family.
| Family Type | # Families | Family Size |
| Married-Couple | 4,967 (80.3%) | 3.14 |
| Single Male/Father | 385 (6.2%) | 2.49 |
| Single Female/Mother | 836 (13.5%) | 2.34 |
| Total Families | 6,188 (100.0%) | 2.99 |
Median Household Size in Lexington
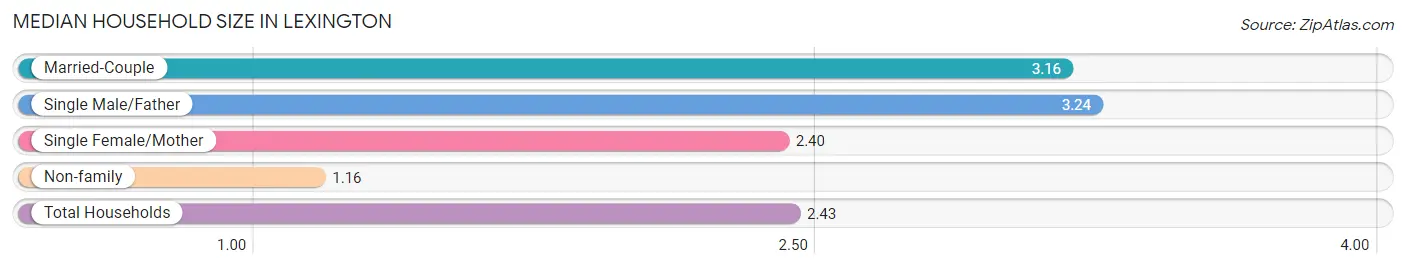
The median household size in Lexington is 2.43 persons per household, with single male/father households (385 | 4.2%) accounting for the largest median household size of 3.24 persons per household. non-family households (3,086 | 33.3%) represent the smallest median household size with 1.16 persons per household.
| Household Type | # Households | Household Size |
| Married-Couple | 4,967 (53.6%) | 3.16 |
| Single Male/Father | 385 (4.2%) | 3.24 |
| Single Female/Mother | 836 (9.0%) | 2.40 |
| Non-family | 3,086 (33.3%) | 1.16 |
| Total Households | 9,274 (100.0%) | 2.43 |
Household Size by Marriage Status in Lexington
Out of a total of 9,274 households in Lexington, 6,188 (66.7%) are family households, while 3,086 (33.3%) are nonfamily households. The most numerous type of family households are 2-person households, comprising 2,724, and the most common type of nonfamily households are 1-person households, comprising 2,633.
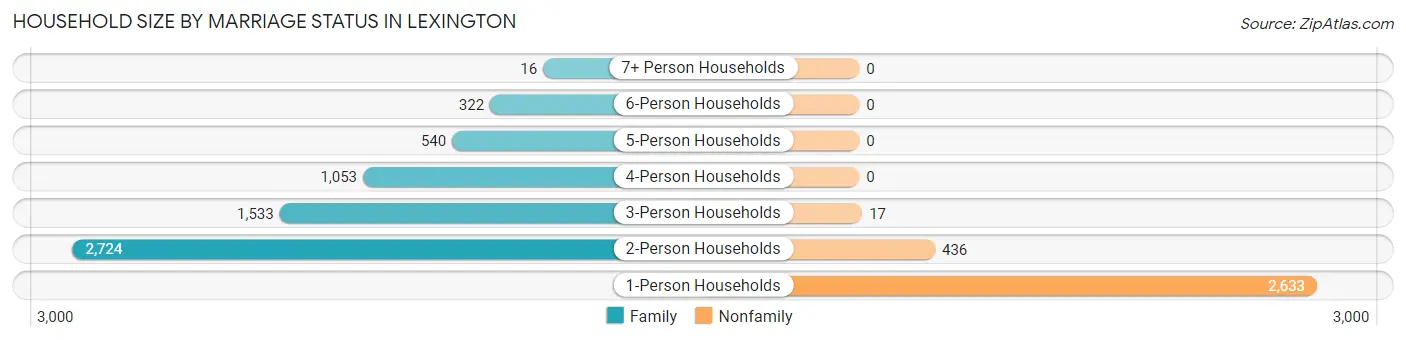
| Household Size | Family Households | Nonfamily Households |
| 1-Person Households | - | 2,633 (28.4%) |
| 2-Person Households | 2,724 (29.4%) | 436 (4.7%) |
| 3-Person Households | 1,533 (16.5%) | 17 (0.2%) |
| 4-Person Households | 1,053 (11.4%) | 0 (0.0%) |
| 5-Person Households | 540 (5.8%) | 0 (0.0%) |
| 6-Person Households | 322 (3.5%) | 0 (0.0%) |
| 7+ Person Households | 16 (0.2%) | 0 (0.0%) |
| Total | 6,188 (66.7%) | 3,086 (33.3%) |
Female Fertility in Lexington
Fertility by Age in Lexington
Average fertility rate in Lexington is 51.0 births per 1,000 women. Women in the age bracket of 20 to 34 years have the highest fertility rate with 105.0 births per 1,000 women. Women in the age bracket of 20 to 34 years acount for 76.1% of all women with births.
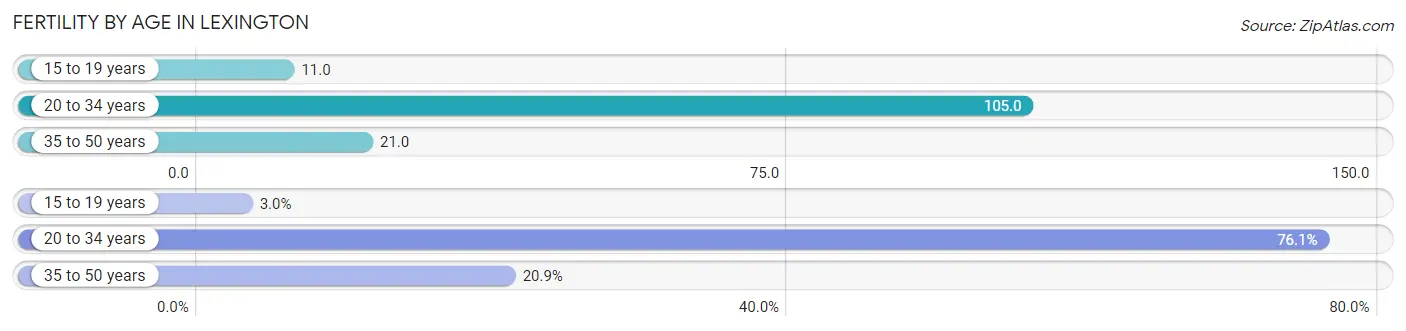
| Age Bracket | Women with Births | Births / 1,000 Women |
| 15 to 19 years | 9 (3.0%) | 11.0 |
| 20 to 34 years | 226 (76.1%) | 105.0 |
| 35 to 50 years | 62 (20.9%) | 21.0 |
| Total | 297 (100.0%) | 51.0 |
Fertility by Age by Marriage Status in Lexington
65.0% of women with births (297) in Lexington are married. The highest percentage of unmarried women with births falls into 15 to 19 years age bracket with 100.0% of them unmarried at the time of birth, while the lowest percentage of unmarried women with births belong to 35 to 50 years age bracket with 25.8% of them unmarried.
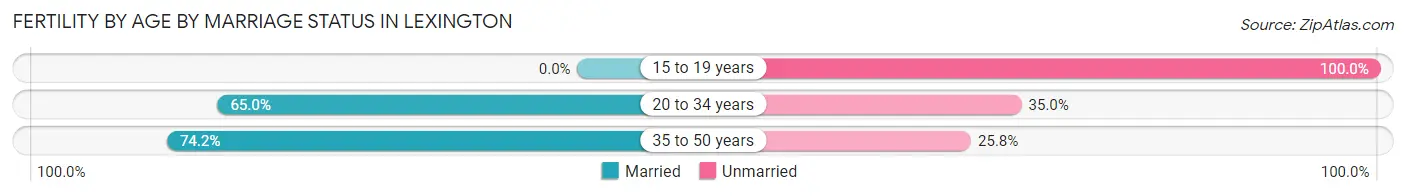
| Age Bracket | Married | Unmarried |
| 15 to 19 years | 0 (0.0%) | 9 (100.0%) |
| 20 to 34 years | 147 (65.0%) | 79 (35.0%) |
| 35 to 50 years | 46 (74.2%) | 16 (25.8%) |
| Total | 193 (65.0%) | 104 (35.0%) |
Fertility by Education in Lexington
Average fertility rate in Lexington is 51.0 births per 1,000 women. Women with the education attainment of graduate degree have the highest fertility rate of 76.0 births per 1,000 women, while women with the education attainment of less than high school have the lowest fertility at 12.0 births per 1,000 women. Women with the education attainment of college or associate's degree represent 32.0% of all women with births.
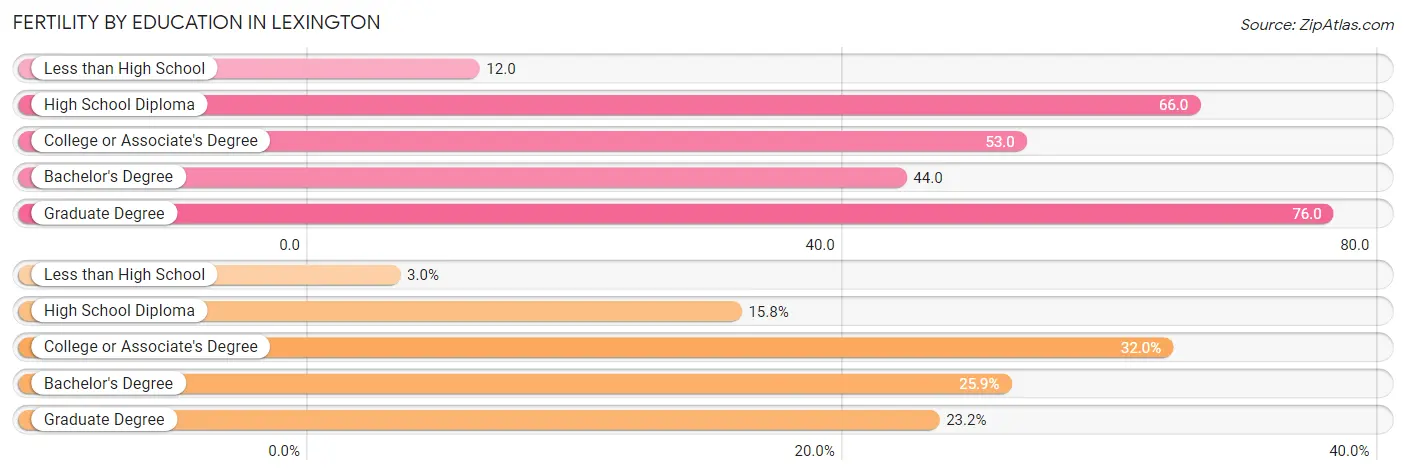
| Educational Attainment | Women with Births | Births / 1,000 Women |
| Less than High School | 9 (3.0%) | 12.0 |
| High School Diploma | 47 (15.8%) | 66.0 |
| College or Associate's Degree | 95 (32.0%) | 53.0 |
| Bachelor's Degree | 77 (25.9%) | 44.0 |
| Graduate Degree | 69 (23.2%) | 76.0 |
| Total | 297 (100.0%) | 51.0 |
Fertility by Education by Marriage Status in Lexington
35.0% of women with births in Lexington are unmarried. Women with the educational attainment of bachelor's degree are most likely to be married with 100.0% of them married at childbirth, while women with the educational attainment of less than high school are least likely to be married with 100.0% of them unmarried at childbirth.
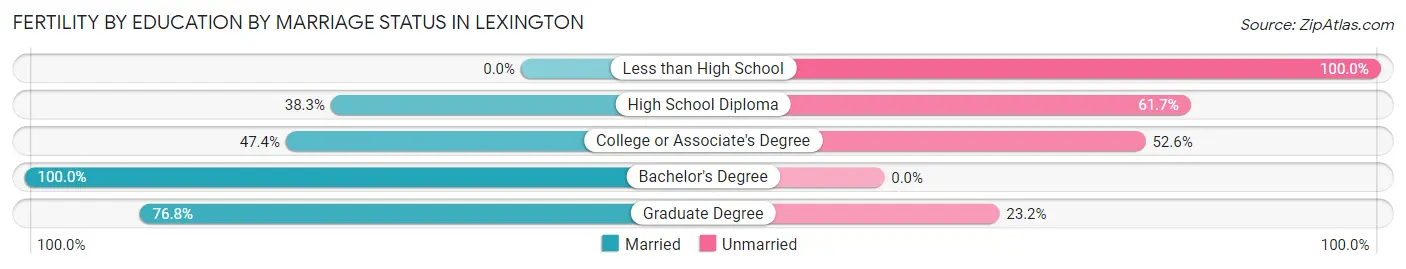
| Educational Attainment | Married | Unmarried |
| Less than High School | 0 (0.0%) | 9 (100.0%) |
| High School Diploma | 18 (38.3%) | 29 (61.7%) |
| College or Associate's Degree | 45 (47.4%) | 50 (52.6%) |
| Bachelor's Degree | 77 (100.0%) | 0 (0.0%) |
| Graduate Degree | 53 (76.8%) | 16 (23.2%) |
| Total | 193 (65.0%) | 104 (35.0%) |
Employment Characteristics in Lexington
Employment by Class of Employer in Lexington
Among the 11,053 employed individuals in Lexington, private company employees (7,166 | 64.8%), not-for-profit organizations (1,040 | 9.4%), and state government employees (813 | 7.4%) make up the most common classes of employment.
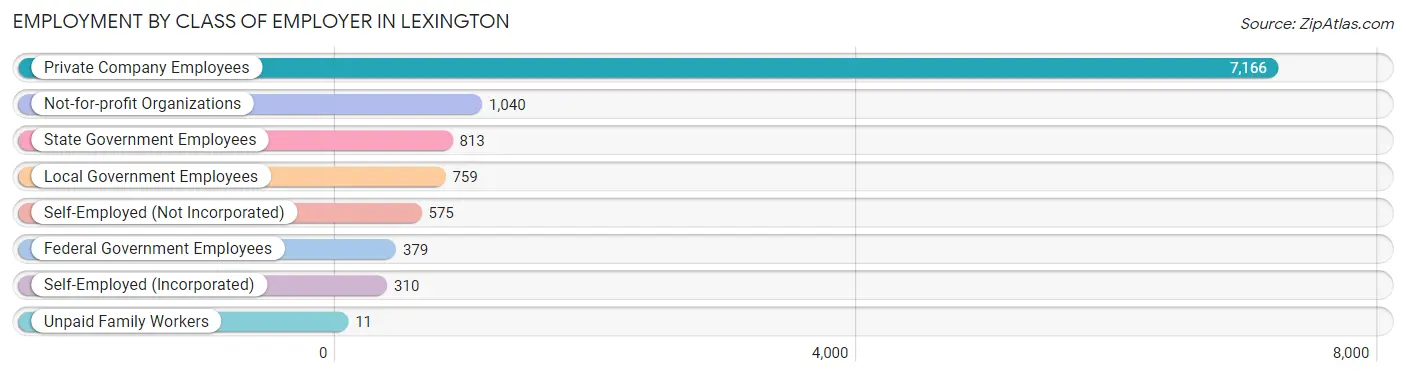
| Employer Class | # Employees | % Employees |
| Private Company Employees | 7,166 | 64.8% |
| Self-Employed (Incorporated) | 310 | 2.8% |
| Self-Employed (Not Incorporated) | 575 | 5.2% |
| Not-for-profit Organizations | 1,040 | 9.4% |
| Local Government Employees | 759 | 6.9% |
| State Government Employees | 813 | 7.4% |
| Federal Government Employees | 379 | 3.4% |
| Unpaid Family Workers | 11 | 0.1% |
| Total | 11,053 | 100.0% |
Employment Status by Age in Lexington
According to the labor force statistics for Lexington, out of the total population over 16 years of age (18,588), 62.4% or 11,599 individuals are in the labor force, with 3.6% or 418 of them unemployed. The age group with the highest labor force participation rate is 30 to 34 years, with 80.8% or 1,441 individuals in the labor force. Within the labor force, the 75 years and over age range has the highest percentage of unemployed individuals, with 12.2% or 17 of them being unemployed.
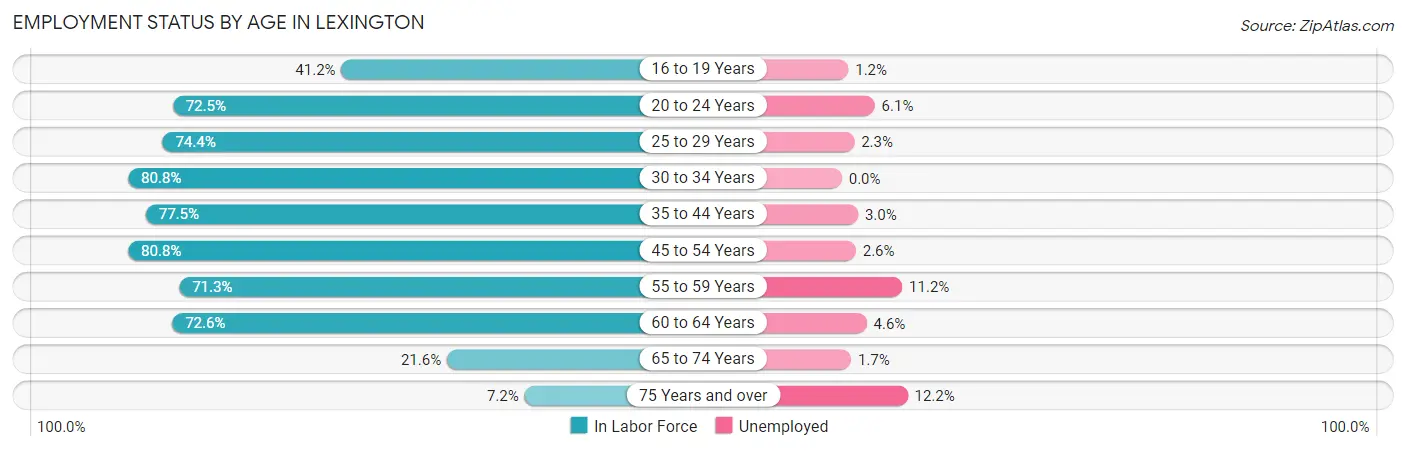
| Age Bracket | In Labor Force | Unemployed |
| 16 to 19 Years | 492 (41.2%) | 6 (1.2%) |
| 20 to 24 Years | 750 (72.5%) | 46 (6.1%) |
| 25 to 29 Years | 995 (74.4%) | 23 (2.3%) |
| 30 to 34 Years | 1,441 (80.8%) | 0 (0.0%) |
| 35 to 44 Years | 2,960 (77.5%) | 89 (3.0%) |
| 45 to 54 Years | 2,310 (80.8%) | 60 (2.6%) |
| 55 to 59 Years | 1,065 (71.3%) | 119 (11.2%) |
| 60 to 64 Years | 1,093 (72.6%) | 50 (4.6%) |
| 65 to 74 Years | 352 (21.6%) | 6 (1.7%) |
| 75 Years and over | 139 (7.2%) | 17 (12.2%) |
| Total | 11,599 (62.4%) | 418 (3.6%) |
Employment Status by Educational Attainment in Lexington
According to labor force statistics for Lexington, 77.1% of individuals (9,867) out of the total population between 25 and 64 years of age (12,798) are in the labor force, with 3.5% or 345 of them being unemployed. The group with the highest labor force participation rate are those with the educational attainment of bachelor's degree or higher, with 87.1% or 5,477 individuals in the labor force. Within the labor force, individuals with college / associate degree education have the highest percentage of unemployment, with 4.6% or 128 of them being unemployed.
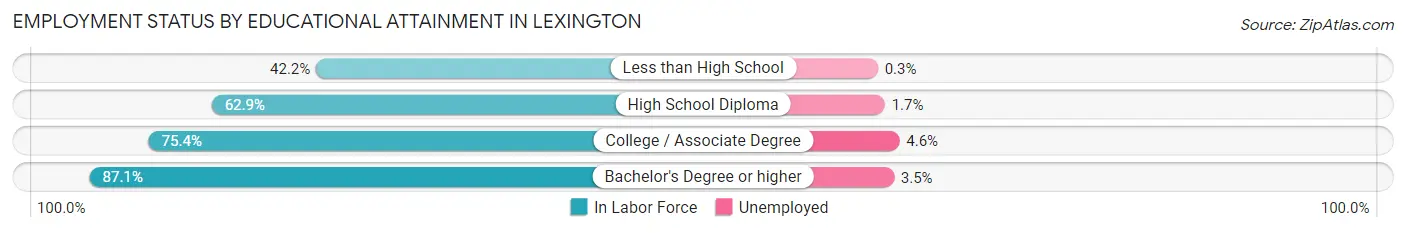
| Educational Attainment | In Labor Force | Unemployed |
| Less than High School | 332 (42.2%) | 2 (0.3%) |
| High School Diploma | 1,280 (62.9%) | 35 (1.7%) |
| College / Associate Degree | 2,782 (75.4%) | 170 (4.6%) |
| Bachelor's Degree or higher | 5,477 (87.1%) | 220 (3.5%) |
| Total | 9,867 (77.1%) | 448 (3.5%) |
Employment Occupations by Sex in Lexington
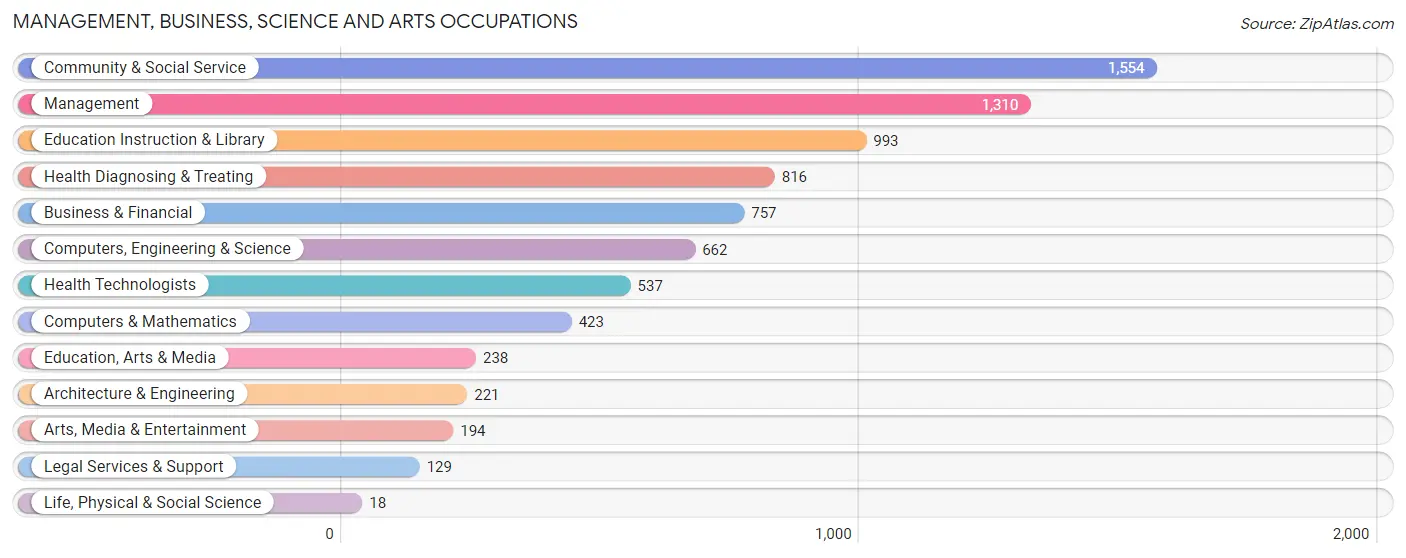
Management, Business, Science and Arts Occupations
The most common Management, Business, Science and Arts occupations in Lexington are Community & Social Service (1,554 | 14.0%), Management (1,310 | 11.8%), Education Instruction & Library (993 | 8.9%), Health Diagnosing & Treating (816 | 7.3%), and Business & Financial (757 | 6.8%).
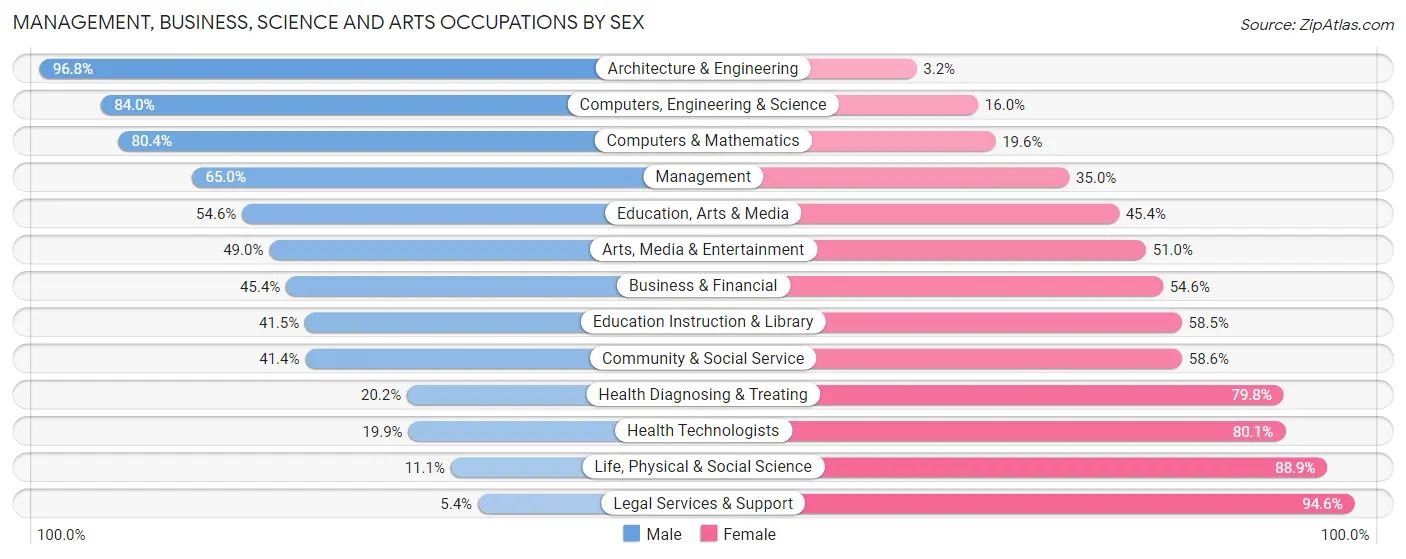
Management, Business, Science and Arts Occupations by Sex
Within the Management, Business, Science and Arts occupations in Lexington, the most male-oriented occupations are Architecture & Engineering (96.8%), Computers, Engineering & Science (84.0%), and Computers & Mathematics (80.4%), while the most female-oriented occupations are Legal Services & Support (94.6%), Life, Physical & Social Science (88.9%), and Health Technologists (80.1%).
| Occupation | Male | Female |
| Management | 851 (65.0%) | 459 (35.0%) |
| Business & Financial | 344 (45.4%) | 413 (54.6%) |
| Computers, Engineering & Science | 556 (84.0%) | 106 (16.0%) |
| Computers & Mathematics | 340 (80.4%) | 83 (19.6%) |
| Architecture & Engineering | 214 (96.8%) | 7 (3.2%) |
| Life, Physical & Social Science | 2 (11.1%) | 16 (88.9%) |
| Community & Social Service | 644 (41.4%) | 910 (58.6%) |
| Education, Arts & Media | 130 (54.6%) | 108 (45.4%) |
| Legal Services & Support | 7 (5.4%) | 122 (94.6%) |
| Education Instruction & Library | 412 (41.5%) | 581 (58.5%) |
| Arts, Media & Entertainment | 95 (49.0%) | 99 (51.0%) |
| Health Diagnosing & Treating | 165 (20.2%) | 651 (79.8%) |
| Health Technologists | 107 (19.9%) | 430 (80.1%) |
| Total (Category) | 2,560 (50.2%) | 2,539 (49.8%) |
| Total (Overall) | 5,608 (50.4%) | 5,527 (49.6%) |
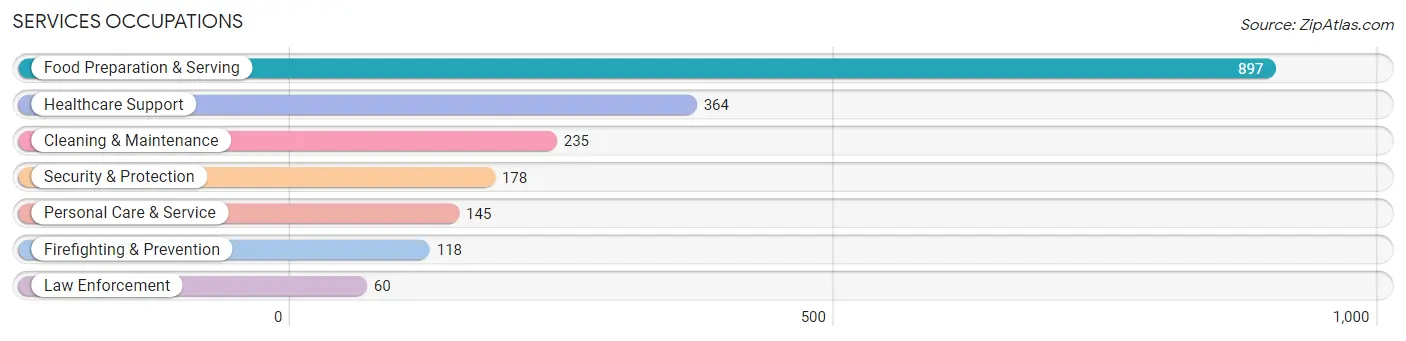
Services Occupations
The most common Services occupations in Lexington are Food Preparation & Serving (897 | 8.1%), Healthcare Support (364 | 3.3%), Cleaning & Maintenance (235 | 2.1%), Security & Protection (178 | 1.6%), and Personal Care & Service (145 | 1.3%).
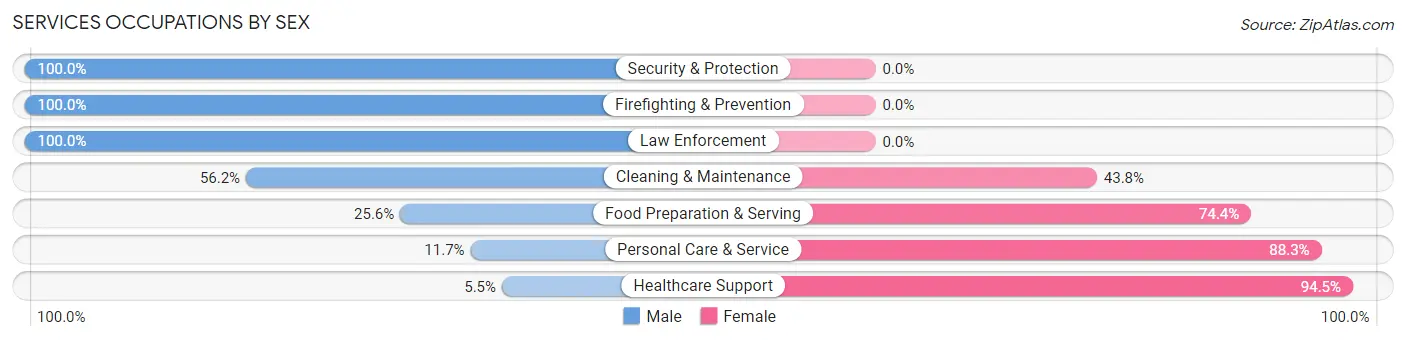
Services Occupations by Sex
Within the Services occupations in Lexington, the most male-oriented occupations are Security & Protection (100.0%), Firefighting & Prevention (100.0%), and Law Enforcement (100.0%), while the most female-oriented occupations are Healthcare Support (94.5%), Personal Care & Service (88.3%), and Food Preparation & Serving (74.4%).
| Occupation | Male | Female |
| Healthcare Support | 20 (5.5%) | 344 (94.5%) |
| Security & Protection | 178 (100.0%) | 0 (0.0%) |
| Firefighting & Prevention | 118 (100.0%) | 0 (0.0%) |
| Law Enforcement | 60 (100.0%) | 0 (0.0%) |
| Food Preparation & Serving | 230 (25.6%) | 667 (74.4%) |
| Cleaning & Maintenance | 132 (56.2%) | 103 (43.8%) |
| Personal Care & Service | 17 (11.7%) | 128 (88.3%) |
| Total (Category) | 577 (31.7%) | 1,242 (68.3%) |
| Total (Overall) | 5,608 (50.4%) | 5,527 (49.6%) |
Sales and Office Occupations
The most common Sales and Office occupations in Lexington are Office & Administration (1,420 | 12.8%), and Sales & Related (1,190 | 10.7%).

Sales and Office Occupations by Sex
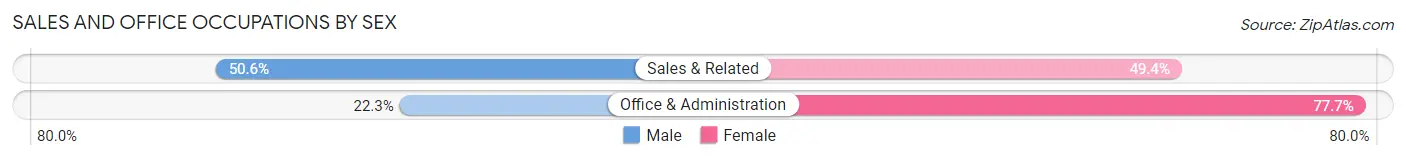
| Occupation | Male | Female |
| Sales & Related | 602 (50.6%) | 588 (49.4%) |
| Office & Administration | 317 (22.3%) | 1,103 (77.7%) |
| Total (Category) | 919 (35.2%) | 1,691 (64.8%) |
| Total (Overall) | 5,608 (50.4%) | 5,527 (49.6%) |
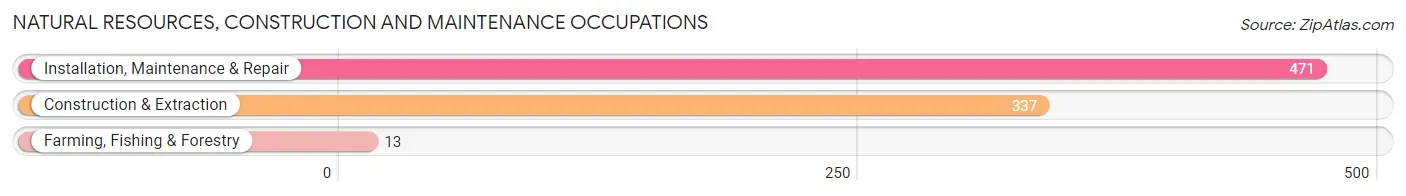
Natural Resources, Construction and Maintenance Occupations
The most common Natural Resources, Construction and Maintenance occupations in Lexington are Installation, Maintenance & Repair (471 | 4.2%), Construction & Extraction (337 | 3.0%), and Farming, Fishing & Forestry (13 | 0.1%).
Natural Resources, Construction and Maintenance Occupations by Sex
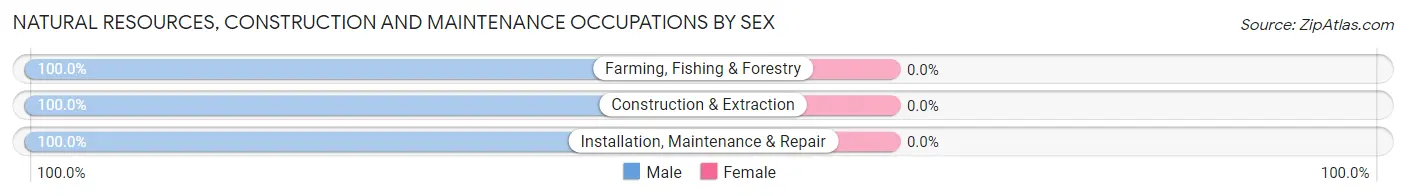
| Occupation | Male | Female |
| Farming, Fishing & Forestry | 13 (100.0%) | 0 (0.0%) |
| Construction & Extraction | 337 (100.0%) | 0 (0.0%) |
| Installation, Maintenance & Repair | 471 (100.0%) | 0 (0.0%) |
| Total (Category) | 821 (100.0%) | 0 (0.0%) |
| Total (Overall) | 5,608 (50.4%) | 5,527 (49.6%) |
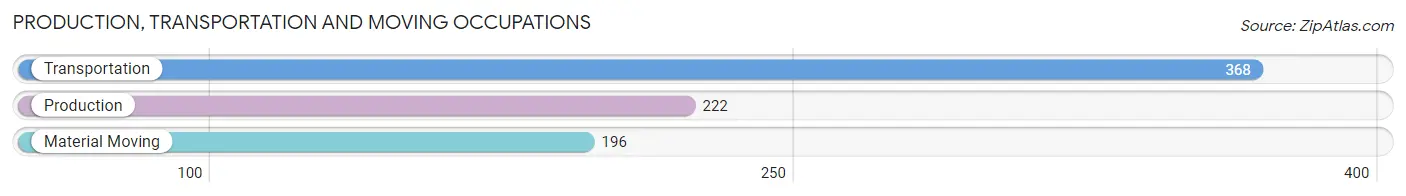
Production, Transportation and Moving Occupations
The most common Production, Transportation and Moving occupations in Lexington are Transportation (368 | 3.3%), Production (222 | 2.0%), and Material Moving (196 | 1.8%).
Production, Transportation and Moving Occupations by Sex
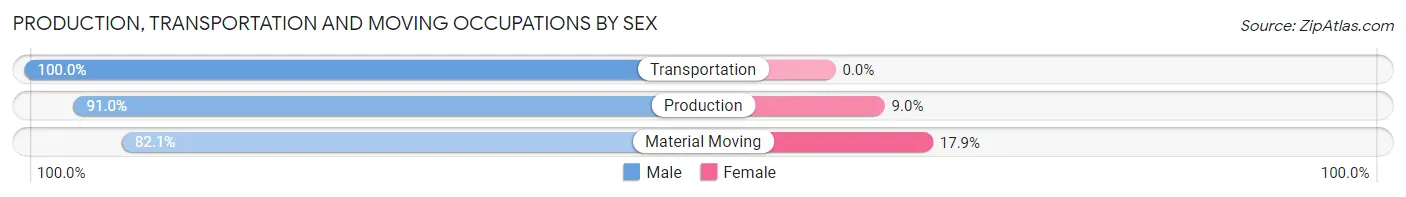
| Occupation | Male | Female |
| Production | 202 (91.0%) | 20 (9.0%) |
| Transportation | 368 (100.0%) | 0 (0.0%) |
| Material Moving | 161 (82.1%) | 35 (17.9%) |
| Total (Category) | 731 (93.0%) | 55 (7.0%) |
| Total (Overall) | 5,608 (50.4%) | 5,527 (49.6%) |
Employment Industries by Sex in Lexington
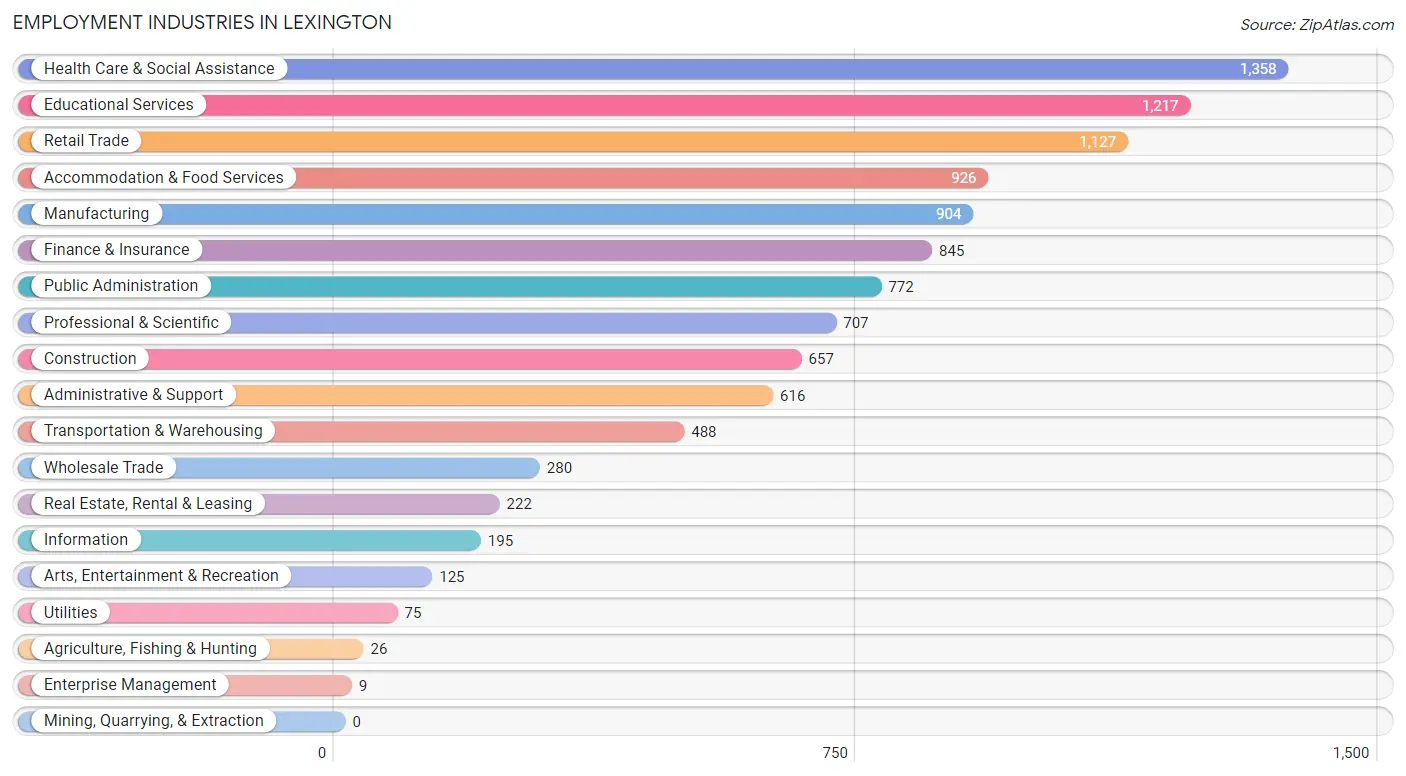
Employment Industries in Lexington
The major employment industries in Lexington include Health Care & Social Assistance (1,358 | 12.2%), Educational Services (1,217 | 10.9%), Retail Trade (1,127 | 10.1%), Accommodation & Food Services (926 | 8.3%), and Manufacturing (904 | 8.1%).
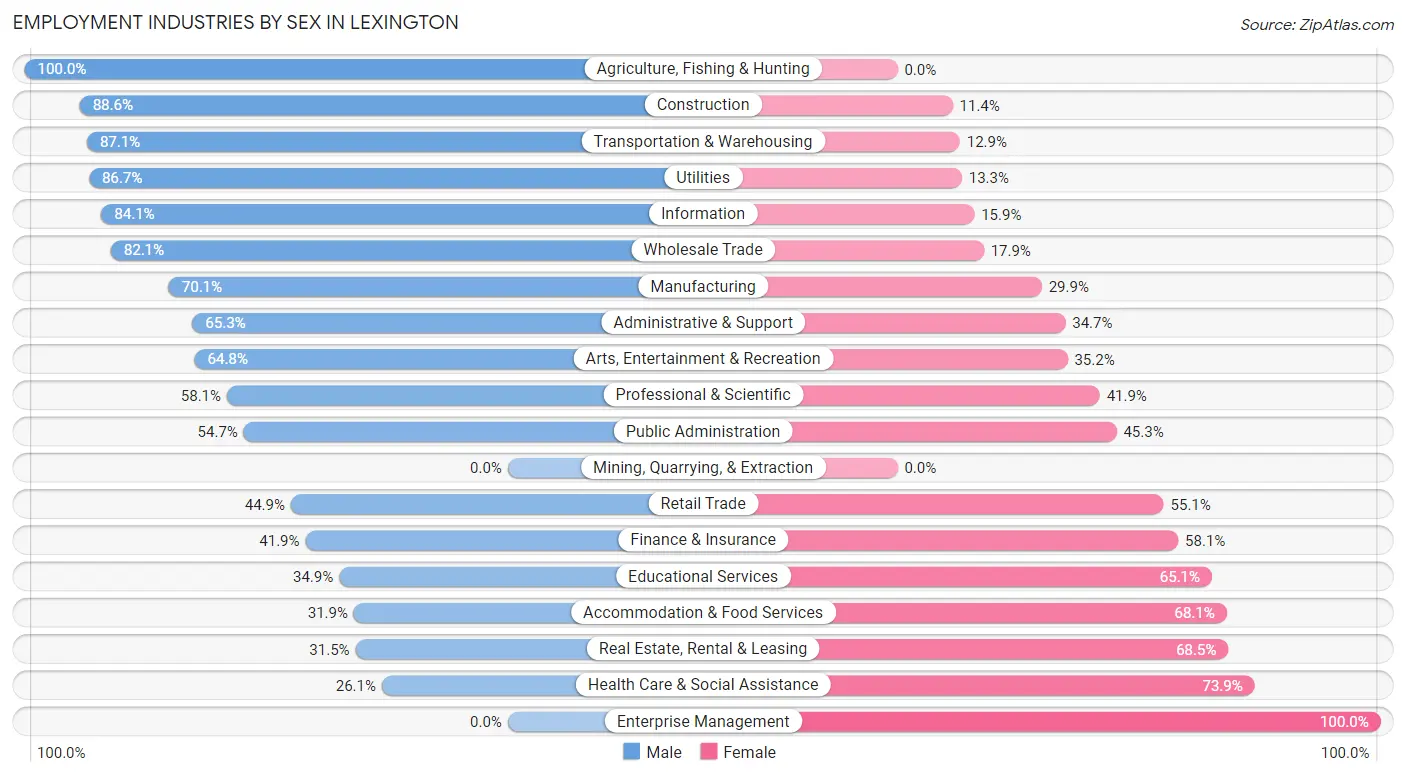
Employment Industries by Sex in Lexington
The Lexington industries that see more men than women are Agriculture, Fishing & Hunting (100.0%), Construction (88.6%), and Transportation & Warehousing (87.1%), whereas the industries that tend to have a higher number of women are Enterprise Management (100.0%), Health Care & Social Assistance (73.9%), and Real Estate, Rental & Leasing (68.5%).
| Industry | Male | Female |
| Agriculture, Fishing & Hunting | 26 (100.0%) | 0 (0.0%) |
| Mining, Quarrying, & Extraction | 0 (0.0%) | 0 (0.0%) |
| Construction | 582 (88.6%) | 75 (11.4%) |
| Manufacturing | 634 (70.1%) | 270 (29.9%) |
| Wholesale Trade | 230 (82.1%) | 50 (17.9%) |
| Retail Trade | 506 (44.9%) | 621 (55.1%) |
| Transportation & Warehousing | 425 (87.1%) | 63 (12.9%) |
| Utilities | 65 (86.7%) | 10 (13.3%) |
| Information | 164 (84.1%) | 31 (15.9%) |
| Finance & Insurance | 354 (41.9%) | 491 (58.1%) |
| Real Estate, Rental & Leasing | 70 (31.5%) | 152 (68.5%) |
| Professional & Scientific | 411 (58.1%) | 296 (41.9%) |
| Enterprise Management | 0 (0.0%) | 9 (100.0%) |
| Administrative & Support | 402 (65.3%) | 214 (34.7%) |
| Educational Services | 425 (34.9%) | 792 (65.1%) |
| Health Care & Social Assistance | 354 (26.1%) | 1,004 (73.9%) |
| Arts, Entertainment & Recreation | 81 (64.8%) | 44 (35.2%) |
| Accommodation & Food Services | 295 (31.9%) | 631 (68.1%) |
| Public Administration | 422 (54.7%) | 350 (45.3%) |
| Total | 5,608 (50.4%) | 5,527 (49.6%) |
Education in Lexington
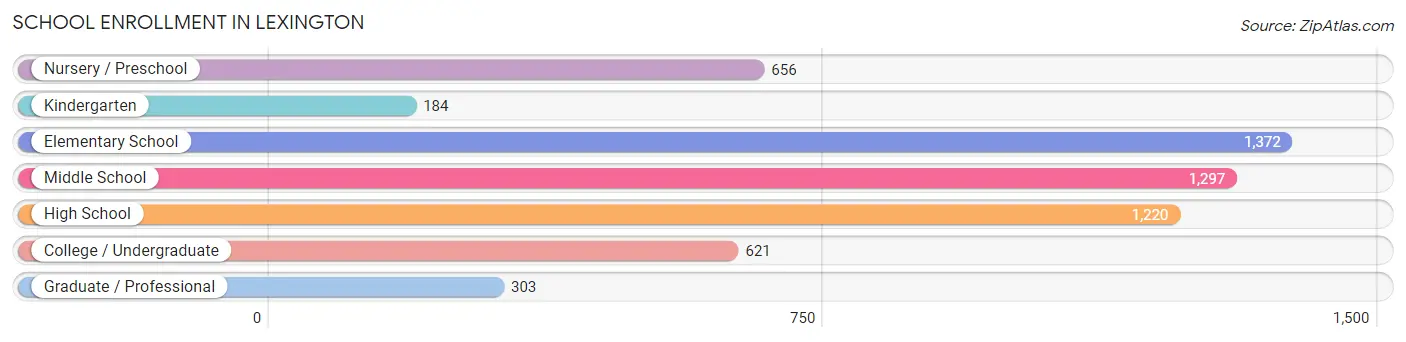
School Enrollment in Lexington
The most common levels of schooling among the 5,653 students in Lexington are elementary school (1,372 | 24.3%), middle school (1,297 | 22.9%), and high school (1,220 | 21.6%).
| School Level | # Students | % Students |
| Nursery / Preschool | 656 | 11.6% |
| Kindergarten | 184 | 3.3% |
| Elementary School | 1,372 | 24.3% |
| Middle School | 1,297 | 22.9% |
| High School | 1,220 | 21.6% |
| College / Undergraduate | 621 | 11.0% |
| Graduate / Professional | 303 | 5.4% |
| Total | 5,653 | 100.0% |
School Enrollment by Age by Funding Source in Lexington
Out of a total of 5,653 students who are enrolled in schools in Lexington, 995 (17.6%) attend a private institution, while the remaining 4,658 (82.4%) are enrolled in public schools. The age group of 3 to 4 year olds has the highest likelihood of being enrolled in private schools, with 295 (51.8% in the age bracket) enrolled. Conversely, the age group of 15 to 17 year olds has the lowest likelihood of being enrolled in a private school, with 816 (96.3% in the age bracket) attending a public institution.
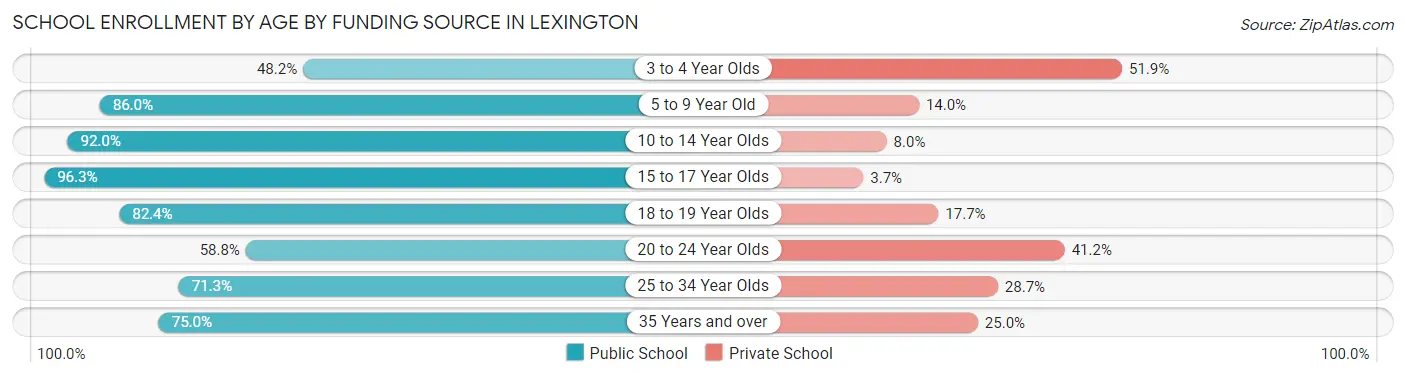
| Age Bracket | Public School | Private School |
| 3 to 4 Year Olds | 274 (48.1%) | 295 (51.8%) |
| 5 to 9 Year Old | 1,282 (86.0%) | 209 (14.0%) |
| 10 to 14 Year Olds | 1,504 (92.0%) | 131 (8.0%) |
| 15 to 17 Year Olds | 816 (96.3%) | 31 (3.7%) |
| 18 to 19 Year Olds | 210 (82.4%) | 45 (17.6%) |
| 20 to 24 Year Olds | 230 (58.8%) | 161 (41.2%) |
| 25 to 34 Year Olds | 129 (71.3%) | 52 (28.7%) |
| 35 Years and over | 213 (75.0%) | 71 (25.0%) |
| Total | 4,658 (82.4%) | 995 (17.6%) |
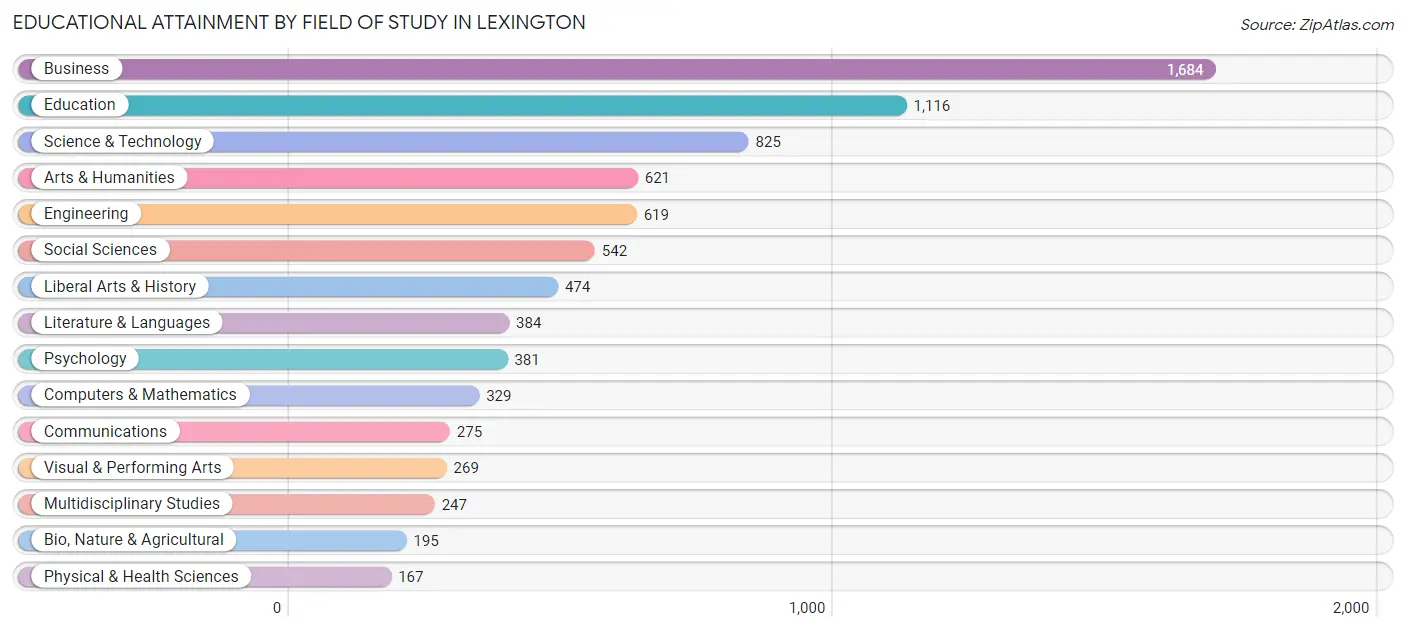
Educational Attainment by Field of Study in Lexington
Business (1,684 | 20.7%), education (1,116 | 13.7%), science & technology (825 | 10.2%), arts & humanities (621 | 7.6%), and engineering (619 | 7.6%) are the most common fields of study among 8,128 individuals in Lexington who have obtained a bachelor's degree or higher.
| Field of Study | # Graduates | % Graduates |
| Computers & Mathematics | 329 | 4.1% |
| Bio, Nature & Agricultural | 195 | 2.4% |
| Physical & Health Sciences | 167 | 2.1% |
| Psychology | 381 | 4.7% |
| Social Sciences | 542 | 6.7% |
| Engineering | 619 | 7.6% |
| Multidisciplinary Studies | 247 | 3.0% |
| Science & Technology | 825 | 10.2% |
| Business | 1,684 | 20.7% |
| Education | 1,116 | 13.7% |
| Literature & Languages | 384 | 4.7% |
| Liberal Arts & History | 474 | 5.8% |
| Visual & Performing Arts | 269 | 3.3% |
| Communications | 275 | 3.4% |
| Arts & Humanities | 621 | 7.6% |
| Total | 8,128 | 100.0% |
Transportation & Commute in Lexington
Vehicle Availability by Sex in Lexington
The most prevalent vehicle ownership categories in Lexington are males with 2 vehicles (3,225, accounting for 57.8%) and females with 2 vehicles (2,693, making up 59.3%).
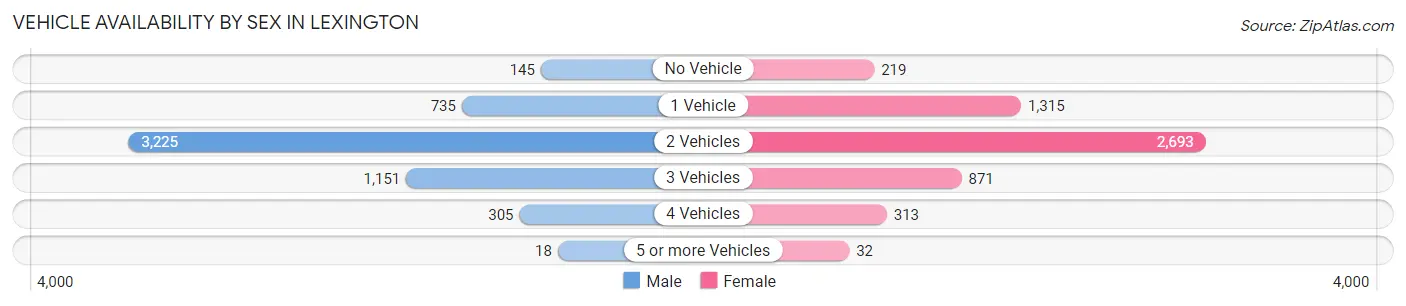
| Vehicles Available | Male | Female |
| No Vehicle | 145 (2.6%) | 219 (4.0%) |
| 1 Vehicle | 735 (13.2%) | 1,315 (24.2%) |
| 2 Vehicles | 3,225 (57.8%) | 2,693 (49.5%) |
| 3 Vehicles | 1,151 (20.6%) | 871 (16.0%) |
| 4 Vehicles | 305 (5.5%) | 313 (5.8%) |
| 5 or more Vehicles | 18 (0.3%) | 32 (0.6%) |
| Total | 5,579 (100.0%) | 5,443 (100.0%) |
Commute Time in Lexington
The most frequently occuring commute durations in Lexington are 20 to 24 minutes (2,188 commuters, 22.1%), 15 to 19 minutes (1,562 commuters, 15.8%), and 30 to 34 minutes (1,529 commuters, 15.4%).
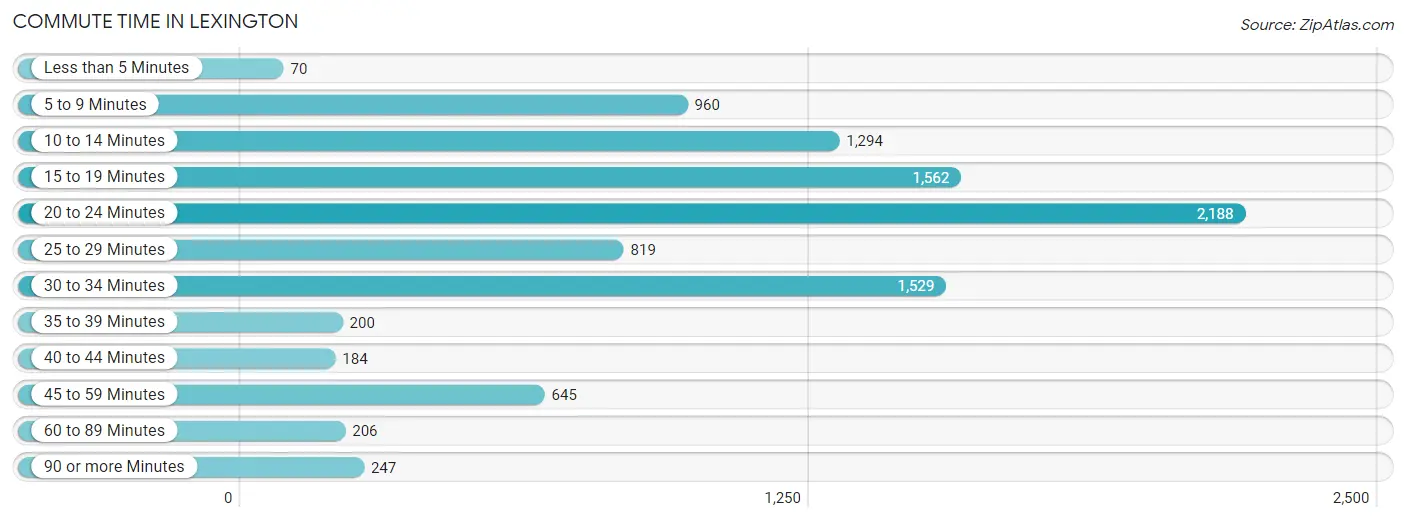
| Commute Time | # Commuters | % Commuters |
| Less than 5 Minutes | 70 | 0.7% |
| 5 to 9 Minutes | 960 | 9.7% |
| 10 to 14 Minutes | 1,294 | 13.1% |
| 15 to 19 Minutes | 1,562 | 15.8% |
| 20 to 24 Minutes | 2,188 | 22.1% |
| 25 to 29 Minutes | 819 | 8.3% |
| 30 to 34 Minutes | 1,529 | 15.4% |
| 35 to 39 Minutes | 200 | 2.0% |
| 40 to 44 Minutes | 184 | 1.9% |
| 45 to 59 Minutes | 645 | 6.5% |
| 60 to 89 Minutes | 206 | 2.1% |
| 90 or more Minutes | 247 | 2.5% |
Commute Time by Sex in Lexington
The most common commute times in Lexington are 20 to 24 minutes (1,229 commuters, 24.6%) for males and 20 to 24 minutes (959 commuters, 19.6%) for females.
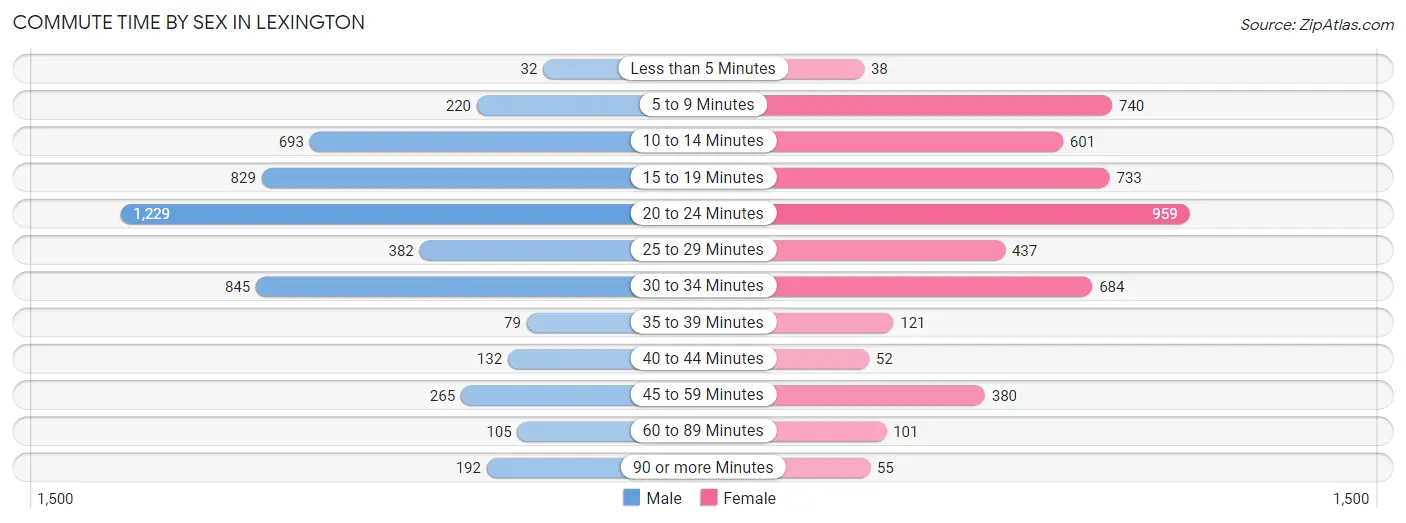
| Commute Time | Male | Female |
| Less than 5 Minutes | 32 (0.6%) | 38 (0.8%) |
| 5 to 9 Minutes | 220 (4.4%) | 740 (15.1%) |
| 10 to 14 Minutes | 693 (13.9%) | 601 (12.3%) |
| 15 to 19 Minutes | 829 (16.6%) | 733 (15.0%) |
| 20 to 24 Minutes | 1,229 (24.6%) | 959 (19.6%) |
| 25 to 29 Minutes | 382 (7.6%) | 437 (8.9%) |
| 30 to 34 Minutes | 845 (16.9%) | 684 (14.0%) |
| 35 to 39 Minutes | 79 (1.6%) | 121 (2.5%) |
| 40 to 44 Minutes | 132 (2.6%) | 52 (1.1%) |
| 45 to 59 Minutes | 265 (5.3%) | 380 (7.7%) |
| 60 to 89 Minutes | 105 (2.1%) | 101 (2.1%) |
| 90 or more Minutes | 192 (3.8%) | 55 (1.1%) |
Time of Departure to Work by Sex in Lexington
The most frequent times of departure to work in Lexington are 7:00 AM to 7:29 AM (1,152, 23.0%) for males and 8:00 AM to 8:29 AM (1,073, 21.9%) for females.
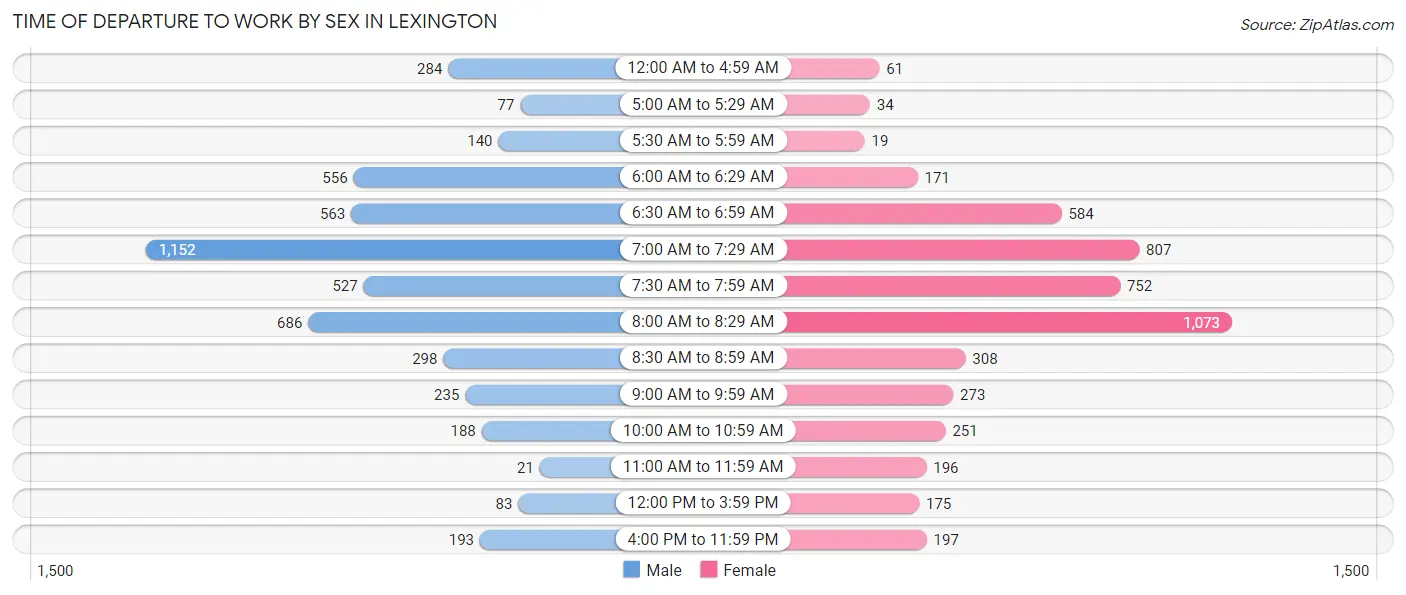
| Time of Departure | Male | Female |
| 12:00 AM to 4:59 AM | 284 (5.7%) | 61 (1.2%) |
| 5:00 AM to 5:29 AM | 77 (1.5%) | 34 (0.7%) |
| 5:30 AM to 5:59 AM | 140 (2.8%) | 19 (0.4%) |
| 6:00 AM to 6:29 AM | 556 (11.1%) | 171 (3.5%) |
| 6:30 AM to 6:59 AM | 563 (11.3%) | 584 (11.9%) |
| 7:00 AM to 7:29 AM | 1,152 (23.0%) | 807 (16.5%) |
| 7:30 AM to 7:59 AM | 527 (10.5%) | 752 (15.3%) |
| 8:00 AM to 8:29 AM | 686 (13.7%) | 1,073 (21.9%) |
| 8:30 AM to 8:59 AM | 298 (6.0%) | 308 (6.3%) |
| 9:00 AM to 9:59 AM | 235 (4.7%) | 273 (5.6%) |
| 10:00 AM to 10:59 AM | 188 (3.8%) | 251 (5.1%) |
| 11:00 AM to 11:59 AM | 21 (0.4%) | 196 (4.0%) |
| 12:00 PM to 3:59 PM | 83 (1.7%) | 175 (3.6%) |
| 4:00 PM to 11:59 PM | 193 (3.9%) | 197 (4.0%) |
| Total | 5,003 (100.0%) | 4,901 (100.0%) |
Housing Occupancy in Lexington
Occupancy by Ownership in Lexington
Of the total 9,274 dwellings in Lexington, owner-occupied units account for 6,276 (67.7%), while renter-occupied units make up 2,998 (32.3%).
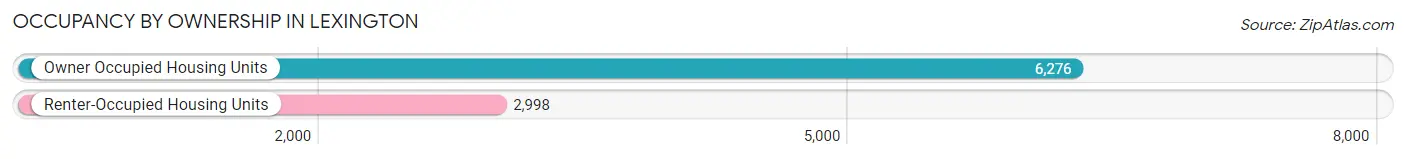
| Occupancy | # Housing Units | % Housing Units |
| Owner Occupied Housing Units | 6,276 | 67.7% |
| Renter-Occupied Housing Units | 2,998 | 32.3% |
| Total Occupied Housing Units | 9,274 | 100.0% |
Occupancy by Household Size in Lexington
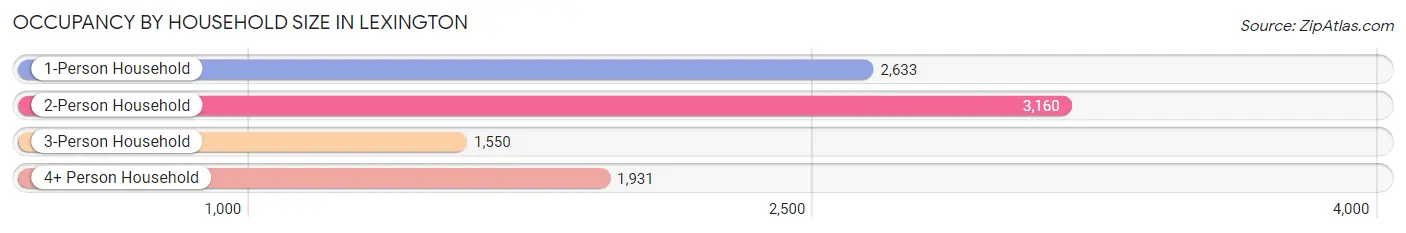
| Household Size | # Housing Units | % Housing Units |
| 1-Person Household | 2,633 | 28.4% |
| 2-Person Household | 3,160 | 34.1% |
| 3-Person Household | 1,550 | 16.7% |
| 4+ Person Household | 1,931 | 20.8% |
| Total Housing Units | 9,274 | 100.0% |
Occupancy by Ownership by Household Size in Lexington
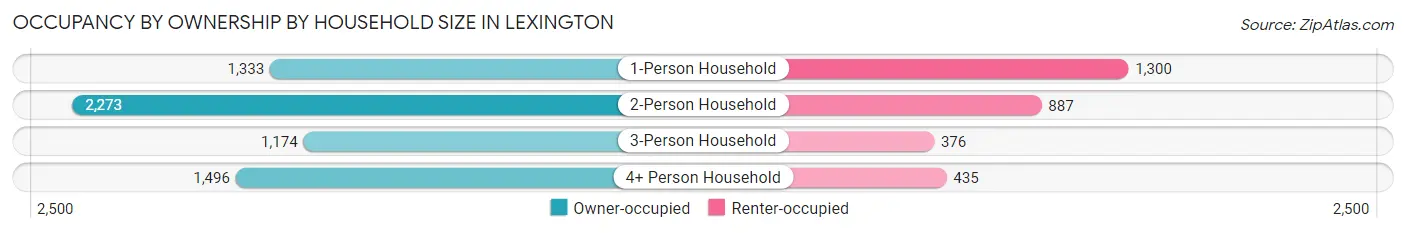
| Household Size | Owner-occupied | Renter-occupied |
| 1-Person Household | 1,333 (50.6%) | 1,300 (49.4%) |
| 2-Person Household | 2,273 (71.9%) | 887 (28.1%) |
| 3-Person Household | 1,174 (75.7%) | 376 (24.3%) |
| 4+ Person Household | 1,496 (77.5%) | 435 (22.5%) |
| Total Housing Units | 6,276 (67.7%) | 2,998 (32.3%) |
Occupancy by Educational Attainment in Lexington
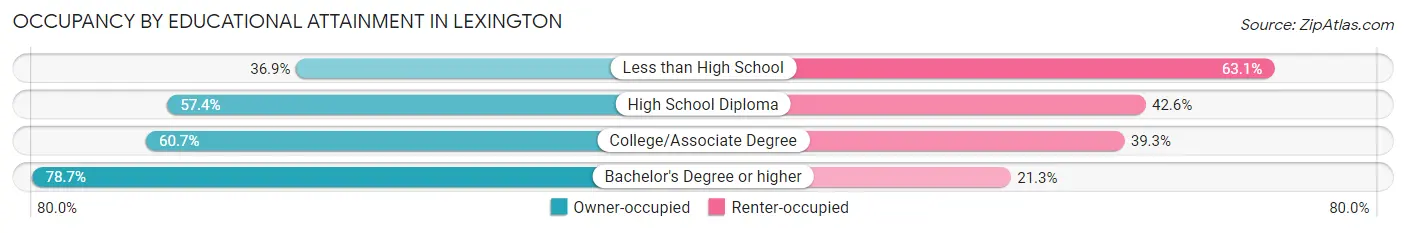
| Household Size | Owner-occupied | Renter-occupied |
| Less than High School | 110 (36.9%) | 188 (63.1%) |
| High School Diploma | 838 (57.4%) | 623 (42.6%) |
| College/Associate Degree | 1,986 (60.7%) | 1,284 (39.3%) |
| Bachelor's Degree or higher | 3,342 (78.7%) | 903 (21.3%) |
Occupancy by Age of Householder in Lexington
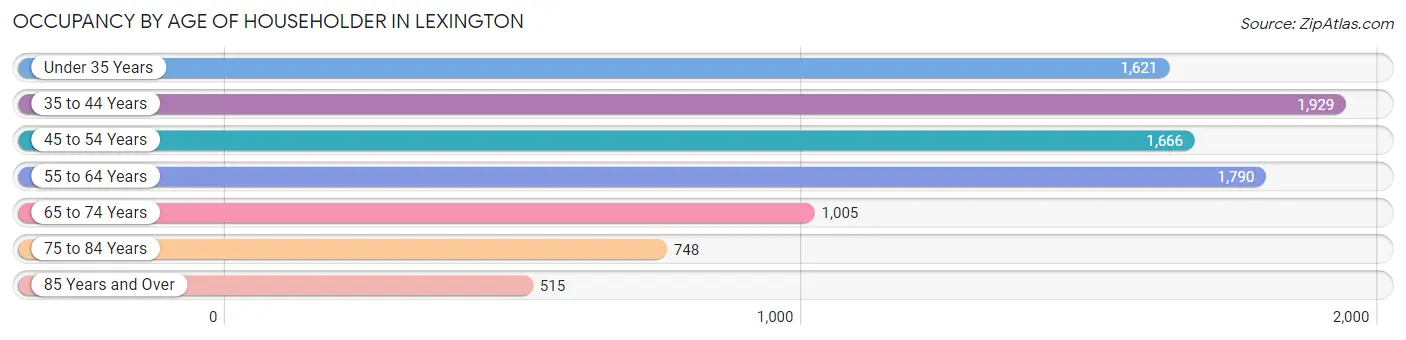
| Age Bracket | # Households | % Households |
| Under 35 Years | 1,621 | 17.5% |
| 35 to 44 Years | 1,929 | 20.8% |
| 45 to 54 Years | 1,666 | 18.0% |
| 55 to 64 Years | 1,790 | 19.3% |
| 65 to 74 Years | 1,005 | 10.8% |
| 75 to 84 Years | 748 | 8.1% |
| 85 Years and Over | 515 | 5.6% |
| Total | 9,274 | 100.0% |
Housing Finances in Lexington
Median Income by Occupancy in Lexington
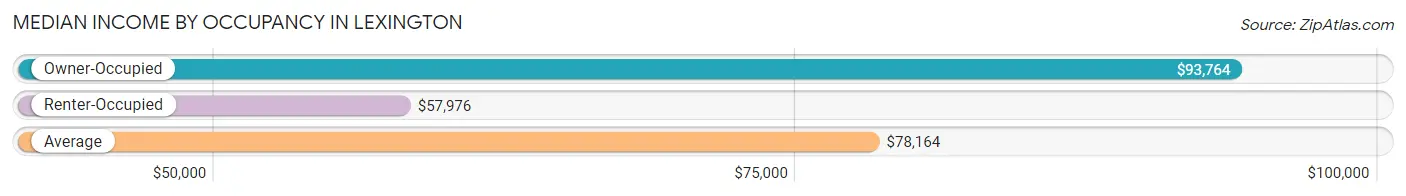
| Occupancy Type | # Households | Median Income |
| Owner-Occupied | 6,276 (67.7%) | $93,764 |
| Renter-Occupied | 2,998 (32.3%) | $57,976 |
| Average | 9,274 (100.0%) | $78,164 |
Occupancy by Householder Income Bracket in Lexington
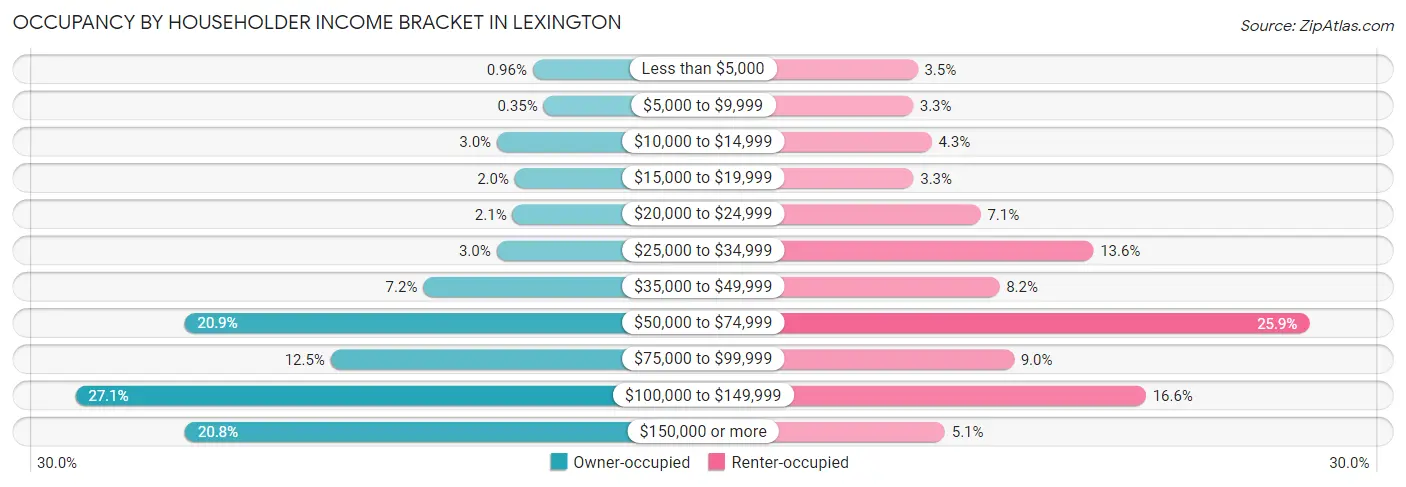
| Income Bracket | Owner-occupied | Renter-occupied |
| Less than $5,000 | 60 (1.0%) | 106 (3.5%) |
| $5,000 to $9,999 | 22 (0.4%) | 98 (3.3%) |
| $10,000 to $14,999 | 189 (3.0%) | 130 (4.3%) |
| $15,000 to $19,999 | 125 (2.0%) | 99 (3.3%) |
| $20,000 to $24,999 | 133 (2.1%) | 214 (7.1%) |
| $25,000 to $34,999 | 190 (3.0%) | 407 (13.6%) |
| $35,000 to $49,999 | 453 (7.2%) | 246 (8.2%) |
| $50,000 to $74,999 | 1,310 (20.9%) | 777 (25.9%) |
| $75,000 to $99,999 | 785 (12.5%) | 271 (9.0%) |
| $100,000 to $149,999 | 1,701 (27.1%) | 497 (16.6%) |
| $150,000 or more | 1,308 (20.8%) | 153 (5.1%) |
| Total | 6,276 (100.0%) | 2,998 (100.0%) |
Monthly Housing Cost Tiers in Lexington
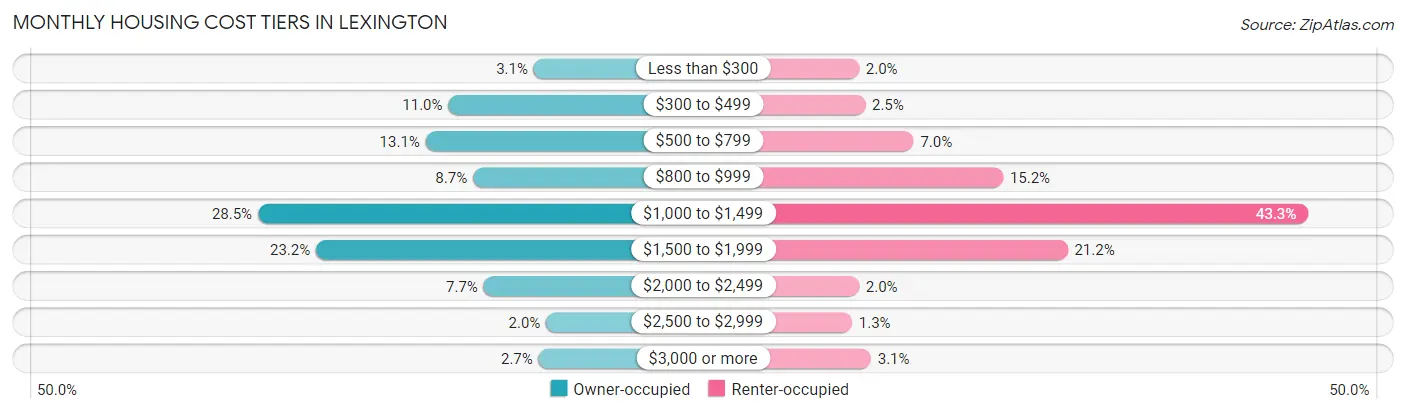
| Monthly Cost | Owner-occupied | Renter-occupied |
| Less than $300 | 196 (3.1%) | 59 (2.0%) |
| $300 to $499 | 690 (11.0%) | 76 (2.5%) |
| $500 to $799 | 821 (13.1%) | 210 (7.0%) |
| $800 to $999 | 547 (8.7%) | 457 (15.2%) |
| $1,000 to $1,499 | 1,790 (28.5%) | 1,299 (43.3%) |
| $1,500 to $1,999 | 1,454 (23.2%) | 635 (21.2%) |
| $2,000 to $2,499 | 486 (7.7%) | 59 (2.0%) |
| $2,500 to $2,999 | 124 (2.0%) | 40 (1.3%) |
| $3,000 or more | 168 (2.7%) | 92 (3.1%) |
| Total | 6,276 (100.0%) | 2,998 (100.0%) |
Physical Housing Characteristics in Lexington
Housing Structures in Lexington
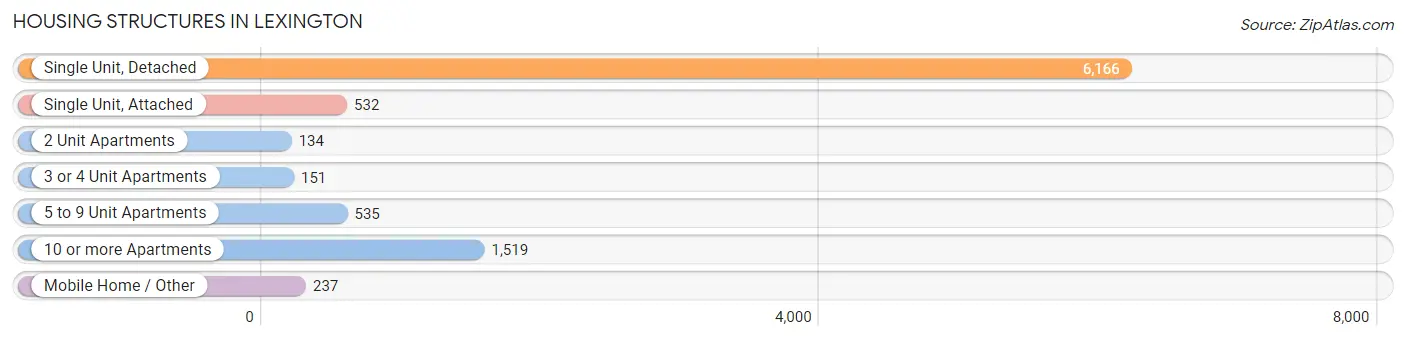
| Structure Type | # Housing Units | % Housing Units |
| Single Unit, Detached | 6,166 | 66.5% |
| Single Unit, Attached | 532 | 5.7% |
| 2 Unit Apartments | 134 | 1.4% |
| 3 or 4 Unit Apartments | 151 | 1.6% |
| 5 to 9 Unit Apartments | 535 | 5.8% |
| 10 or more Apartments | 1,519 | 16.4% |
| Mobile Home / Other | 237 | 2.6% |
| Total | 9,274 | 100.0% |
Housing Structures by Occupancy in Lexington
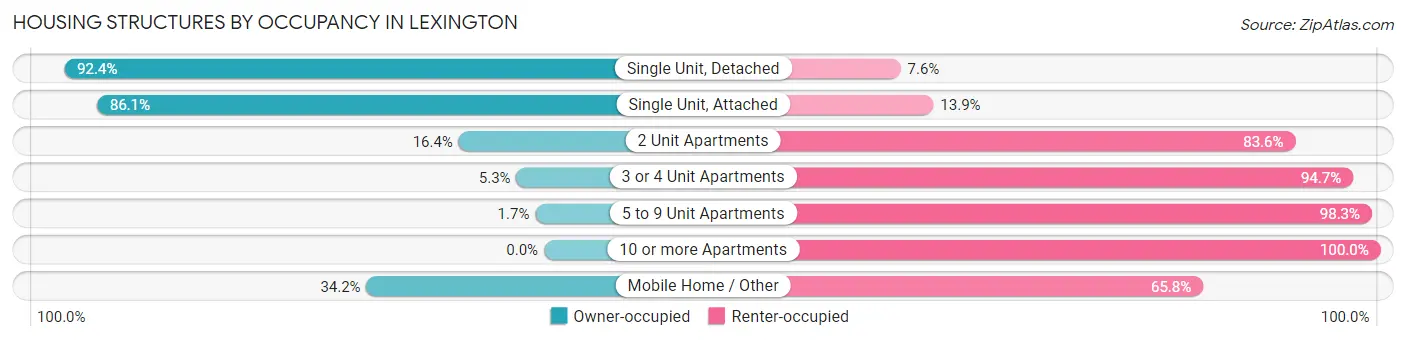
| Structure Type | Owner-occupied | Renter-occupied |
| Single Unit, Detached | 5,698 (92.4%) | 468 (7.6%) |
| Single Unit, Attached | 458 (86.1%) | 74 (13.9%) |
| 2 Unit Apartments | 22 (16.4%) | 112 (83.6%) |
| 3 or 4 Unit Apartments | 8 (5.3%) | 143 (94.7%) |
| 5 to 9 Unit Apartments | 9 (1.7%) | 526 (98.3%) |
| 10 or more Apartments | 0 (0.0%) | 1,519 (100.0%) |
| Mobile Home / Other | 81 (34.2%) | 156 (65.8%) |
| Total | 6,276 (67.7%) | 2,998 (32.3%) |
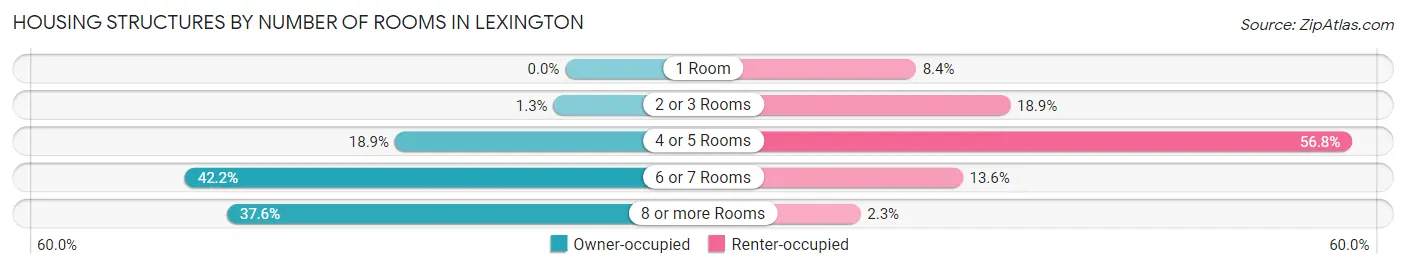
Housing Structures by Number of Rooms in Lexington
| Number of Rooms | Owner-occupied | Renter-occupied |
| 1 Room | 0 (0.0%) | 252 (8.4%) |
| 2 or 3 Rooms | 82 (1.3%) | 566 (18.9%) |
| 4 or 5 Rooms | 1,187 (18.9%) | 1,704 (56.8%) |
| 6 or 7 Rooms | 2,650 (42.2%) | 408 (13.6%) |
| 8 or more Rooms | 2,357 (37.6%) | 68 (2.3%) |
| Total | 6,276 (100.0%) | 2,998 (100.0%) |
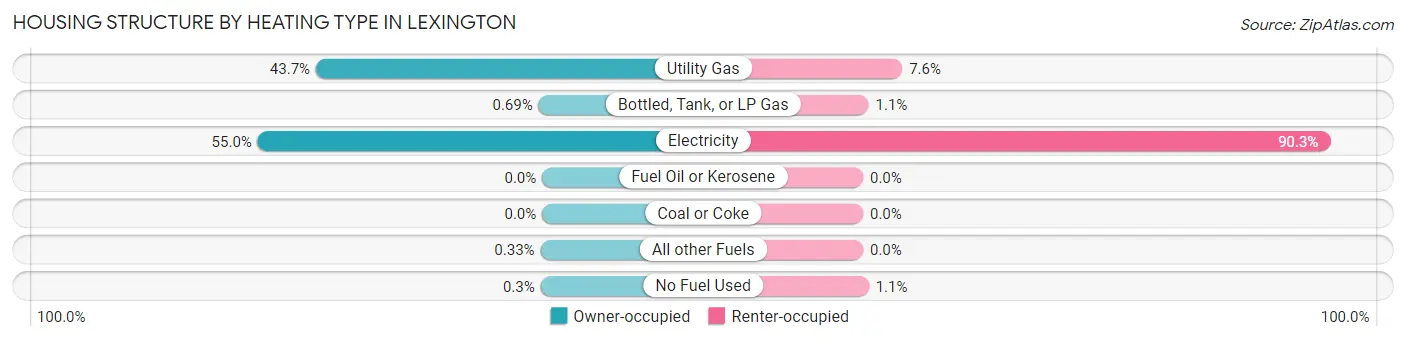
Housing Structure by Heating Type in Lexington
| Heating Type | Owner-occupied | Renter-occupied |
| Utility Gas | 2,743 (43.7%) | 227 (7.6%) |
| Bottled, Tank, or LP Gas | 43 (0.7%) | 32 (1.1%) |
| Electricity | 3,450 (55.0%) | 2,706 (90.3%) |
| Fuel Oil or Kerosene | 0 (0.0%) | 0 (0.0%) |
| Coal or Coke | 0 (0.0%) | 0 (0.0%) |
| All other Fuels | 21 (0.3%) | 0 (0.0%) |
| No Fuel Used | 19 (0.3%) | 33 (1.1%) |
| Total | 6,276 (100.0%) | 2,998 (100.0%) |
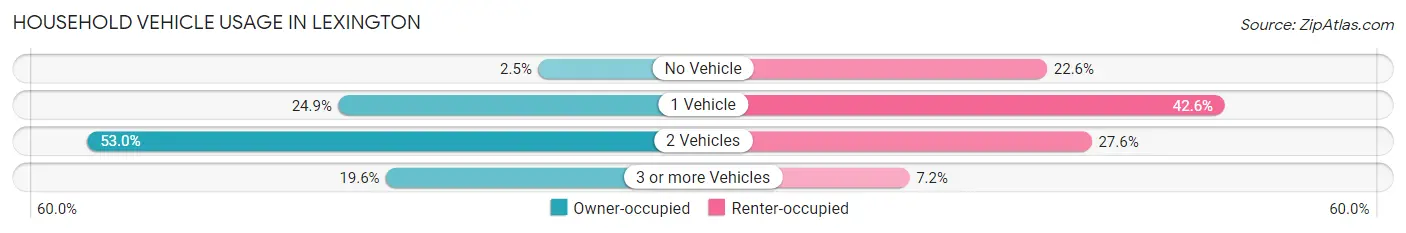
Household Vehicle Usage in Lexington
| Vehicles per Household | Owner-occupied | Renter-occupied |
| No Vehicle | 158 (2.5%) | 678 (22.6%) |
| 1 Vehicle | 1,564 (24.9%) | 1,276 (42.6%) |
| 2 Vehicles | 3,325 (53.0%) | 828 (27.6%) |
| 3 or more Vehicles | 1,229 (19.6%) | 216 (7.2%) |
| Total | 6,276 (100.0%) | 2,998 (100.0%) |
Real Estate & Mortgages in Lexington
Real Estate and Mortgage Overview in Lexington
| Characteristic | Without Mortgage | With Mortgage |
| Housing Units | 1,682 | 4,594 |
| Median Property Value | $250,500 | $236,800 |
| Median Household Income | $90,417 | $990 |
| Monthly Housing Costs | $498 | $165 |
| Real Estate Taxes | $1,463 | $137 |
Property Value by Mortgage Status in Lexington
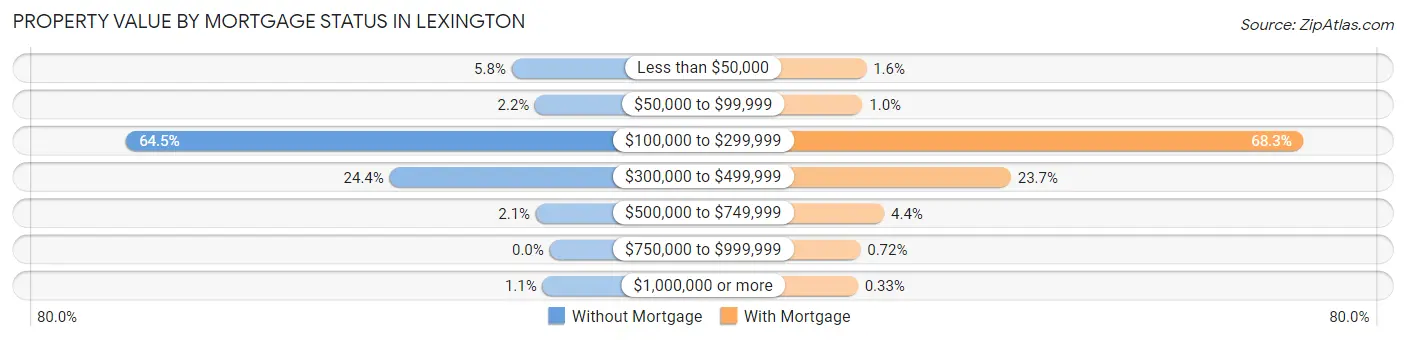
| Property Value | Without Mortgage | With Mortgage |
| Less than $50,000 | 97 (5.8%) | 75 (1.6%) |
| $50,000 to $99,999 | 37 (2.2%) | 48 (1.0%) |
| $100,000 to $299,999 | 1,085 (64.5%) | 3,136 (68.3%) |
| $300,000 to $499,999 | 410 (24.4%) | 1,087 (23.7%) |
| $500,000 to $749,999 | 35 (2.1%) | 200 (4.3%) |
| $750,000 to $999,999 | 0 (0.0%) | 33 (0.7%) |
| $1,000,000 or more | 18 (1.1%) | 15 (0.3%) |
| Total | 1,682 (100.0%) | 4,594 (100.0%) |
Household Income by Mortgage Status in Lexington
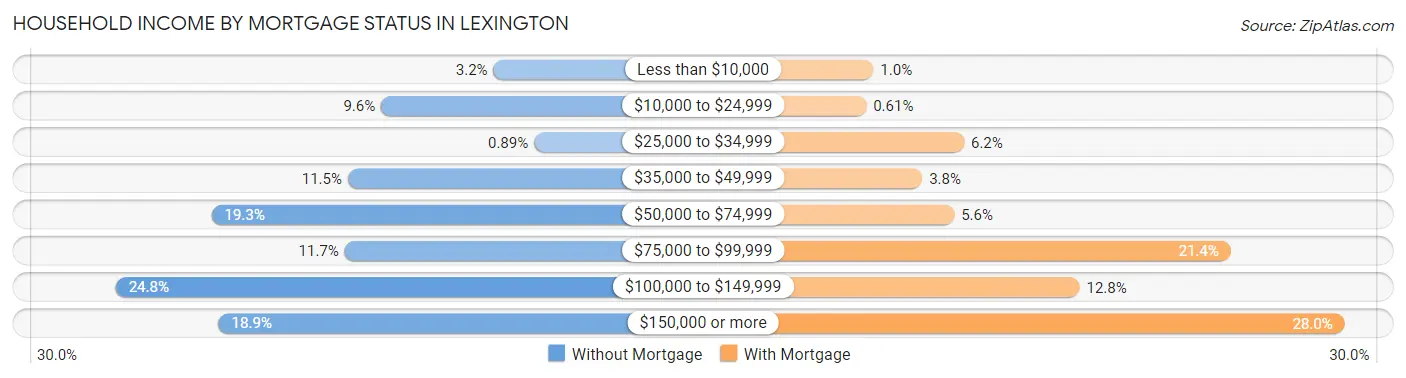
| Household Income | Without Mortgage | With Mortgage |
| Less than $10,000 | 54 (3.2%) | 47 (1.0%) |
| $10,000 to $24,999 | 162 (9.6%) | 28 (0.6%) |
| $25,000 to $34,999 | 15 (0.9%) | 285 (6.2%) |
| $35,000 to $49,999 | 194 (11.5%) | 175 (3.8%) |
| $50,000 to $74,999 | 325 (19.3%) | 259 (5.6%) |
| $75,000 to $99,999 | 197 (11.7%) | 985 (21.4%) |
| $100,000 to $149,999 | 417 (24.8%) | 588 (12.8%) |
| $150,000 or more | 318 (18.9%) | 1,284 (28.0%) |
| Total | 1,682 (100.0%) | 4,594 (100.0%) |
Property Value to Household Income Ratio in Lexington
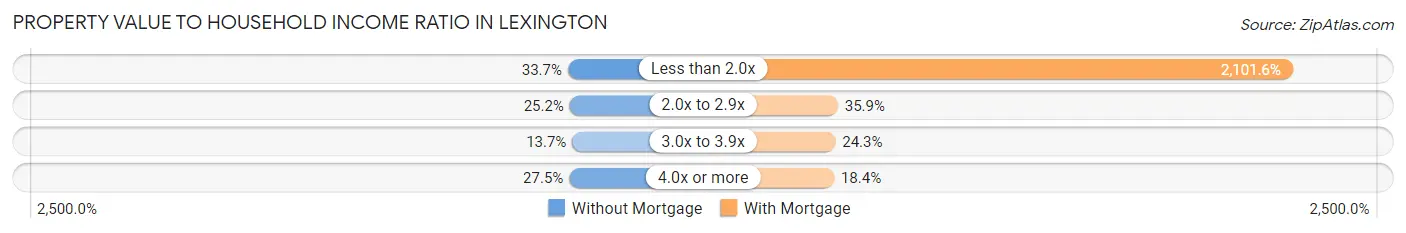
| Value-to-Income Ratio | Without Mortgage | With Mortgage |
| Less than 2.0x | 566 (33.7%) | 96,548 (2,101.6%) |
| 2.0x to 2.9x | 423 (25.2%) | 1,647 (35.8%) |
| 3.0x to 3.9x | 230 (13.7%) | 1,117 (24.3%) |
| 4.0x or more | 463 (27.5%) | 847 (18.4%) |
| Total | 1,682 (100.0%) | 4,594 (100.0%) |
Real Estate Taxes by Mortgage Status in Lexington
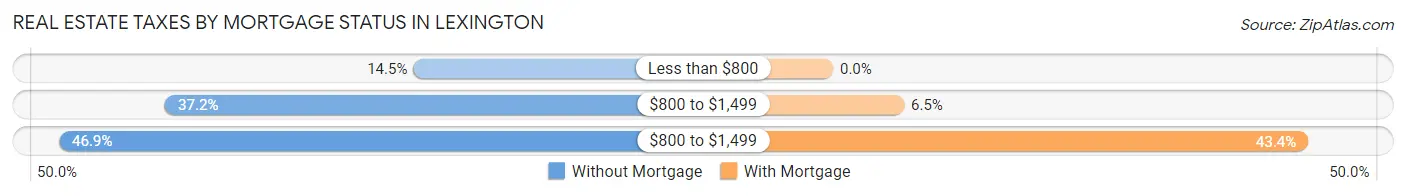
| Property Taxes | Without Mortgage | With Mortgage |
| Less than $800 | 244 (14.5%) | 0 (0.0%) |
| $800 to $1,499 | 625 (37.2%) | 298 (6.5%) |
| $800 to $1,499 | 788 (46.9%) | 1,993 (43.4%) |
| Total | 1,682 (100.0%) | 4,594 (100.0%) |
Health & Disability in Lexington
Health Insurance Coverage by Age in Lexington
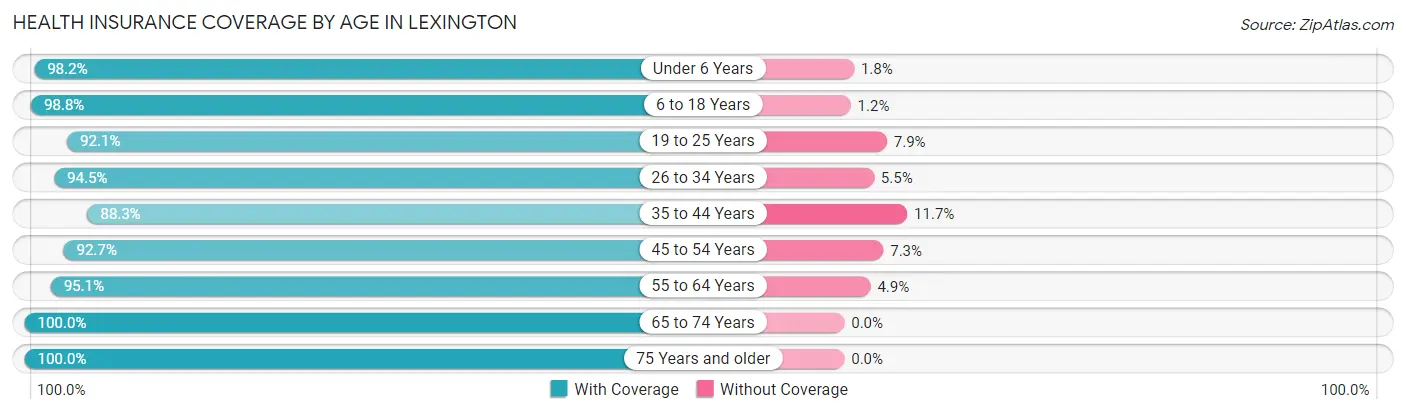
| Age Bracket | With Coverage | Without Coverage |
| Under 6 Years | 1,799 (98.2%) | 33 (1.8%) |
| 6 to 18 Years | 3,999 (98.8%) | 48 (1.2%) |
| 19 to 25 Years | 1,440 (92.1%) | 124 (7.9%) |
| 26 to 34 Years | 2,378 (94.5%) | 139 (5.5%) |
| 35 to 44 Years | 3,140 (88.3%) | 417 (11.7%) |
| 45 to 54 Years | 2,565 (92.7%) | 201 (7.3%) |
| 55 to 64 Years | 2,769 (95.1%) | 142 (4.9%) |
| 65 to 74 Years | 1,588 (100.0%) | 0 (0.0%) |
| 75 Years and older | 1,859 (100.0%) | 0 (0.0%) |
| Total | 21,537 (95.1%) | 1,104 (4.9%) |
Health Insurance Coverage by Citizenship Status in Lexington
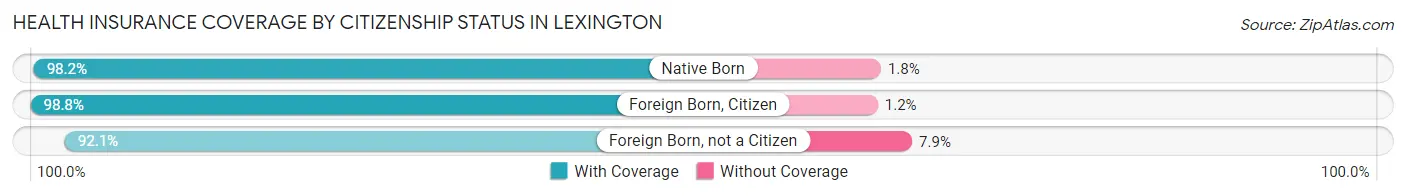
| Citizenship Status | With Coverage | Without Coverage |
| Native Born | 1,799 (98.2%) | 33 (1.8%) |
| Foreign Born, Citizen | 3,999 (98.8%) | 48 (1.2%) |
| Foreign Born, not a Citizen | 1,440 (92.1%) | 124 (7.9%) |
Health Insurance Coverage by Household Income in Lexington
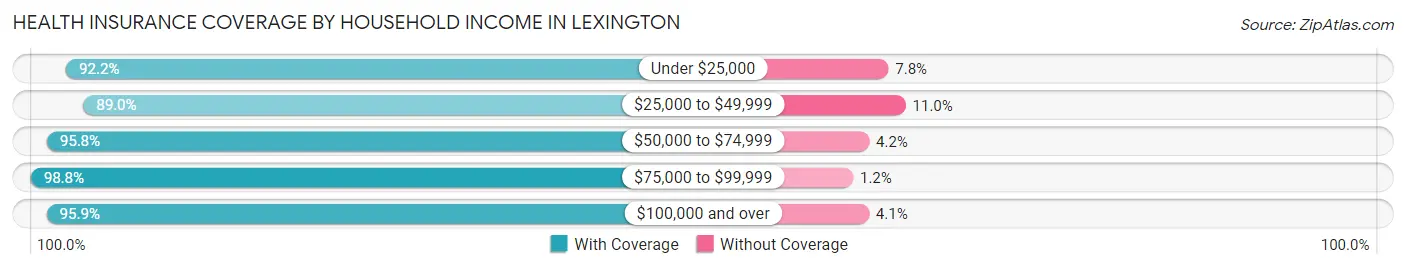
| Household Income | With Coverage | Without Coverage |
| Under $25,000 | 1,836 (92.2%) | 155 (7.8%) |
| $25,000 to $49,999 | 2,003 (89.0%) | 248 (11.0%) |
| $50,000 to $74,999 | 4,934 (95.8%) | 215 (4.2%) |
| $75,000 to $99,999 | 2,615 (98.8%) | 31 (1.2%) |
| $100,000 and over | 10,007 (95.9%) | 432 (4.1%) |
Public vs Private Health Insurance Coverage by Age in Lexington
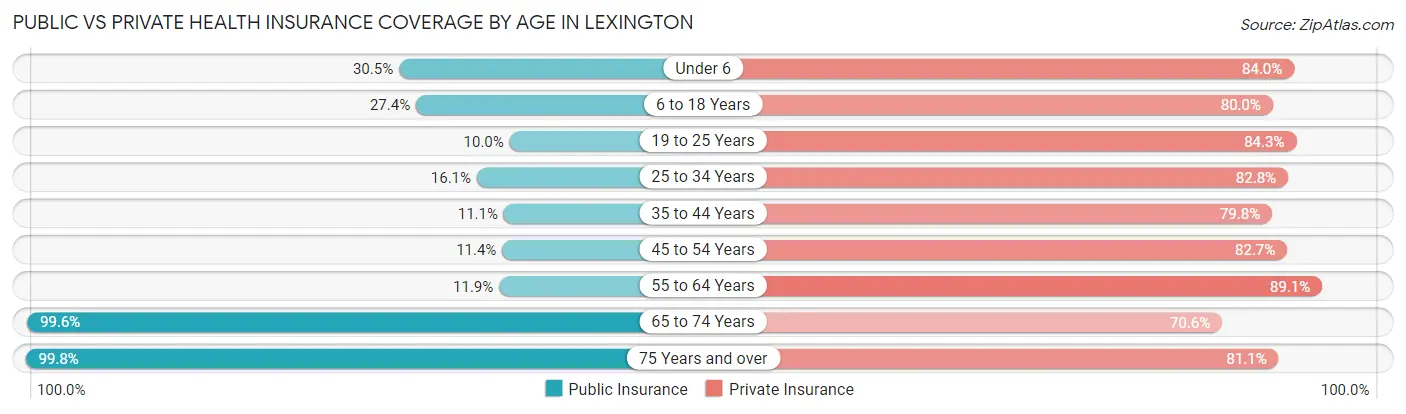
| Age Bracket | Public Insurance | Private Insurance |
| Under 6 | 559 (30.5%) | 1,538 (84.0%) |
| 6 to 18 Years | 1,107 (27.4%) | 3,237 (80.0%) |
| 19 to 25 Years | 156 (10.0%) | 1,319 (84.3%) |
| 25 to 34 Years | 404 (16.1%) | 2,084 (82.8%) |
| 35 to 44 Years | 393 (11.1%) | 2,840 (79.8%) |
| 45 to 54 Years | 314 (11.4%) | 2,286 (82.7%) |
| 55 to 64 Years | 347 (11.9%) | 2,595 (89.1%) |
| 65 to 74 Years | 1,581 (99.6%) | 1,121 (70.6%) |
| 75 Years and over | 1,856 (99.8%) | 1,507 (81.1%) |
| Total | 6,717 (29.7%) | 18,527 (81.8%) |
Disability Status by Sex by Age in Lexington
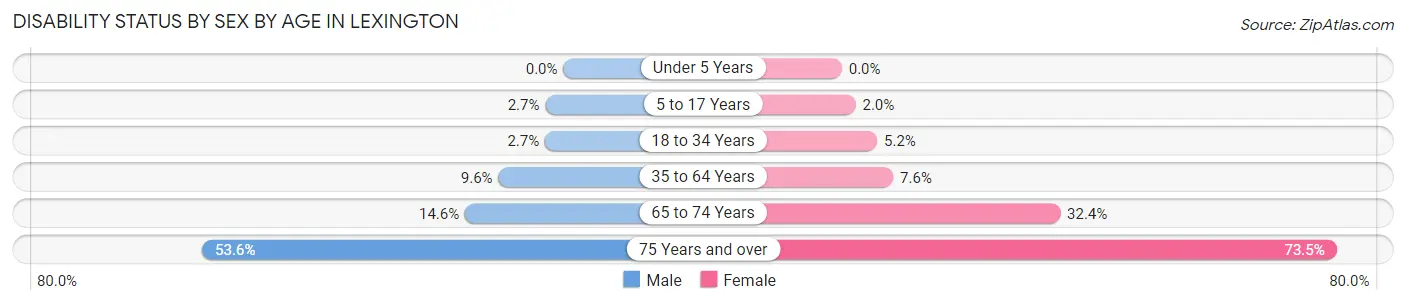
| Age Bracket | Male | Female |
| Under 5 Years | 0 (0.0%) | 0 (0.0%) |
| 5 to 17 Years | 52 (2.7%) | 43 (2.0%) |
| 18 to 34 Years | 51 (2.7%) | 128 (5.2%) |
| 35 to 64 Years | 414 (9.6%) | 377 (7.6%) |
| 65 to 74 Years | 99 (14.6%) | 295 (32.4%) |
| 75 Years and over | 413 (53.6%) | 800 (73.5%) |
Disability Class by Sex by Age in Lexington
Disability Class: Hearing Difficulty
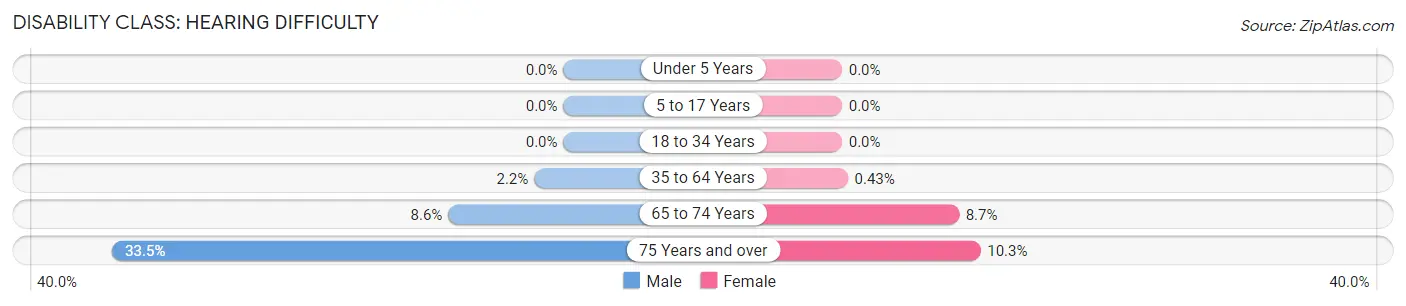
| Age Bracket | Male | Female |
| Under 5 Years | 0 (0.0%) | 0 (0.0%) |
| 5 to 17 Years | 0 (0.0%) | 0 (0.0%) |
| 18 to 34 Years | 0 (0.0%) | 0 (0.0%) |
| 35 to 64 Years | 93 (2.2%) | 21 (0.4%) |
| 65 to 74 Years | 58 (8.6%) | 79 (8.7%) |
| 75 Years and over | 258 (33.5%) | 112 (10.3%) |
Disability Class: Vision Difficulty
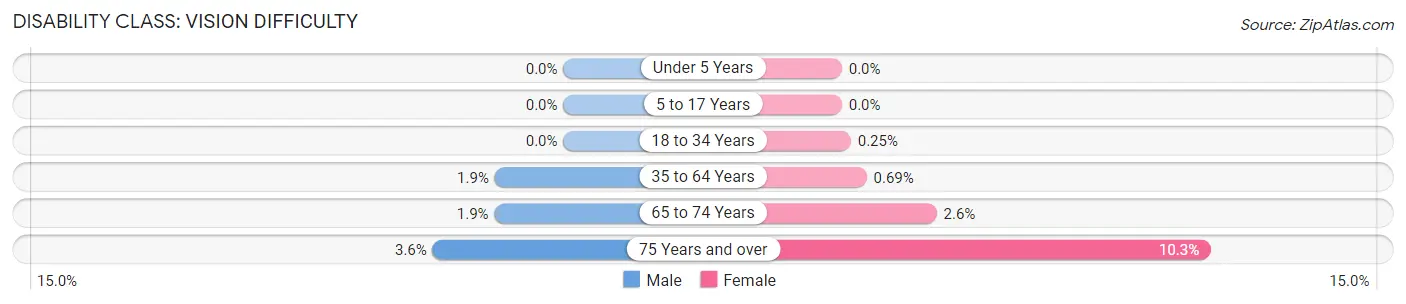
| Age Bracket | Male | Female |
| Under 5 Years | 0 (0.0%) | 0 (0.0%) |
| 5 to 17 Years | 0 (0.0%) | 0 (0.0%) |
| 18 to 34 Years | 0 (0.0%) | 6 (0.3%) |
| 35 to 64 Years | 82 (1.9%) | 34 (0.7%) |
| 65 to 74 Years | 13 (1.9%) | 24 (2.6%) |
| 75 Years and over | 28 (3.6%) | 112 (10.3%) |
Disability Class: Cognitive Difficulty
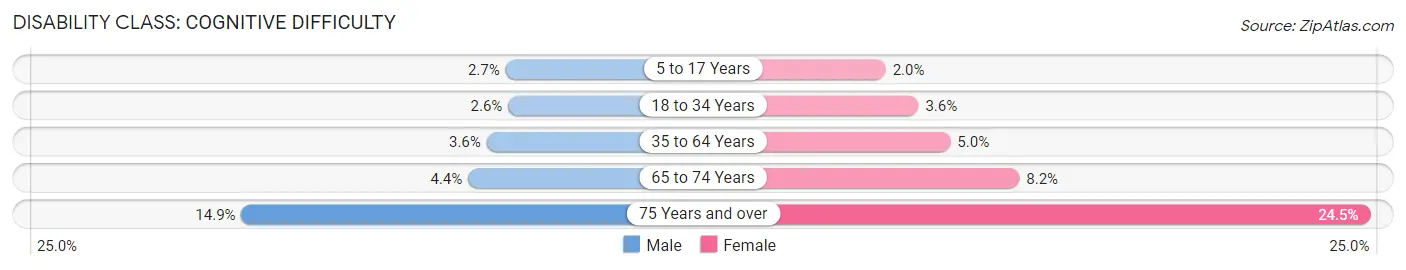
| Age Bracket | Male | Female |
| 5 to 17 Years | 52 (2.7%) | 43 (2.0%) |
| 18 to 34 Years | 48 (2.6%) | 87 (3.6%) |
| 35 to 64 Years | 153 (3.6%) | 249 (5.0%) |
| 65 to 74 Years | 30 (4.4%) | 75 (8.2%) |
| 75 Years and over | 115 (14.9%) | 267 (24.5%) |
Disability Class: Ambulatory Difficulty
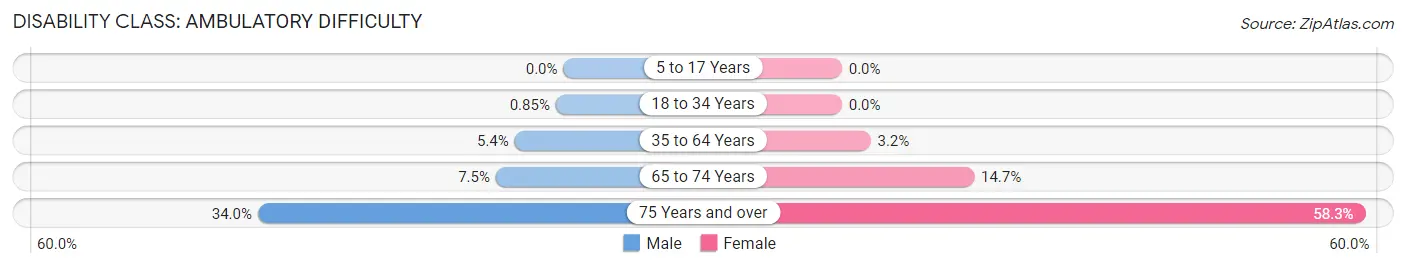
| Age Bracket | Male | Female |
| 5 to 17 Years | 0 (0.0%) | 0 (0.0%) |
| 18 to 34 Years | 16 (0.9%) | 0 (0.0%) |
| 35 to 64 Years | 233 (5.4%) | 158 (3.2%) |
| 65 to 74 Years | 51 (7.5%) | 134 (14.7%) |
| 75 Years and over | 262 (34.0%) | 635 (58.3%) |
Disability Class: Self-Care Difficulty
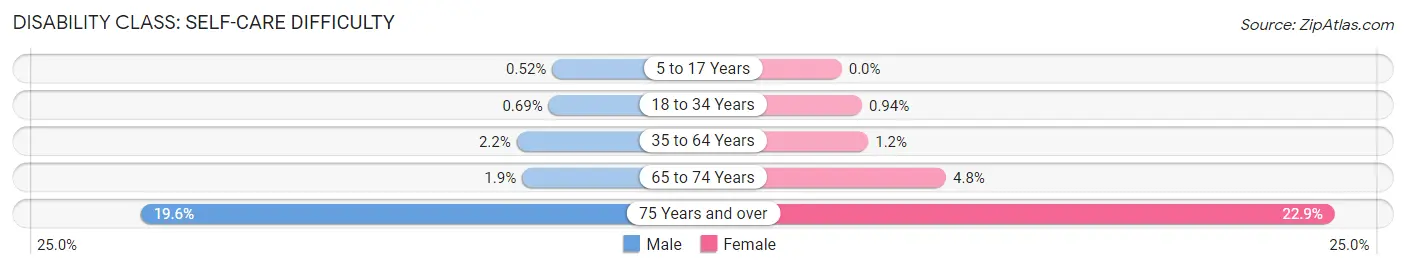
| Age Bracket | Male | Female |
| 5 to 17 Years | 10 (0.5%) | 0 (0.0%) |
| 18 to 34 Years | 13 (0.7%) | 23 (0.9%) |
| 35 to 64 Years | 93 (2.2%) | 61 (1.2%) |
| 65 to 74 Years | 13 (1.9%) | 44 (4.8%) |
| 75 Years and over | 151 (19.6%) | 249 (22.9%) |
Technology Access in Lexington
Computing Device Access in Lexington
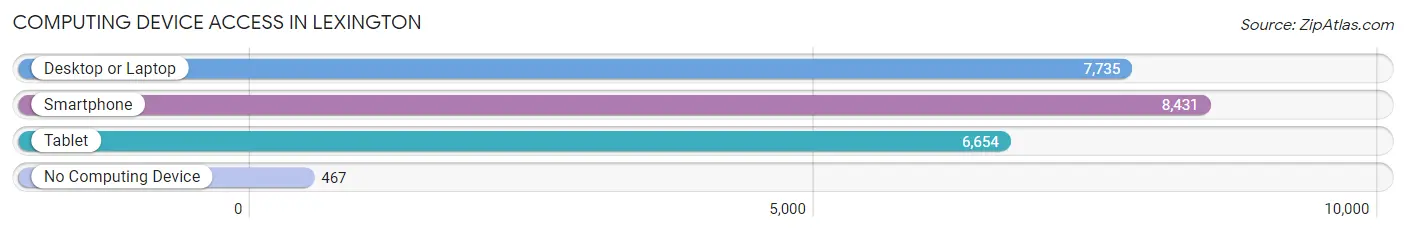
| Device Type | # Households | % Households |
| Desktop or Laptop | 7,735 | 83.4% |
| Smartphone | 8,431 | 90.9% |
| Tablet | 6,654 | 71.8% |
| No Computing Device | 467 | 5.0% |
| Total | 9,274 | 100.0% |
Internet Access in Lexington
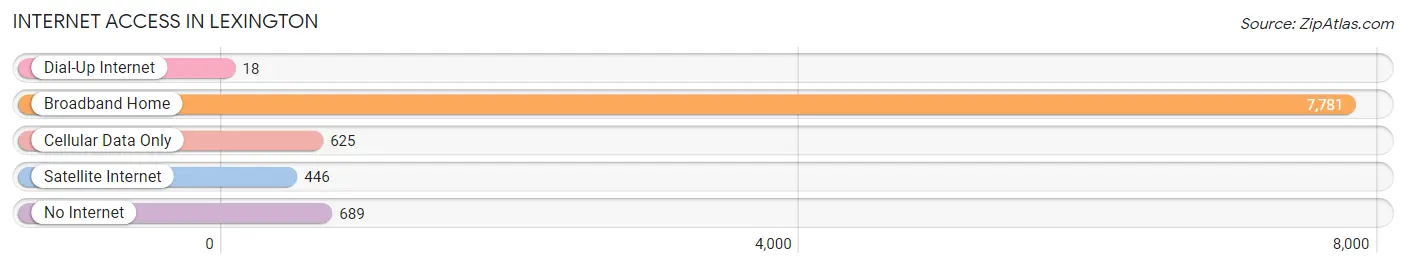
| Internet Type | # Households | % Households |
| Dial-Up Internet | 18 | 0.2% |
| Broadband Home | 7,781 | 83.9% |
| Cellular Data Only | 625 | 6.7% |
| Satellite Internet | 446 | 4.8% |
| No Internet | 689 | 7.4% |
| Total | 9,274 | 100.0% |
Lexington Summary
Lexington, South Carolina is a city located in the Midlands region of the state. It is the county seat of Lexington County and is located approximately 20 miles west of Columbia, the state capital. The city is situated along the Saluda River and is home to a population of approximately 20,000 people.
History
The area that is now Lexington was first settled in 1735 by a group of German and Swiss immigrants. The settlement was originally known as Saxe Gotha, named after the two German states from which the settlers had come. The settlement was incorporated in 1785 and renamed Lexington in honor of the Battle of Lexington, which had taken place in Massachusetts during the American Revolution.
In the 19th century, Lexington became an important center for cotton production and processing. The city was also home to several cotton mills, which provided employment for many of the city’s residents. The city was also home to several Confederate military units during the Civil War.
Geography
Lexington is located in the Midlands region of South Carolina, approximately 20 miles west of Columbia. The city is situated along the Saluda River and is surrounded by several smaller towns and communities. The city is located at an elevation of approximately 300 feet above sea level.
The climate in Lexington is classified as humid subtropical, with hot, humid summers and mild winters. The average annual temperature is around 70 degrees Fahrenheit, with average highs in the summer reaching into the mid-90s and average lows in the winter dipping into the mid-30s.
Economy
The economy of Lexington is largely based on manufacturing and agriculture. The city is home to several manufacturing plants, including a paper mill, a textile mill, and a plastics plant. The city is also home to several agricultural operations, including poultry farms, dairy farms, and vegetable farms.
The city is also home to several retail stores, restaurants, and other businesses. The city is served by several major highways, including Interstate 20 and US Highway 378.
Demographics
As of the 2010 census, the population of Lexington was 20,138. The racial makeup of the city was 79.3% White, 16.2% African American, 0.4% Native American, 1.2% Asian, 0.1% Pacific Islander, 1.3% from other races, and 1.5% from two or more races. Hispanic or Latino of any race were 3.2% of the population.
The median household income in Lexington was $45,837, and the median family income was $54,837. The per capita income for the city was $22,837. About 11.2% of families and 14.2% of the population were below the poverty line, including 19.2% of those under age 18 and 10.2% of those age 65 or over.
The city is served by the Lexington County School District, which includes seven elementary schools, three middle schools, and two high schools. The city is also home to several private schools, including Lexington Christian Academy and Lexington Preparatory Academy.
Common Questions
What is Per Capita Income in Lexington?
Per Capita income in Lexington is $38,796.
What is the Median Family Income in Lexington?
Median Family Income in Lexington is $94,306.
What is the Median Household income in Lexington?
Median Household Income in Lexington is $78,164.
What is Income or Wage Gap in Lexington?
Income or Wage Gap in Lexington is 33.2%.
Women in Lexington earn 66.8 cents for every dollar earned by a man.
What is Inequality or Gini Index in Lexington?
Inequality or Gini Index in Lexington is 0.40.
What is the Total Population of Lexington?
Total Population of Lexington is 23,665.
What is the Total Male Population of Lexington?
Total Male Population of Lexington is 11,445.
What is the Total Female Population of Lexington?
Total Female Population of Lexington is 12,220.
What is the Ratio of Males per 100 Females in Lexington?
There are 93.66 Males per 100 Females in Lexington.
What is the Ratio of Females per 100 Males in Lexington?
There are 106.77 Females per 100 Males in Lexington.
What is the Median Population Age in Lexington?
Median Population Age in Lexington is 38.8 Years.
What is the Average Family Size in Lexington
Average Family Size in Lexington is 3.0 People.
What is the Average Household Size in Lexington
Average Household Size in Lexington is 2.4 People.
How Large is the Labor Force in Lexington?
There are 11,599 People in the Labor Forcein in Lexington.
What is the Percentage of People in the Labor Force in Lexington?
62.4% of People are in the Labor Force in Lexington.
What is the Unemployment Rate in Lexington?
Unemployment Rate in Lexington is 3.6%.