Missouri Map & Demographics
Missouri Map
Missouri Overview
Aug 10, 1821
INCORPORATED
69,702
TOTAL AREA [ SQ MI ]
68,716
LAND AREA [ SQ MI ]
987
WATER AREA [ SQ MI ]
800
ELEVATION AVG [ FT ]
1,772
ELEVATION HIGH [ FT ]
230
ELEVATION LOW [ FT ]
89.6
POP DENSITY [ PPL / SQ MI ]
$36,754
PER CAPITA INCOME
$84,745
AVG FAMILY INCOME
$65,920
AVG HOUSEHOLD INCOME
27.1%
WAGE / INCOME GAP [ % ]
72.9¢/ $1
WAGE / INCOME GAP [ $ ]
$10,558
FAMILY INCOME DEFICIT
0.47
INEQUALITY / GINI INDEX
63376
LARGEST ZIP CODE
Kansas City
LARGEST CITY
St. Louis County
LARGEST COUNTY
6,154,422
TOTAL POPULATION
3,039,220
MALE POPULATION
3,115,202
FEMALE POPULATION
97.56
MALES / 100 FEMALES
102.50
FEMALES / 100 MALES
38.8
MEDIAN AGE
3.1
AVG FAMILY SIZE
2.4
AVG HOUSEHOLD SIZE
3,107,508
LABOR FORCE [ PEOPLE ]
62.9%
PERCENT IN LABOR FORCE
4.3%
UNEMPLOYMENT RATE
Income in Missouri
Income Overview in Missouri
Per Capita Income in Missouri is $36,754, while median incomes of families and households are $84,745 and $65,920 respectively.
| Characteristic | Number | Measure |
| Per Capita Income | 6,154,422 | $36,754 |
| Median Family Income | 1,542,797 | $84,745 |
| Mean Family Income | 1,542,797 | $109,112 |
| Median Household Income | 2,458,324 | $65,920 |
| Mean Household Income | 2,458,324 | $89,952 |
| Income Deficit | 1,542,797 | $10,558 |
| Wage / Income Gap (%) | 6,154,422 | 27.08% |
| Wage / Income Gap ($) | 6,154,422 | 72.92¢ per $1 |
| Gini / Inequality Index | 6,154,422 | 0.47 |
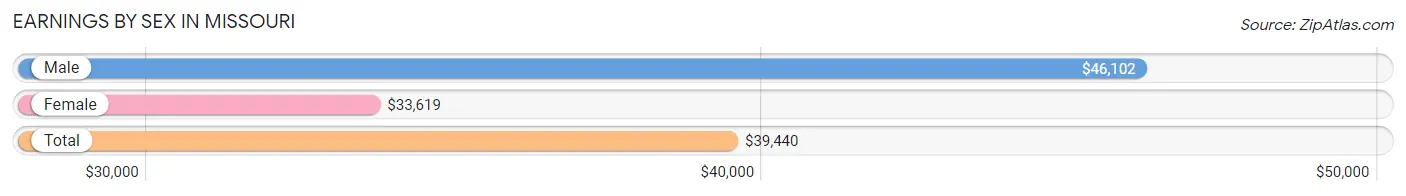
Earnings by Sex in Missouri
Average Earnings in Missouri are $39,440, $46,102 for men and $33,619 for women, a difference of 27.1%.
| Sex | Number | Average Earnings |
| Male | 1,694,146 (51.9%) | $46,102 |
| Female | 1,569,775 (48.1%) | $33,619 |
| Total | 3,263,921 (100.0%) | $39,440 |
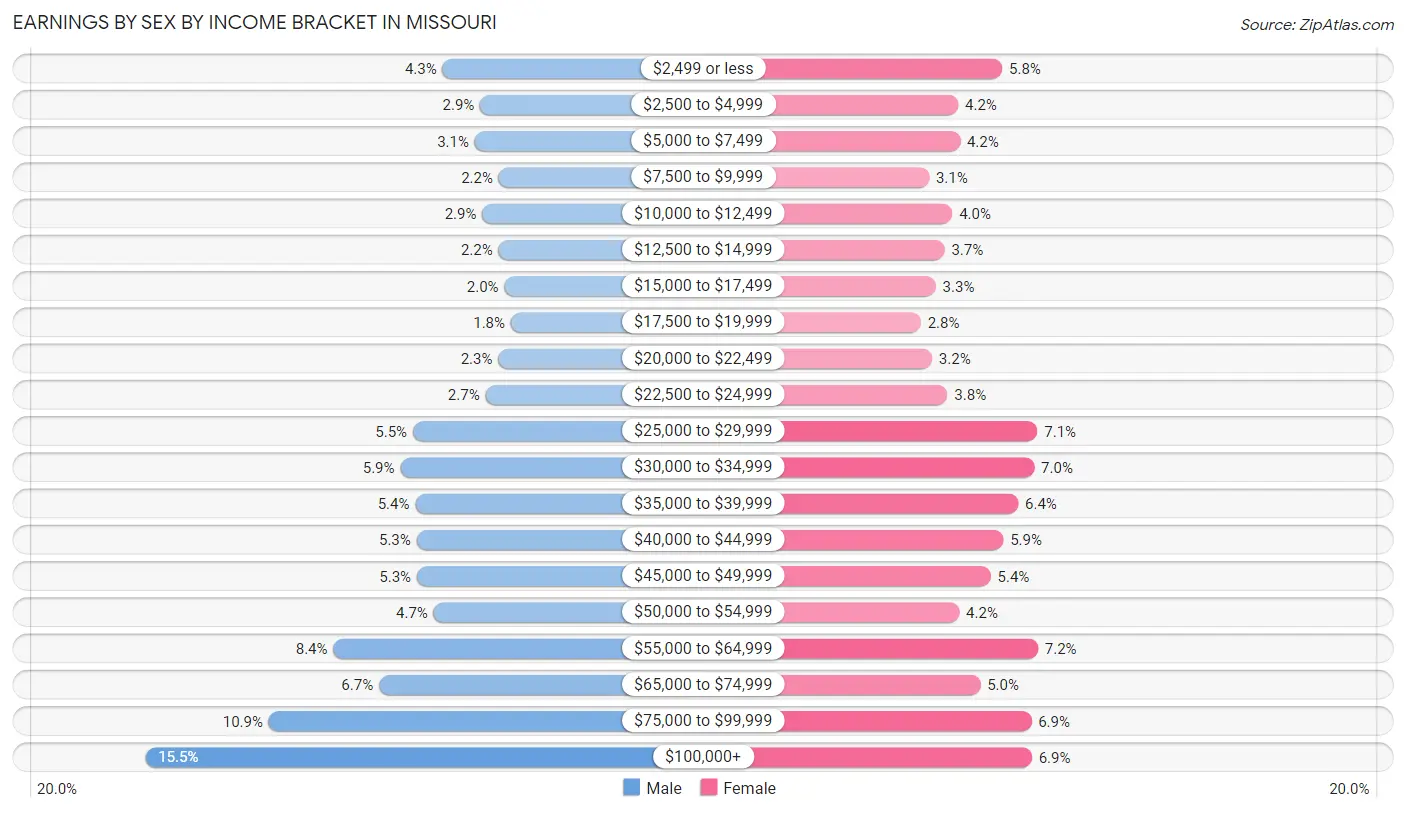
Earnings by Sex by Income Bracket in Missouri
The most common earnings brackets in Missouri are $100,000+ for men (262,258 | 15.5%) and $55,000 to $64,999 for women (112,324 | 7.2%).
| Income | Male | Female |
| $2,499 or less | 73,603 (4.3%) | 91,299 (5.8%) |
| $2,500 to $4,999 | 49,557 (2.9%) | 65,382 (4.2%) |
| $5,000 to $7,499 | 53,088 (3.1%) | 66,517 (4.2%) |
| $7,500 to $9,999 | 37,805 (2.2%) | 48,325 (3.1%) |
| $10,000 to $12,499 | 48,348 (2.9%) | 62,001 (4.0%) |
| $12,500 to $14,999 | 38,025 (2.2%) | 57,420 (3.7%) |
| $15,000 to $17,499 | 34,150 (2.0%) | 52,232 (3.3%) |
| $17,500 to $19,999 | 30,088 (1.8%) | 43,515 (2.8%) |
| $20,000 to $22,499 | 38,062 (2.2%) | 50,038 (3.2%) |
| $22,500 to $24,999 | 46,306 (2.7%) | 59,149 (3.8%) |
| $25,000 to $29,999 | 92,282 (5.4%) | 112,130 (7.1%) |
| $30,000 to $34,999 | 100,211 (5.9%) | 110,276 (7.0%) |
| $35,000 to $39,999 | 90,884 (5.4%) | 100,816 (6.4%) |
| $40,000 to $44,999 | 90,039 (5.3%) | 91,914 (5.9%) |
| $45,000 to $49,999 | 89,838 (5.3%) | 84,566 (5.4%) |
| $50,000 to $54,999 | 79,188 (4.7%) | 66,098 (4.2%) |
| $55,000 to $64,999 | 142,786 (8.4%) | 112,324 (7.2%) |
| $65,000 to $74,999 | 113,850 (6.7%) | 78,443 (5.0%) |
| $75,000 to $99,999 | 183,778 (10.8%) | 108,520 (6.9%) |
| $100,000+ | 262,258 (15.5%) | 108,810 (6.9%) |
| Total | 1,694,146 (100.0%) | 1,569,775 (100.0%) |
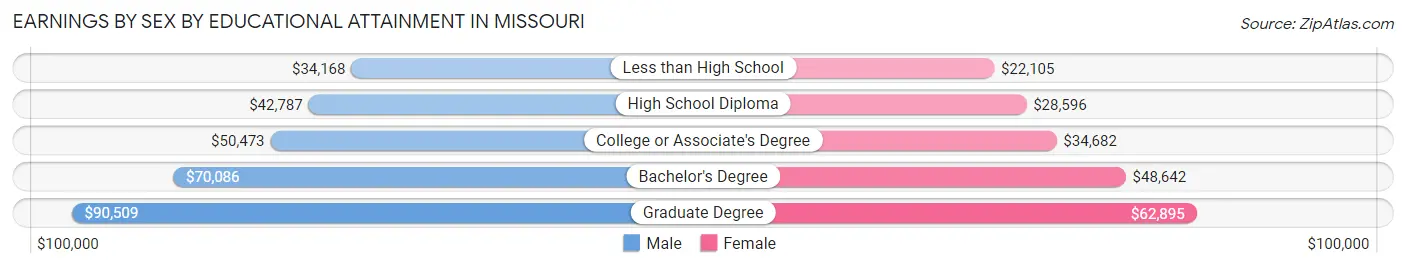
Earnings by Sex by Educational Attainment in Missouri
Average earnings in Missouri are $53,218 for men and $38,582 for women, a difference of 27.5%. Men with an educational attainment of graduate degree enjoy the highest average annual earnings of $90,509, while those with less than high school education earn the least with $34,168. Women with an educational attainment of graduate degree earn the most with the average annual earnings of $62,895, while those with less than high school education have the smallest earnings of $22,105.
| Educational Attainment | Male Income | Female Income |
| Less than High School | $34,168 | $22,105 |
| High School Diploma | $42,787 | $28,596 |
| College or Associate's Degree | $50,473 | $34,682 |
| Bachelor's Degree | $70,086 | $48,642 |
| Graduate Degree | $90,509 | $62,895 |
| Total | $53,218 | $38,582 |
Family Income in Missouri
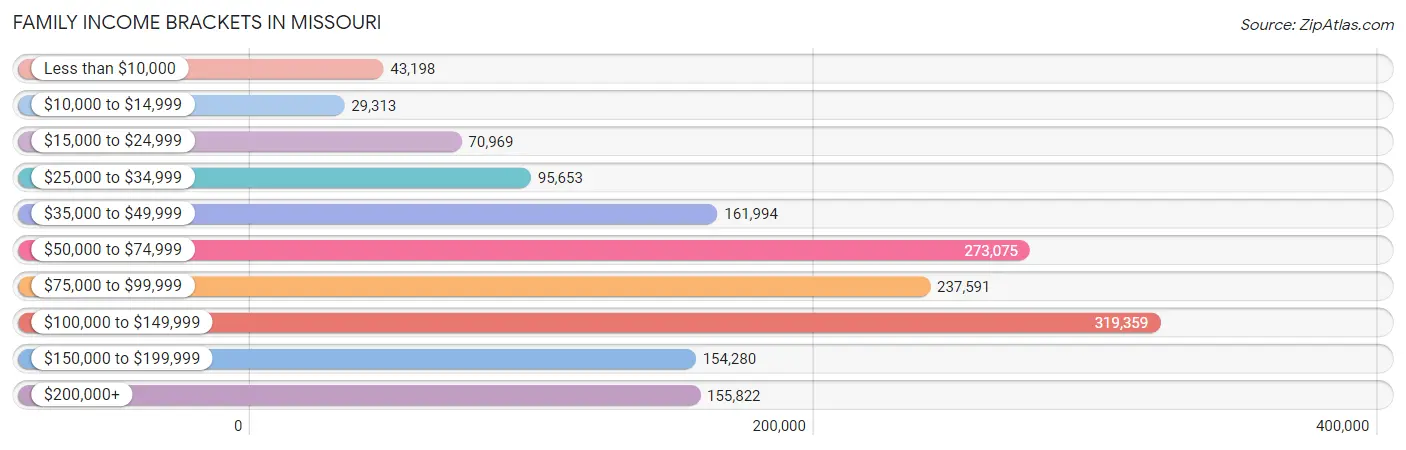
Family Income Brackets in Missouri
According to the Missouri family income data, there are 319,359 families falling into the $100,000 to $149,999 income range, which is the most common income bracket and makes up 20.7% of all families. Conversely, the $10,000 to $14,999 income bracket is the least frequent group with only 29,313 families (1.9%) belonging to this category.
| Income Bracket | # Families | % Families |
| Less than $10,000 | 43,198 | 2.8% |
| $10,000 to $14,999 | 29,313 | 1.9% |
| $15,000 to $24,999 | 70,969 | 4.6% |
| $25,000 to $34,999 | 95,653 | 6.2% |
| $35,000 to $49,999 | 161,994 | 10.5% |
| $50,000 to $74,999 | 273,075 | 17.7% |
| $75,000 to $99,999 | 237,591 | 15.4% |
| $100,000 to $149,999 | 319,359 | 20.7% |
| $150,000 to $199,999 | 154,280 | 10.0% |
| $200,000+ | 155,822 | 10.1% |
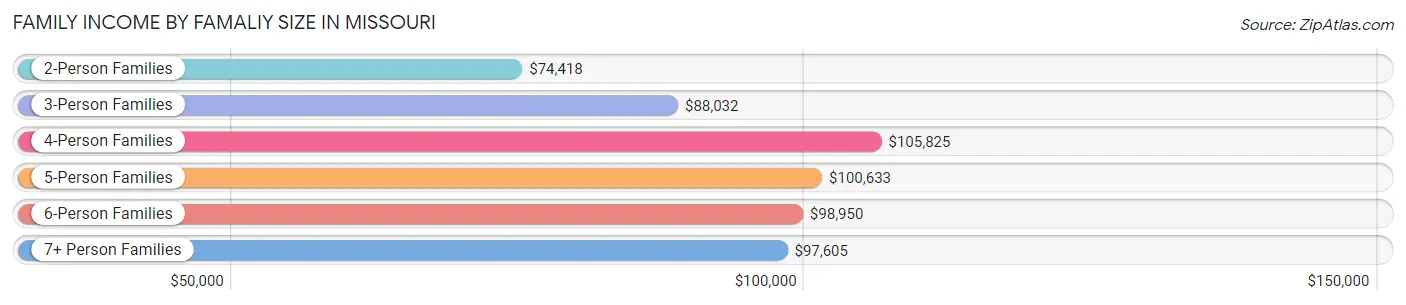
Family Income by Famaliy Size in Missouri
4-person families (264,463 | 17.1%) account for the highest median family income in Missouri with $105,825 per family, while 2-person families (776,509 | 50.3%) have the highest median income of $37,209 per family member.
| Income Bracket | # Families | Median Income |
| 2-Person Families | 776,509 (50.3%) | $74,418 |
| 3-Person Families | 326,959 (21.2%) | $88,032 |
| 4-Person Families | 264,463 (17.1%) | $105,825 |
| 5-Person Families | 112,165 (7.3%) | $100,633 |
| 6-Person Families | 40,651 (2.6%) | $98,950 |
| 7+ Person Families | 22,050 (1.4%) | $97,605 |
| Total | 1,542,797 (100.0%) | $84,745 |
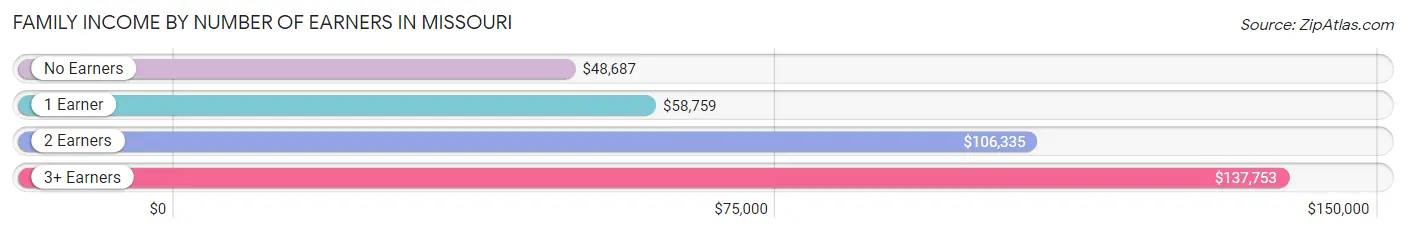
Family Income by Number of Earners in Missouri
The median family income in Missouri is $84,745, with families comprising 3+ earners (162,384) having the highest median family income of $137,753, while families with no earners (241,850) have the lowest median family income of $48,687, accounting for 10.5% and 15.7% of families, respectively.
| Number of Earners | # Families | Median Income |
| No Earners | 241,850 (15.7%) | $48,687 |
| 1 Earner | 482,643 (31.3%) | $58,759 |
| 2 Earners | 655,920 (42.5%) | $106,335 |
| 3+ Earners | 162,384 (10.5%) | $137,753 |
| Total | 1,542,797 (100.0%) | $84,745 |
Household Income in Missouri
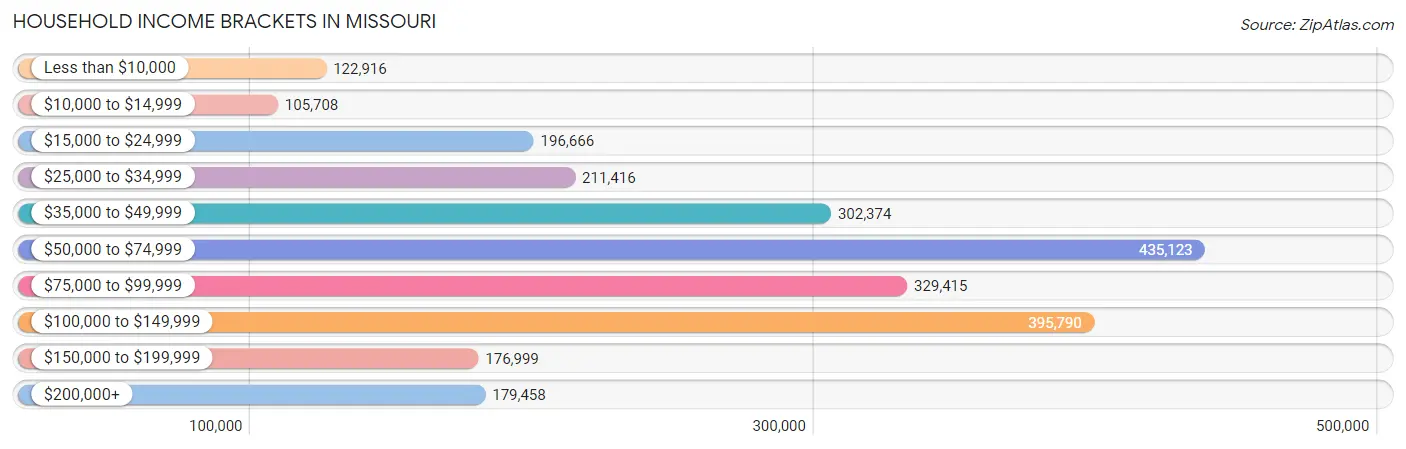
Household Income Brackets in Missouri
With 435,123 households falling in the category, the $50,000 to $74,999 income range is the most frequent in Missouri, accounting for 17.7% of all households. In contrast, only 105,708 households (4.3%) fall into the $10,000 to $14,999 income bracket, making it the least populous group.
| Income Bracket | # Households | % Households |
| Less than $10,000 | 122,916 | 5.0% |
| $10,000 to $14,999 | 105,708 | 4.3% |
| $15,000 to $24,999 | 196,666 | 8.0% |
| $25,000 to $34,999 | 211,416 | 8.6% |
| $35,000 to $49,999 | 302,374 | 12.3% |
| $50,000 to $74,999 | 435,123 | 17.7% |
| $75,000 to $99,999 | 329,415 | 13.4% |
| $100,000 to $149,999 | 395,790 | 16.1% |
| $150,000 to $199,999 | 176,999 | 7.2% |
| $200,000+ | 179,458 | 7.3% |
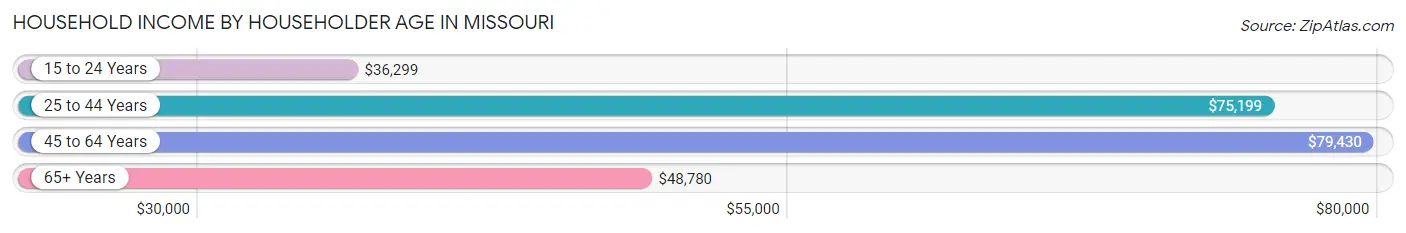
Household Income by Householder Age in Missouri
The median household income in Missouri is $65,920, with the highest median household income of $79,430 found in the 45 to 64 years age bracket for the primary householder. A total of 881,882 households (35.9%) fall into this category. Meanwhile, the 15 to 24 years age bracket for the primary householder has the lowest median household income of $36,299, with 114,139 households (4.6%) in this group.
| Income Bracket | # Households | Median Income |
| 15 to 24 Years | 114,139 (4.6%) | $36,299 |
| 25 to 44 Years | 791,895 (32.2%) | $75,199 |
| 45 to 64 Years | 881,882 (35.9%) | $79,430 |
| 65+ Years | 670,408 (27.3%) | $48,780 |
| Total | 2,458,324 (100.0%) | $65,920 |
Poverty in Missouri
Income Below Poverty by Sex and Age in Missouri
With 11.7% poverty level for males and 14.0% for females among the residents of Missouri, 18 to 24 year old males and 18 to 24 year old females are the most vulnerable to poverty, with 48,451 males (18.4%) and 59,171 females (23.5%) in their respective age groups living below the poverty level.
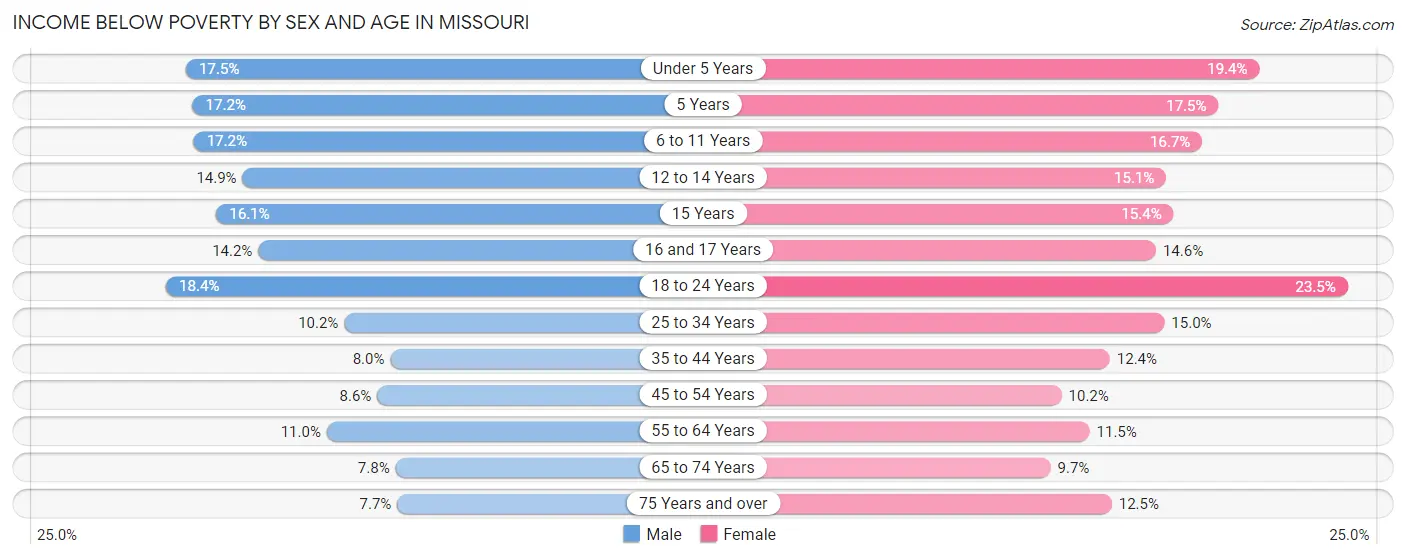
| Age Bracket | Male | Female |
| Under 5 Years | 31,660 (17.5%) | 33,162 (19.4%) |
| 5 Years | 6,451 (17.2%) | 6,279 (17.5%) |
| 6 to 11 Years | 39,572 (17.2%) | 36,208 (16.7%) |
| 12 to 14 Years | 17,720 (14.9%) | 17,396 (15.0%) |
| 15 Years | 6,617 (16.1%) | 5,865 (15.4%) |
| 16 and 17 Years | 11,436 (14.2%) | 11,366 (14.6%) |
| 18 to 24 Years | 48,451 (18.4%) | 59,171 (23.5%) |
| 25 to 34 Years | 40,346 (10.2%) | 60,112 (15.0%) |
| 35 to 44 Years | 30,325 (8.0%) | 47,432 (12.4%) |
| 45 to 54 Years | 30,944 (8.6%) | 37,188 (10.2%) |
| 55 to 64 Years | 43,476 (11.0%) | 47,900 (11.5%) |
| 65 to 74 Years | 22,377 (7.8%) | 31,483 (9.7%) |
| 75 Years and over | 13,241 (7.7%) | 30,404 (12.5%) |
| Total | 342,616 (11.7%) | 423,966 (14.0%) |
Income Above Poverty by Sex and Age in Missouri
According to the poverty statistics in Missouri, males aged 75 years and over and females aged 65 to 74 years are the age groups that are most secure financially, with 92.3% of males and 90.3% of females in these age groups living above the poverty line.
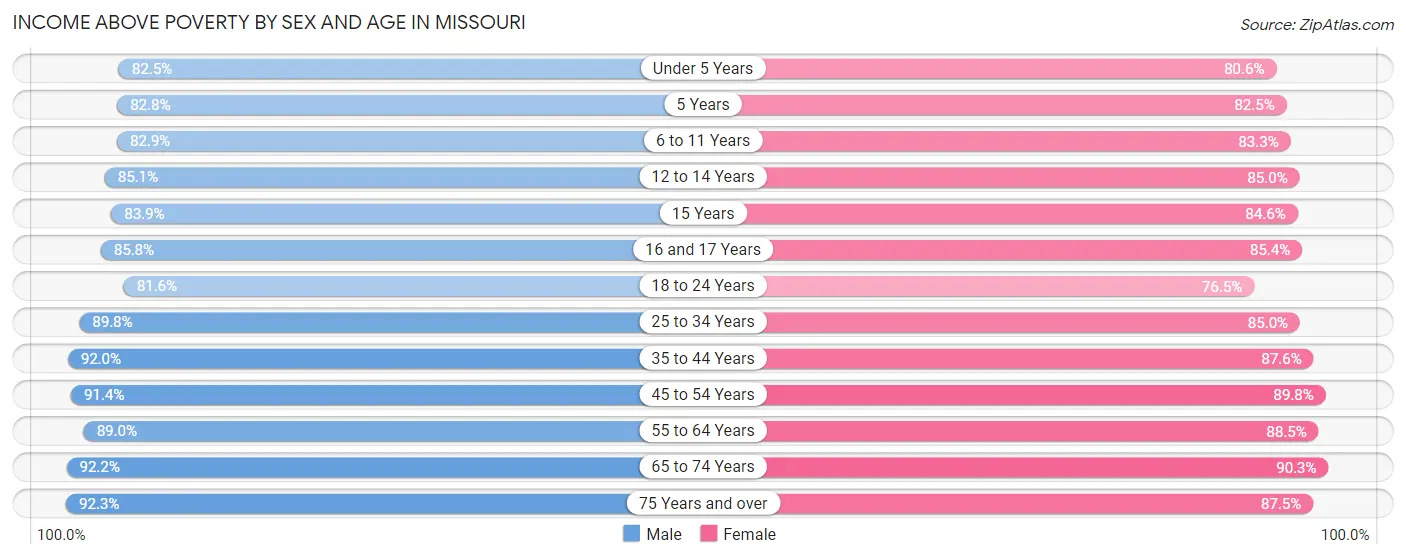
| Age Bracket | Male | Female |
| Under 5 Years | 149,144 (82.5%) | 138,051 (80.6%) |
| 5 Years | 31,049 (82.8%) | 29,665 (82.5%) |
| 6 to 11 Years | 191,221 (82.9%) | 180,306 (83.3%) |
| 12 to 14 Years | 101,304 (85.1%) | 98,211 (85.0%) |
| 15 Years | 34,472 (83.9%) | 32,233 (84.6%) |
| 16 and 17 Years | 69,334 (85.8%) | 66,601 (85.4%) |
| 18 to 24 Years | 214,464 (81.6%) | 192,992 (76.5%) |
| 25 to 34 Years | 356,297 (89.8%) | 341,406 (85.0%) |
| 35 to 44 Years | 347,524 (92.0%) | 333,937 (87.6%) |
| 45 to 54 Years | 327,228 (91.4%) | 327,299 (89.8%) |
| 55 to 64 Years | 352,529 (89.0%) | 368,600 (88.5%) |
| 65 to 74 Years | 264,738 (92.2%) | 293,579 (90.3%) |
| 75 Years and over | 158,418 (92.3%) | 212,256 (87.5%) |
| Total | 2,597,722 (88.3%) | 2,615,136 (86.1%) |
Income Below Poverty Among Married-Couple Families in Missouri
The poverty statistics for married-couple families in Missouri show that 4.2% or 48,196 of the total 1,159,320 families live below the poverty line. Families with 5 or more children have the highest poverty rate of 24.2%, comprising of 2,352 families. On the other hand, families with no children have the lowest poverty rate of 3.3%, which includes 23,473 families.
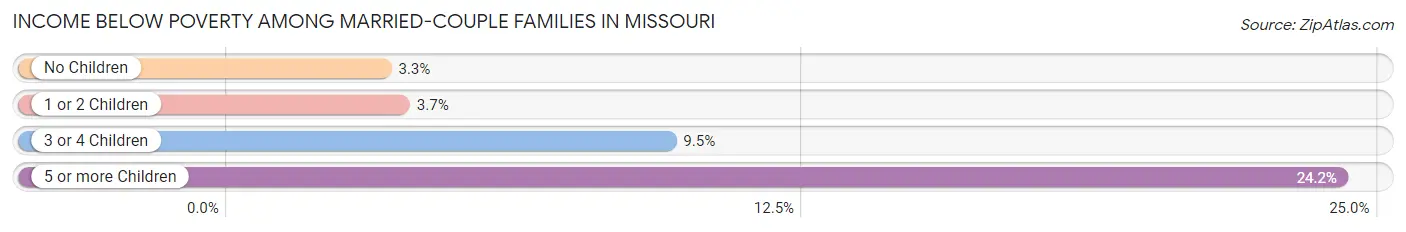
| Children | Above Poverty | Below Poverty |
| No Children | 679,329 (96.7%) | 23,473 (3.3%) |
| 1 or 2 Children | 336,365 (96.3%) | 13,083 (3.7%) |
| 3 or 4 Children | 88,051 (90.5%) | 9,288 (9.5%) |
| 5 or more Children | 7,379 (75.8%) | 2,352 (24.2%) |
| Total | 1,111,124 (95.8%) | 48,196 (4.2%) |
Income Below Poverty Among Single-Parent Households in Missouri
According to the poverty data in Missouri, 13.1% or 14,601 single-father households and 25.1% or 68,223 single-mother households are living below the poverty line. Among single-father households, those with 5 or more children have the highest poverty rate, with 412 households (54.9%) experiencing poverty. Likewise, among single-mother households, those with 5 or more children have the highest poverty rate, with 2,032 households (72.0%) falling below the poverty line.
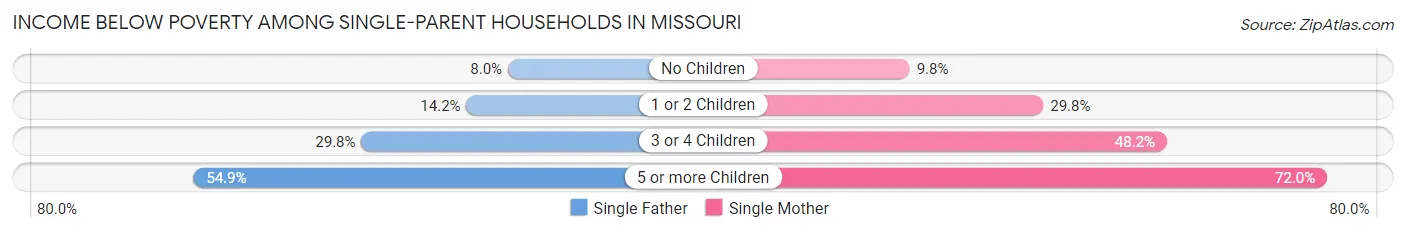
| Children | Single Father | Single Mother |
| No Children | 3,671 (8.0%) | 9,620 (9.8%) |
| 1 or 2 Children | 7,911 (14.2%) | 42,043 (29.7%) |
| 3 or 4 Children | 2,607 (29.8%) | 14,528 (48.2%) |
| 5 or more Children | 412 (54.9%) | 2,032 (72.0%) |
| Total | 14,601 (13.1%) | 68,223 (25.1%) |
Income Below Poverty Among Married-Couple vs Single-Parent Households in Missouri
The poverty data for Missouri shows that 48,196 of the married-couple family households (4.2%) and 82,824 of the single-parent households (21.6%) are living below the poverty level. Within the married-couple family households, those with 5 or more children have the highest poverty rate, with 2,352 households (24.2%) falling below the poverty line. Among the single-parent households, those with 5 or more children have the highest poverty rate, with 2,444 household (68.4%) living below poverty.
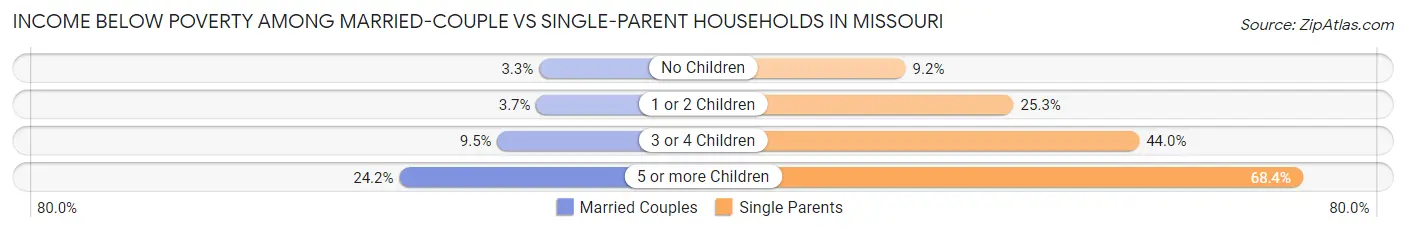
| Children | Married-Couple Families | Single-Parent Households |
| No Children | 23,473 (3.3%) | 13,291 (9.2%) |
| 1 or 2 Children | 13,083 (3.7%) | 49,954 (25.3%) |
| 3 or 4 Children | 9,288 (9.5%) | 17,135 (44.0%) |
| 5 or more Children | 2,352 (24.2%) | 2,444 (68.4%) |
| Total | 48,196 (4.2%) | 82,824 (21.6%) |
Largest Zip Codes by Population in Missouri
The largest zip codes in Missouri by population are 63376 (74,967), 65203 (59,673), 63021 (55,944), 65807 (55,384), and 63366 (52,746).
1.63376
74,967 (1.22%)
2.65203
59,673 (0.97%)
3.63021
55,944 (0.91%)
4.65807
55,384 (0.90%)
5.63366
52,746 (0.86%)
6.63129
51,893 (0.84%)
7.63301
51,401 (0.84%)
8.63031
50,568 (0.82%)
9.63123
50,347 (0.82%)
10.65201
48,537 (0.79%)
11.63385
48,535 (0.79%)
12.65202
47,776 (0.78%)
13.63303
47,285 (0.77%)
14.65802
46,532 (0.76%)
15.63368
46,124 (0.75%)
16.63026
44,824 (0.73%)
17.65803
42,975 (0.70%)
18.64118
42,897 (0.70%)
19.63304
42,738 (0.69%)
20.63017
42,686 (0.69%)
21.63136
42,385 (0.69%)
22.63116
41,821 (0.68%)
23.63122
41,416 (0.67%)
24.63033
41,037 (0.67%)
25.65109
40,191 (0.65%)
26.65804
39,032 (0.63%)
27.63701
37,821 (0.61%)
28.64133
37,442 (0.61%)
29.64068
37,237 (0.61%)
30.64804
37,043 (0.60%)
Largest Cities by Population in Missouri
The largest cities in Missouri by population are Kansas City (505,958), St Louis (298,018), Springfield (168,873), Columbia (126,172), and Independence (122,218).
505,958 (8.22%)
2.St Louis
298,018 (4.84%)
168,873 (2.74%)
4.Columbia
126,172 (2.05%)
122,218 (1.99%)
101,728 (1.65%)
7.O Fallon
91,825 (1.49%)
72,198 (1.17%)
70,687 (1.15%)
10.Blue Springs
58,720 (0.95%)
11.St Peters
57,692 (0.94%)
12.Florissant
52,167 (0.85%)
13.Joplin
51,848 (0.84%)
14.Chesterfield
49,645 (0.81%)
15.Wentzville
44,584 (0.72%)
42,644 (0.69%)
39,795 (0.65%)
18.Oakville
35,412 (0.58%)
19.Wildwood
35,276 (0.57%)
34,850 (0.57%)
21.Ballwin
30,948 (0.50%)
22.Liberty
30,299 (0.49%)
23.Raytown
29,772 (0.48%)
24.Kirkwood
29,309 (0.48%)
25.Mehlville
29,089 (0.47%)
28,099 (0.46%)
27.Gladstone
26,964 (0.44%)
28.Grandview
25,921 (0.42%)
29.Hazelwood
25,345 (0.41%)
30.Belton
24,241 (0.39%)
Largest Counties by Population in Missouri
The largest counties in Missouri by population are St. Louis County (999,703), Jackson County (715,526), St. Charles County (406,262), Greene County (299,188), and St. Louis city (298,018).
999,703 (16.24%)
715,526 (11.63%)
406,262 (6.60%)
299,188 (4.86%)
298,018 (4.84%)
253,085 (4.11%)
226,984 (3.69%)
184,043 (2.99%)
122,788 (2.00%)
10.Cass County
108,205 (1.76%)
107,033 (1.74%)
104,858 (1.70%)
89,568 (1.46%)
84,544 (1.37%)
81,703 (1.33%)
16.Cole County
76,890 (1.25%)
66,814 (1.09%)
60,172 (0.98%)
59,019 (0.96%)
20.Taney County
56,202 (0.91%)
54,025 (0.88%)
53,726 (0.87%)
44,843 (0.73%)
44,517 (0.72%)
43,227 (0.70%)
43,059 (0.70%)
42,280 (0.69%)
39,960 (0.65%)
39,265 (0.64%)
38,231 (0.62%)
Race in Missouri
The most populous races in Missouri are White / Caucasian (4,884,165 | 79.4%), Black / African American (693,892 | 11.3%), and Two or more Races (331,228 | 5.4%).
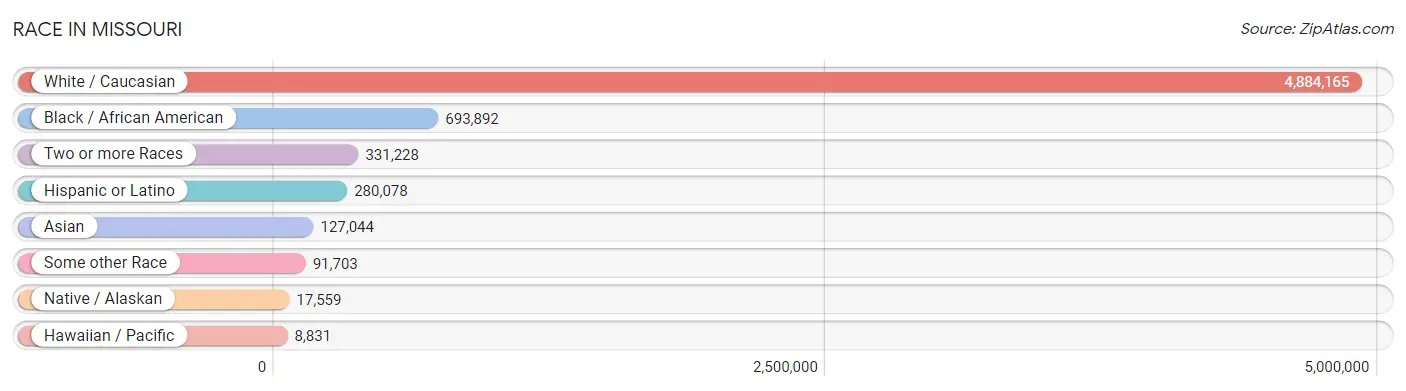
| Race | # Population | % Population |
| Asian | 127,044 | 2.1% |
| Black / African American | 693,892 | 11.3% |
| Hawaiian / Pacific | 8,831 | 0.1% |
| Hispanic or Latino | 280,078 | 4.5% |
| Native / Alaskan | 17,559 | 0.3% |
| White / Caucasian | 4,884,165 | 79.4% |
| Two or more Races | 331,228 | 5.4% |
| Some other Race | 91,703 | 1.5% |
| Total | 6,154,422 | 100.0% |
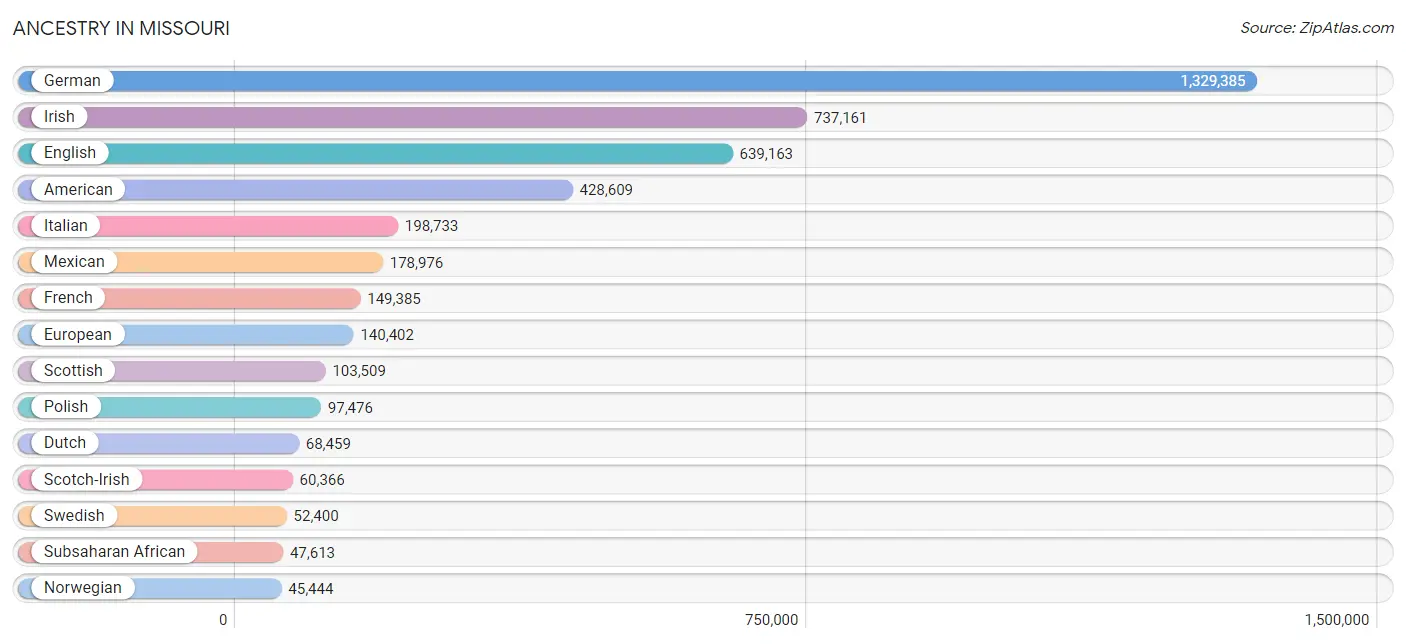
Ancestry in Missouri
The most populous ancestries reported in Missouri are German (1,329,385 | 21.6%), Irish (737,161 | 12.0%), English (639,163 | 10.4%), American (428,609 | 7.0%), and Italian (198,733 | 3.2%), together accounting for 54.2% of all Missouri residents.
| Ancestry | # Population | % Population |
| Afghan | 946 | 0.0% |
| African | 24,132 | 0.4% |
| Alaska Native | 62 | 0.0% |
| Alaskan Athabascan | 40 | 0.0% |
| Albanian | 2,108 | 0.0% |
| Aleut | 59 | 0.0% |
| Alsatian | 198 | 0.0% |
| American | 428,609 | 7.0% |
| Apache | 1,363 | 0.0% |
| Arab | 23,627 | 0.4% |
| Arapaho | 54 | 0.0% |
| Argentinean | 894 | 0.0% |
| Armenian | 1,915 | 0.0% |
| Assyrian / Chaldean / Syriac | 44 | 0.0% |
| Australian | 1,499 | 0.0% |
| Austrian | 10,521 | 0.2% |
| Bahamian | 239 | 0.0% |
| Bangladeshi | 1,437 | 0.0% |
| Barbadian | 112 | 0.0% |
| Basque | 144 | 0.0% |
| Belgian | 5,393 | 0.1% |
| Belizean | 377 | 0.0% |
| Bermudan | 27 | 0.0% |
| Bhutanese | 10,659 | 0.2% |
| Blackfeet | 5,285 | 0.1% |
| Bolivian | 516 | 0.0% |
| Brazilian | 2,108 | 0.0% |
| British | 30,414 | 0.5% |
| British West Indian | 310 | 0.0% |
| Bulgarian | 2,061 | 0.0% |
| Burmese | 16,768 | 0.3% |
| Cajun | 594 | 0.0% |
| Cambodian | 153 | 0.0% |
| Canadian | 5,459 | 0.1% |
| Cape Verdean | 28 | 0.0% |
| Carpatho Rusyn | 26 | 0.0% |
| Celtic | 644 | 0.0% |
| Central American | 30,710 | 0.5% |
| Central American Indian | 2,106 | 0.0% |
| Cherokee | 33,584 | 0.5% |
| Cheyenne | 336 | 0.0% |
| Chickasaw | 833 | 0.0% |
| Chilean | 1,325 | 0.0% |
| Chinese | 184 | 0.0% |
| Chippewa | 1,102 | 0.0% |
| Choctaw | 4,273 | 0.1% |
| Colombian | 5,567 | 0.1% |
| Colville | 13 | 0.0% |
| Comanche | 416 | 0.0% |
| Costa Rican | 1,150 | 0.0% |
| Cree | 165 | 0.0% |
| Creek | 1,247 | 0.0% |
| Croatian | 9,489 | 0.2% |
| Crow | 287 | 0.0% |
| Cuban | 7,762 | 0.1% |
| Cypriot | 10 | 0.0% |
| Czech | 23,389 | 0.4% |
| Czechoslovakian | 4,611 | 0.1% |
| Danish | 15,800 | 0.3% |
| Delaware | 283 | 0.0% |
| Dominican | 2,207 | 0.0% |
| Dutch | 68,459 | 1.1% |
| Dutch West Indian | 523 | 0.0% |
| Eastern European | 12,202 | 0.2% |
| Ecuadorian | 1,283 | 0.0% |
| Egyptian | 2,034 | 0.0% |
| English | 639,163 | 10.4% |
| Estonian | 137 | 0.0% |
| Ethiopian | 3,163 | 0.1% |
| European | 140,402 | 2.3% |
| Fijian | 168 | 0.0% |
| Filipino | 2,563 | 0.0% |
| Finnish | 4,660 | 0.1% |
| French | 149,385 | 2.4% |
| French American Indian | 700 | 0.0% |
| French Canadian | 11,751 | 0.2% |
| German | 1,329,385 | 21.6% |
| German Russian | 394 | 0.0% |
| Ghanaian | 1,681 | 0.0% |
| Greek | 13,037 | 0.2% |
| Guamanian / Chamorro | 1,334 | 0.0% |
| Guatemalan | 11,745 | 0.2% |
| Guyanese | 109 | 0.0% |
| Haitian | 2,697 | 0.0% |
| Hmong | 38 | 0.0% |
| Honduran | 6,689 | 0.1% |
| Hopi | 107 | 0.0% |
| Houma | 6 | 0.0% |
| Hungarian | 13,016 | 0.2% |
| Icelander | 384 | 0.0% |
| Indian (Asian) | 33,796 | 0.5% |
| Indonesian | 1,767 | 0.0% |
| Inupiat | 119 | 0.0% |
| Iranian | 2,748 | 0.0% |
| Iraqi | 2,695 | 0.0% |
| Irish | 737,161 | 12.0% |
| Iroquois | 1,306 | 0.0% |
| Israeli | 1,210 | 0.0% |
| Italian | 198,733 | 3.2% |
| Jamaican | 4,208 | 0.1% |
| Japanese | 2,374 | 0.0% |
| Jordanian | 752 | 0.0% |
| Kenyan | 3,136 | 0.1% |
| Kiowa | 153 | 0.0% |
| Korean | 26,401 | 0.4% |
| Laotian | 678 | 0.0% |
| Latvian | 758 | 0.0% |
| Lebanese | 5,940 | 0.1% |
| Liberian | 801 | 0.0% |
| Lithuanian | 6,214 | 0.1% |
| Lumbee | 134 | 0.0% |
| Luxembourger | 803 | 0.0% |
| Macedonian | 312 | 0.0% |
| Malaysian | 1,186 | 0.0% |
| Maltese | 217 | 0.0% |
| Marshallese | 277 | 0.0% |
| Menominee | 36 | 0.0% |
| Mexican | 178,976 | 2.9% |
| Mexican American Indian | 2,285 | 0.0% |
| Mongolian | 523 | 0.0% |
| Moroccan | 1,037 | 0.0% |
| Native Hawaiian | 4,375 | 0.1% |
| Navajo | 1,118 | 0.0% |
| New Zealander | 379 | 0.0% |
| Nicaraguan | 1,605 | 0.0% |
| Nigerian | 6,478 | 0.1% |
| Northern European | 8,158 | 0.1% |
| Norwegian | 45,444 | 0.7% |
| Okinawan | 23 | 0.0% |
| Osage | 1,022 | 0.0% |
| Ottawa | 328 | 0.0% |
| Paiute | 147 | 0.0% |
| Pakistani | 3,828 | 0.1% |
| Palestinian | 2,289 | 0.0% |
| Panamanian | 1,409 | 0.0% |
| Paraguayan | 149 | 0.0% |
| Pennsylvania German | 2,333 | 0.0% |
| Peruvian | 2,293 | 0.0% |
| Pima | 27 | 0.0% |
| Polish | 97,476 | 1.6% |
| Portuguese | 5,745 | 0.1% |
| Potawatomi | 738 | 0.0% |
| Pueblo | 169 | 0.0% |
| Puerto Rican | 20,820 | 0.3% |
| Puget Sound Salish | 38 | 0.0% |
| Romanian | 5,134 | 0.1% |
| Russian | 23,029 | 0.4% |
| Salvadoran | 8,003 | 0.1% |
| Samoan | 4,269 | 0.1% |
| Scandinavian | 17,988 | 0.3% |
| Scotch-Irish | 60,366 | 1.0% |
| Scottish | 103,509 | 1.7% |
| Seminole | 467 | 0.0% |
| Senegalese | 285 | 0.0% |
| Serbian | 1,996 | 0.0% |
| Shoshone | 169 | 0.0% |
| Sierra Leonean | 467 | 0.0% |
| Sioux | 2,694 | 0.0% |
| Slavic | 1,748 | 0.0% |
| Slovak | 4,141 | 0.1% |
| Slovene | 1,518 | 0.0% |
| Somali | 2,594 | 0.0% |
| South African | 548 | 0.0% |
| South American | 14,642 | 0.2% |
| South American Indian | 343 | 0.0% |
| Soviet Union | 9 | 0.0% |
| Spaniard | 6,977 | 0.1% |
| Spanish | 7,202 | 0.1% |
| Spanish American | 73 | 0.0% |
| Sri Lankan | 19,563 | 0.3% |
| Subsaharan African | 47,613 | 0.8% |
| Sudanese | 665 | 0.0% |
| Swedish | 52,400 | 0.9% |
| Swiss | 21,710 | 0.4% |
| Syrian | 2,654 | 0.0% |
| Taiwanese | 20 | 0.0% |
| Thai | 38,578 | 0.6% |
| Tlingit-Haida | 41 | 0.0% |
| Tohono O'Odham | 32 | 0.0% |
| Tongan | 66 | 0.0% |
| Trinidadian and Tobagonian | 654 | 0.0% |
| Turkish | 2,108 | 0.0% |
| U.S. Virgin Islander | 21 | 0.0% |
| Ugandan | 423 | 0.0% |
| Ukrainian | 8,751 | 0.1% |
| Uruguayan | 179 | 0.0% |
| Ute | 158 | 0.0% |
| Venezuelan | 2,366 | 0.0% |
| Vietnamese | 671 | 0.0% |
| Welsh | 34,952 | 0.6% |
| West Indian | 685 | 0.0% |
| Yaqui | 228 | 0.0% |
| Yugoslavian | 12,570 | 0.2% |
| Yuman | 1 | 0.0% |
| Yup'ik | 39 | 0.0% |
| Zimbabwean | 99 | 0.0% | View All 196 Rows |
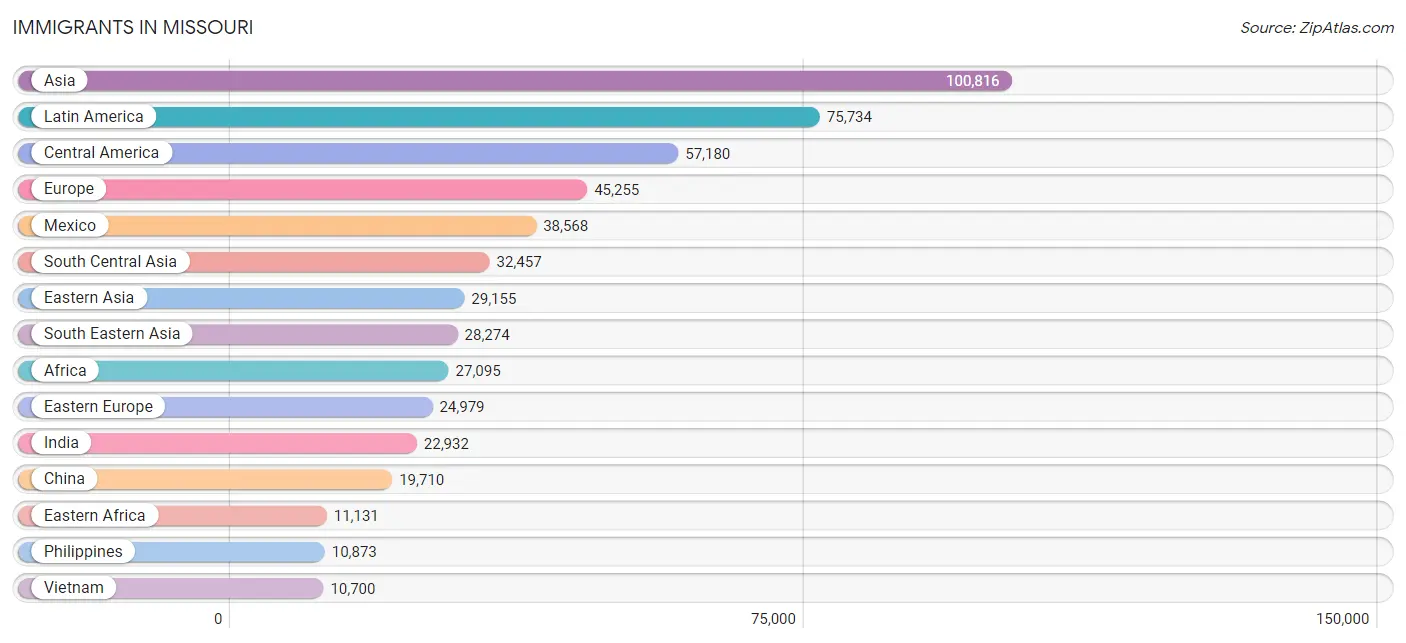
Immigrants in Missouri
The most numerous immigrant groups reported in Missouri came from Asia (100,816 | 1.6%), Latin America (75,734 | 1.2%), Central America (57,180 | 0.9%), Europe (45,255 | 0.7%), and Mexico (38,568 | 0.6%), together accounting for 5.2% of all Missouri residents.
| Immigration Origin | # Population | % Population |
| Afghanistan | 930 | 0.0% |
| Africa | 27,095 | 0.4% |
| Albania | 1,155 | 0.0% |
| Argentina | 664 | 0.0% |
| Armenia | 49 | 0.0% |
| Asia | 100,816 | 1.6% |
| Australia | 983 | 0.0% |
| Austria | 404 | 0.0% |
| Azores | 27 | 0.0% |
| Bahamas | 260 | 0.0% |
| Bangladesh | 1,194 | 0.0% |
| Barbados | 21 | 0.0% |
| Belarus | 852 | 0.0% |
| Belgium | 213 | 0.0% |
| Belize | 247 | 0.0% |
| Bolivia | 397 | 0.0% |
| Bosnia and Herzegovina | 8,168 | 0.1% |
| Brazil | 1,861 | 0.0% |
| Bulgaria | 1,414 | 0.0% |
| Cambodia | 764 | 0.0% |
| Cameroon | 255 | 0.0% |
| Canada | 4,806 | 0.1% |
| Caribbean | 8,389 | 0.1% |
| Central America | 57,180 | 0.9% |
| Chile | 500 | 0.0% |
| China | 19,710 | 0.3% |
| Colombia | 2,988 | 0.1% |
| Congo | 657 | 0.0% |
| Costa Rica | 567 | 0.0% |
| Croatia | 719 | 0.0% |
| Cuba | 2,867 | 0.1% |
| Czechoslovakia | 415 | 0.0% |
| Denmark | 148 | 0.0% |
| Dominica | 30 | 0.0% |
| Dominican Republic | 832 | 0.0% |
| Eastern Africa | 11,131 | 0.2% |
| Eastern Asia | 29,155 | 0.5% |
| Eastern Europe | 24,979 | 0.4% |
| Ecuador | 614 | 0.0% |
| Egypt | 1,143 | 0.0% |
| El Salvador | 3,926 | 0.1% |
| England | 2,796 | 0.1% |
| Eritrea | 498 | 0.0% |
| Ethiopia | 2,751 | 0.0% |
| Europe | 45,255 | 0.7% |
| Fiji | 66 | 0.0% |
| France | 1,205 | 0.0% |
| Germany | 7,803 | 0.1% |
| Ghana | 1,245 | 0.0% |
| Greece | 516 | 0.0% |
| Grenada | 39 | 0.0% |
| Guatemala | 7,146 | 0.1% |
| Guyana | 124 | 0.0% |
| Haiti | 1,107 | 0.0% |
| Honduras | 5,346 | 0.1% |
| Hong Kong | 781 | 0.0% |
| Hungary | 472 | 0.0% |
| India | 22,932 | 0.4% |
| Indonesia | 494 | 0.0% |
| Iran | 1,625 | 0.0% |
| Iraq | 3,509 | 0.1% |
| Ireland | 455 | 0.0% |
| Israel | 727 | 0.0% |
| Italy | 1,681 | 0.0% |
| Jamaica | 2,341 | 0.0% |
| Japan | 1,818 | 0.0% |
| Jordan | 1,113 | 0.0% |
| Kazakhstan | 186 | 0.0% |
| Kenya | 4,518 | 0.1% |
| Korea | 7,525 | 0.1% |
| Kuwait | 406 | 0.0% |
| Laos | 877 | 0.0% |
| Latin America | 75,734 | 1.2% |
| Latvia | 76 | 0.0% |
| Lebanon | 242 | 0.0% |
| Liberia | 923 | 0.0% |
| Lithuania | 123 | 0.0% |
| Malaysia | 582 | 0.0% |
| Mexico | 38,568 | 0.6% |
| Micronesia | 2,263 | 0.0% |
| Middle Africa | 2,836 | 0.1% |
| Moldova | 447 | 0.0% |
| Morocco | 634 | 0.0% |
| Nepal | 1,214 | 0.0% |
| Netherlands | 472 | 0.0% |
| Nicaragua | 637 | 0.0% |
| Nigeria | 3,640 | 0.1% |
| North Macedonia | 121 | 0.0% |
| Northern Africa | 3,242 | 0.1% |
| Northern Europe | 6,498 | 0.1% |
| Norway | 80 | 0.0% |
| Oceania | 4,433 | 0.1% |
| Pakistan | 3,209 | 0.1% |
| Panama | 683 | 0.0% |
| Peru | 1,247 | 0.0% |
| Philippines | 10,873 | 0.2% |
| Poland | 1,253 | 0.0% |
| Portugal | 99 | 0.0% |
| Romania | 1,481 | 0.0% |
| Russia | 3,767 | 0.1% |
| Saudi Arabia | 1,233 | 0.0% |
| Scotland | 551 | 0.0% |
| Senegal | 239 | 0.0% |
| Serbia | 326 | 0.0% |
| Sierra Leone | 329 | 0.0% |
| Singapore | 140 | 0.0% |
| Somalia | 1,699 | 0.0% |
| South Africa | 1,043 | 0.0% |
| South America | 10,165 | 0.2% |
| South Central Asia | 32,457 | 0.5% |
| South Eastern Asia | 28,274 | 0.5% |
| Southern Europe | 3,158 | 0.1% |
| Spain | 826 | 0.0% |
| Sri Lanka | 361 | 0.0% |
| St. Vincent and the Grenadines | 10 | 0.0% |
| Sudan | 772 | 0.0% |
| Sweden | 259 | 0.0% |
| Switzerland | 234 | 0.0% |
| Syria | 1,478 | 0.0% |
| Taiwan | 1,927 | 0.0% |
| Thailand | 2,597 | 0.0% |
| Trinidad and Tobago | 689 | 0.0% |
| Turkey | 911 | 0.0% |
| Uganda | 390 | 0.0% |
| Ukraine | 2,895 | 0.1% |
| Uruguay | 88 | 0.0% |
| Uzbekistan | 227 | 0.0% |
| Venezuela | 1,519 | 0.0% |
| Vietnam | 10,700 | 0.2% |
| West Indies | 10 | 0.0% |
| Western Africa | 7,191 | 0.1% |
| Western Asia | 10,266 | 0.2% |
| Western Europe | 10,331 | 0.2% |
| Yemen | 99 | 0.0% |
| Zaire | 1,850 | 0.0% |
| Zimbabwe | 409 | 0.0% | View All 136 Rows |
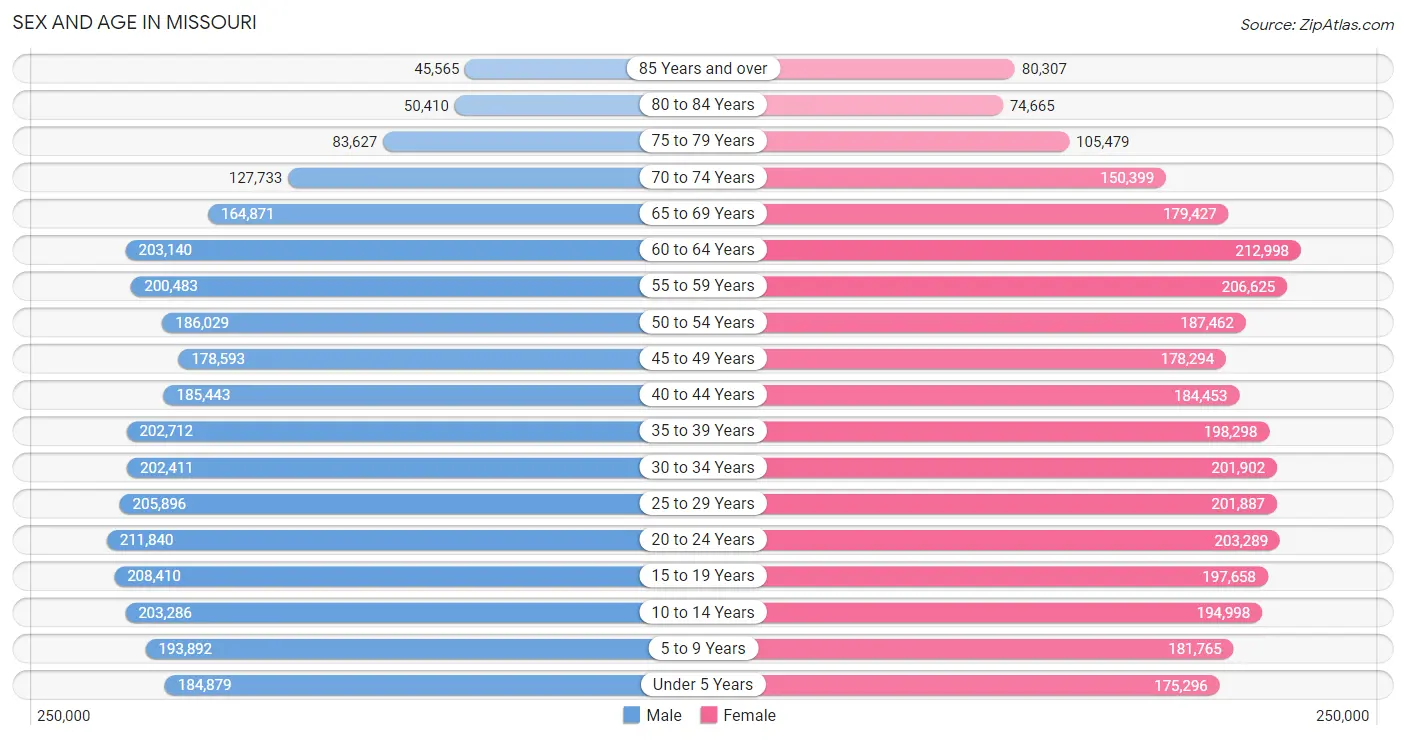
Sex and Age in Missouri
Sex and Age in Missouri
The most populous age groups in Missouri are 20 to 24 Years (211,840 | 7.0%) for men and 60 to 64 Years (212,998 | 6.8%) for women.
| Age Bracket | Male | Female |
| Under 5 Years | 184,879 (6.1%) | 175,296 (5.6%) |
| 5 to 9 Years | 193,892 (6.4%) | 181,765 (5.8%) |
| 10 to 14 Years | 203,286 (6.7%) | 194,998 (6.3%) |
| 15 to 19 Years | 208,410 (6.9%) | 197,658 (6.3%) |
| 20 to 24 Years | 211,840 (7.0%) | 203,289 (6.5%) |
| 25 to 29 Years | 205,896 (6.8%) | 201,887 (6.5%) |
| 30 to 34 Years | 202,411 (6.7%) | 201,902 (6.5%) |
| 35 to 39 Years | 202,712 (6.7%) | 198,298 (6.4%) |
| 40 to 44 Years | 185,443 (6.1%) | 184,453 (5.9%) |
| 45 to 49 Years | 178,593 (5.9%) | 178,294 (5.7%) |
| 50 to 54 Years | 186,029 (6.1%) | 187,462 (6.0%) |
| 55 to 59 Years | 200,483 (6.6%) | 206,625 (6.6%) |
| 60 to 64 Years | 203,140 (6.7%) | 212,998 (6.8%) |
| 65 to 69 Years | 164,871 (5.4%) | 179,427 (5.8%) |
| 70 to 74 Years | 127,733 (4.2%) | 150,399 (4.8%) |
| 75 to 79 Years | 83,627 (2.8%) | 105,479 (3.4%) |
| 80 to 84 Years | 50,410 (1.7%) | 74,665 (2.4%) |
| 85 Years and over | 45,565 (1.5%) | 80,307 (2.6%) |
| Total | 3,039,220 (100.0%) | 3,115,202 (100.0%) |
Families and Households in Missouri
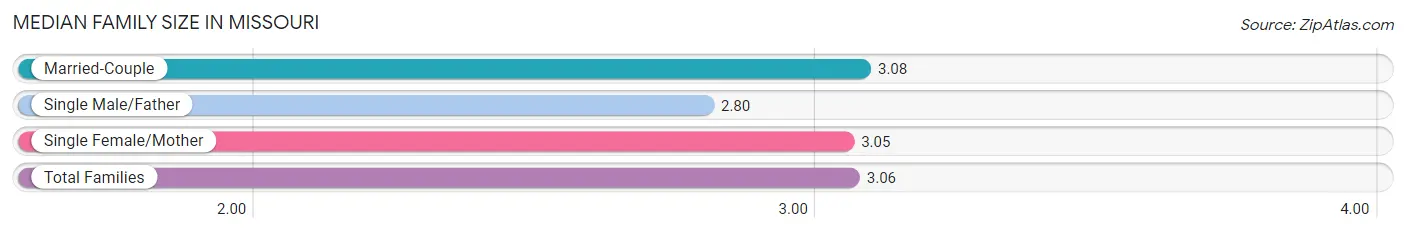
Median Family Size in Missouri
The median family size in Missouri is 3.06 persons per family, with married-couple families (1,159,320 | 75.1%) accounting for the largest median family size of 3.08 persons per family. On the other hand, single male/father families (111,331 | 7.2%) represent the smallest median family size with 2.80 persons per family.
| Family Type | # Families | Family Size |
| Married-Couple | 1,159,320 (75.1%) | 3.08 |
| Single Male/Father | 111,331 (7.2%) | 2.80 |
| Single Female/Mother | 272,146 (17.6%) | 3.05 |
| Total Families | 1,542,797 (100.0%) | 3.06 |
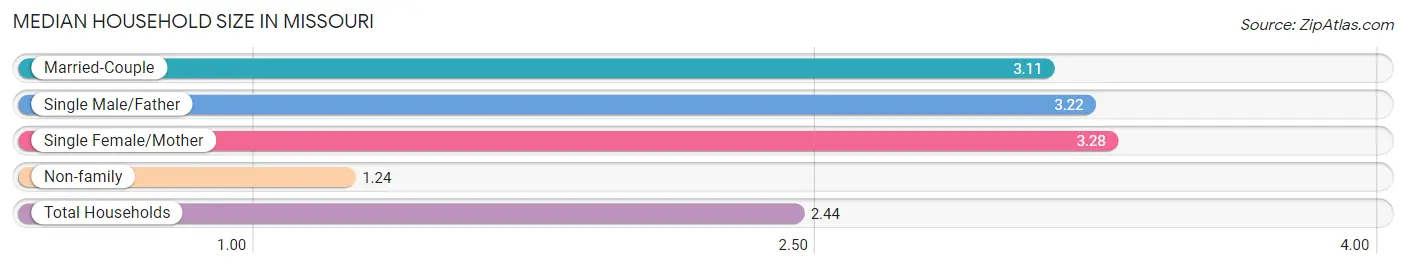
Median Household Size in Missouri
The median household size in Missouri is 2.44 persons per household, with single female/mother households (272,146 | 11.1%) accounting for the largest median household size of 3.28 persons per household. non-family households (915,527 | 37.2%) represent the smallest median household size with 1.24 persons per household.
| Household Type | # Households | Household Size |
| Married-Couple | 1,159,320 (47.2%) | 3.11 |
| Single Male/Father | 111,331 (4.5%) | 3.22 |
| Single Female/Mother | 272,146 (11.1%) | 3.28 |
| Non-family | 915,527 (37.2%) | 1.24 |
| Total Households | 2,458,324 (100.0%) | 2.44 |
Household Size by Marriage Status in Missouri
Out of a total of 2,458,324 households in Missouri, 1,542,797 (62.8%) are family households, while 915,527 (37.2%) are nonfamily households. The most numerous type of family households are 2-person households, comprising 730,481, and the most common type of nonfamily households are 1-person households, comprising 751,010.
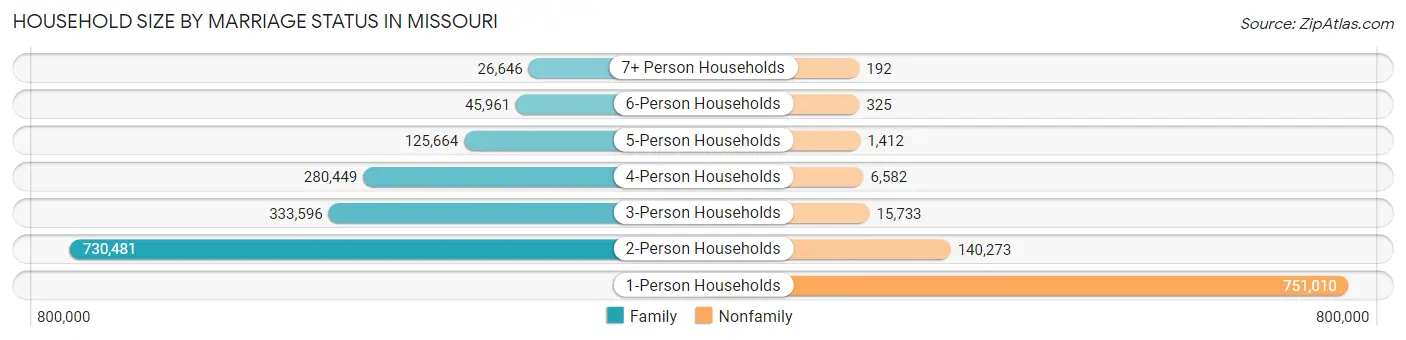
| Household Size | Family Households | Nonfamily Households |
| 1-Person Households | - | 751,010 (30.5%) |
| 2-Person Households | 730,481 (29.7%) | 140,273 (5.7%) |
| 3-Person Households | 333,596 (13.6%) | 15,733 (0.6%) |
| 4-Person Households | 280,449 (11.4%) | 6,582 (0.3%) |
| 5-Person Households | 125,664 (5.1%) | 1,412 (0.1%) |
| 6-Person Households | 45,961 (1.9%) | 325 (0.0%) |
| 7+ Person Households | 26,646 (1.1%) | 192 (0.0%) |
| Total | 1,542,797 (62.8%) | 915,527 (37.2%) |
Female Fertility in Missouri
Fertility by Age in Missouri
Average fertility rate in Missouri is 55.0 births per 1,000 women. Women in the age bracket of 20 to 34 years have the highest fertility rate with 95.0 births per 1,000 women. Women in the age bracket of 20 to 34 years acount for 75.2% of all women with births.
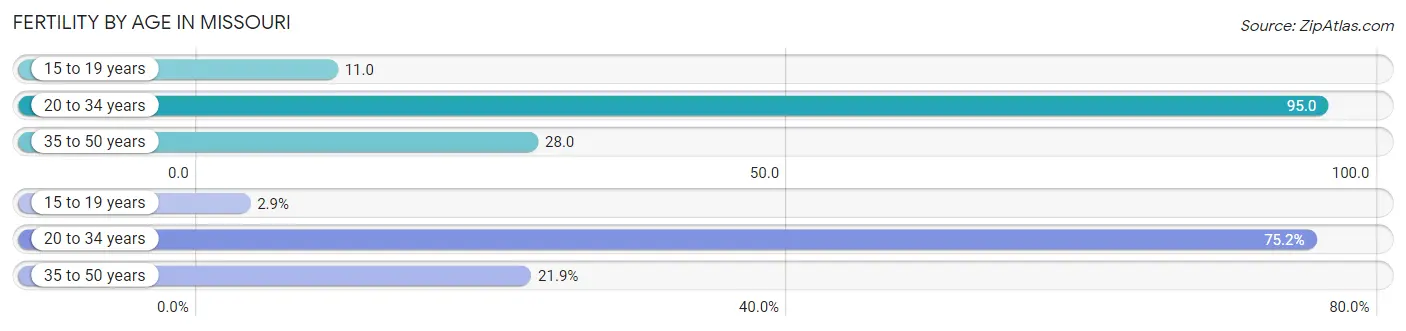
| Age Bracket | Women with Births | Births / 1,000 Women |
| 15 to 19 years | 2,191 (2.9%) | 11.0 |
| 20 to 34 years | 57,576 (75.2%) | 95.0 |
| 35 to 50 years | 16,784 (21.9%) | 28.0 |
| Total | 76,551 (100.0%) | 55.0 |
Fertility by Age by Marriage Status in Missouri
69.8% of women with births (76,551) in Missouri are married. The highest percentage of unmarried women with births falls into 15 to 19 years age bracket with 93.7% of them unmarried at the time of birth, while the lowest percentage of unmarried women with births belong to 35 to 50 years age bracket with 19.2% of them unmarried.
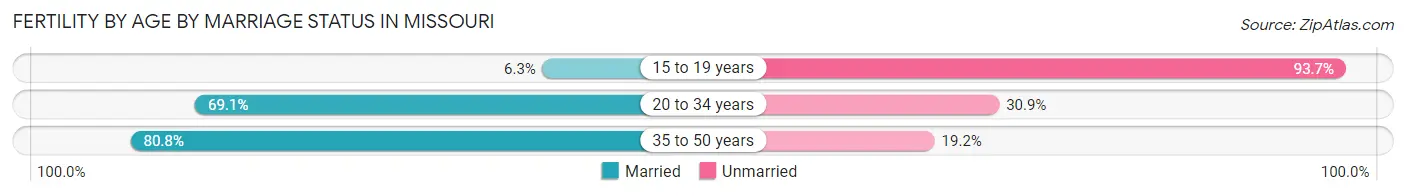
| Age Bracket | Married | Unmarried |
| 15 to 19 years | 138 (6.3%) | 2,053 (93.7%) |
| 20 to 34 years | 39,785 (69.1%) | 17,791 (30.9%) |
| 35 to 50 years | 13,561 (80.8%) | 3,223 (19.2%) |
| Total | 53,433 (69.8%) | 23,118 (30.2%) |
Fertility by Education in Missouri
Average fertility rate in Missouri is 55.0 births per 1,000 women. Women with the education attainment of bachelor's degree have the highest fertility rate of 62.0 births per 1,000 women, while women with the education attainment of less than high school have the lowest fertility at 35.0 births per 1,000 women. Women with the education attainment of college or associate's degree represent 31.9% of all women with births.
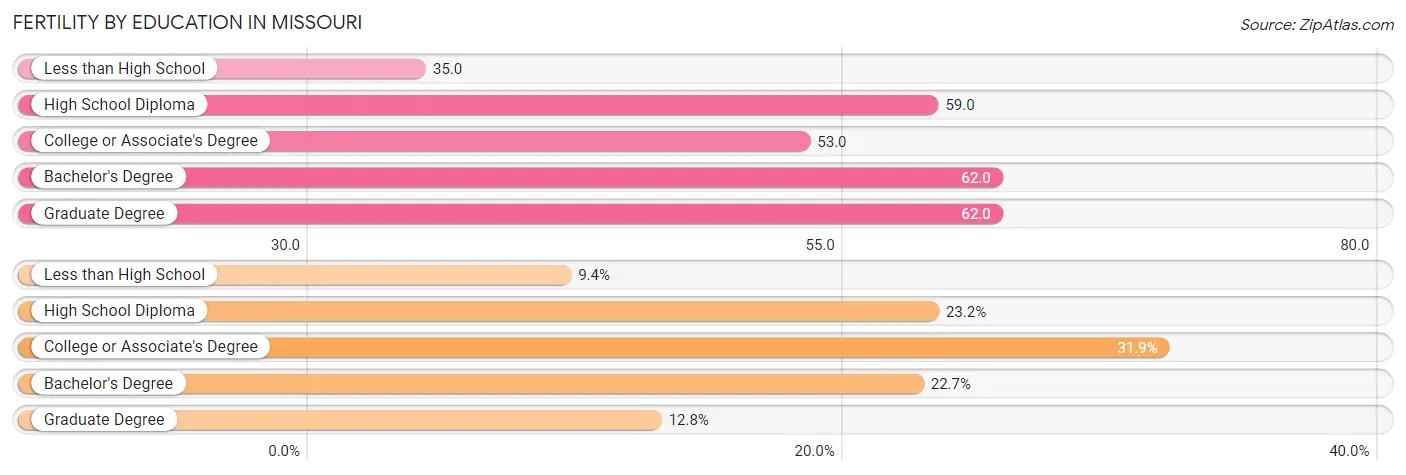
| Educational Attainment | Women with Births | Births / 1,000 Women |
| Less than High School | 7,224 (9.4%) | 35.0 |
| High School Diploma | 17,777 (23.2%) | 59.0 |
| College or Associate's Degree | 24,390 (31.9%) | 53.0 |
| Bachelor's Degree | 17,337 (22.7%) | 62.0 |
| Graduate Degree | 9,823 (12.8%) | 62.0 |
| Total | 76,551 (100.0%) | 55.0 |
Fertility by Education by Marriage Status in Missouri
30.2% of women with births in Missouri are unmarried. Women with the educational attainment of graduate degree are most likely to be married with 94.6% of them married at childbirth, while women with the educational attainment of high school diploma are least likely to be married with 50.3% of them unmarried at childbirth.
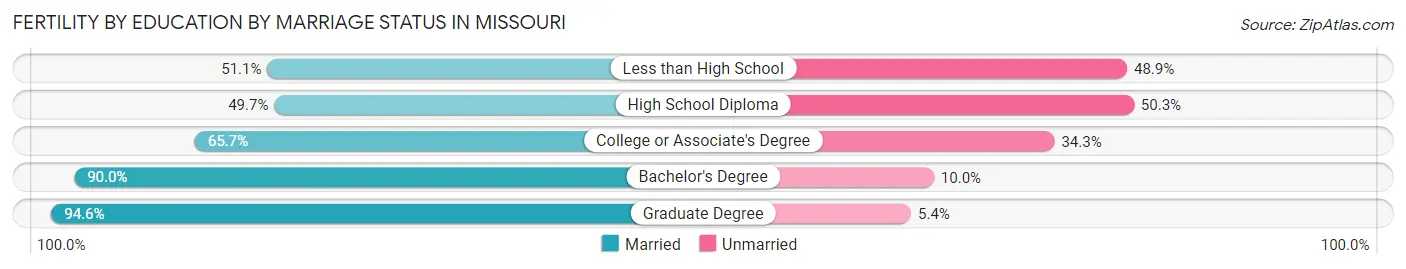
| Educational Attainment | Married | Unmarried |
| Less than High School | 3,691 (51.1%) | 3,533 (48.9%) |
| High School Diploma | 8,835 (49.7%) | 8,942 (50.3%) |
| College or Associate's Degree | 16,024 (65.7%) | 8,366 (34.3%) |
| Bachelor's Degree | 15,603 (90.0%) | 1,734 (10.0%) |
| Graduate Degree | 9,293 (94.6%) | 530 (5.4%) |
| Total | 53,433 (69.8%) | 23,118 (30.2%) |
Employment Characteristics in Missouri
Employment by Class of Employer in Missouri
Among the 2,920,193 employed individuals in Missouri, private company employees (1,976,078 | 67.7%), not-for-profit organizations (297,313 | 10.2%), and local government employees (182,812 | 6.3%) make up the most common classes of employment.
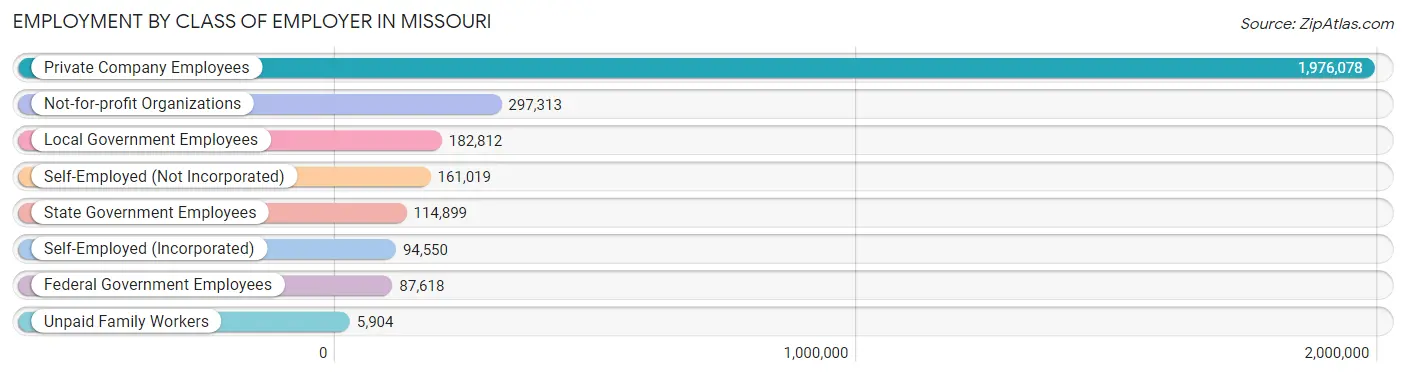
| Employer Class | # Employees | % Employees |
| Private Company Employees | 1,976,078 | 67.7% |
| Self-Employed (Incorporated) | 94,550 | 3.2% |
| Self-Employed (Not Incorporated) | 161,019 | 5.5% |
| Not-for-profit Organizations | 297,313 | 10.2% |
| Local Government Employees | 182,812 | 6.3% |
| State Government Employees | 114,899 | 3.9% |
| Federal Government Employees | 87,618 | 3.0% |
| Unpaid Family Workers | 5,904 | 0.2% |
| Total | 2,920,193 | 100.0% |
Employment Status by Age in Missouri
According to the labor force statistics for Missouri, out of the total population over 16 years of age (4,940,395), 62.9% or 3,107,508 individuals are in the labor force, with 4.3% or 133,623 of them unemployed. The age group with the highest labor force participation rate is 25 to 29 years, with 85.4% or 348,247 individuals in the labor force. Within the labor force, the 16 to 19 years age range has the highest percentage of unemployed individuals, with 11.6% or 16,950 of them being unemployed.
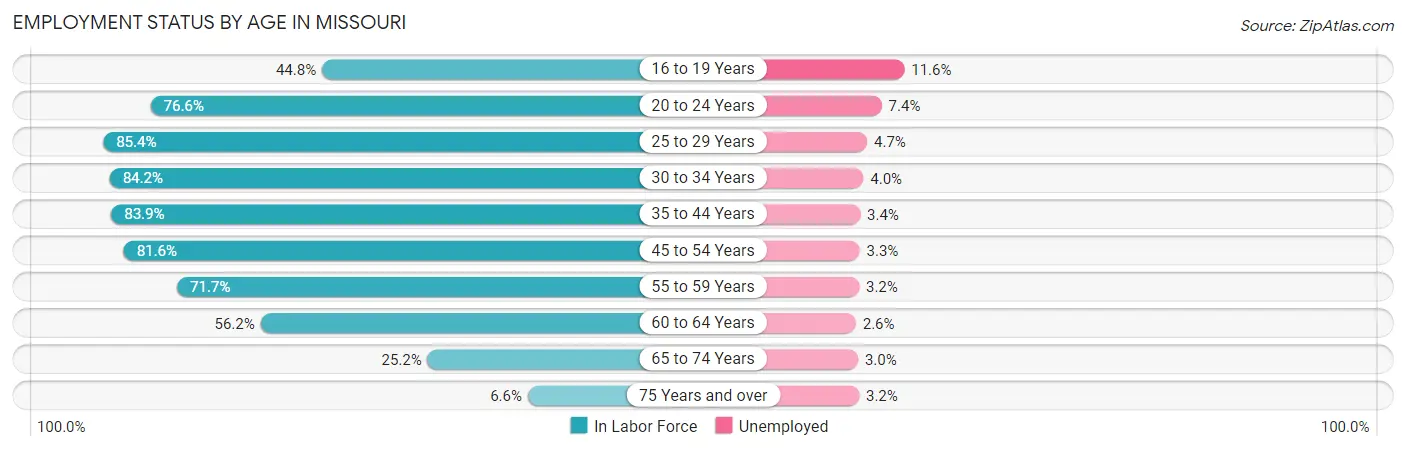
| Age Bracket | In Labor Force | Unemployed |
| 16 to 19 Years | 146,118 (44.8%) | 16,950 (11.6%) |
| 20 to 24 Years | 317,989 (76.6%) | 23,531 (7.4%) |
| 25 to 29 Years | 348,247 (85.4%) | 16,368 (4.7%) |
| 30 to 34 Years | 340,432 (84.2%) | 13,617 (4.0%) |
| 35 to 44 Years | 646,790 (83.9%) | 21,991 (3.4%) |
| 45 to 54 Years | 595,988 (81.6%) | 19,668 (3.3%) |
| 55 to 59 Years | 291,896 (71.7%) | 9,341 (3.2%) |
| 60 to 64 Years | 233,870 (56.2%) | 6,081 (2.6%) |
| 65 to 74 Years | 156,852 (25.2%) | 4,706 (3.0%) |
| 75 Years and over | 29,043 (6.6%) | 929 (3.2%) |
| Total | 3,107,508 (62.9%) | 133,623 (4.3%) |
Employment Status by Educational Attainment in Missouri
According to labor force statistics for Missouri, 78.3% of individuals (2,455,978) out of the total population between 25 and 64 years of age (3,136,626) are in the labor force, with 3.6% or 88,415 of them being unemployed. The group with the highest labor force participation rate are those with the educational attainment of bachelor's degree or higher, with 88.2% or 917,970 individuals in the labor force. Within the labor force, individuals with less than high school education have the highest percentage of unemployment, with 9.0% or 12,269 of them being unemployed.
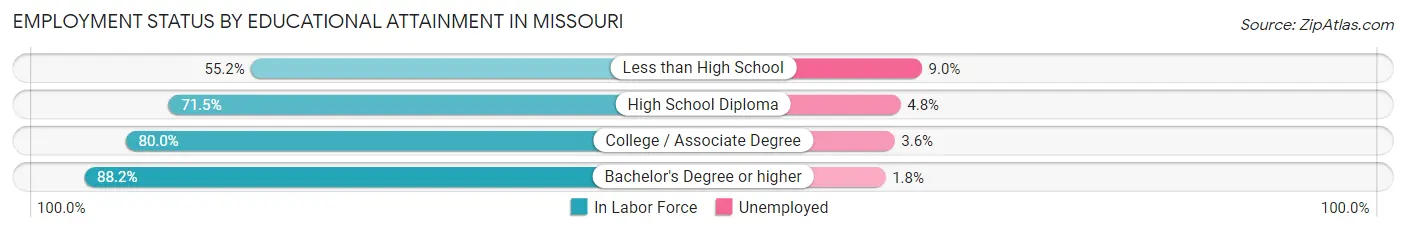
| Educational Attainment | In Labor Force | Unemployed |
| Less than High School | 136,321 (55.2%) | 22,226 (9.0%) |
| High School Diploma | 641,843 (71.5%) | 43,089 (4.8%) |
| College / Associate Degree | 760,962 (80.0%) | 34,243 (3.6%) |
| Bachelor's Degree or higher | 917,970 (88.2%) | 18,734 (1.8%) |
| Total | 2,455,978 (78.3%) | 112,919 (3.6%) |
Employment Occupations by Sex in Missouri
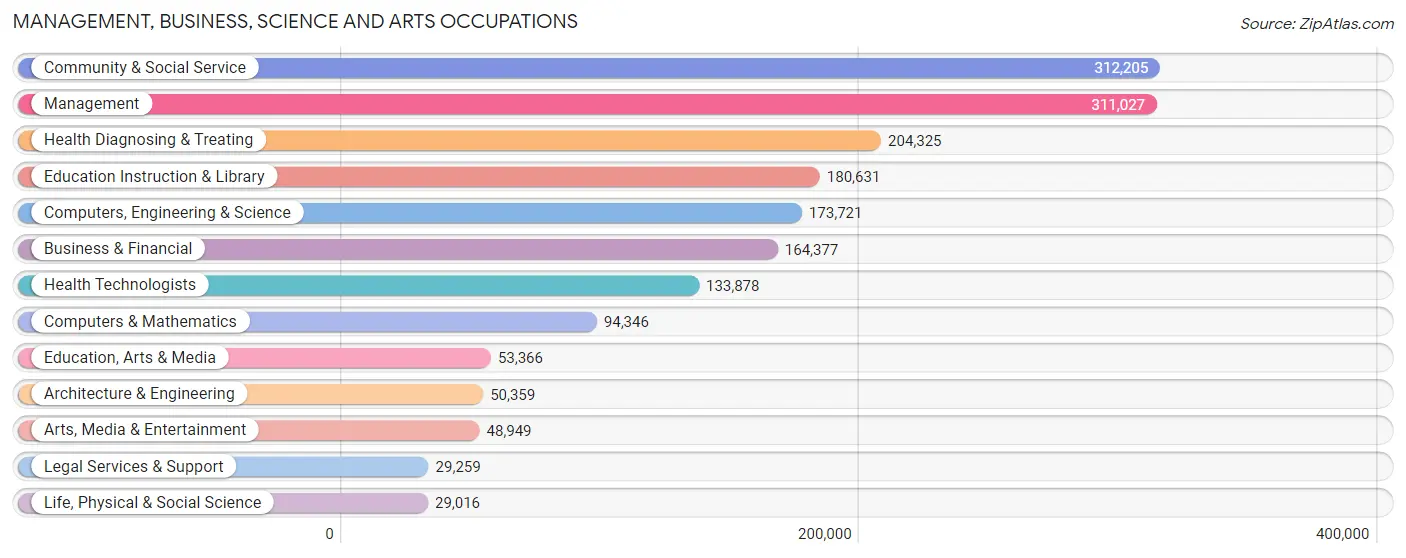
Management, Business, Science and Arts Occupations
The most common Management, Business, Science and Arts occupations in Missouri are Community & Social Service (312,205 | 10.6%), Management (311,027 | 10.5%), Health Diagnosing & Treating (204,325 | 6.9%), Education Instruction & Library (180,631 | 6.1%), and Computers, Engineering & Science (173,721 | 5.9%).
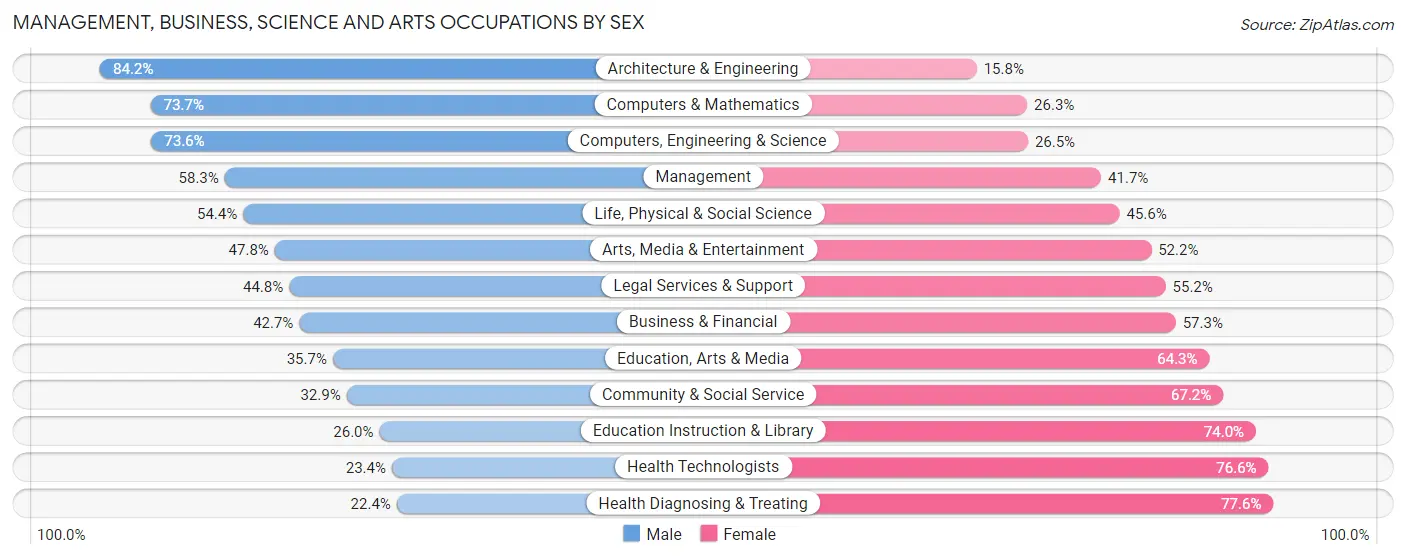
Management, Business, Science and Arts Occupations by Sex
Within the Management, Business, Science and Arts occupations in Missouri, the most male-oriented occupations are Architecture & Engineering (84.2%), Computers & Mathematics (73.7%), and Computers, Engineering & Science (73.6%), while the most female-oriented occupations are Health Diagnosing & Treating (77.6%), Health Technologists (76.6%), and Education Instruction & Library (74.0%).
| Occupation | Male | Female |
| Management | 181,260 (58.3%) | 129,767 (41.7%) |
| Business & Financial | 70,215 (42.7%) | 94,162 (57.3%) |
| Computers, Engineering & Science | 127,776 (73.6%) | 45,945 (26.5%) |
| Computers & Mathematics | 69,556 (73.7%) | 24,790 (26.3%) |
| Architecture & Engineering | 42,424 (84.2%) | 7,935 (15.8%) |
| Life, Physical & Social Science | 15,796 (54.4%) | 13,220 (45.6%) |
| Community & Social Service | 102,574 (32.9%) | 209,631 (67.1%) |
| Education, Arts & Media | 19,064 (35.7%) | 34,302 (64.3%) |
| Legal Services & Support | 13,121 (44.8%) | 16,138 (55.2%) |
| Education Instruction & Library | 46,970 (26.0%) | 133,661 (74.0%) |
| Arts, Media & Entertainment | 23,419 (47.8%) | 25,530 (52.2%) |
| Health Diagnosing & Treating | 45,754 (22.4%) | 158,571 (77.6%) |
| Health Technologists | 31,330 (23.4%) | 102,548 (76.6%) |
| Total (Category) | 527,579 (45.3%) | 638,076 (54.7%) |
| Total (Overall) | 1,533,945 (51.9%) | 1,420,915 (48.1%) |
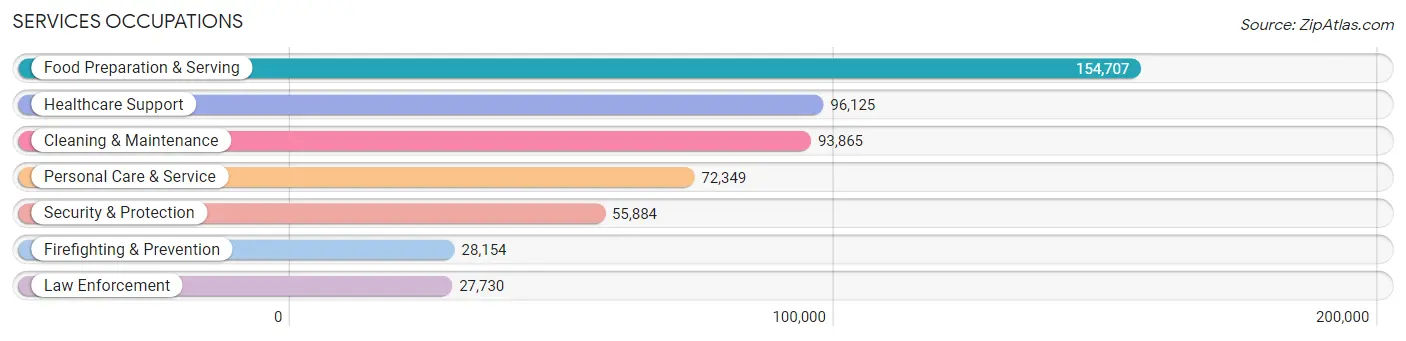
Services Occupations
The most common Services occupations in Missouri are Food Preparation & Serving (154,707 | 5.2%), Healthcare Support (96,125 | 3.3%), Cleaning & Maintenance (93,865 | 3.2%), Personal Care & Service (72,349 | 2.5%), and Security & Protection (55,884 | 1.9%).
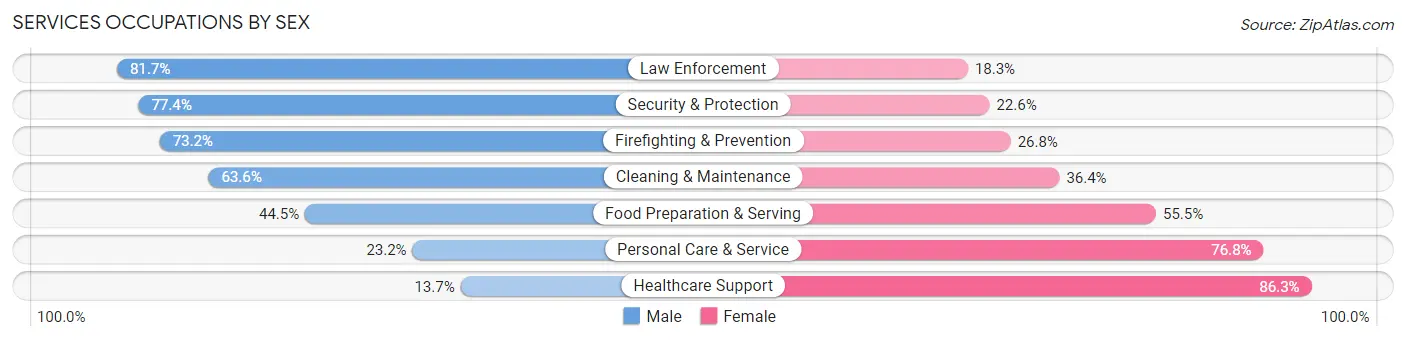
Services Occupations by Sex
Within the Services occupations in Missouri, the most male-oriented occupations are Law Enforcement (81.7%), Security & Protection (77.4%), and Firefighting & Prevention (73.2%), while the most female-oriented occupations are Healthcare Support (86.3%), Personal Care & Service (76.8%), and Food Preparation & Serving (55.5%).
| Occupation | Male | Female |
| Healthcare Support | 13,156 (13.7%) | 82,969 (86.3%) |
| Security & Protection | 43,275 (77.4%) | 12,609 (22.6%) |
| Firefighting & Prevention | 20,619 (73.2%) | 7,535 (26.8%) |
| Law Enforcement | 22,656 (81.7%) | 5,074 (18.3%) |
| Food Preparation & Serving | 68,789 (44.5%) | 85,918 (55.5%) |
| Cleaning & Maintenance | 59,683 (63.6%) | 34,182 (36.4%) |
| Personal Care & Service | 16,783 (23.2%) | 55,566 (76.8%) |
| Total (Category) | 201,686 (42.6%) | 271,244 (57.4%) |
| Total (Overall) | 1,533,945 (51.9%) | 1,420,915 (48.1%) |
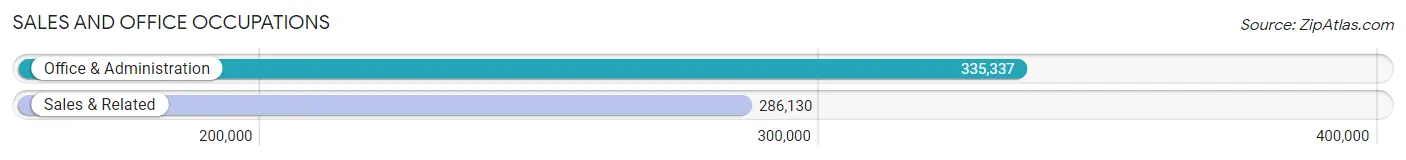
Sales and Office Occupations
The most common Sales and Office occupations in Missouri are Office & Administration (335,337 | 11.4%), and Sales & Related (286,130 | 9.7%).
Sales and Office Occupations by Sex
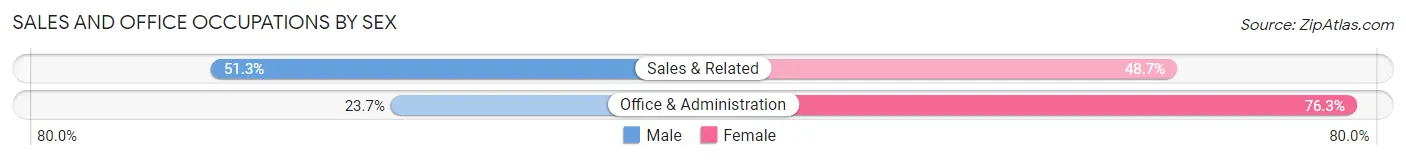
| Occupation | Male | Female |
| Sales & Related | 146,860 (51.3%) | 139,270 (48.7%) |
| Office & Administration | 79,385 (23.7%) | 255,952 (76.3%) |
| Total (Category) | 226,245 (36.4%) | 395,222 (63.6%) |
| Total (Overall) | 1,533,945 (51.9%) | 1,420,915 (48.1%) |
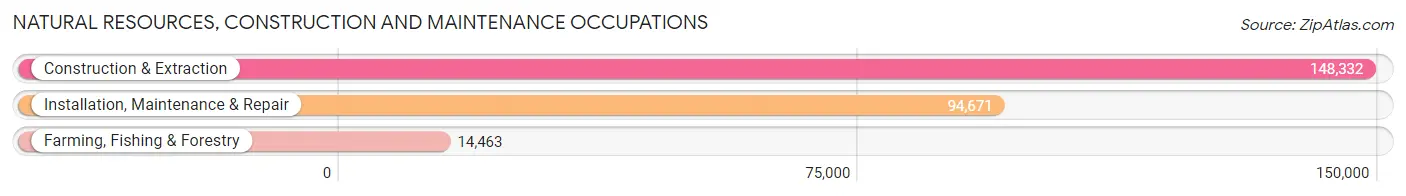
Natural Resources, Construction and Maintenance Occupations
The most common Natural Resources, Construction and Maintenance occupations in Missouri are Construction & Extraction (148,332 | 5.0%), Installation, Maintenance & Repair (94,671 | 3.2%), and Farming, Fishing & Forestry (14,463 | 0.5%).
Natural Resources, Construction and Maintenance Occupations by Sex
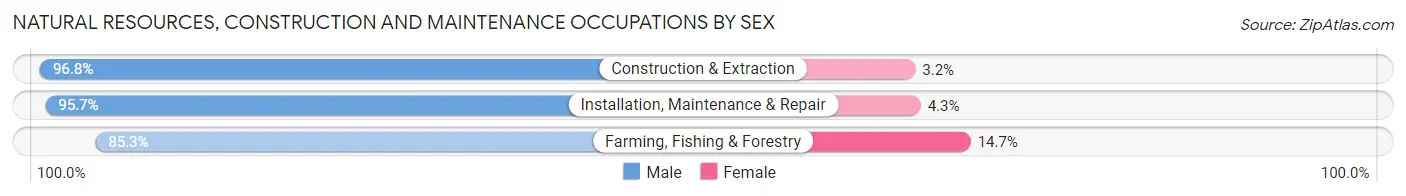
| Occupation | Male | Female |
| Farming, Fishing & Forestry | 12,332 (85.3%) | 2,131 (14.7%) |
| Construction & Extraction | 143,565 (96.8%) | 4,767 (3.2%) |
| Installation, Maintenance & Repair | 90,572 (95.7%) | 4,099 (4.3%) |
| Total (Category) | 246,469 (95.7%) | 10,997 (4.3%) |
| Total (Overall) | 1,533,945 (51.9%) | 1,420,915 (48.1%) |
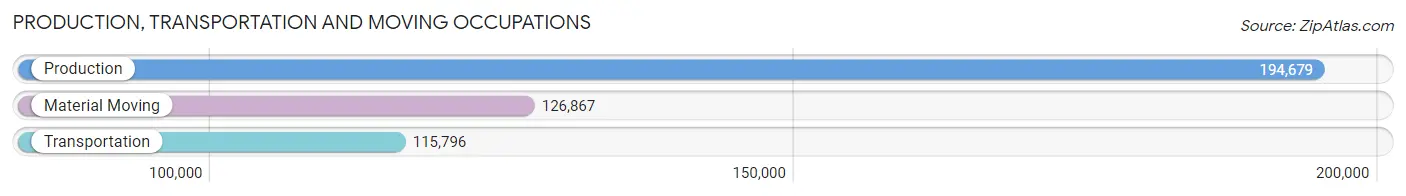
Production, Transportation and Moving Occupations
The most common Production, Transportation and Moving occupations in Missouri are Production (194,679 | 6.6%), Material Moving (126,867 | 4.3%), and Transportation (115,796 | 3.9%).
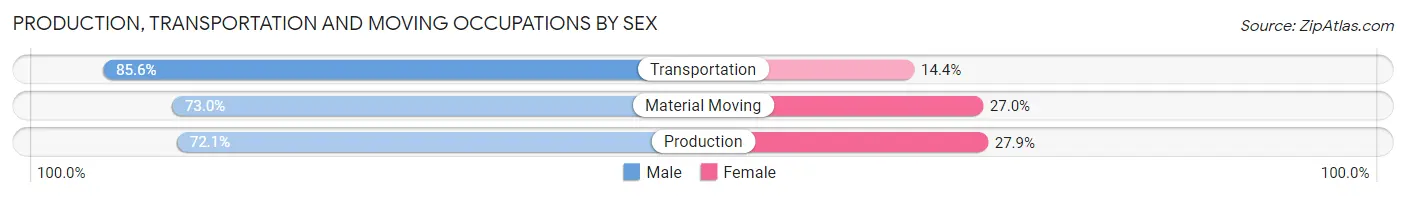
Production, Transportation and Moving Occupations by Sex
| Occupation | Male | Female |
| Production | 140,307 (72.1%) | 54,372 (27.9%) |
| Transportation | 99,097 (85.6%) | 16,699 (14.4%) |
| Material Moving | 92,562 (73.0%) | 34,305 (27.0%) |
| Total (Category) | 331,966 (75.9%) | 105,376 (24.1%) |
| Total (Overall) | 1,533,945 (51.9%) | 1,420,915 (48.1%) |
Employment Industries by Sex in Missouri
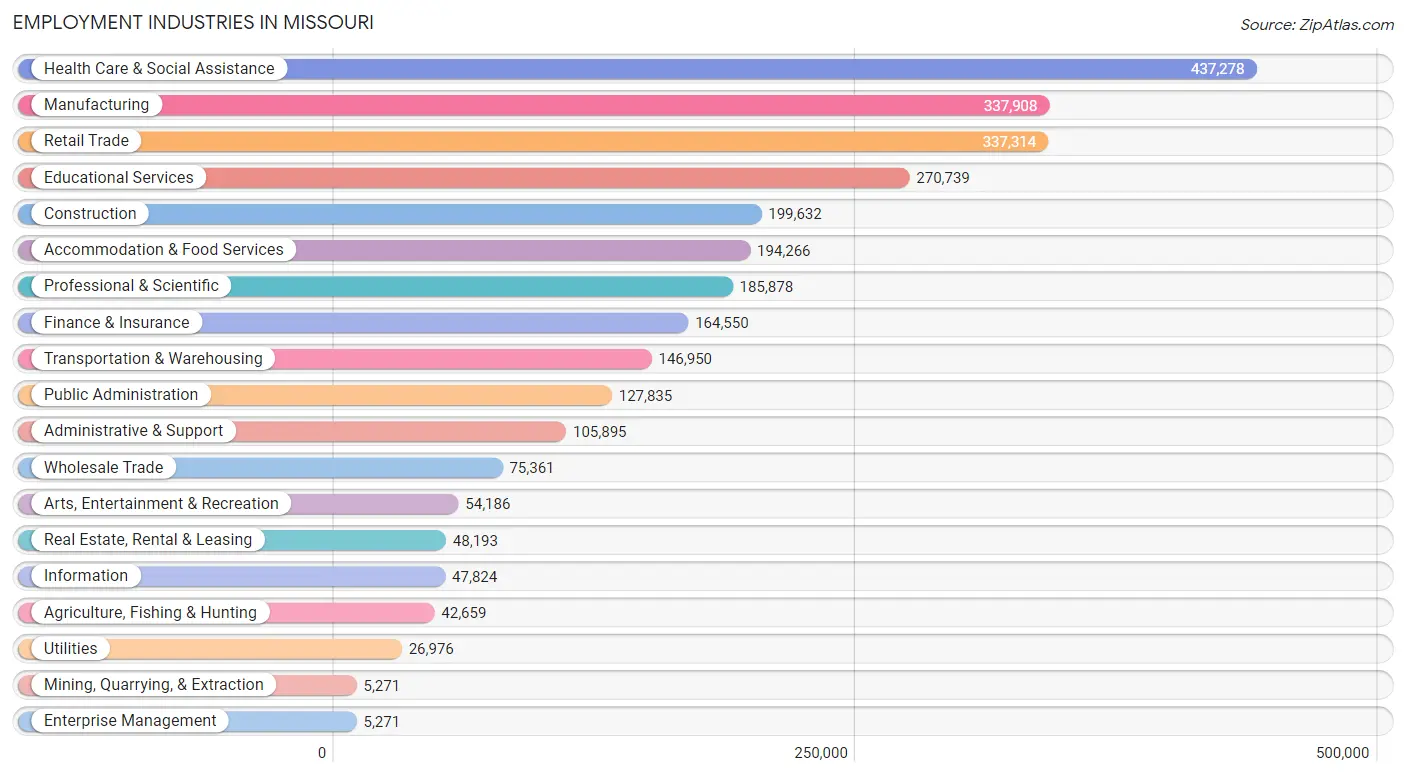
Employment Industries in Missouri
The major employment industries in Missouri include Health Care & Social Assistance (437,278 | 14.8%), Manufacturing (337,908 | 11.4%), Retail Trade (337,314 | 11.4%), Educational Services (270,739 | 9.2%), and Construction (199,632 | 6.8%).
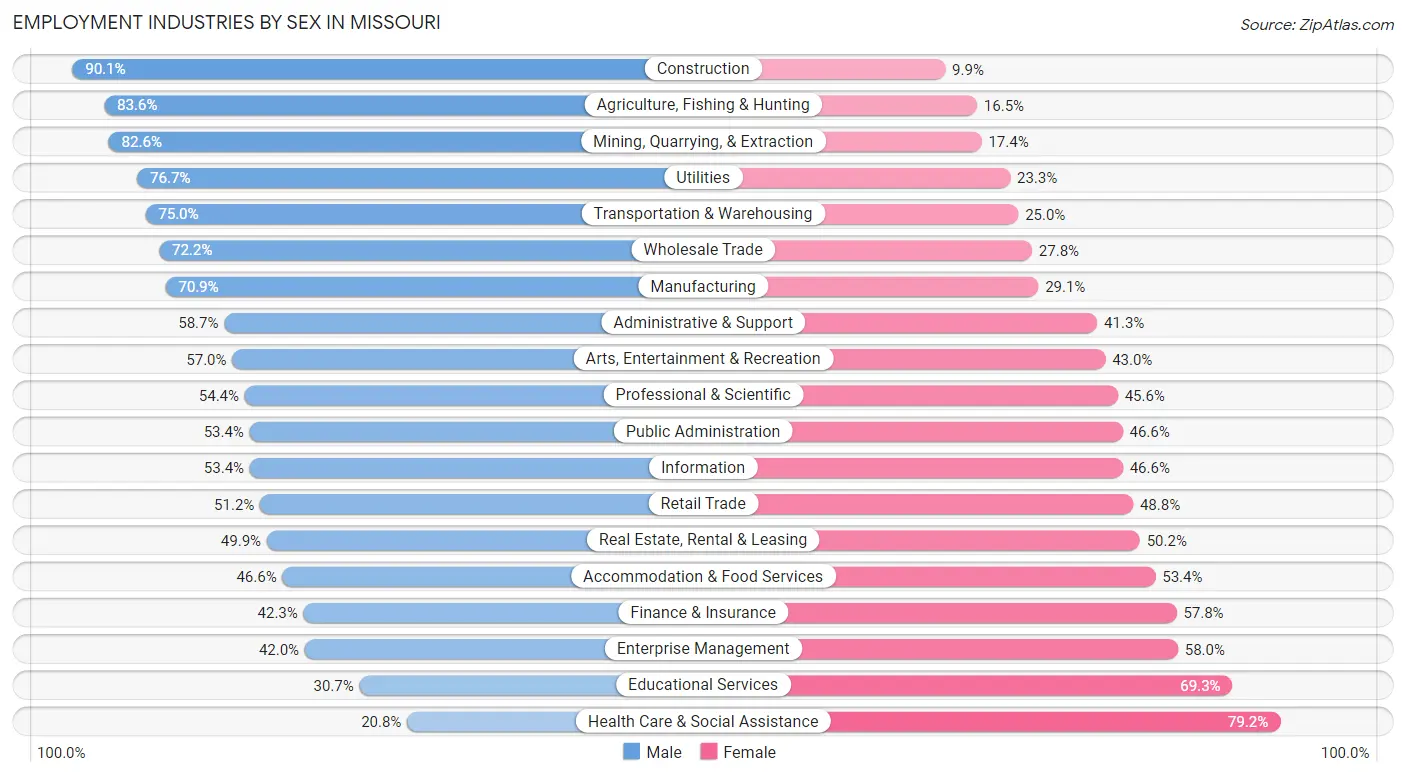
Employment Industries by Sex in Missouri
The Missouri industries that see more men than women are Construction (90.1%), Agriculture, Fishing & Hunting (83.6%), and Mining, Quarrying, & Extraction (82.6%), whereas the industries that tend to have a higher number of women are Health Care & Social Assistance (79.2%), Educational Services (69.3%), and Enterprise Management (58.0%).
| Industry | Male | Female |
| Agriculture, Fishing & Hunting | 35,642 (83.6%) | 7,017 (16.5%) |
| Mining, Quarrying, & Extraction | 4,354 (82.6%) | 917 (17.4%) |
| Construction | 179,912 (90.1%) | 19,720 (9.9%) |
| Manufacturing | 239,455 (70.9%) | 98,453 (29.1%) |
| Wholesale Trade | 54,382 (72.2%) | 20,979 (27.8%) |
| Retail Trade | 172,851 (51.2%) | 164,463 (48.8%) |
| Transportation & Warehousing | 110,206 (75.0%) | 36,744 (25.0%) |
| Utilities | 20,688 (76.7%) | 6,288 (23.3%) |
| Information | 25,518 (53.4%) | 22,306 (46.6%) |
| Finance & Insurance | 69,526 (42.2%) | 95,024 (57.8%) |
| Real Estate, Rental & Leasing | 24,024 (49.8%) | 24,169 (50.1%) |
| Professional & Scientific | 101,145 (54.4%) | 84,733 (45.6%) |
| Enterprise Management | 2,212 (42.0%) | 3,059 (58.0%) |
| Administrative & Support | 62,120 (58.7%) | 43,775 (41.3%) |
| Educational Services | 83,044 (30.7%) | 187,695 (69.3%) |
| Health Care & Social Assistance | 90,996 (20.8%) | 346,282 (79.2%) |
| Arts, Entertainment & Recreation | 30,883 (57.0%) | 23,303 (43.0%) |
| Accommodation & Food Services | 90,568 (46.6%) | 103,698 (53.4%) |
| Public Administration | 68,272 (53.4%) | 59,563 (46.6%) |
| Total | 1,533,945 (51.9%) | 1,420,915 (48.1%) |
Education in Missouri
School Enrollment in Missouri
The most common levels of schooling among the 1,450,458 students in Missouri are middle school (314,037 | 21.6%), high school (310,077 | 21.4%), and elementary school (293,868 | 20.3%).
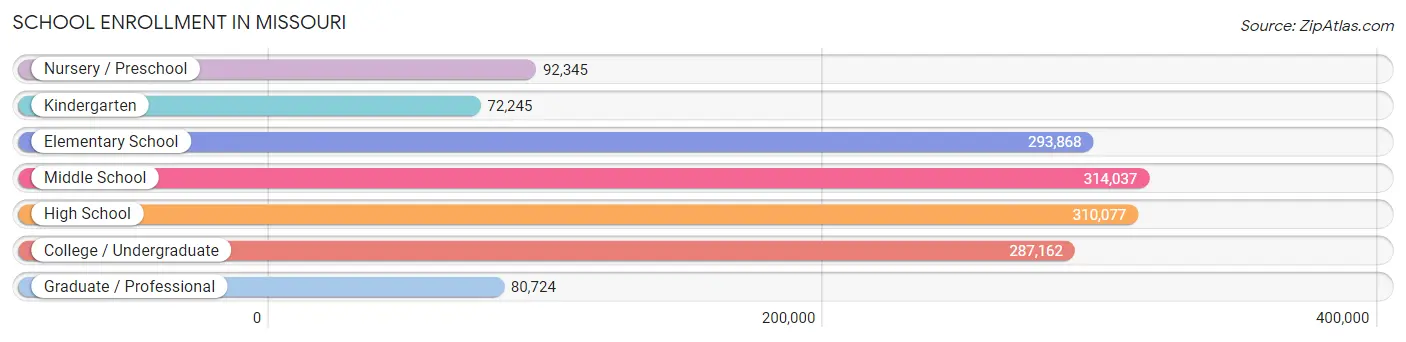
| School Level | # Students | % Students |
| Nursery / Preschool | 92,345 | 6.4% |
| Kindergarten | 72,245 | 5.0% |
| Elementary School | 293,868 | 20.3% |
| Middle School | 314,037 | 21.6% |
| High School | 310,077 | 21.4% |
| College / Undergraduate | 287,162 | 19.8% |
| Graduate / Professional | 80,724 | 5.6% |
| Total | 1,450,458 | 100.0% |
School Enrollment by Age by Funding Source in Missouri
Out of a total of 1,450,458 students who are enrolled in schools in Missouri, 277,037 (19.1%) attend a private institution, while the remaining 1,173,421 (80.9%) are enrolled in public schools. The age group of 3 to 4 year olds has the highest likelihood of being enrolled in private schools, with 26,355 (40.3% in the age bracket) enrolled. Conversely, the age group of 15 to 17 year olds has the lowest likelihood of being enrolled in a private school, with 199,381 (87.2% in the age bracket) attending a public institution.
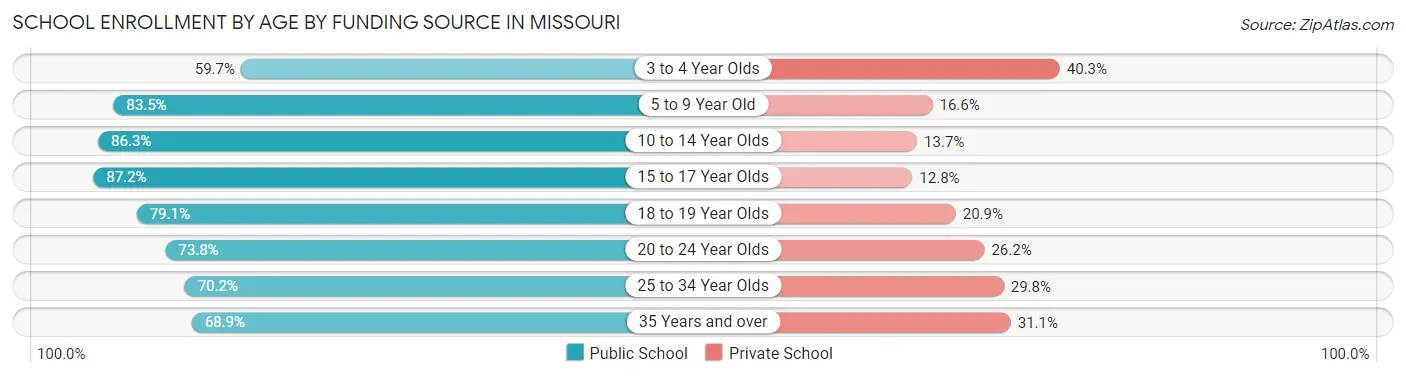
| Age Bracket | Public School | Private School |
| 3 to 4 Year Olds | 39,086 (59.7%) | 26,355 (40.3%) |
| 5 to 9 Year Old | 290,910 (83.5%) | 57,686 (16.6%) |
| 10 to 14 Year Olds | 333,880 (86.3%) | 52,975 (13.7%) |
| 15 to 17 Year Olds | 199,381 (87.2%) | 29,258 (12.8%) |
| 18 to 19 Year Olds | 93,869 (79.1%) | 24,792 (20.9%) |
| 20 to 24 Year Olds | 115,969 (73.8%) | 41,241 (26.2%) |
| 25 to 34 Year Olds | 55,746 (70.2%) | 23,698 (29.8%) |
| 35 Years and over | 45,185 (68.9%) | 20,427 (31.1%) |
| Total | 1,173,421 (80.9%) | 277,037 (19.1%) |
Educational Attainment by Field of Study in Missouri
Business (300,163 | 21.1%), education (206,341 | 14.5%), science & technology (152,955 | 10.8%), bio, nature & agricultural (98,977 | 7.0%), and arts & humanities (92,214 | 6.5%) are the most common fields of study among 1,419,177 individuals in Missouri who have obtained a bachelor's degree or higher.
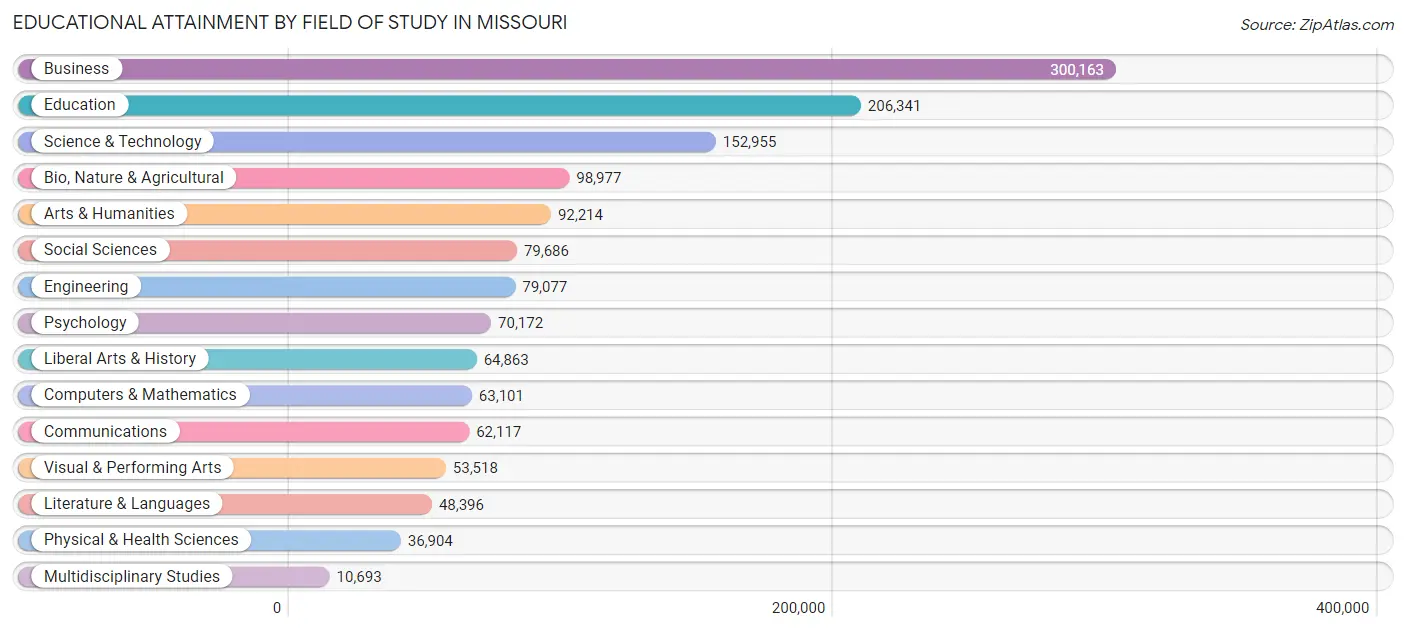
| Field of Study | # Graduates | % Graduates |
| Computers & Mathematics | 63,101 | 4.4% |
| Bio, Nature & Agricultural | 98,977 | 7.0% |
| Physical & Health Sciences | 36,904 | 2.6% |
| Psychology | 70,172 | 4.9% |
| Social Sciences | 79,686 | 5.6% |
| Engineering | 79,077 | 5.6% |
| Multidisciplinary Studies | 10,693 | 0.7% |
| Science & Technology | 152,955 | 10.8% |
| Business | 300,163 | 21.1% |
| Education | 206,341 | 14.5% |
| Literature & Languages | 48,396 | 3.4% |
| Liberal Arts & History | 64,863 | 4.6% |
| Visual & Performing Arts | 53,518 | 3.8% |
| Communications | 62,117 | 4.4% |
| Arts & Humanities | 92,214 | 6.5% |
| Total | 1,419,177 | 100.0% |
Transportation & Commute in Missouri
Vehicle Availability by Sex in Missouri
The most prevalent vehicle ownership categories in Missouri are males with 2 vehicles (643,746, accounting for 42.6%) and females with 2 vehicles (563,991, making up 46.5%).
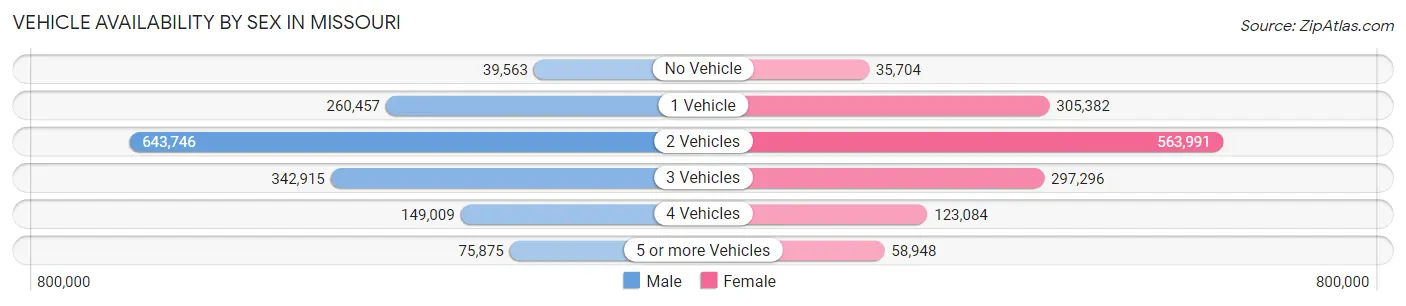
| Vehicles Available | Male | Female |
| No Vehicle | 39,563 (2.6%) | 35,704 (2.6%) |
| 1 Vehicle | 260,457 (17.2%) | 305,382 (22.1%) |
| 2 Vehicles | 643,746 (42.6%) | 563,991 (40.7%) |
| 3 Vehicles | 342,915 (22.7%) | 297,296 (21.5%) |
| 4 Vehicles | 149,009 (9.9%) | 123,084 (8.9%) |
| 5 or more Vehicles | 75,875 (5.0%) | 58,948 (4.3%) |
| Total | 1,511,565 (100.0%) | 1,384,405 (100.0%) |
Commute Time in Missouri
The most frequently occuring commute durations in Missouri are 15 to 19 minutes (431,247 commuters, 16.4%), 20 to 24 minutes (401,620 commuters, 15.3%), and 10 to 14 minutes (372,287 commuters, 14.1%).
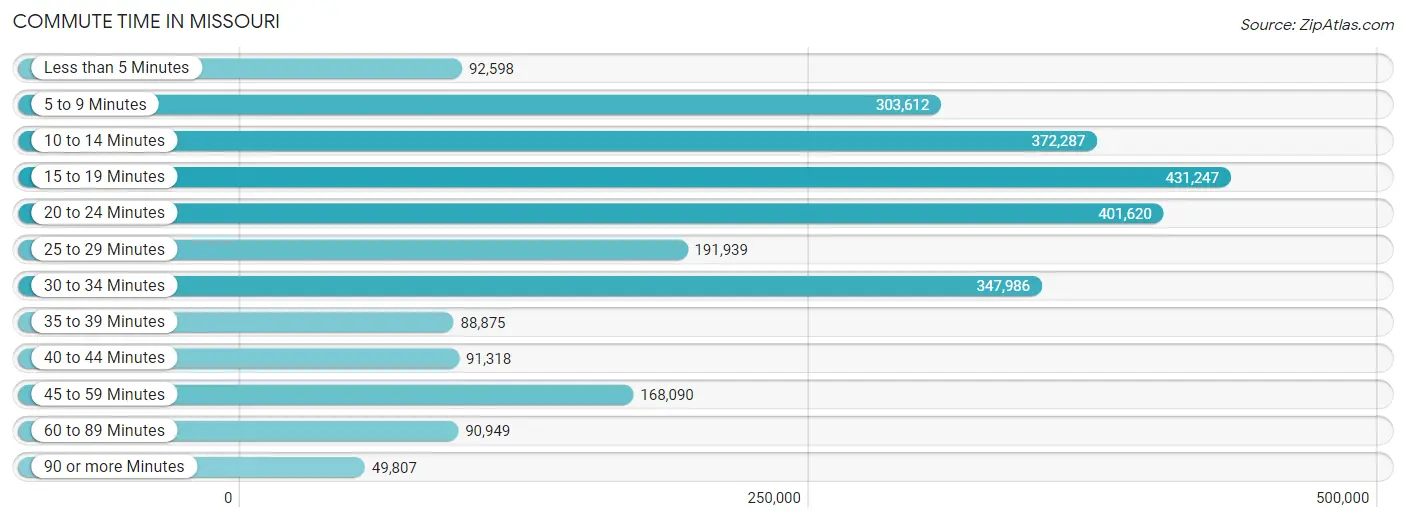
| Commute Time | # Commuters | % Commuters |
| Less than 5 Minutes | 92,598 | 3.5% |
| 5 to 9 Minutes | 303,612 | 11.5% |
| 10 to 14 Minutes | 372,287 | 14.1% |
| 15 to 19 Minutes | 431,247 | 16.4% |
| 20 to 24 Minutes | 401,620 | 15.3% |
| 25 to 29 Minutes | 191,939 | 7.3% |
| 30 to 34 Minutes | 347,986 | 13.2% |
| 35 to 39 Minutes | 88,875 | 3.4% |
| 40 to 44 Minutes | 91,318 | 3.5% |
| 45 to 59 Minutes | 168,090 | 6.4% |
| 60 to 89 Minutes | 90,949 | 3.5% |
| 90 or more Minutes | 49,807 | 1.9% |
Commute Time by Sex in Missouri
The most common commute times in Missouri are 15 to 19 minutes (215,981 commuters, 15.6%) for males and 15 to 19 minutes (215,266 commuters, 17.3%) for females.
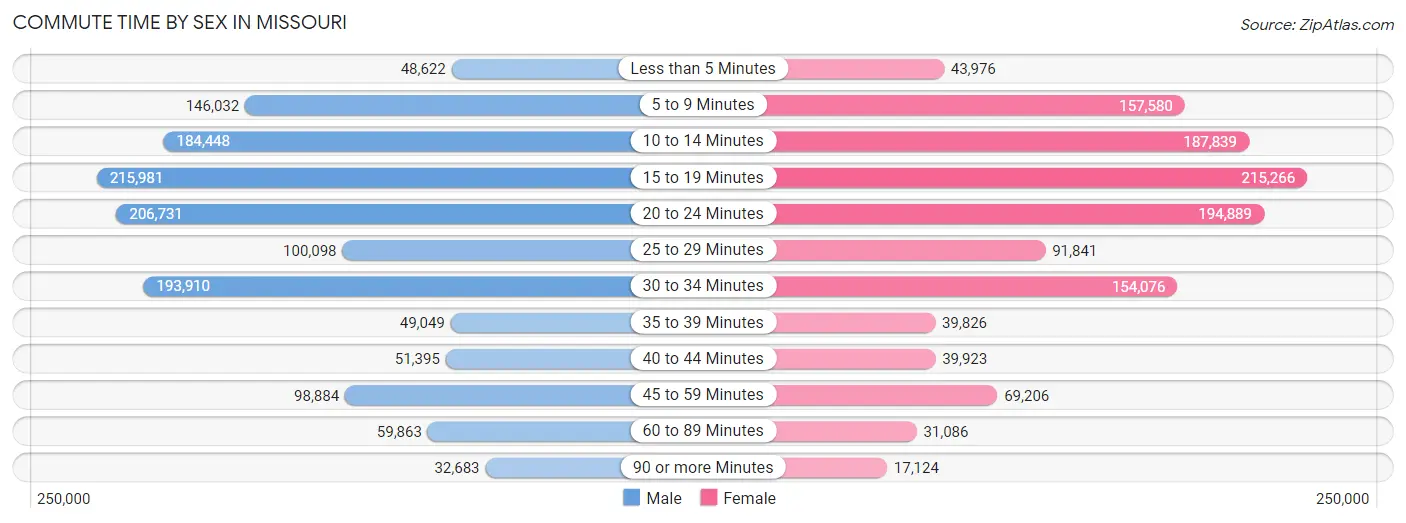
| Commute Time | Male | Female |
| Less than 5 Minutes | 48,622 (3.5%) | 43,976 (3.5%) |
| 5 to 9 Minutes | 146,032 (10.5%) | 157,580 (12.7%) |
| 10 to 14 Minutes | 184,448 (13.3%) | 187,839 (15.1%) |
| 15 to 19 Minutes | 215,981 (15.6%) | 215,266 (17.3%) |
| 20 to 24 Minutes | 206,731 (14.9%) | 194,889 (15.7%) |
| 25 to 29 Minutes | 100,098 (7.2%) | 91,841 (7.4%) |
| 30 to 34 Minutes | 193,910 (14.0%) | 154,076 (12.4%) |
| 35 to 39 Minutes | 49,049 (3.5%) | 39,826 (3.2%) |
| 40 to 44 Minutes | 51,395 (3.7%) | 39,923 (3.2%) |
| 45 to 59 Minutes | 98,884 (7.1%) | 69,206 (5.6%) |
| 60 to 89 Minutes | 59,863 (4.3%) | 31,086 (2.5%) |
| 90 or more Minutes | 32,683 (2.4%) | 17,124 (1.4%) |
Time of Departure to Work by Sex in Missouri
The most frequent times of departure to work in Missouri are 7:00 AM to 7:29 AM (197,554, 14.2%) for males and 7:30 AM to 7:59 AM (200,290, 16.1%) for females.
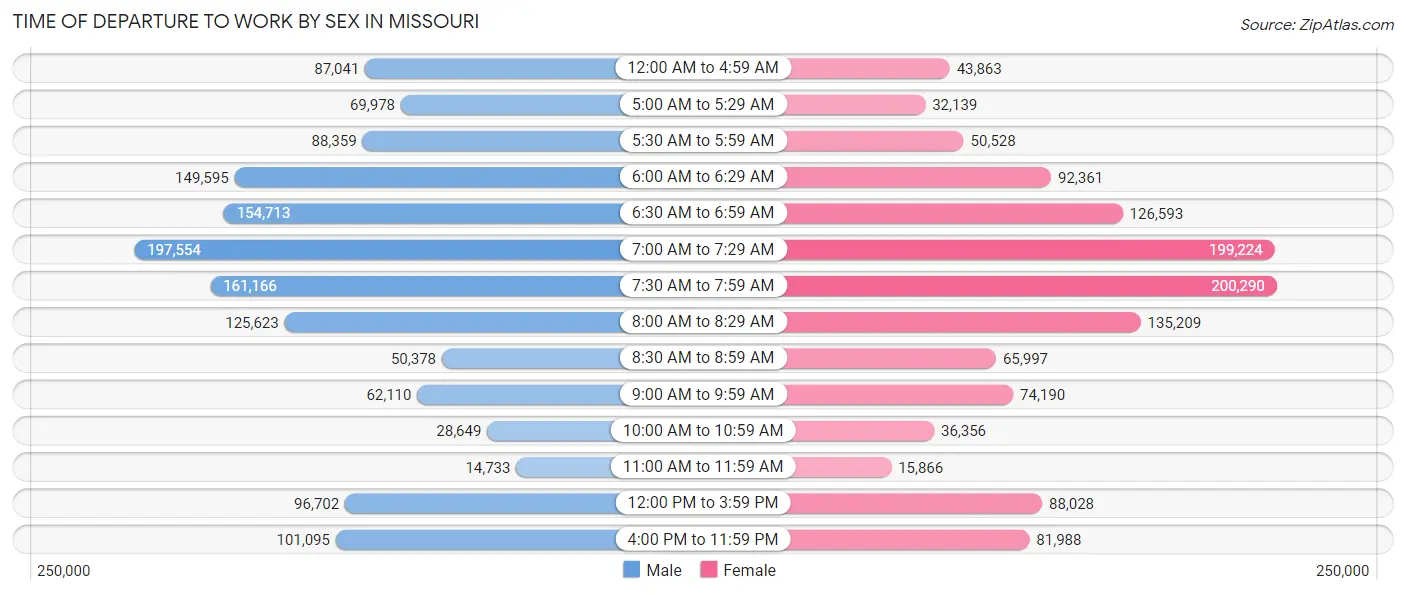
| Time of Departure | Male | Female |
| 12:00 AM to 4:59 AM | 87,041 (6.3%) | 43,863 (3.5%) |
| 5:00 AM to 5:29 AM | 69,978 (5.0%) | 32,139 (2.6%) |
| 5:30 AM to 5:59 AM | 88,359 (6.4%) | 50,528 (4.1%) |
| 6:00 AM to 6:29 AM | 149,595 (10.8%) | 92,361 (7.4%) |
| 6:30 AM to 6:59 AM | 154,713 (11.2%) | 126,593 (10.2%) |
| 7:00 AM to 7:29 AM | 197,554 (14.2%) | 199,224 (16.0%) |
| 7:30 AM to 7:59 AM | 161,166 (11.6%) | 200,290 (16.1%) |
| 8:00 AM to 8:29 AM | 125,623 (9.0%) | 135,209 (10.9%) |
| 8:30 AM to 8:59 AM | 50,378 (3.6%) | 65,997 (5.3%) |
| 9:00 AM to 9:59 AM | 62,110 (4.5%) | 74,190 (6.0%) |
| 10:00 AM to 10:59 AM | 28,649 (2.1%) | 36,356 (2.9%) |
| 11:00 AM to 11:59 AM | 14,733 (1.1%) | 15,866 (1.3%) |
| 12:00 PM to 3:59 PM | 96,702 (7.0%) | 88,028 (7.1%) |
| 4:00 PM to 11:59 PM | 101,095 (7.3%) | 81,988 (6.6%) |
| Total | 1,387,696 (100.0%) | 1,242,632 (100.0%) |
Housing Occupancy in Missouri
Occupancy by Ownership in Missouri
Of the total 2,458,324 dwellings in Missouri, owner-occupied units account for 1,661,854 (67.6%), while renter-occupied units make up 796,470 (32.4%).
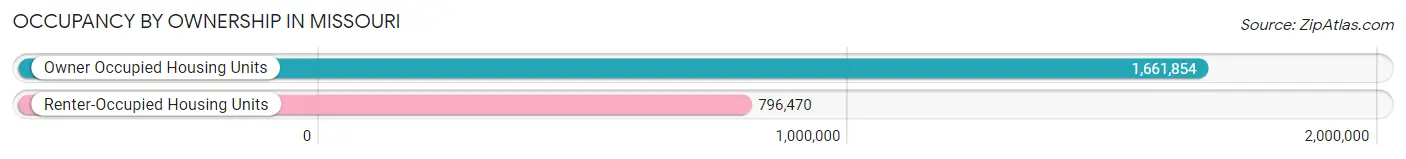
| Occupancy | # Housing Units | % Housing Units |
| Owner Occupied Housing Units | 1,661,854 | 67.6% |
| Renter-Occupied Housing Units | 796,470 | 32.4% |
| Total Occupied Housing Units | 2,458,324 | 100.0% |
Occupancy by Household Size in Missouri
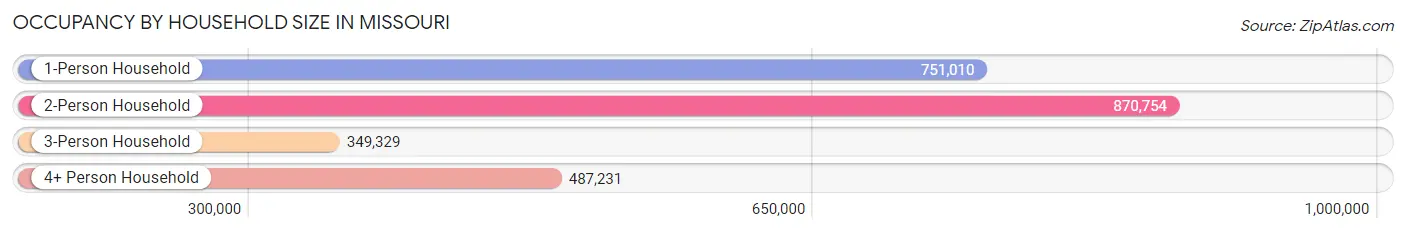
| Household Size | # Housing Units | % Housing Units |
| 1-Person Household | 751,010 | 30.5% |
| 2-Person Household | 870,754 | 35.4% |
| 3-Person Household | 349,329 | 14.2% |
| 4+ Person Household | 487,231 | 19.8% |
| Total Housing Units | 2,458,324 | 100.0% |
Occupancy by Ownership by Household Size in Missouri
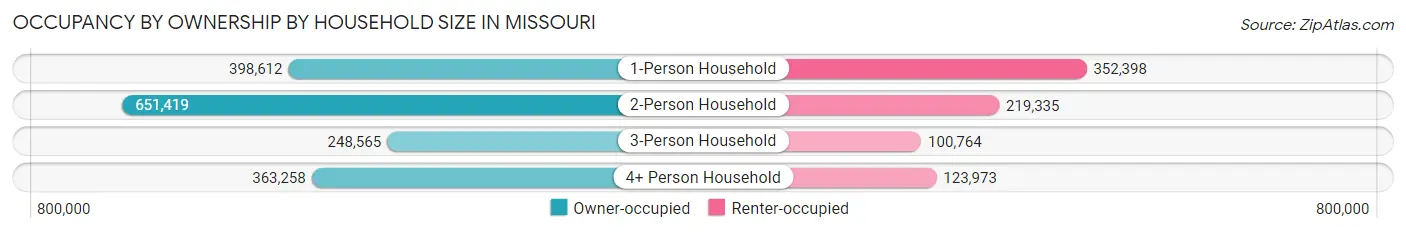
| Household Size | Owner-occupied | Renter-occupied |
| 1-Person Household | 398,612 (53.1%) | 352,398 (46.9%) |
| 2-Person Household | 651,419 (74.8%) | 219,335 (25.2%) |
| 3-Person Household | 248,565 (71.2%) | 100,764 (28.8%) |
| 4+ Person Household | 363,258 (74.6%) | 123,973 (25.4%) |
| Total Housing Units | 1,661,854 (67.6%) | 796,470 (32.4%) |
Occupancy by Educational Attainment in Missouri
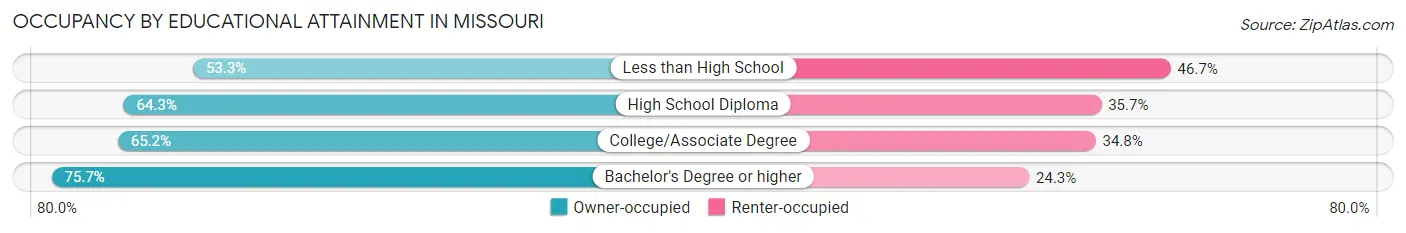
| Household Size | Owner-occupied | Renter-occupied |
| Less than High School | 96,568 (53.3%) | 84,647 (46.7%) |
| High School Diploma | 436,103 (64.3%) | 242,130 (35.7%) |
| College/Associate Degree | 506,494 (65.2%) | 270,224 (34.8%) |
| Bachelor's Degree or higher | 622,689 (75.7%) | 199,469 (24.3%) |
Occupancy by Age of Householder in Missouri
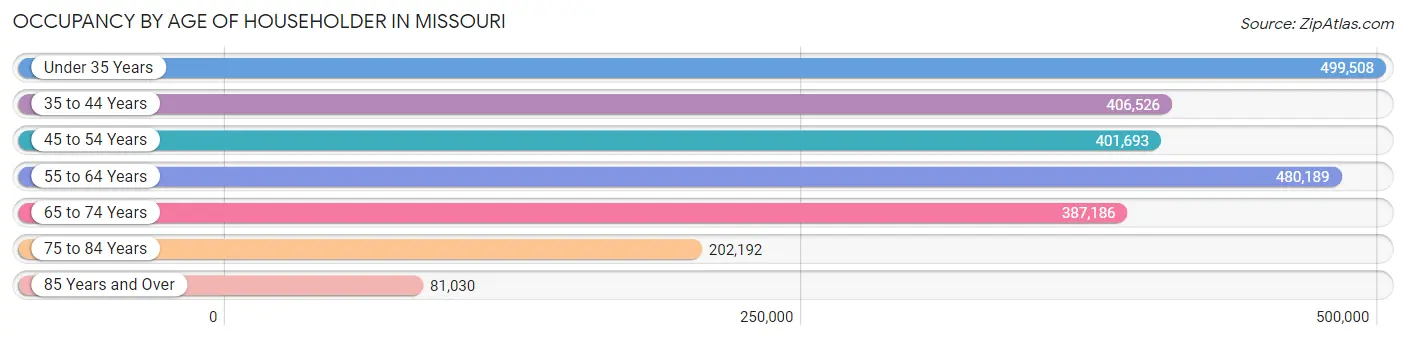
| Age Bracket | # Households | % Households |
| Under 35 Years | 499,508 | 20.3% |
| 35 to 44 Years | 406,526 | 16.5% |
| 45 to 54 Years | 401,693 | 16.3% |
| 55 to 64 Years | 480,189 | 19.5% |
| 65 to 74 Years | 387,186 | 15.8% |
| 75 to 84 Years | 202,192 | 8.2% |
| 85 Years and Over | 81,030 | 3.3% |
| Total | 2,458,324 | 100.0% |
Housing Finances in Missouri
Median Income by Occupancy in Missouri
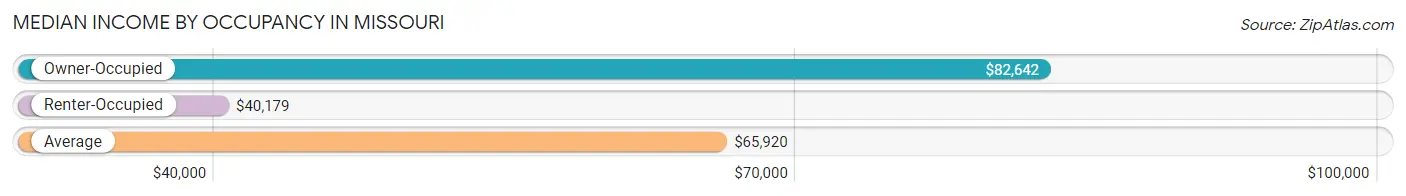
| Occupancy Type | # Households | Median Income |
| Owner-Occupied | 1,661,854 (67.6%) | $82,642 |
| Renter-Occupied | 796,470 (32.4%) | $40,179 |
| Average | 2,458,324 (100.0%) | $65,920 |
Occupancy by Householder Income Bracket in Missouri
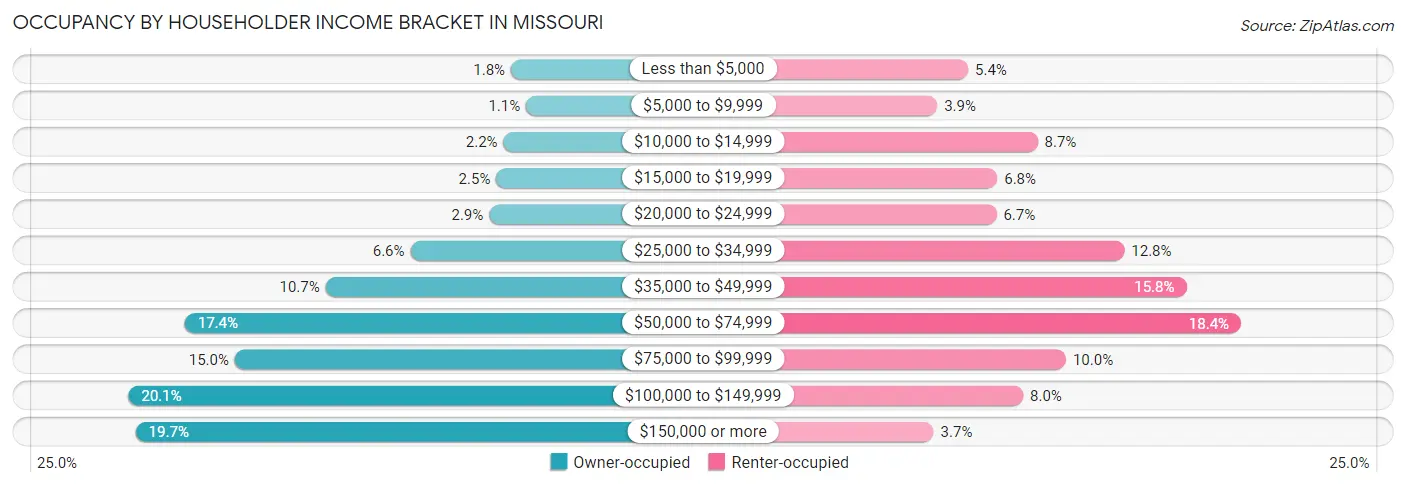
| Income Bracket | Owner-occupied | Renter-occupied |
| Less than $5,000 | 30,567 (1.8%) | 42,707 (5.4%) |
| $5,000 to $9,999 | 18,632 (1.1%) | 30,994 (3.9%) |
| $10,000 to $14,999 | 36,522 (2.2%) | 69,091 (8.7%) |
| $15,000 to $19,999 | 42,142 (2.5%) | 53,786 (6.8%) |
| $20,000 to $24,999 | 47,866 (2.9%) | 53,426 (6.7%) |
| $25,000 to $34,999 | 110,098 (6.6%) | 101,956 (12.8%) |
| $35,000 to $49,999 | 177,328 (10.7%) | 125,413 (15.8%) |
| $50,000 to $74,999 | 288,625 (17.4%) | 146,130 (18.3%) |
| $75,000 to $99,999 | 249,080 (15.0%) | 79,814 (10.0%) |
| $100,000 to $149,999 | 333,391 (20.1%) | 63,539 (8.0%) |
| $150,000 or more | 327,603 (19.7%) | 29,614 (3.7%) |
| Total | 1,661,854 (100.0%) | 796,470 (100.0%) |
Monthly Housing Cost Tiers in Missouri
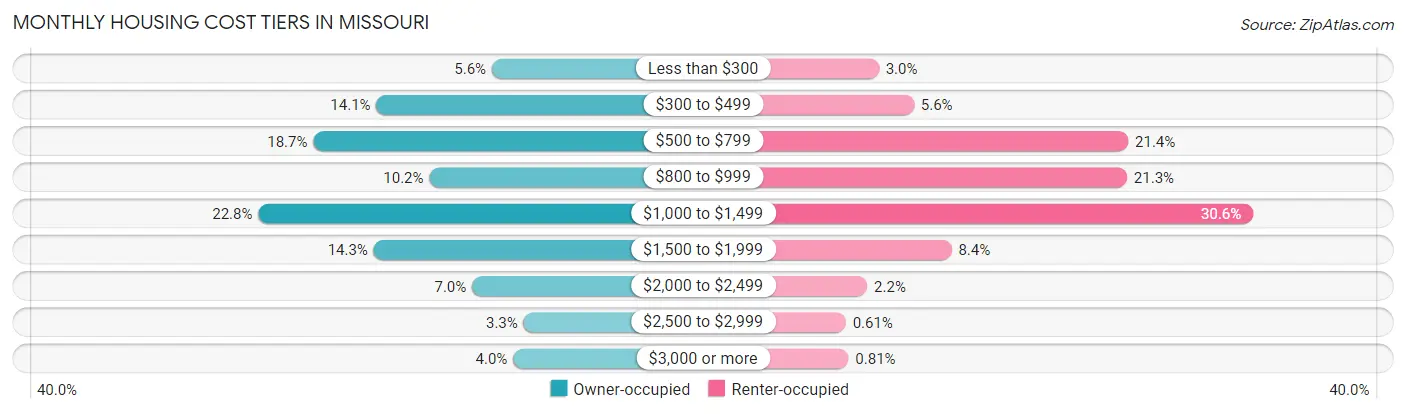
| Monthly Cost | Owner-occupied | Renter-occupied |
| Less than $300 | 92,790 (5.6%) | 24,241 (3.0%) |
| $300 to $499 | 234,185 (14.1%) | 44,808 (5.6%) |
| $500 to $799 | 311,458 (18.7%) | 170,543 (21.4%) |
| $800 to $999 | 169,371 (10.2%) | 169,838 (21.3%) |
| $1,000 to $1,499 | 378,788 (22.8%) | 243,792 (30.6%) |
| $1,500 to $1,999 | 237,514 (14.3%) | 66,910 (8.4%) |
| $2,000 to $2,499 | 116,920 (7.0%) | 17,480 (2.2%) |
| $2,500 to $2,999 | 53,997 (3.3%) | 4,876 (0.6%) |
| $3,000 or more | 66,831 (4.0%) | 6,416 (0.8%) |
| Total | 1,661,854 (100.0%) | 796,470 (100.0%) |
Physical Housing Characteristics in Missouri
Housing Structures in Missouri
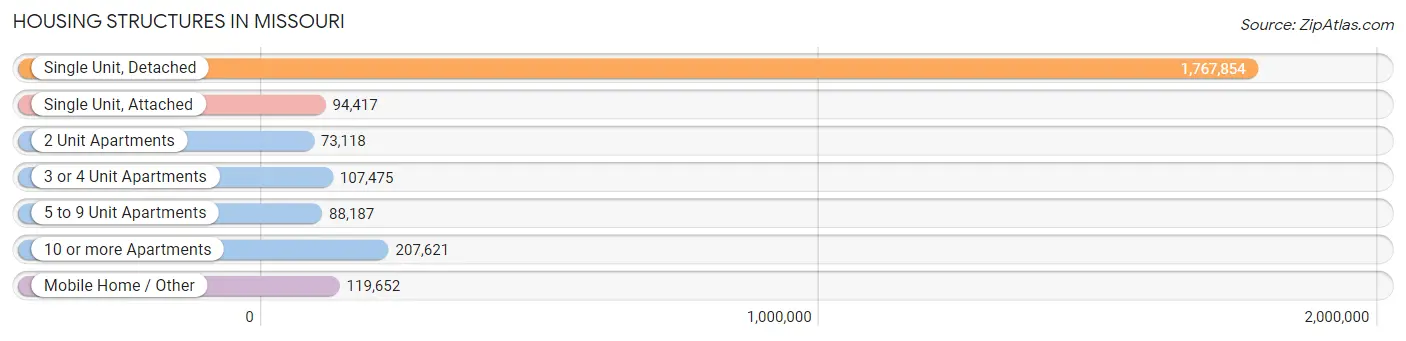
| Structure Type | # Housing Units | % Housing Units |
| Single Unit, Detached | 1,767,854 | 71.9% |
| Single Unit, Attached | 94,417 | 3.8% |
| 2 Unit Apartments | 73,118 | 3.0% |
| 3 or 4 Unit Apartments | 107,475 | 4.4% |
| 5 to 9 Unit Apartments | 88,187 | 3.6% |
| 10 or more Apartments | 207,621 | 8.5% |
| Mobile Home / Other | 119,652 | 4.9% |
| Total | 2,458,324 | 100.0% |
Housing Structures by Occupancy in Missouri
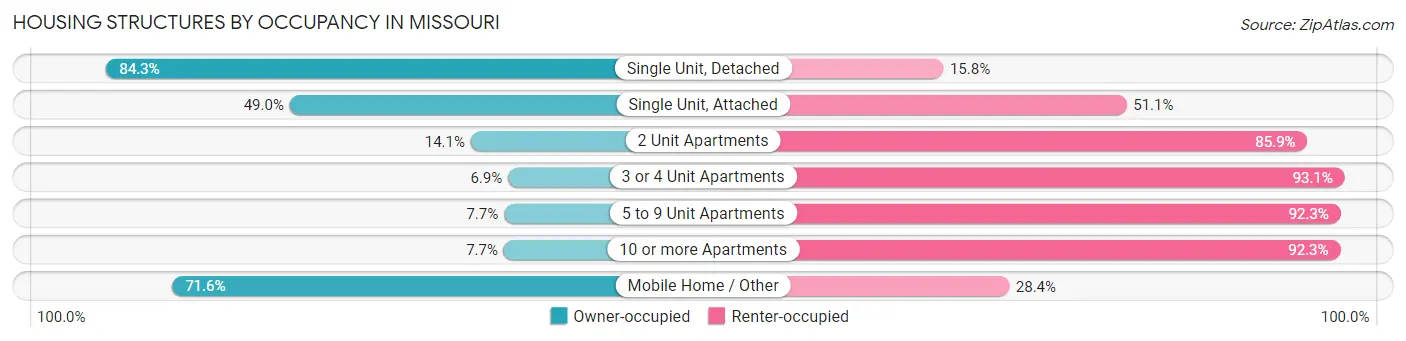
| Structure Type | Owner-occupied | Renter-occupied |
| Single Unit, Detached | 1,489,437 (84.3%) | 278,417 (15.8%) |
| Single Unit, Attached | 46,217 (48.9%) | 48,200 (51.0%) |
| 2 Unit Apartments | 10,301 (14.1%) | 62,817 (85.9%) |
| 3 or 4 Unit Apartments | 7,429 (6.9%) | 100,046 (93.1%) |
| 5 to 9 Unit Apartments | 6,770 (7.7%) | 81,417 (92.3%) |
| 10 or more Apartments | 16,067 (7.7%) | 191,554 (92.3%) |
| Mobile Home / Other | 85,633 (71.6%) | 34,019 (28.4%) |
| Total | 1,661,854 (67.6%) | 796,470 (32.4%) |
Housing Structures by Number of Rooms in Missouri
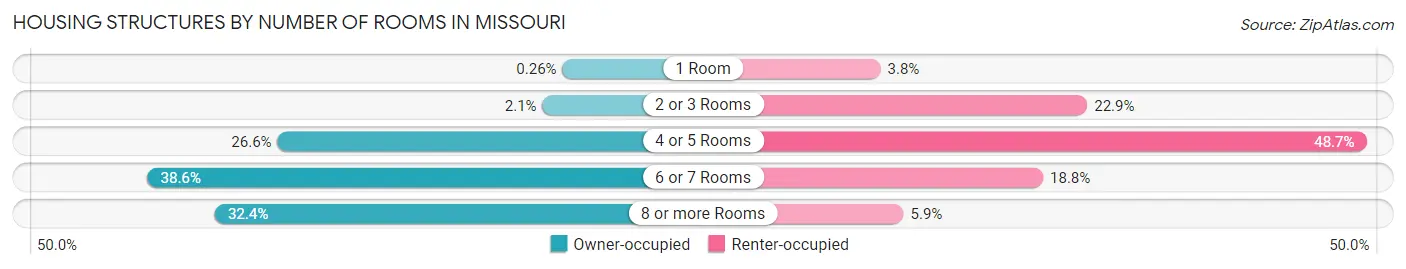
| Number of Rooms | Owner-occupied | Renter-occupied |
| 1 Room | 4,341 (0.3%) | 29,950 (3.8%) |
| 2 or 3 Rooms | 35,003 (2.1%) | 182,201 (22.9%) |
| 4 or 5 Rooms | 442,370 (26.6%) | 387,754 (48.7%) |
| 6 or 7 Rooms | 641,820 (38.6%) | 149,639 (18.8%) |
| 8 or more Rooms | 538,320 (32.4%) | 46,926 (5.9%) |
| Total | 1,661,854 (100.0%) | 796,470 (100.0%) |
Housing Structure by Heating Type in Missouri
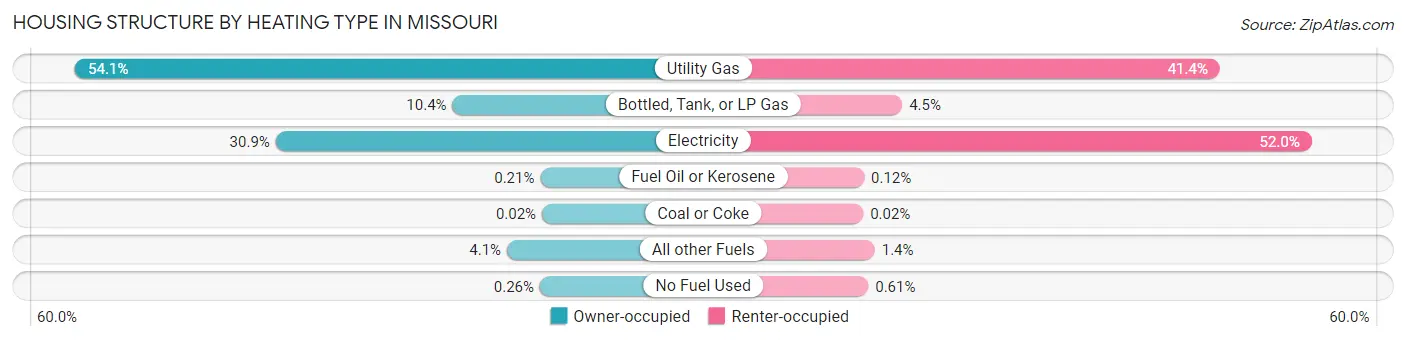
| Heating Type | Owner-occupied | Renter-occupied |
| Utility Gas | 899,798 (54.1%) | 329,340 (41.3%) |
| Bottled, Tank, or LP Gas | 172,891 (10.4%) | 36,141 (4.5%) |
| Electricity | 513,310 (30.9%) | 414,233 (52.0%) |
| Fuel Oil or Kerosene | 3,442 (0.2%) | 966 (0.1%) |
| Coal or Coke | 255 (0.0%) | 144 (0.0%) |
| All other Fuels | 67,875 (4.1%) | 10,819 (1.4%) |
| No Fuel Used | 4,283 (0.3%) | 4,827 (0.6%) |
| Total | 1,661,854 (100.0%) | 796,470 (100.0%) |
Household Vehicle Usage in Missouri
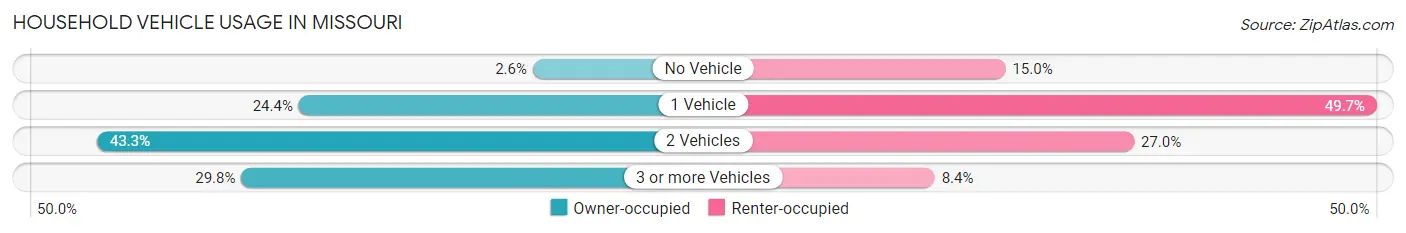
| Vehicles per Household | Owner-occupied | Renter-occupied |
| No Vehicle | 42,600 (2.6%) | 119,356 (15.0%) |
| 1 Vehicle | 405,740 (24.4%) | 395,460 (49.6%) |
| 2 Vehicles | 718,840 (43.3%) | 214,941 (27.0%) |
| 3 or more Vehicles | 494,674 (29.8%) | 66,713 (8.4%) |
| Total | 1,661,854 (100.0%) | 796,470 (100.0%) |
Real Estate & Mortgages in Missouri
Real Estate and Mortgage Overview in Missouri
| Characteristic | Without Mortgage | With Mortgage |
| Housing Units | 649,931 | 1,011,923 |
| Median Property Value | $173,500 | $214,400 |
| Median Household Income | $60,074 | $245,946 |
| Monthly Housing Costs | $508 | $64,914 |
| Real Estate Taxes | $1,531 | $18,508 |
Property Value by Mortgage Status in Missouri
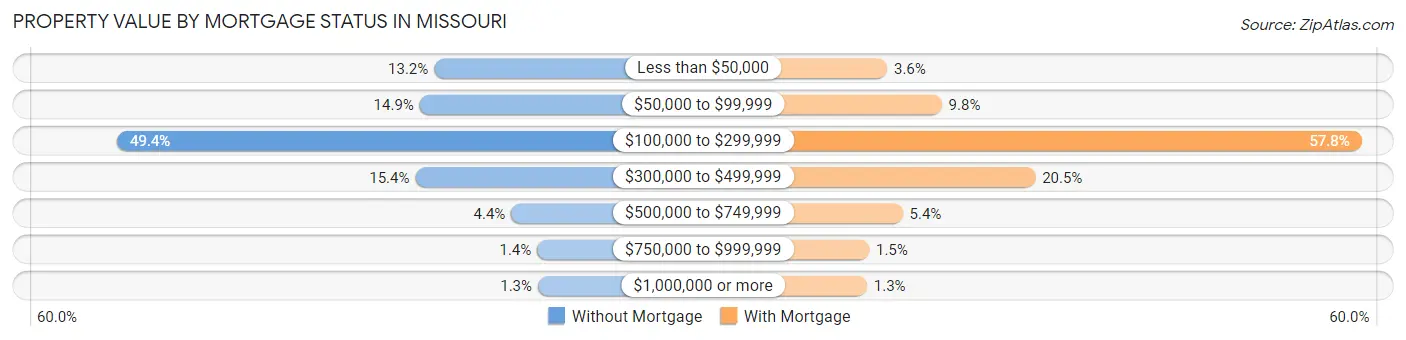
| Property Value | Without Mortgage | With Mortgage |
| Less than $50,000 | 85,805 (13.2%) | 36,478 (3.6%) |
| $50,000 to $99,999 | 96,511 (14.8%) | 99,566 (9.8%) |
| $100,000 to $299,999 | 321,320 (49.4%) | 585,133 (57.8%) |
| $300,000 to $499,999 | 99,782 (15.3%) | 207,724 (20.5%) |
| $500,000 to $749,999 | 28,525 (4.4%) | 54,399 (5.4%) |
| $750,000 to $999,999 | 9,294 (1.4%) | 15,581 (1.5%) |
| $1,000,000 or more | 8,694 (1.3%) | 13,042 (1.3%) |
| Total | 649,931 (100.0%) | 1,011,923 (100.0%) |
Household Income by Mortgage Status in Missouri
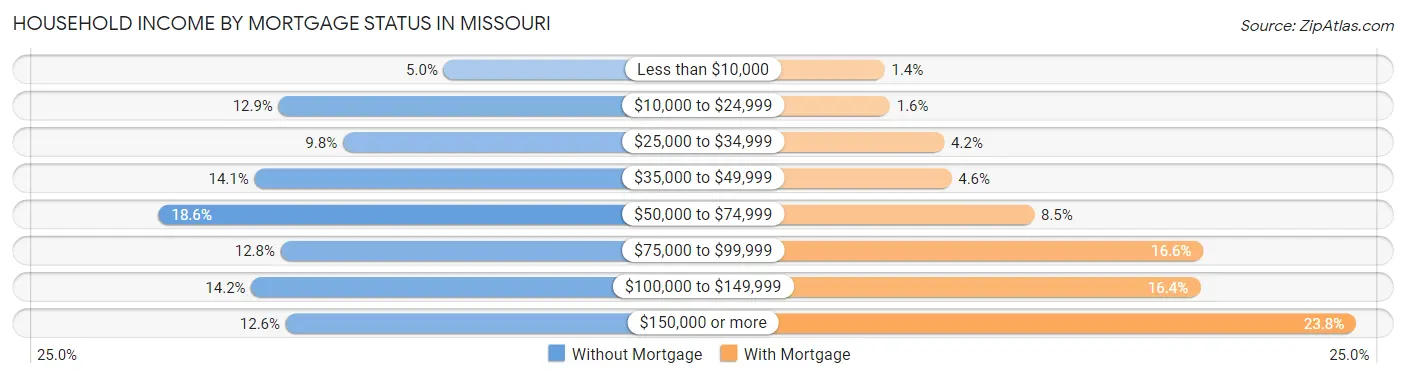
| Household Income | Without Mortgage | With Mortgage |
| Less than $10,000 | 32,733 (5.0%) | 13,920 (1.4%) |
| $10,000 to $24,999 | 83,844 (12.9%) | 16,466 (1.6%) |
| $25,000 to $34,999 | 63,937 (9.8%) | 42,686 (4.2%) |
| $35,000 to $49,999 | 91,292 (14.1%) | 46,161 (4.6%) |
| $50,000 to $74,999 | 121,047 (18.6%) | 86,036 (8.5%) |
| $75,000 to $99,999 | 83,161 (12.8%) | 167,578 (16.6%) |
| $100,000 to $149,999 | 92,260 (14.2%) | 165,919 (16.4%) |
| $150,000 or more | 81,657 (12.6%) | 241,131 (23.8%) |
| Total | 649,931 (100.0%) | 1,011,923 (100.0%) |
Property Value to Household Income Ratio in Missouri
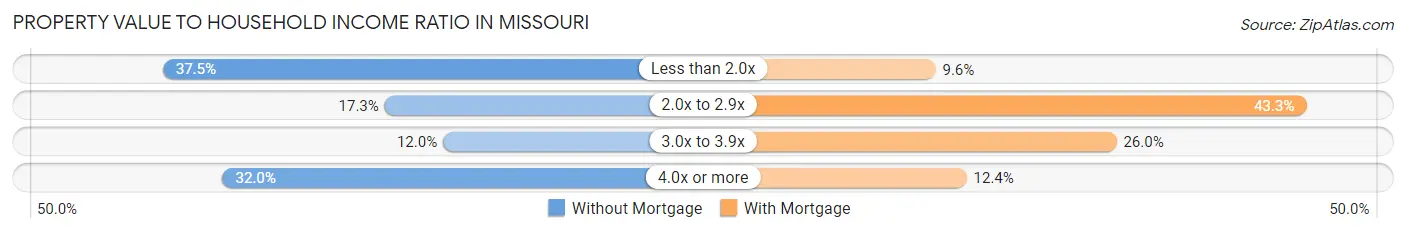
| Value-to-Income Ratio | Without Mortgage | With Mortgage |
| Less than 2.0x | 243,420 (37.4%) | 96,993 (9.6%) |
| 2.0x to 2.9x | 112,494 (17.3%) | 437,700 (43.2%) |
| 3.0x to 3.9x | 78,061 (12.0%) | 263,292 (26.0%) |
| 4.0x or more | 208,127 (32.0%) | 125,598 (12.4%) |
| Total | 649,931 (100.0%) | 1,011,923 (100.0%) |
Real Estate Taxes by Mortgage Status in Missouri
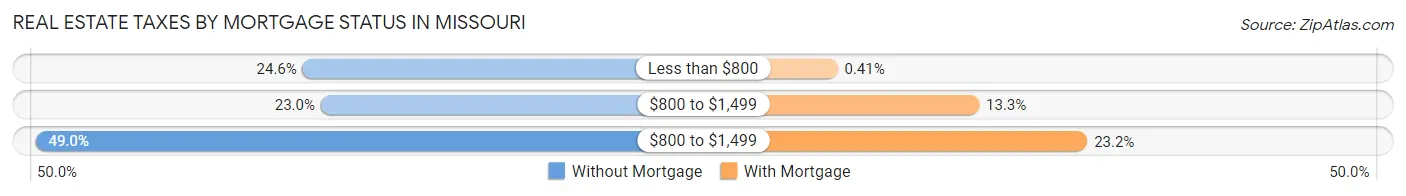
| Property Taxes | Without Mortgage | With Mortgage |
| Less than $800 | 159,955 (24.6%) | 4,114 (0.4%) |
| $800 to $1,499 | 149,148 (23.0%) | 134,983 (13.3%) |
| $800 to $1,499 | 318,452 (49.0%) | 234,848 (23.2%) |
| Total | 649,931 (100.0%) | 1,011,923 (100.0%) |
Health & Disability in Missouri
Health Insurance Coverage by Age in Missouri
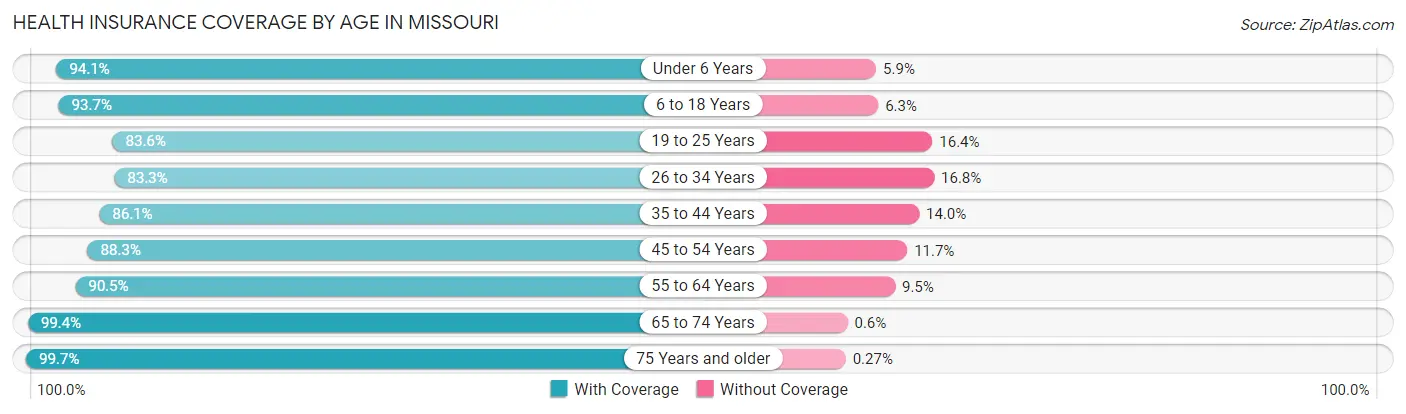
| Age Bracket | With Coverage | Without Coverage |
| Under 6 Years | 409,424 (94.1%) | 25,854 (5.9%) |
| 6 to 18 Years | 954,495 (93.7%) | 64,514 (6.3%) |
| 19 to 25 Years | 468,350 (83.6%) | 92,018 (16.4%) |
| 26 to 34 Years | 596,459 (83.3%) | 119,995 (16.8%) |
| 35 to 44 Years | 650,598 (86.1%) | 105,464 (14.0%) |
| 45 to 54 Years | 636,857 (88.3%) | 84,620 (11.7%) |
| 55 to 64 Years | 735,408 (90.5%) | 76,845 (9.5%) |
| 65 to 74 Years | 608,505 (99.4%) | 3,682 (0.6%) |
| 75 Years and older | 413,201 (99.7%) | 1,118 (0.3%) |
| Total | 5,473,297 (90.5%) | 574,110 (9.5%) |
Health Insurance Coverage by Citizenship Status in Missouri
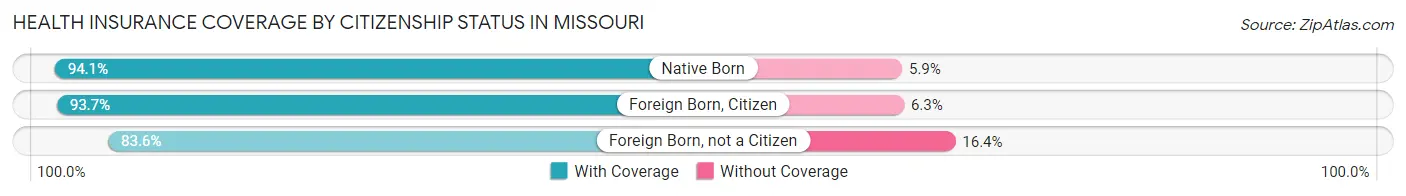
| Citizenship Status | With Coverage | Without Coverage |
| Native Born | 409,424 (94.1%) | 25,854 (5.9%) |
| Foreign Born, Citizen | 954,495 (93.7%) | 64,514 (6.3%) |
| Foreign Born, not a Citizen | 468,350 (83.6%) | 92,018 (16.4%) |
Health Insurance Coverage by Household Income in Missouri
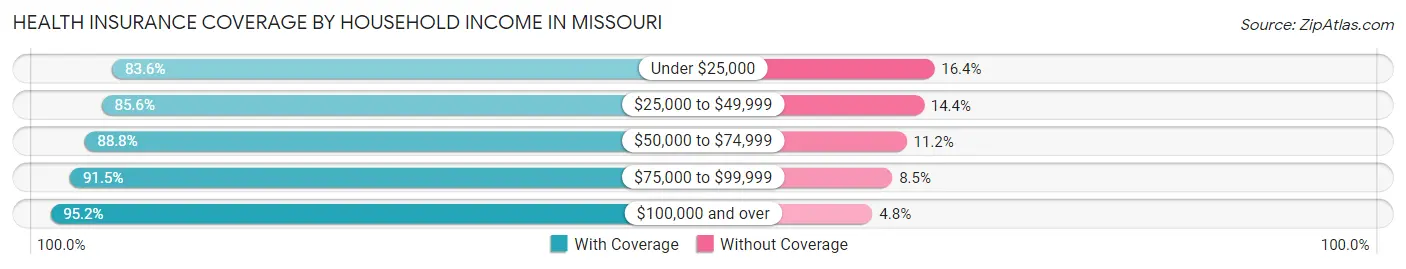
| Household Income | With Coverage | Without Coverage |
| Under $25,000 | 591,186 (83.6%) | 116,008 (16.4%) |
| $25,000 to $49,999 | 888,219 (85.6%) | 149,634 (14.4%) |
| $50,000 to $74,999 | 916,430 (88.8%) | 115,592 (11.2%) |
| $75,000 to $99,999 | 805,404 (91.5%) | 74,961 (8.5%) |
| $100,000 and over | 2,206,137 (95.2%) | 111,221 (4.8%) |
Public vs Private Health Insurance Coverage by Age in Missouri
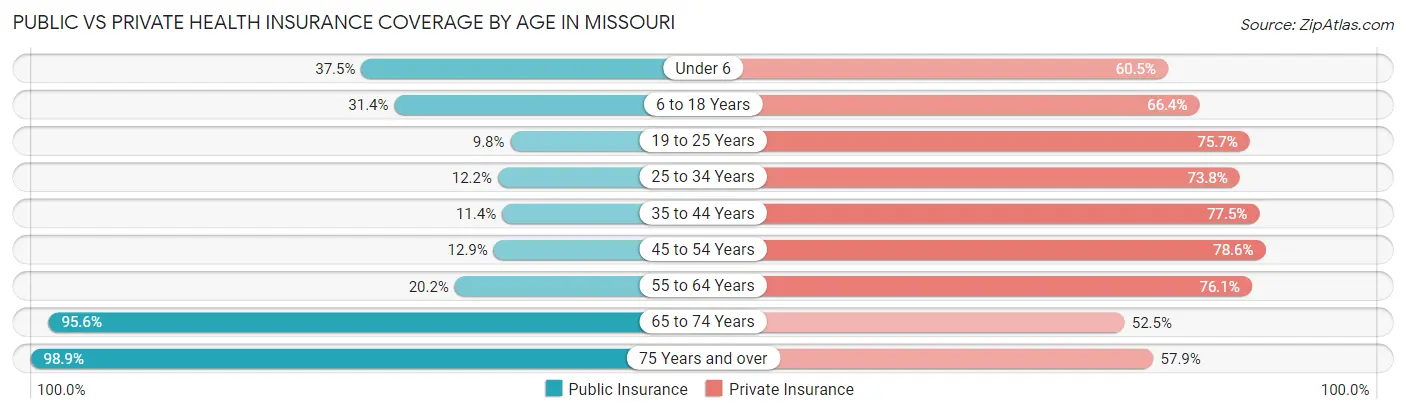
| Age Bracket | Public Insurance | Private Insurance |
| Under 6 | 163,272 (37.5%) | 263,420 (60.5%) |
| 6 to 18 Years | 319,613 (31.4%) | 676,097 (66.3%) |
| 19 to 25 Years | 55,107 (9.8%) | 424,147 (75.7%) |
| 25 to 34 Years | 87,107 (12.2%) | 529,012 (73.8%) |
| 35 to 44 Years | 86,130 (11.4%) | 585,758 (77.5%) |
| 45 to 54 Years | 93,355 (12.9%) | 567,115 (78.6%) |
| 55 to 64 Years | 163,859 (20.2%) | 617,697 (76.0%) |
| 65 to 74 Years | 585,034 (95.6%) | 321,606 (52.5%) |
| 75 Years and over | 409,735 (98.9%) | 239,823 (57.9%) |
| Total | 1,963,212 (32.5%) | 4,224,675 (69.9%) |
Disability Status by Sex by Age in Missouri
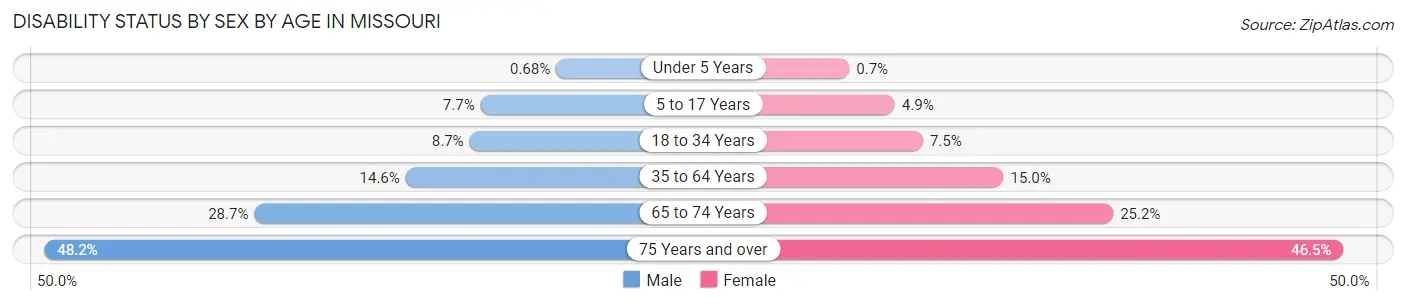
| Age Bracket | Male | Female |
| Under 5 Years | 1,259 (0.7%) | 1,229 (0.7%) |
| 5 to 17 Years | 39,870 (7.7%) | 24,306 (4.9%) |
| 18 to 34 Years | 59,155 (8.7%) | 51,282 (7.5%) |
| 35 to 64 Years | 165,158 (14.6%) | 174,372 (15.0%) |
| 65 to 74 Years | 82,364 (28.7%) | 81,875 (25.2%) |
| 75 Years and over | 82,674 (48.2%) | 112,946 (46.5%) |
Disability Class by Sex by Age in Missouri
Disability Class: Hearing Difficulty
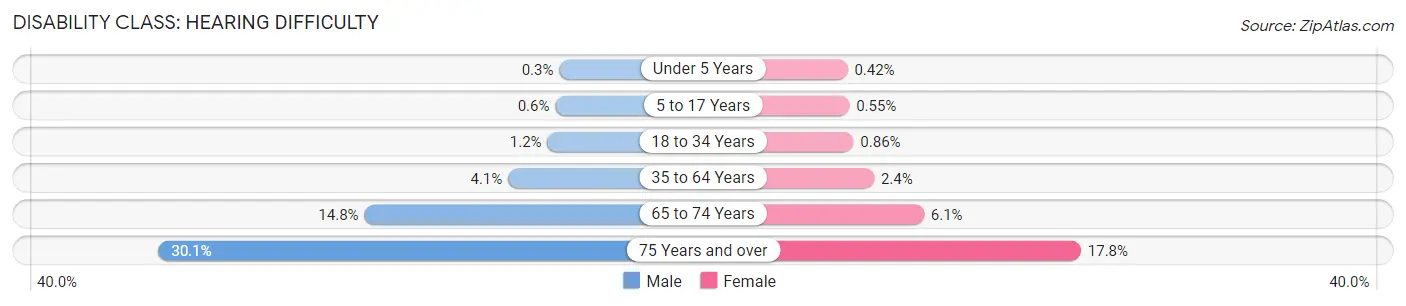
| Age Bracket | Male | Female |
| Under 5 Years | 548 (0.3%) | 736 (0.4%) |
| 5 to 17 Years | 3,106 (0.6%) | 2,729 (0.5%) |
| 18 to 34 Years | 7,974 (1.2%) | 5,884 (0.9%) |
| 35 to 64 Years | 46,236 (4.1%) | 27,752 (2.4%) |
| 65 to 74 Years | 42,399 (14.8%) | 19,797 (6.1%) |
| 75 Years and over | 51,616 (30.1%) | 43,063 (17.7%) |
Disability Class: Vision Difficulty
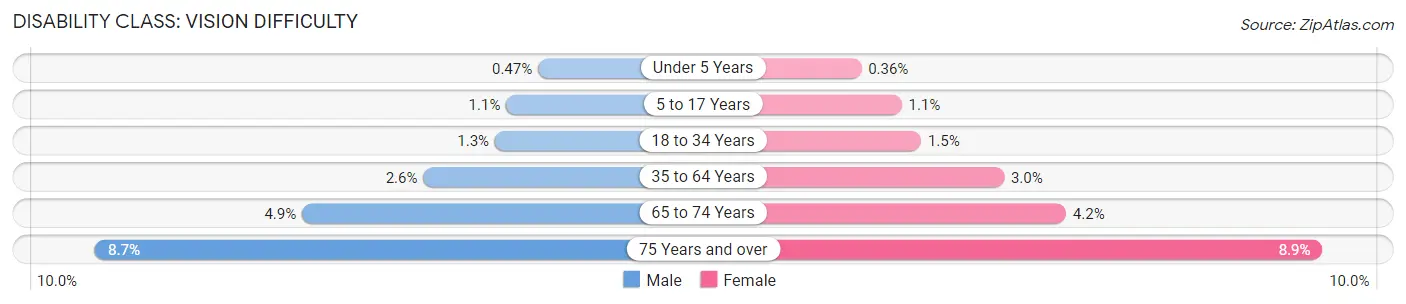
| Age Bracket | Male | Female |
| Under 5 Years | 868 (0.5%) | 633 (0.4%) |
| 5 to 17 Years | 5,505 (1.1%) | 5,461 (1.1%) |
| 18 to 34 Years | 8,616 (1.3%) | 10,011 (1.5%) |
| 35 to 64 Years | 29,316 (2.6%) | 34,905 (3.0%) |
| 65 to 74 Years | 13,939 (4.9%) | 13,510 (4.2%) |
| 75 Years and over | 14,911 (8.7%) | 21,656 (8.9%) |
Disability Class: Cognitive Difficulty
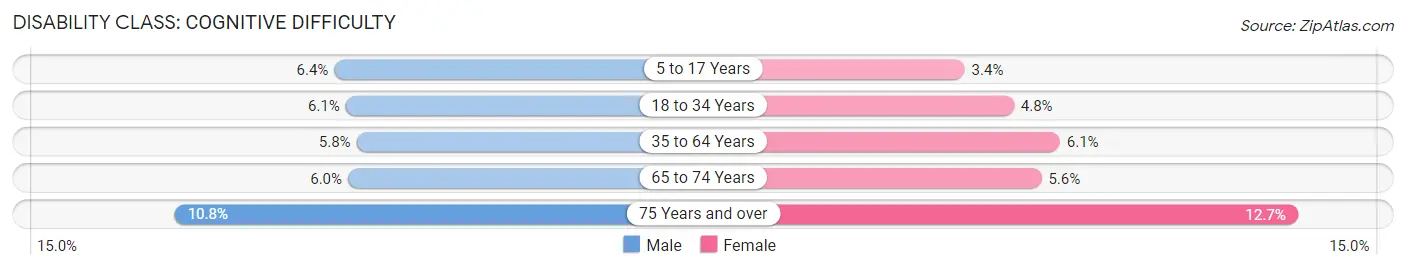
| Age Bracket | Male | Female |
| 5 to 17 Years | 33,100 (6.4%) | 16,854 (3.4%) |
| 18 to 34 Years | 41,108 (6.1%) | 32,671 (4.8%) |
| 35 to 64 Years | 65,012 (5.8%) | 70,512 (6.1%) |
| 65 to 74 Years | 17,235 (6.0%) | 18,090 (5.6%) |
| 75 Years and over | 18,577 (10.8%) | 30,805 (12.7%) |
Disability Class: Ambulatory Difficulty
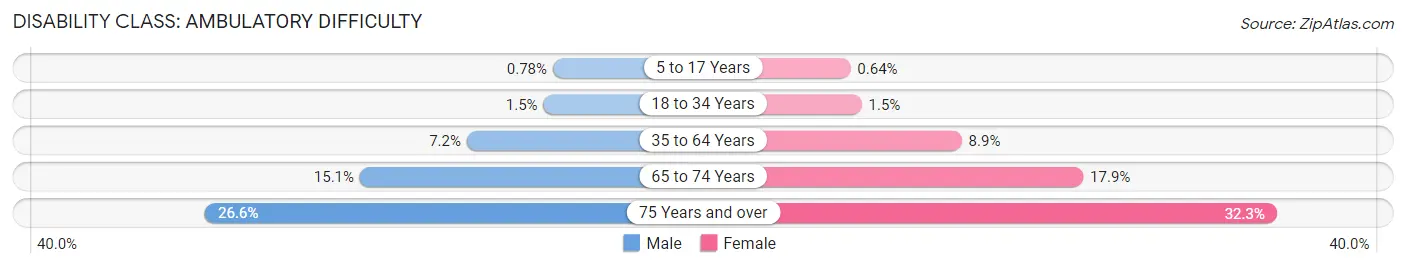
| Age Bracket | Male | Female |
| 5 to 17 Years | 4,054 (0.8%) | 3,145 (0.6%) |
| 18 to 34 Years | 10,040 (1.5%) | 10,026 (1.5%) |
| 35 to 64 Years | 80,909 (7.2%) | 103,365 (8.9%) |
| 65 to 74 Years | 43,376 (15.1%) | 58,253 (17.9%) |
| 75 Years and over | 45,655 (26.6%) | 78,365 (32.3%) |
Disability Class: Self-Care Difficulty
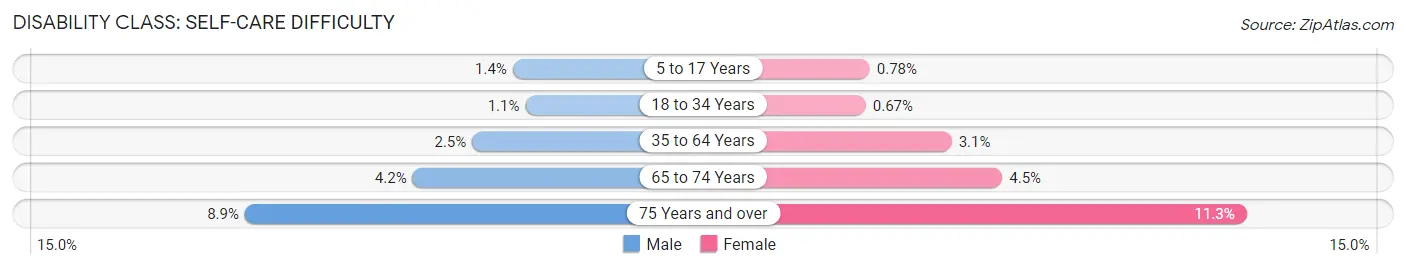
| Age Bracket | Male | Female |
| 5 to 17 Years | 7,314 (1.4%) | 3,826 (0.8%) |
| 18 to 34 Years | 7,217 (1.1%) | 4,539 (0.7%) |
| 35 to 64 Years | 28,665 (2.5%) | 35,504 (3.1%) |
| 65 to 74 Years | 12,070 (4.2%) | 14,522 (4.5%) |
| 75 Years and over | 15,218 (8.9%) | 27,337 (11.3%) |
Technology Access in Missouri
Computing Device Access in Missouri
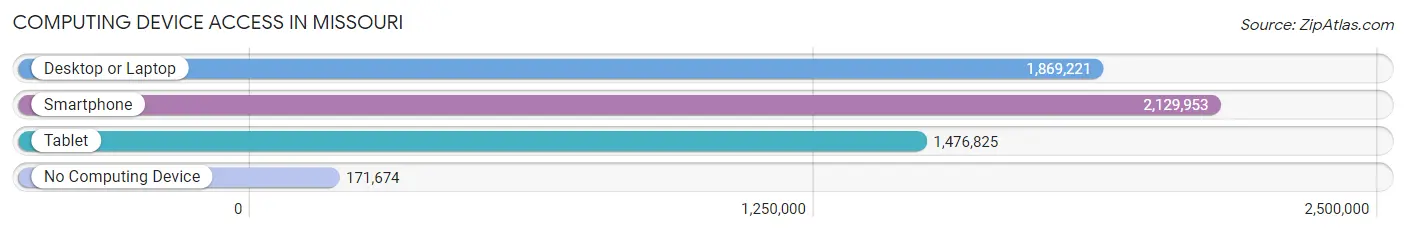
| Device Type | # Households | % Households |
| Desktop or Laptop | 1,869,221 | 76.0% |
| Smartphone | 2,129,953 | 86.6% |
| Tablet | 1,476,825 | 60.1% |
| No Computing Device | 171,674 | 7.0% |
| Total | 2,458,324 | 100.0% |
Internet Access in Missouri
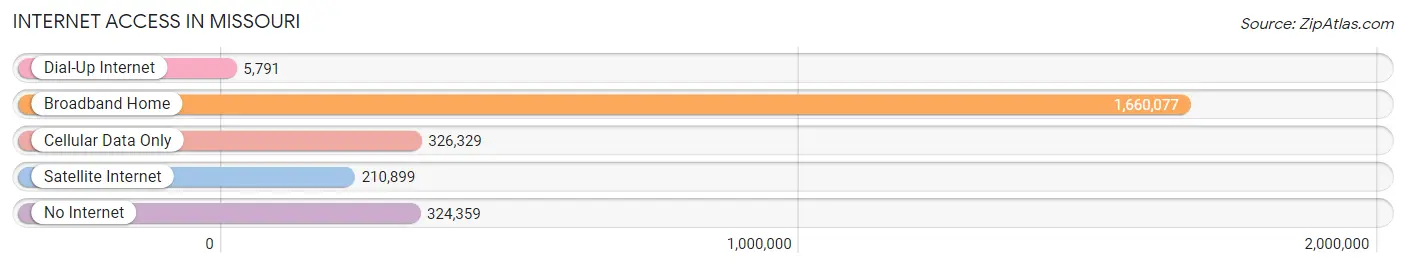
| Internet Type | # Households | % Households |
| Dial-Up Internet | 5,791 | 0.2% |
| Broadband Home | 1,660,077 | 67.5% |
| Cellular Data Only | 326,329 | 13.3% |
| Satellite Internet | 210,899 | 8.6% |
| No Internet | 324,359 | 13.2% |
| Total | 2,458,324 | 100.0% |
Missouri Summary
Missouri is a state located in the Midwestern United States. It is bordered by eight other states: Iowa to the north, Illinois, Kentucky, and Tennessee to the east, Arkansas to the south, and Oklahoma, Kansas, and Nebraska to the west. Missouri is the 18th most populous state in the United States, with a population of 6,063,589 as of 2019.
History
Missouri was first explored by Europeans in the early 1600s, when French explorers Louis Jolliet and Jacques Marquette traveled down the Mississippi River. The area was later claimed by France as part of the Louisiana Purchase in 1803. Missouri became a state in 1821 as part of the Missouri Compromise, which allowed Missouri to enter the Union as a slave state.
During the Civil War, Missouri was a border state, with both Union and Confederate forces occupying the state. After the war, Missouri was the first state to be readmitted to the Union.
Geography
Missouri is located in the Midwestern United States, and is bordered by eight other states. It is the 21st largest state in the United States, with an area of 69,709 square miles. Missouri is divided into 114 counties and one independent city, St. Louis.
The state is divided into two distinct regions: the Ozarks in the south and the Great Plains in the north. The Ozarks are a rugged, hilly region, while the Great Plains are flat and rolling. The highest point in the state is Taum Sauk Mountain, at 1,772 feet.
The Missouri River is the longest river in the state, and is a major tributary of the Mississippi River. Other major rivers in the state include the Osage, Gasconade, and Meramec Rivers.
Economy
Missouri’s economy is largely based on agriculture, manufacturing, and services. The state’s major agricultural products include soybeans, corn, wheat, and hay. Missouri is also a major producer of beef, pork, and poultry.
Manufacturing is a major part of the state’s economy, with major industries including aerospace, automotive, chemicals, food processing, and printing. Missouri is also home to several major corporations, including Anheuser-Busch, Express Scripts, and Monsanto.
The state’s service sector is also important, with major industries including finance, insurance, real estate, and tourism.
Demographics
As of 2019, Missouri had a population of 6,063,589. The state’s population is largely white (83.2%), with African Americans making up 11.7% of the population. Other racial groups include Hispanics (3.2%), Asians (2.2%), and Native Americans (0.4%).
The median household income in Missouri is $51,746, and the median home value is $153,400. The state’s poverty rate is 13.4%.
The largest cities in Missouri are Kansas City (482,000), St. Louis (311,000), Springfield (167,000), and Independence (117,000).
Common Questions
When was Missouri Incorporated?
Missouri was Incorporated into the Union on Aug 10, 1821.
What is the Total Area of Missouri?
Total Area of Missouri is 69,702 Square Miles.
What is the Total Land Area of Missouri?
Total Land Area of Missouri is 68,716 Square Miles.
What is the Total Water Area of Missouri?
Total Water Area of Missouri is 987 Square Miles.
What is the Average Elevation in Missouri?
Average Elevation in Missouri is 800 Feet.
What is the Highest Elevation in Missouri?
Highest Elevation in Missouri is 1,772 Feet.
What is the Lowest Elevation in Missouri?
Lowest Elevation in Missouri is 230 Feet.
What is the Population Density in Missouri?
Population Density in Missouri is 89.6 People per Square Mile.
What is Per Capita Income in Missouri?
Per Capita income in Missouri is $36,754.
What is the Median Family Income in Missouri?
Median Family Income in Missouri is $84,745.
What is the Median Household income in Missouri?
Median Household Income in Missouri is $65,920.
What is Income or Wage Gap in Missouri?
Income or Wage Gap in Missouri is 27.1%.
Women in Missouri earn 72.9 cents for every dollar earned by a man.
What is Family Income Deficit in Missouri?
Family Income Deficit in Missouri is $10,558.
Families that are below poverty line in Missouri earn $10,558 less on average than the poverty threshold level.
What is Inequality or Gini Index in Missouri?
Inequality or Gini Index in Missouri is 0.47.
What is the Total Population of Missouri?
Total Population of Missouri is 6,154,422.
What is the Total Male Population of Missouri?
Total Male Population of Missouri is 3,039,220.
What is the Total Female Population of Missouri?
Total Female Population of Missouri is 3,115,202.
What is the Ratio of Males per 100 Females in Missouri?
There are 97.56 Males per 100 Females in Missouri.
What is the Ratio of Females per 100 Males in Missouri?
There are 102.50 Females per 100 Males in Missouri.
What is the Median Population Age in Missouri?
Median Population Age in Missouri is 38.8 Years.
What is the Average Family Size in Missouri
Average Family Size in Missouri is 3.1 People.
What is the Average Household Size in Missouri
Average Household Size in Missouri is 2.4 People.
How Large is the Labor Force in Missouri?
There are 3,107,508 People in the Labor Forcein in Missouri.
What is the Percentage of People in the Labor Force in Missouri?
62.9% of People are in the Labor Force in Missouri.
What is the Unemployment Rate in Missouri?
Unemployment Rate in Missouri is 4.3%.