Cities with the Highest Inequality / Gini Index in the United States
RELATED REPORTS & OPTIONS
Highest Inequality / Gini Index
United States
Compare Cities
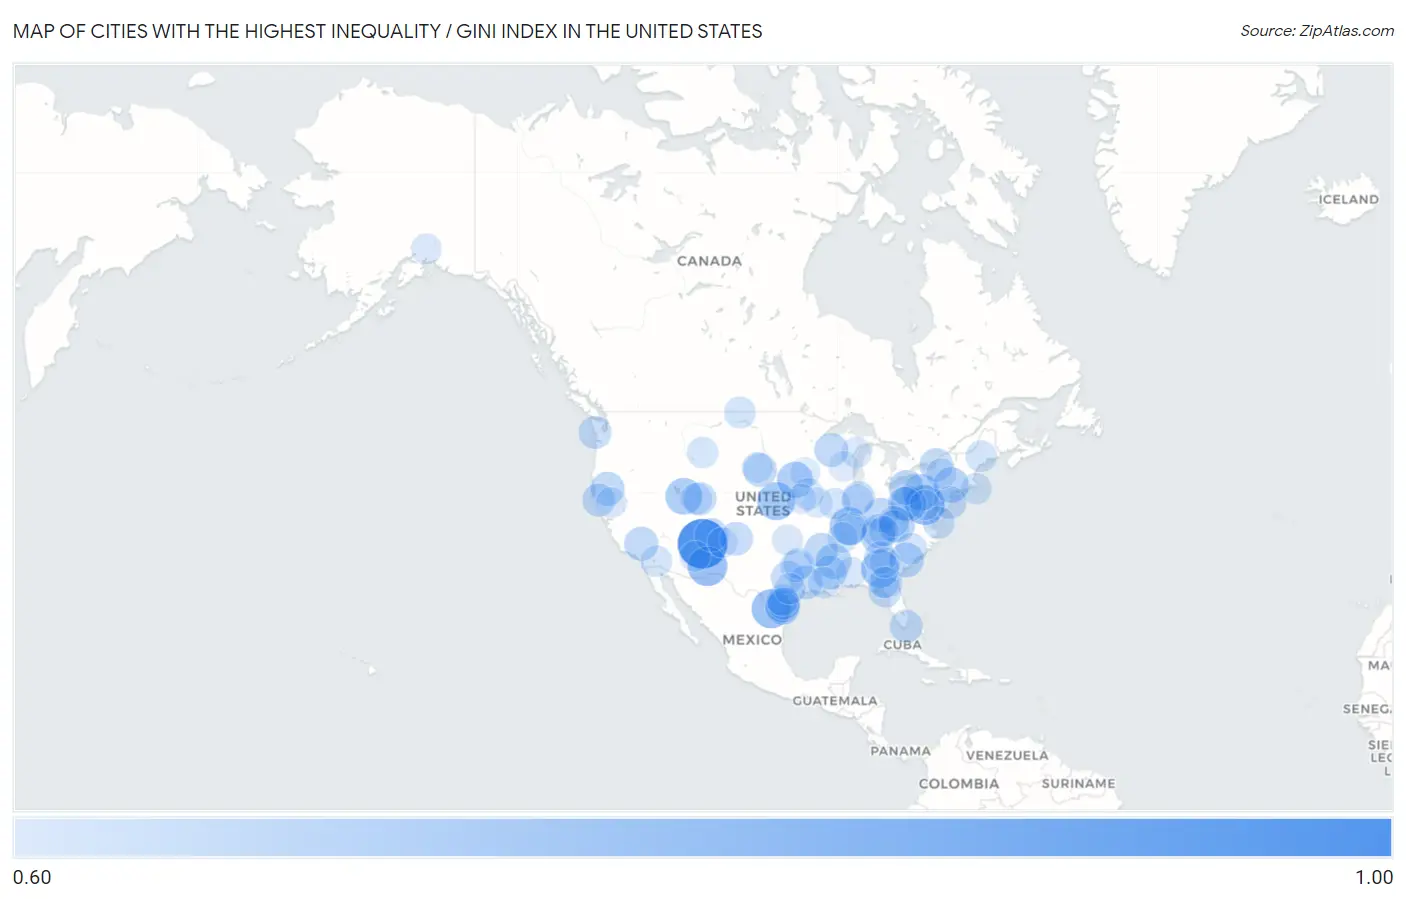
Map of Cities with the Highest Inequality / Gini Index in the United States
0.00
1.00
Cities with the Highest Inequality / Gini Index in the United States
| City | Inequality / Gini Index | vs State | vs National | |
| 1. | Lupton | 1.00 | 0.46(+0.539)#1 | 0.48(+0.517)#1 |
| 2. | Janesville | 0.83 | 0.48(+0.352)#1 | 0.48(+0.350)#2 |
| 3. | Cearfoss | 0.83 | 0.46(+0.376)#1 | 0.48(+0.349)#3 |
| 4. | Rosedale | 0.83 | 0.48(+0.354)#1 | 0.48(+0.347)#4 |
| 5. | San Carlos Ii | 0.82 | 0.48(+0.346)#1 | 0.48(+0.339)#5 |
| 6. | Inavale | 0.80 | 0.45(+0.349)#1 | 0.48(+0.319)#6 |
| 7. | Burna | 0.80 | 0.48(+0.325)#1 | 0.48(+0.319)#7 |
| 8. | Marshallville | 0.80 | 0.48(+0.320)#1 | 0.48(+0.316)#8 |
| 9. | Riverview Colony | 0.79 | 0.46(+0.324)#1 | 0.48(+0.306)#9 |
| 10. | Serena | 0.78 | 0.48(+0.301)#2 | 0.48(+0.300)#10 |
| 11. | Alta | 0.78 | 0.43(+0.351)#1 | 0.48(+0.297)#11 |
| 12. | Kylertown | 0.78 | 0.47(+0.304)#1 | 0.48(+0.295)#12 |
| 13. | Oto | 0.77 | 0.44(+0.329)#1 | 0.48(+0.290)#13 |
| 14. | Mapletown | 0.76 | 0.47(+0.291)#2 | 0.48(+0.281)#14 |
| 15. | Pelkie | 0.76 | 0.46(+0.296)#1 | 0.48(+0.277)#15 |
| 16. | Isola | 0.76 | 0.48(+0.276)#1 | 0.48(+0.276)#16 |
| 17. | Rifton | 0.76 | 0.51(+0.244)#1 | 0.48(+0.276)#17 |
| 18. | New Miami Colony | 0.76 | 0.46(+0.294)#2 | 0.48(+0.276)#18 |
| 19. | Galt | 0.75 | 0.48(+0.272)#3 | 0.48(+0.270)#19 |
| 20. | Adamsville | 0.75 | 0.47(+0.278)#3 | 0.48(+0.268)#20 |
| 21. | Kimball | 0.75 | 0.47(+0.279)#1 | 0.48(+0.267)#21 |
| 22. | Vance | 0.75 | 0.48(+0.272)#1 | 0.48(+0.266)#22 |
| 23. | Sandy Hollow Escondidas | 0.75 | 0.48(+0.272)#2 | 0.48(+0.265)#23 |
| 24. | La Paloma Lost Creek | 0.75 | 0.48(+0.271)#3 | 0.48(+0.264)#24 |
| 25. | Eagle Creek Colony | 0.75 | 0.46(+0.281)#3 | 0.48(+0.262)#25 |
| 26. | Groverton | 0.74 | 0.45(+0.291)#1 | 0.48(+0.260)#26 |
| 27. | Petros | 0.74 | 0.48(+0.266)#1 | 0.48(+0.260)#27 |
| 28. | Mays Lick | 0.74 | 0.48(+0.264)#2 | 0.48(+0.258)#28 |
| 29. | Pleasant View | 0.74 | 0.48(+0.264)#3 | 0.48(+0.257)#29 |
| 30. | Cameron | 0.74 | 0.47(+0.265)#2 | 0.48(+0.254)#30 |
| 31. | Port Gibson | 0.74 | 0.48(+0.253)#2 | 0.48(+0.254)#31 |
| 32. | Johannesburg | 0.74 | 0.49(+0.247)#1 | 0.48(+0.253)#32 |
| 33. | Weed | 0.74 | 0.49(+0.246)#2 | 0.48(+0.253)#33 |
| 34. | Sweet Home | 0.74 | 0.48(+0.253)#1 | 0.48(+0.252)#34 |
| 35. | Jump River | 0.73 | 0.44(+0.291)#1 | 0.48(+0.252)#35 |
| 36. | Bond | 0.73 | 0.48(+0.250)#3 | 0.48(+0.251)#36 |
| 37. | Soldier Creek | 0.73 | 0.45(+0.288)#1 | 0.48(+0.250)#37 |
| 38. | Coker Creek | 0.73 | 0.48(+0.254)#2 | 0.48(+0.247)#38 |
| 39. | Henderson | 0.73 | 0.51(+0.214)#2 | 0.48(+0.246)#39 |
| 40. | Woodville | 0.73 | 0.48(+0.252)#4 | 0.48(+0.246)#40 |
| 41. | El Veintiséis | 0.73 | 0.54(+0.184)#1 | 0.48(+0.246)#41 |
| 42. | Nageezi | 0.73 | 0.48(+0.251)#2 | 0.48(+0.245)#42 |
| 43. | Roy | 0.73 | 0.48(+0.251)#3 | 0.48(+0.244)#43 |
| 44. | Alderpoint | 0.72 | 0.49(+0.234)#3 | 0.48(+0.241)#44 |
| 45. | Jensen | 0.72 | 0.43(+0.293)#2 | 0.48(+0.239)#45 |
| 46. | Silver Ridge | 0.72 | 0.48(+0.240)#1 | 0.48(+0.238)#46 |
| 47. | Gilbertsville | 0.72 | 0.48(+0.244)#4 | 0.48(+0.238)#47 |
| 48. | Oyehut | 0.72 | 0.46(+0.256)#1 | 0.48(+0.237)#48 |
| 49. | North Key Largo | 0.72 | 0.49(+0.233)#1 | 0.48(+0.236)#49 |
| 50. | Dellrose | 0.72 | 0.48(+0.242)#3 | 0.48(+0.236)#50 |
| 51. | Chilton | 0.72 | 0.48(+0.242)#5 | 0.48(+0.235)#51 |
| 52. | Tarsney Lakes | 0.72 | 0.47(+0.250)#1 | 0.48(+0.234)#52 |
| 53. | Rectortown | 0.72 | 0.47(+0.243)#1 | 0.48(+0.233)#53 |
| 54. | White Oak | 0.71 | 0.47(+0.248)#2 | 0.48(+0.231)#54 |
| 55. | Montmorenci | 0.71 | 0.45(+0.261)#2 | 0.48(+0.230)#55 |
| 56. | Steinhatchee | 0.71 | 0.49(+0.227)#2 | 0.48(+0.229)#56 |
| 57. | Lakeview Estates | 0.71 | 0.48(+0.232)#2 | 0.48(+0.228)#57 |
| 58. | Fruitvale | 0.71 | 0.48(+0.229)#6 | 0.48(+0.223)#58 |
| 59. | Lake Park | 0.71 | 0.48(+0.227)#3 | 0.48(+0.223)#59 |
| 60. | St Paul | 0.71 | 0.48(+0.229)#7 | 0.48(+0.222)#60 |
| 61. | Green Lane Borough | 0.70 | 0.47(+0.232)#4 | 0.48(+0.222)#61 |
| 62. | Lee Mont | 0.70 | 0.47(+0.232)#2 | 0.48(+0.221)#62 |
| 63. | Vansant | 0.70 | 0.47(+0.230)#3 | 0.48(+0.219)#63 |
| 64. | Fort Duchesne | 0.70 | 0.43(+0.272)#3 | 0.48(+0.218)#64 |
| 65. | Gibson | 0.70 | 0.48(+0.222)#1 | 0.48(+0.217)#65 |
| 66. | Pettus | 0.70 | 0.48(+0.223)#8 | 0.48(+0.216)#66 |
| 67. | Palmetto | 0.70 | 0.50(+0.204)#1 | 0.48(+0.216)#67 |
| 68. | Como | 0.70 | 0.48(+0.223)#9 | 0.48(+0.216)#68 |
| 69. | Niland | 0.70 | 0.49(+0.209)#4 | 0.48(+0.215)#69 |
| 70. | Fortuna | 0.70 | 0.45(+0.245)#1 | 0.48(+0.214)#70 |
| 71. | Norridgewock | 0.70 | 0.46(+0.239)#1 | 0.48(+0.213)#71 |
| 72. | Mellott | 0.70 | 0.45(+0.244)#3 | 0.48(+0.213)#72 |
| 73. | Round Top | 0.70 | 0.48(+0.219)#10 | 0.48(+0.213)#73 |
| 74. | Tingley | 0.69 | 0.44(+0.252)#2 | 0.48(+0.212)#74 |
| 75. | Concord | 0.69 | 0.48(+0.213)#4 | 0.48(+0.211)#75 |
| 76. | Cass | 0.69 | 0.45(+0.242)#4 | 0.48(+0.211)#76 |
| 77. | Isleta | 0.69 | 0.54(+0.148)#2 | 0.48(+0.210)#77 |
| 78. | Belfry | 0.69 | 0.46(+0.227)#4 | 0.48(+0.209)#78 |
| 79. | Edgartown | 0.69 | 0.49(+0.204)#1 | 0.48(+0.209)#79 |
| 80. | Quitman | 0.69 | 0.48(+0.213)#4 | 0.48(+0.209)#80 |
| 81. | Edgemont | 0.69 | 0.48(+0.209)#2 | 0.48(+0.208)#81 |
| 82. | Corn Creek | 0.69 | 0.45(+0.243)#2 | 0.48(+0.205)#82 |
| 83. | Rainbow City | 0.69 | 0.46(+0.227)#2 | 0.48(+0.205)#83 |
| 84. | Holden | 0.69 | 0.47(+0.216)#3 | 0.48(+0.205)#84 |
| 85. | Dyersburg | 0.69 | 0.48(+0.211)#4 | 0.48(+0.204)#85 |
| 86. | Warwick | 0.69 | 0.47(+0.219)#1 | 0.48(+0.203)#86 |
| 87. | Putnam | 0.69 | 0.48(+0.206)#1 | 0.48(+0.203)#87 |
| 88. | Cohasset | 0.68 | 0.49(+0.195)#5 | 0.48(+0.202)#88 |
| 89. | Egg Harbor | 0.68 | 0.44(+0.240)#2 | 0.48(+0.201)#89 |
| 90. | Milledgeville | 0.68 | 0.48(+0.205)#5 | 0.48(+0.200)#90 |
| 91. | The University Of Virginia's College At Wise | 0.68 | 0.47(+0.209)#4 | 0.48(+0.199)#91 |
| 92. | Oriskany Falls | 0.68 | 0.51(+0.166)#3 | 0.48(+0.198)#92 |
| 93. | Madrid | 0.68 | 0.48(+0.204)#4 | 0.48(+0.198)#93 |
| 94. | Glacier View | 0.68 | 0.43(+0.250)#1 | 0.48(+0.197)#94 |
| 95. | Marquette | 0.68 | 0.44(+0.236)#3 | 0.48(+0.196)#95 |
| 96. | Ethel | 0.68 | 0.47(+0.213)#3 | 0.48(+0.196)#96 |
| 97. | Rodman | 0.68 | 0.44(+0.235)#3 | 0.48(+0.196)#97 |
| 98. | Pathfork | 0.68 | 0.48(+0.201)#5 | 0.48(+0.195)#98 |
| 99. | Skidmore | 0.68 | 0.47(+0.211)#4 | 0.48(+0.194)#99 |
| 100. | Leitersburg | 0.68 | 0.46(+0.221)#2 | 0.48(+0.194)#100 |
Common Questions
What are the Top 10 Cities with the Highest Inequality / Gini Index in the United States?
Top 10 Cities with the Highest Inequality / Gini Index in the United States are:
What city has the Highest Inequality / Gini Index in the United States?
Lupton has the Highest Inequality / Gini Index in the United States with 1.00.
What is the Inequality / Gini Index in the United States?
Inequality / Gini Index in the United States is 0.48.