Cities with the Highest Percentage of Immigrants from Azores in the United States
RELATED REPORTS & OPTIONS
Azores
United States
Compare Cities
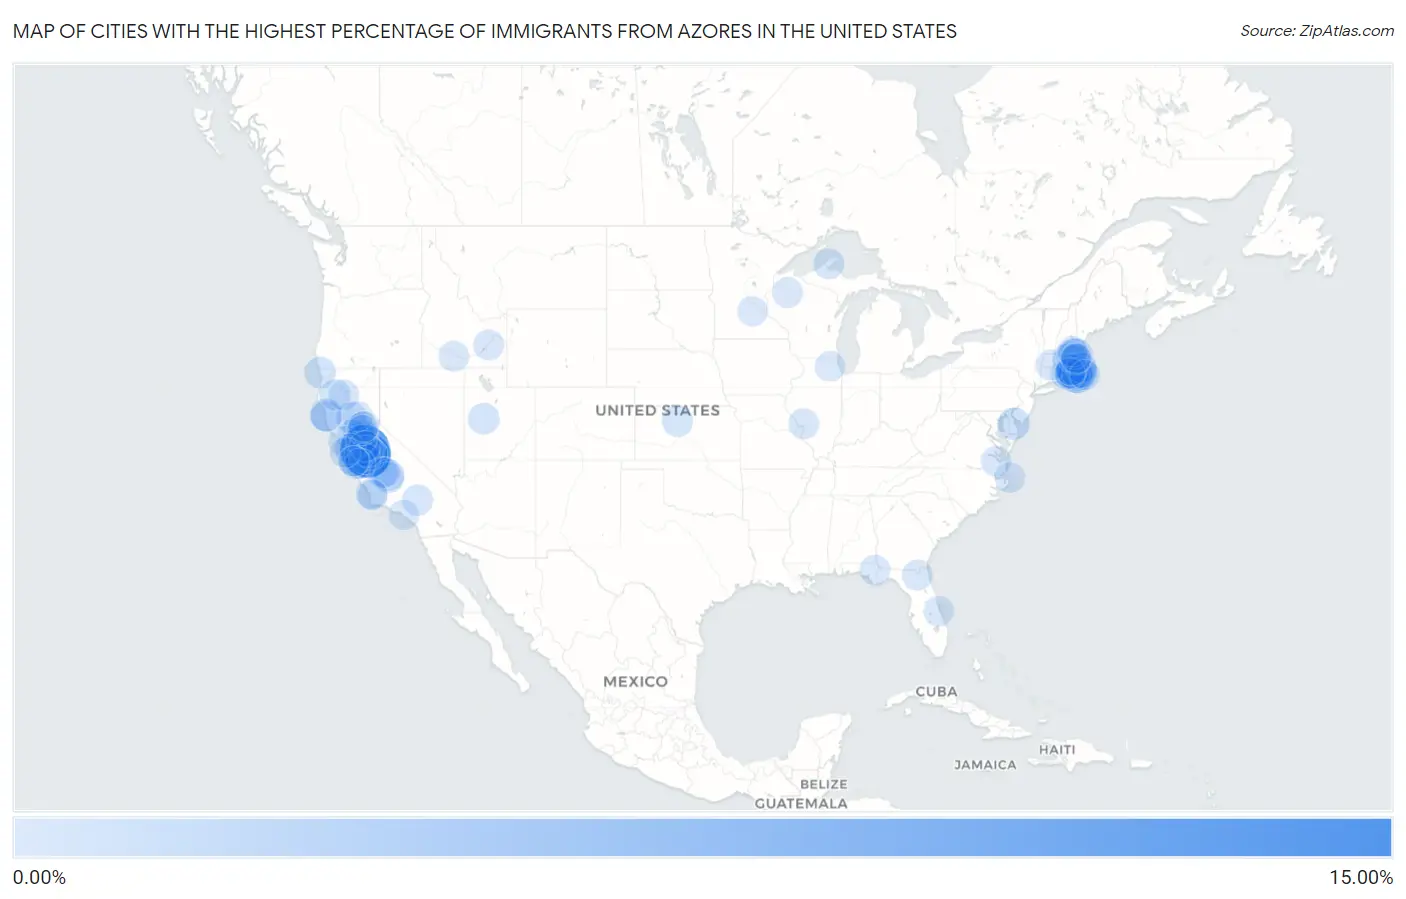
Map of Cities with the Highest Percentage of Immigrants from Azores in the United States
0.00%
15.00%
Cities with the Highest Percentage of Immigrants from Azores in the United States
| City | Azores | vs State | vs National | |
| 1. | Cowan | 11.03% | 0.022%(+11.0)#1 | 0.0078%(+11.0)#1 |
| 2. | Hilmar Irwin | 9.13% | 0.022%(+9.11)#2 | 0.0078%(+9.12)#2 |
| 3. | Stevinson | 9.09% | 0.022%(+9.07)#3 | 0.0078%(+9.08)#3 |
| 4. | Fall River | 4.47% | 0.15%(+4.32)#1 | 0.0078%(+4.46)#4 |
| 5. | Ballico | 3.93% | 0.022%(+3.90)#4 | 0.0078%(+3.92)#5 |
| 6. | East Providence | 2.55% | 0.35%(+2.21)#1 | 0.0078%(+2.55)#6 |
| 7. | Bliss Corner | 2.16% | 0.15%(+2.01)#2 | 0.0078%(+2.16)#7 |
| 8. | North Westport | 1.82% | 0.15%(+1.67)#3 | 0.0078%(+1.82)#8 |
| 9. | Boxford | 1.66% | 0.15%(+1.50)#4 | 0.0078%(+1.65)#9 |
| 10. | Franklin Cdp Merced County | 1.50% | 0.022%(+1.48)#5 | 0.0078%(+1.50)#10 |
| 11. | Somerset | 1.49% | 0.15%(+1.33)#5 | 0.0078%(+1.48)#11 |
| 12. | Cleone | 1.42% | 0.022%(+1.40)#6 | 0.0078%(+1.41)#12 |
| 13. | Cornwall Bridge | 1.31% | 0.0066%(+1.30)#1 | 0.0078%(+1.30)#13 |
| 14. | Hudson | 1.28% | 0.15%(+1.12)#6 | 0.0078%(+1.27)#14 |
| 15. | Bowers | 1.19% | 0.00040%(+1.19)#1 | 0.0078%(+1.18)#15 |
| 16. | Newman | 0.98% | 0.022%(+0.956)#7 | 0.0078%(+0.970)#16 |
| 17. | Loganton Borough | 0.95% | 0.0018%(+0.951)#1 | 0.0078%(+0.945)#17 |
| 18. | New Bedford | 0.94% | 0.15%(+0.789)#7 | 0.0078%(+0.935)#18 |
| 19. | North Plymouth | 0.93% | 0.15%(+0.774)#8 | 0.0078%(+0.920)#19 |
| 20. | Clay | 0.89% | 0.022%(+0.870)#8 | 0.0078%(+0.884)#20 |
| 21. | Roseto Borough | 0.87% | 0.0018%(+0.870)#2 | 0.0078%(+0.864)#21 |
| 22. | Bayview Cdp Humboldt County | 0.81% | 0.022%(+0.787)#9 | 0.0078%(+0.801)#22 |
| 23. | Taunton | 0.79% | 0.15%(+0.637)#9 | 0.0078%(+0.783)#23 |
| 24. | Atwater | 0.77% | 0.022%(+0.747)#10 | 0.0078%(+0.762)#24 |
| 25. | Crescent City | 0.77% | 0.022%(+0.746)#11 | 0.0078%(+0.760)#25 |
| 26. | Los Banos | 0.77% | 0.022%(+0.744)#12 | 0.0078%(+0.758)#26 |
| 27. | Hinckley | 0.76% | 0.00073%(+0.759)#1 | 0.0078%(+0.752)#27 |
| 28. | Greene | 0.75% | 0.35%(+0.398)#2 | 0.0078%(+0.740)#28 |
| 29. | Elverta | 0.74% | 0.022%(+0.723)#13 | 0.0078%(+0.737)#29 |
| 30. | Denair | 0.72% | 0.022%(+0.701)#14 | 0.0078%(+0.715)#30 |
| 31. | Galt | 0.71% | 0.022%(+0.688)#15 | 0.0078%(+0.702)#31 |
| 32. | Winton | 0.70% | 0.022%(+0.679)#16 | 0.0078%(+0.693)#32 |
| 33. | Tiverton | 0.65% | 0.35%(+0.305)#3 | 0.0078%(+0.646)#33 |
| 34. | Fort Bragg | 0.63% | 0.022%(+0.606)#17 | 0.0078%(+0.620)#34 |
| 35. | Tulare | 0.63% | 0.022%(+0.603)#18 | 0.0078%(+0.617)#35 |
| 36. | Hayfork | 0.62% | 0.022%(+0.598)#19 | 0.0078%(+0.612)#36 |
| 37. | Patterson | 0.61% | 0.022%(+0.590)#20 | 0.0078%(+0.605)#37 |
| 38. | Attleboro | 0.60% | 0.15%(+0.443)#10 | 0.0078%(+0.589)#38 |
| 39. | Princeton | 0.56% | 0.022%(+0.538)#21 | 0.0078%(+0.552)#39 |
| 40. | Ocean Grove | 0.56% | 0.15%(+0.403)#11 | 0.0078%(+0.550)#40 |
| 41. | West Wareham | 0.54% | 0.15%(+0.383)#12 | 0.0078%(+0.530)#41 |
| 42. | Pawtucket | 0.51% | 0.35%(+0.158)#4 | 0.0078%(+0.499)#42 |
| 43. | Silver Lakes | 0.51% | 0.022%(+0.484)#22 | 0.0078%(+0.498)#43 |
| 44. | Natoma | 0.50% | 0.00041%(+0.500)#1 | 0.0078%(+0.492)#44 |
| 45. | Turlock | 0.50% | 0.022%(+0.476)#23 | 0.0078%(+0.490)#45 |
| 46. | Penryn | 0.45% | 0.022%(+0.428)#24 | 0.0078%(+0.442)#46 |
| 47. | Valley Falls | 0.43% | 0.35%(+0.081)#5 | 0.0078%(+0.423)#47 |
| 48. | Hartley | 0.43% | 0.022%(+0.406)#25 | 0.0078%(+0.420)#48 |
| 49. | Laurium | 0.42% | 0.00030%(+0.419)#1 | 0.0078%(+0.412)#49 |
| 50. | Tipton | 0.41% | 0.022%(+0.388)#26 | 0.0078%(+0.402)#50 |
| 51. | Prunedale | 0.40% | 0.022%(+0.375)#27 | 0.0078%(+0.390)#51 |
| 52. | Novato | 0.38% | 0.022%(+0.357)#28 | 0.0078%(+0.371)#52 |
| 53. | Lemoore | 0.38% | 0.022%(+0.356)#29 | 0.0078%(+0.371)#53 |
| 54. | Brighton | 0.37% | 0.00021%(+0.369)#1 | 0.0078%(+0.361)#54 |
| 55. | East Camden | 0.36% | 0.00068%(+0.362)#1 | 0.0078%(+0.355)#55 |
| 56. | Central Falls | 0.36% | 0.35%(+0.013)#6 | 0.0078%(+0.354)#56 |
| 57. | Woodbridge | 0.36% | 0.022%(+0.340)#30 | 0.0078%(+0.354)#57 |
| 58. | Santa Nella | 0.34% | 0.022%(+0.319)#31 | 0.0078%(+0.333)#58 |
| 59. | Westfield | 0.34% | 0.15%(+0.182)#13 | 0.0078%(+0.328)#59 |
| 60. | Grover Beach | 0.33% | 0.022%(+0.307)#32 | 0.0078%(+0.321)#60 |
| 61. | Blackfoot | 0.32% | 0.0075%(+0.308)#1 | 0.0078%(+0.308)#61 |
| 62. | Reserve | 0.31% | 0.00002%(+0.310)#1 | 0.0078%(+0.302)#62 |
| 63. | Buzzards Bay | 0.30% | 0.15%(+0.147)#14 | 0.0078%(+0.293)#63 |
| 64. | Somerville | 0.29% | 0.15%(+0.139)#15 | 0.0078%(+0.286)#64 |
| 65. | Shasta | 0.29% | 0.022%(+0.269)#33 | 0.0078%(+0.283)#65 |
| 66. | Cherryland | 0.29% | 0.022%(+0.268)#34 | 0.0078%(+0.283)#66 |
| 67. | Lowell | 0.29% | 0.15%(+0.133)#16 | 0.0078%(+0.279)#67 |
| 68. | Buhl | 0.28% | 0.0075%(+0.277)#2 | 0.0078%(+0.276)#68 |
| 69. | Escalon | 0.28% | 0.022%(+0.260)#35 | 0.0078%(+0.274)#69 |
| 70. | Glen St Mary | 0.28% | 0.0024%(+0.279)#1 | 0.0078%(+0.273)#70 |
| 71. | Palermo | 0.27% | 0.022%(+0.250)#36 | 0.0078%(+0.264)#71 |
| 72. | Newcastle | 0.27% | 0.022%(+0.244)#37 | 0.0078%(+0.259)#72 |
| 73. | South Duxbury | 0.26% | 0.15%(+0.110)#17 | 0.0078%(+0.256)#73 |
| 74. | Freedom | 0.24% | 0.022%(+0.216)#38 | 0.0078%(+0.230)#74 |
| 75. | Ridgemark | 0.23% | 0.022%(+0.210)#39 | 0.0078%(+0.224)#75 |
| 76. | Acushnet Center | 0.22% | 0.15%(+0.067)#18 | 0.0078%(+0.213)#76 |
| 77. | Hanford | 0.22% | 0.022%(+0.197)#40 | 0.0078%(+0.211)#77 |
| 78. | Cranston | 0.21% | 0.35%(-0.135)#7 | 0.0078%(+0.206)#78 |
| 79. | Union Beach Borough | 0.21% | 0.0037%(+0.205)#1 | 0.0078%(+0.201)#79 |
| 80. | Madera Ranchos | 0.21% | 0.022%(+0.187)#41 | 0.0078%(+0.201)#80 |
| 81. | Methuen Town | 0.21% | 0.15%(+0.052)#19 | 0.0078%(+0.199)#81 |
| 82. | St Bonifacius | 0.20% | 0.00007%(+0.204)#1 | 0.0078%(+0.197)#82 |
| 83. | South Lakes | 0.20% | 0.0018%(+0.201)#1 | 0.0078%(+0.195)#83 |
| 84. | Watsonville | 0.20% | 0.022%(+0.178)#42 | 0.0078%(+0.192)#84 |
| 85. | Half Moon Bay | 0.20% | 0.022%(+0.176)#43 | 0.0078%(+0.190)#85 |
| 86. | Kill Devil Hills | 0.20% | 0.00069%(+0.195)#1 | 0.0078%(+0.188)#86 |
| 87. | Altha | 0.19% | 0.0024%(+0.188)#2 | 0.0078%(+0.183)#87 |
| 88. | Ho Ho Kus Borough | 0.19% | 0.0037%(+0.185)#2 | 0.0078%(+0.181)#88 |
| 89. | Alondra Park | 0.18% | 0.022%(+0.158)#44 | 0.0078%(+0.173)#89 |
| 90. | Warwick | 0.18% | 0.35%(-0.170)#8 | 0.0078%(+0.171)#90 |
| 91. | North Arlington Borough | 0.18% | 0.0037%(+0.174)#3 | 0.0078%(+0.170)#91 |
| 92. | Orangevale | 0.17% | 0.022%(+0.145)#45 | 0.0078%(+0.160)#92 |
| 93. | Nipomo | 0.17% | 0.022%(+0.145)#46 | 0.0078%(+0.159)#93 |
| 94. | Derry | 0.17% | 0.013%(+0.152)#1 | 0.0078%(+0.157)#94 |
| 95. | Smithfield | 0.16% | 0.00038%(+0.162)#1 | 0.0078%(+0.155)#95 |
| 96. | West Melbourne | 0.16% | 0.0024%(+0.158)#3 | 0.0078%(+0.153)#96 |
| 97. | Peabody | 0.16% | 0.15%(+0.003)#20 | 0.0078%(+0.149)#97 |
| 98. | Sleepy Hollow | 0.16% | 0.00021%(+0.156)#2 | 0.0078%(+0.148)#98 |
| 99. | Barnstable Town | 0.15% | 0.15%(-0.001)#21 | 0.0078%(+0.146)#99 |
| 100. | Saugus | 0.15% | 0.15%(-0.004)#22 | 0.0078%(+0.143)#100 |
Common Questions
What are the Top 10 Cities with the Highest Percentage of Immigrants from Azores in the United States?
Top 10 Cities with the Highest Percentage of Immigrants from Azores in the United States are:
#1
11.03%
#2
9.13%
#3
9.09%
#4
4.47%
#5
3.93%
#6
2.55%
#7
2.16%
#8
1.82%
#9
1.66%
#10
1.49%
What city has the Highest Percentage of Immigrants from Azores in the United States?
Cowan has the Highest Percentage of Immigrants from Azores in the United States with 11.03%.
What is the Percentage of Immigrants from Azores in the United States?
Percentage of Immigrants from Azores in the United States is 0.0078%.