Cities with the Largest Black / African American Community in the United States
RELATED REPORTS & OPTIONS
Black / African American
United States
Compare Cities
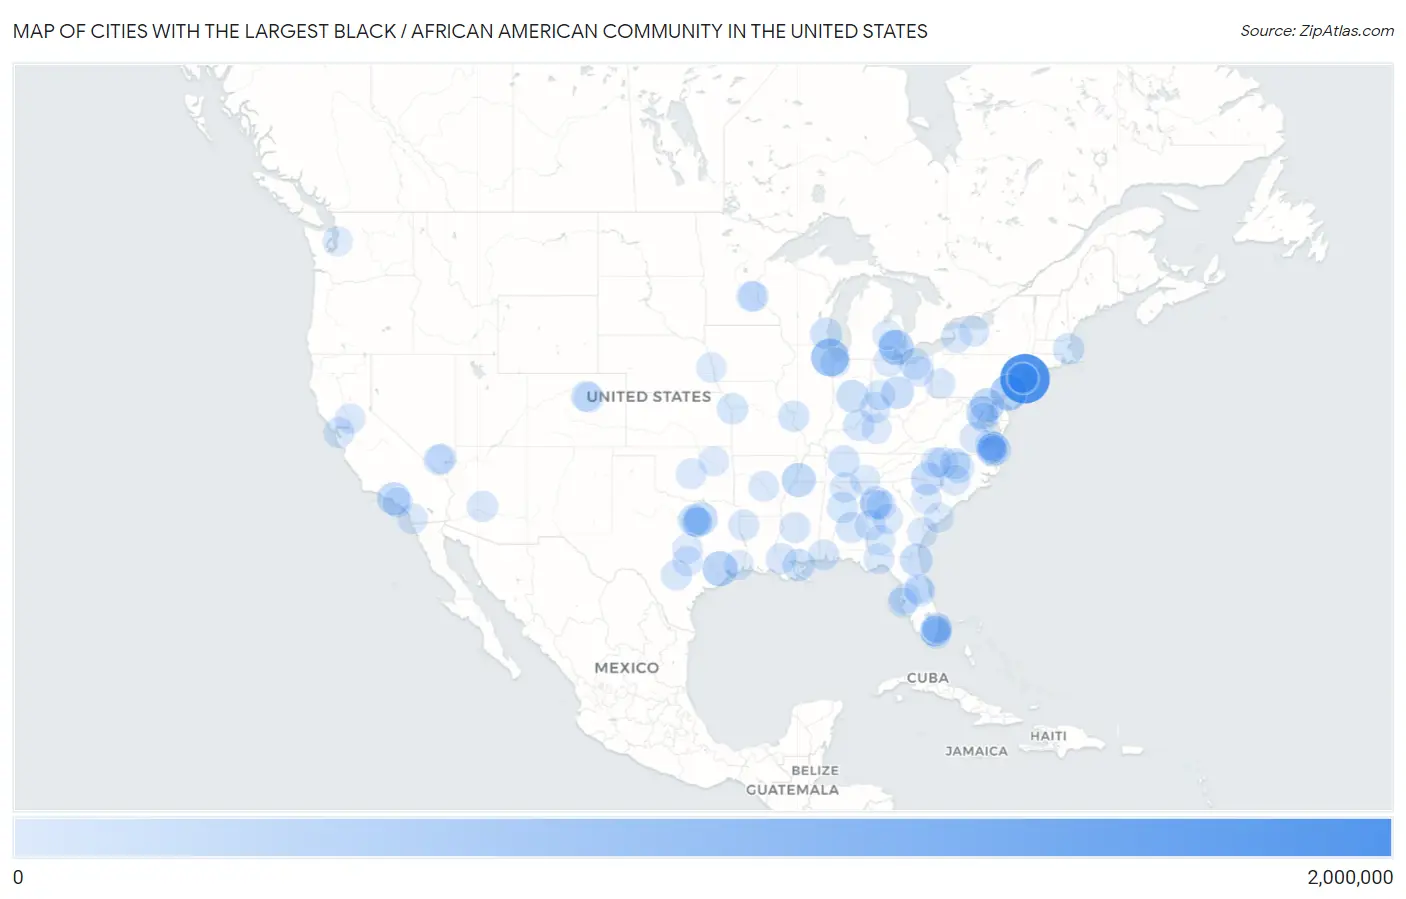
Map of Cities with the Largest Black / African American Community in the United States
0
2,000,000
Cities with the Largest Black / African American Community in the United States
| City | Black / African American | vs State | vs National | |
| 1. | New York | 1,992,200 | 3,011,116(66.16%)#1 | 41,288,572(4.83%)#1 |
| 2. | Chicago | 784,078 | 1,774,605(44.18%)#1 | 41,288,572(1.90%)#2 |
| 3. | Philadelphia | 638,907 | 1,407,814(45.38%)#1 | 41,288,572(1.55%)#3 |
| 4. | Houston | 514,692 | 3,552,579(14.49%)#1 | 41,288,572(1.25%)#4 |
| 5. | Detroit | 495,533 | 1,363,539(36.34%)#1 | 41,288,572(1.20%)#5 |
| 6. | Memphis | 405,463 | 1,126,815(35.98%)#1 | 41,288,572(0.98%)#6 |
| 7. | Baltimore | 358,028 | 1,841,926(19.44%)#1 | 41,288,572(0.87%)#7 |
| 8. | Los Angeles | 332,173 | 2,202,587(15.08%)#1 | 41,288,572(0.80%)#8 |
| 9. | Charlotte | 308,131 | 2,192,455(14.05%)#1 | 41,288,572(0.75%)#9 |
| 10. | Dallas | 307,086 | 3,552,579(8.64%)#2 | 41,288,572(0.74%)#10 |
| 11. | Washington | 297,101 | 297,101(100.00%)#1 | 41,288,572(0.72%)#11 |
| 12. | Jacksonville | 289,093 | 3,355,708(8.61%)#1 | 41,288,572(0.70%)#12 |
| 13. | Columbus | 263,000 | 1,449,450(18.14%)#1 | 41,288,572(0.64%)#13 |
| 14. | Indianapolis | 254,390 | 640,752(39.70%)#1 | 41,288,572(0.62%)#14 |
| 15. | Atlanta | 235,308 | 3,373,948(6.97%)#1 | 41,288,572(0.57%)#15 |
| 16. | Milwaukee | 221,344 | 363,331(60.92%)#1 | 41,288,572(0.54%)#16 |
| 17. | New Orleans | 216,866 | 1,464,582(14.81%)#1 | 41,288,572(0.53%)#17 |
| 18. | Nashville | 183,398 | 1,126,815(16.28%)#2 | 41,288,572(0.44%)#18 |
| 19. | Fort Worth | 177,635 | 3,552,579(5.00%)#3 | 41,288,572(0.43%)#19 |
| 20. | Cleveland | 172,571 | 1,449,450(11.91%)#2 | 41,288,572(0.42%)#20 |
| 21. | Louisville | 150,640 | 360,184(41.82%)#1 | 41,288,572(0.36%)#21 |
| 22. | Boston | 150,002 | 498,785(30.07%)#1 | 41,288,572(0.36%)#22 |
| 23. | Newark | 144,557 | 1,213,265(11.91%)#1 | 41,288,572(0.35%)#23 |
| 24. | Birmingham | 137,487 | 1,326,341(10.37%)#1 | 41,288,572(0.33%)#24 |
| 25. | Kansas City | 132,741 | 693,892(19.13%)#1 | 41,288,572(0.32%)#25 |
| 26. | Raleigh | 131,013 | 2,192,455(5.98%)#2 | 41,288,572(0.32%)#26 |
| 27. | St Louis | 130,753 | 693,892(18.84%)#2 | 41,288,572(0.32%)#27 |
| 28. | Greensboro | 127,965 | 2,192,455(5.84%)#3 | 41,288,572(0.31%)#28 |
| 29. | Jackson | 125,946 | 1,101,836(11.43%)#1 | 41,288,572(0.31%)#29 |
| 30. | Montgomery | 125,354 | 1,326,341(9.45%)#2 | 41,288,572(0.30%)#30 |
| 31. | Cincinnati | 122,384 | 1,449,450(8.44%)#3 | 41,288,572(0.30%)#31 |
| 32. | Phoenix | 118,457 | 327,077(36.22%)#1 | 41,288,572(0.29%)#32 |
| 33. | Baton Rouge | 118,457 | 1,464,582(8.09%)#2 | 41,288,572(0.29%)#33 |
| 34. | Augusta-Richmond County Consolidated Government (Balance) | 113,801 | 3,373,948(3.37%)#2 | 41,288,572(0.28%)#34 |
| 35. | Shreveport | 105,368 | 1,464,582(7.19%)#3 | 41,288,572(0.26%)#35 |
| 36. | Durham | 102,698 | 2,192,455(4.68%)#4 | 41,288,572(0.25%)#36 |
| 37. | Richmond | 99,855 | 1,630,355(6.12%)#1 | 41,288,572(0.24%)#37 |
| 38. | Mobile | 98,951 | 1,326,341(7.46%)#3 | 41,288,572(0.24%)#38 |
| 39. | South Fulton | 98,483 | 3,373,948(2.92%)#3 | 41,288,572(0.24%)#39 |
| 40. | Norfolk | 96,487 | 1,630,355(5.92%)#2 | 41,288,572(0.23%)#40 |
| 41. | Oakland | 95,412 | 2,202,587(4.33%)#2 | 41,288,572(0.23%)#41 |
| 42. | Columbus | 95,323 | 3,373,948(2.83%)#4 | 41,288,572(0.23%)#42 |
| 43. | San Antonio | 95,064 | 3,552,579(2.68%)#4 | 41,288,572(0.23%)#43 |
| 44. | Oklahoma City | 93,143 | 284,453(32.74%)#1 | 41,288,572(0.23%)#44 |
| 45. | Buffalo | 91,963 | 3,011,116(3.05%)#2 | 41,288,572(0.22%)#45 |
| 46. | Arlington | 89,659 | 3,552,579(2.52%)#5 | 41,288,572(0.22%)#46 |
| 47. | Fayetteville | 88,538 | 2,192,455(4.04%)#5 | 41,288,572(0.21%)#47 |
| 48. | Virginia Beach | 86,497 | 1,630,355(5.31%)#3 | 41,288,572(0.21%)#48 |
| 49. | Macon Bibb County | 85,028 | 3,373,948(2.52%)#5 | 41,288,572(0.21%)#49 |
| 50. | Tampa | 84,660 | 3,355,708(2.52%)#2 | 41,288,572(0.21%)#50 |
| 51. | Little Rock | 83,874 | 456,693(18.37%)#1 | 41,288,572(0.20%)#51 |
| 52. | Winston Salem | 82,945 | 2,192,455(3.78%)#6 | 41,288,572(0.20%)#52 |
| 53. | San Diego | 81,231 | 2,202,587(3.69%)#3 | 41,288,572(0.20%)#53 |
| 54. | Rochester | 79,911 | 3,011,116(2.65%)#3 | 41,288,572(0.19%)#54 |
| 55. | Minneapolis | 79,138 | 382,082(20.71%)#1 | 41,288,572(0.19%)#55 |
| 56. | Savannah | 77,831 | 3,373,948(2.31%)#6 | 41,288,572(0.19%)#56 |
| 57. | Newport News | 76,203 | 1,630,355(4.67%)#4 | 41,288,572(0.18%)#57 |
| 58. | Toledo | 75,862 | 1,449,450(5.23%)#4 | 41,288,572(0.18%)#58 |
| 59. | Las Vegas | 75,806 | 290,223(26.12%)#1 | 41,288,572(0.18%)#59 |
| 60. | Austin | 75,432 | 3,552,579(2.12%)#6 | 41,288,572(0.18%)#60 |
| 61. | Chesapeake | 73,034 | 1,630,355(4.48%)#5 | 41,288,572(0.18%)#61 |
| 62. | Miami Gardens | 72,624 | 3,355,708(2.16%)#3 | 41,288,572(0.18%)#62 |
| 63. | Orlando | 71,661 | 3,355,708(2.14%)#4 | 41,288,572(0.17%)#63 |
| 64. | Pittsburgh | 70,584 | 1,407,814(5.01%)#2 | 41,288,572(0.17%)#64 |
| 65. | Tallahassee | 70,450 | 3,355,708(2.10%)#5 | 41,288,572(0.17%)#65 |
| 66. | Hampton | 67,213 | 1,630,355(4.12%)#6 | 41,288,572(0.16%)#66 |
| 67. | Sacramento | 65,978 | 2,202,587(3.00%)#4 | 41,288,572(0.16%)#67 |
| 68. | Huntsville | 65,393 | 1,326,341(4.93%)#4 | 41,288,572(0.16%)#68 |
| 69. | Aurora | 64,408 | 233,712(27.56%)#1 | 41,288,572(0.16%)#69 |
| 70. | Denver | 63,002 | 233,712(26.96%)#2 | 41,288,572(0.15%)#70 |
| 71. | Miami | 62,634 | 3,355,708(1.87%)#6 | 41,288,572(0.15%)#71 |
| 72. | Miramar | 62,590 | 3,355,708(1.87%)#7 | 41,288,572(0.15%)#72 |
| 73. | Jersey City | 61,946 | 1,213,265(5.11%)#2 | 41,288,572(0.15%)#73 |
| 74. | Pine Hills | 61,427 | 3,355,708(1.83%)#8 | 41,288,572(0.15%)#74 |
| 75. | Tulsa | 60,242 | 284,453(21.18%)#2 | 41,288,572(0.15%)#75 |
| 76. | Killeen | 59,811 | 3,552,579(1.68%)#7 | 41,288,572(0.14%)#76 |
| 77. | Lauderhill | 58,670 | 3,355,708(1.75%)#9 | 41,288,572(0.14%)#77 |
| 78. | Omaha | 58,246 | 93,555(62.26%)#1 | 41,288,572(0.14%)#78 |
| 79. | North Las Vegas | 58,228 | 290,223(20.06%)#2 | 41,288,572(0.14%)#79 |
| 80. | Akron | 56,085 | 1,449,450(3.87%)#5 | 41,288,572(0.14%)#80 |
| 81. | Long Beach | 55,623 | 2,202,587(2.53%)#5 | 41,288,572(0.13%)#81 |
| 82. | Columbia | 55,616 | 1,326,209(4.19%)#1 | 41,288,572(0.13%)#82 |
| 83. | East Orange | 55,532 | 1,213,265(4.58%)#3 | 41,288,572(0.13%)#83 |
| 84. | Stonecrest | 54,018 | 3,373,948(1.60%)#7 | 41,288,572(0.13%)#84 |
| 85. | Gary | 53,623 | 640,752(8.37%)#2 | 41,288,572(0.13%)#85 |
| 86. | Chattanooga | 53,428 | 1,126,815(4.74%)#3 | 41,288,572(0.13%)#86 |
| 87. | Fort Lauderdale | 53,400 | 3,355,708(1.59%)#10 | 41,288,572(0.13%)#87 |
| 88. | Beaumont | 52,240 | 3,552,579(1.47%)#8 | 41,288,572(0.13%)#88 |
| 89. | Dayton | 52,202 | 1,449,450(3.60%)#6 | 41,288,572(0.13%)#89 |
| 90. | St Petersburg | 52,156 | 3,355,708(1.55%)#11 | 41,288,572(0.13%)#90 |
| 91. | Albany | 52,084 | 3,373,948(1.54%)#8 | 41,288,572(0.13%)#91 |
| 92. | North Charleston | 51,905 | 1,326,209(3.91%)#2 | 41,288,572(0.13%)#92 |
| 93. | Waldorf | 51,052 | 1,841,926(2.77%)#2 | 41,288,572(0.12%)#93 |
| 94. | Portsmouth | 50,091 | 1,630,355(3.07%)#7 | 41,288,572(0.12%)#94 |
| 95. | Southfield | 49,680 | 1,363,539(3.64%)#2 | 41,288,572(0.12%)#95 |
| 96. | Seattle | 49,534 | 301,477(16.43%)#1 | 41,288,572(0.12%)#96 |
| 97. | St Paul | 48,323 | 382,082(12.65%)#2 | 41,288,572(0.12%)#97 |
| 98. | Lexington | 47,240 | 360,184(13.12%)#2 | 41,288,572(0.11%)#98 |
| 99. | Flint | 46,091 | 1,363,539(3.38%)#3 | 41,288,572(0.11%)#99 |
| 100. | Grand Prairie | 46,057 | 3,552,579(1.30%)#9 | 41,288,572(0.11%)#100 |
Common Questions
What are the Top 10 Cities with the Largest Black / African American Community in the United States?
Top 10 Cities with the Largest Black / African American Community in the United States are:
What city has the Largest Black / African American Community in the United States?
New York has the Largest Black / African American Community in the United States with 1,992,200.
What is the Total Black / African American Population in the United States?
Total Black / African American Population in the United States is 41,288,572.