Cities with the Most Immigrants from Grenada in the United States
RELATED REPORTS & OPTIONS
Grenada
United States
Compare Cities
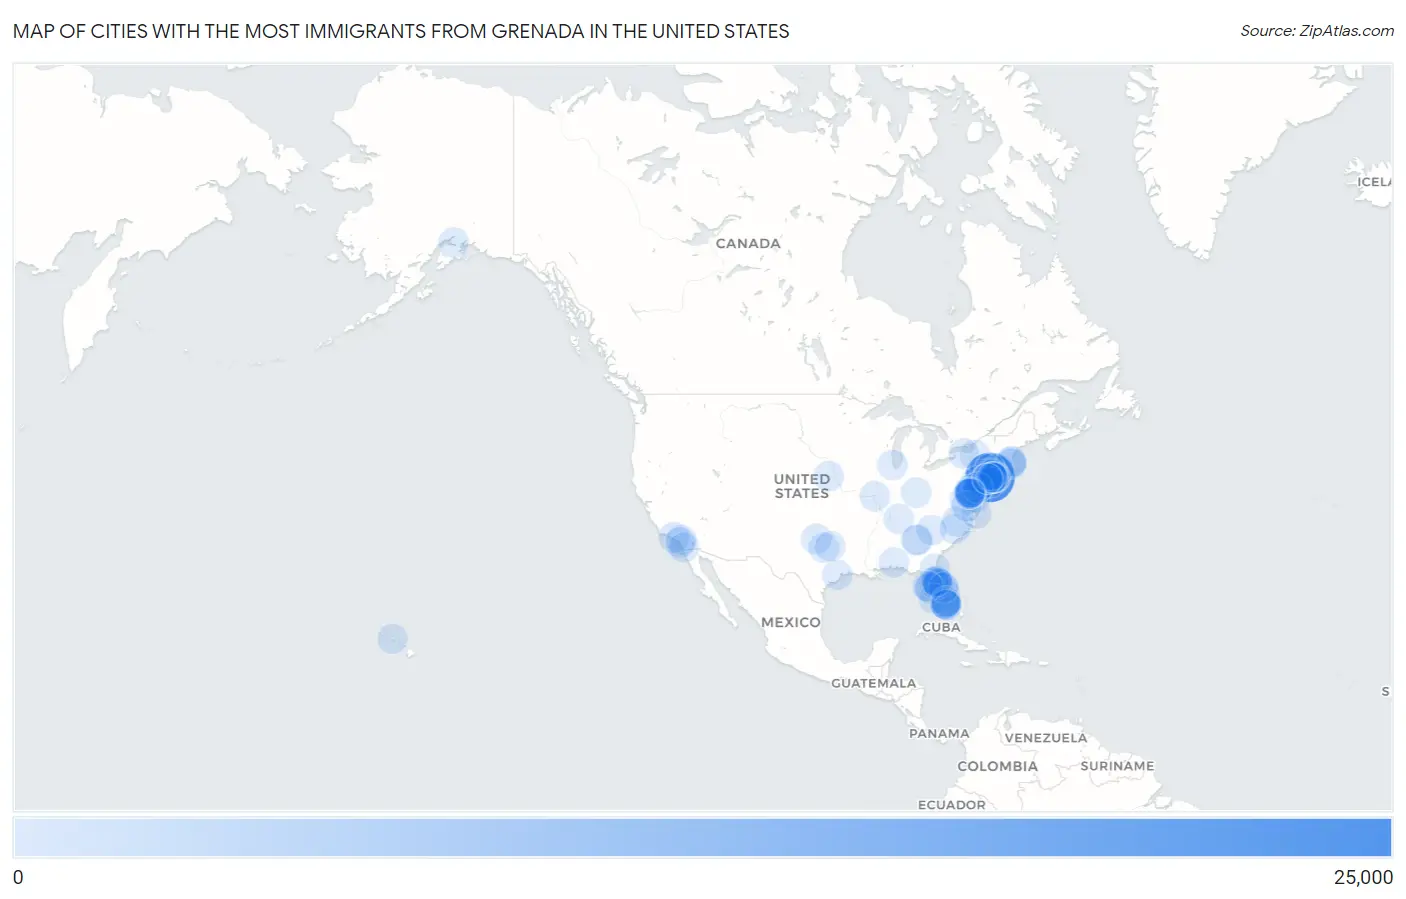
Map of Cities with the Most Immigrants from Grenada in the United States
0
25,000
Cities with the Most Immigrants from Grenada in the United States
| City | Grenada | vs State | vs National | |
| 1. | New York | 20,756 | 22,582(91.91%)#1 | 34,433(60.28%)#1 |
| 2. | Raleigh | 529 | 752(70.35%)#1 | 34,433(1.54%)#2 |
| 3. | Boston | 338 | 588(57.48%)#1 | 34,433(0.98%)#3 |
| 4. | Elmont | 322 | 22,582(1.43%)#2 | 34,433(0.94%)#4 |
| 5. | St Cloud | 261 | 3,183(8.20%)#1 | 34,433(0.76%)#5 |
| 6. | Los Angeles | 227 | 496(45.77%)#1 | 34,433(0.66%)#6 |
| 7. | Newark | 224 | 1,602(13.98%)#1 | 34,433(0.65%)#7 |
| 8. | Palm Bay | 212 | 3,183(6.66%)#2 | 34,433(0.62%)#8 |
| 9. | Arlington Heights | 191 | 842(22.68%)#1 | 34,433(0.55%)#9 |
| 10. | Port St Lucie | 173 | 3,183(5.44%)#3 | 34,433(0.50%)#10 |
| 11. | East Orange | 170 | 1,602(10.61%)#2 | 34,433(0.49%)#11 |
| 12. | Easton | 149 | 842(17.70%)#2 | 34,433(0.43%)#12 |
| 13. | Lincoln | 133 | 133(100.00%)#1 | 34,433(0.39%)#13 |
| 14. | Miami | 124 | 3,183(3.90%)#4 | 34,433(0.36%)#14 |
| 15. | Debary | 114 | 3,183(3.58%)#5 | 34,433(0.33%)#15 |
| 16. | Washington | 110 | 110(100.00%)#1 | 34,433(0.32%)#16 |
| 17. | Campbell | 107 | 3,183(3.36%)#6 | 34,433(0.31%)#17 |
| 18. | Falmouth | 100 | 340(29.41%)#1 | 34,433(0.29%)#18 |
| 19. | Miami Gardens | 96 | 3,183(3.02%)#7 | 34,433(0.28%)#19 |
| 20. | Philadelphia | 89 | 842(10.57%)#3 | 34,433(0.26%)#20 |
| 21. | Missouri City | 89 | 621(14.33%)#1 | 34,433(0.26%)#21 |
| 22. | Glasgow | 89 | 139(64.03%)#1 | 34,433(0.26%)#22 |
| 23. | Cambridge | 88 | 916(9.61%)#1 | 34,433(0.26%)#23 |
| 24. | Wichita Falls | 83 | 621(13.37%)#2 | 34,433(0.24%)#24 |
| 25. | Sunrise | 82 | 3,183(2.58%)#8 | 34,433(0.24%)#25 |
| 26. | Evanston | 79 | 91(86.81%)#1 | 34,433(0.23%)#26 |
| 27. | Mount Vernon | 79 | 22,582(0.35%)#3 | 34,433(0.23%)#27 |
| 28. | Syracuse | 78 | 22,582(0.35%)#4 | 34,433(0.23%)#28 |
| 29. | Baltimore | 77 | 916(8.41%)#2 | 34,433(0.22%)#29 |
| 30. | Fayetteville | 77 | 752(10.24%)#2 | 34,433(0.22%)#30 |
| 31. | Rochester | 76 | 22,582(0.34%)#5 | 34,433(0.22%)#31 |
| 32. | Marion Oaks | 73 | 3,183(2.29%)#9 | 34,433(0.21%)#32 |
| 33. | Reading | 71 | 842(8.43%)#4 | 34,433(0.21%)#33 |
| 34. | Glen Burnie | 70 | 916(7.64%)#3 | 34,433(0.20%)#34 |
| 35. | Miramar | 69 | 3,183(2.17%)#10 | 34,433(0.20%)#35 |
| 36. | Gibsonton | 69 | 3,183(2.17%)#11 | 34,433(0.20%)#36 |
| 37. | Jacksonville | 68 | 3,183(2.14%)#12 | 34,433(0.20%)#37 |
| 38. | Malden | 68 | 588(11.56%)#2 | 34,433(0.20%)#38 |
| 39. | Lake Mary | 68 | 3,183(2.14%)#13 | 34,433(0.20%)#39 |
| 40. | Greenlawn | 68 | 22,582(0.30%)#6 | 34,433(0.20%)#40 |
| 41. | Orlando | 67 | 3,183(2.10%)#14 | 34,433(0.19%)#41 |
| 42. | Randolph Town | 67 | 588(11.39%)#3 | 34,433(0.19%)#42 |
| 43. | Turpin Hills | 67 | 88(76.14%)#1 | 34,433(0.19%)#43 |
| 44. | Tampa | 66 | 3,183(2.07%)#15 | 34,433(0.19%)#44 |
| 45. | Lindenwold Borough | 66 | 1,602(4.12%)#3 | 34,433(0.19%)#45 |
| 46. | Monticello | 66 | 22,582(0.29%)#7 | 34,433(0.19%)#46 |
| 47. | Pine Hills | 64 | 3,183(2.01%)#16 | 34,433(0.19%)#47 |
| 48. | Stonecrest | 63 | 874(7.21%)#1 | 34,433(0.18%)#48 |
| 49. | Cape Coral | 62 | 3,183(1.95%)#17 | 34,433(0.18%)#49 |
| 50. | Hollywood | 62 | 3,183(1.95%)#18 | 34,433(0.18%)#50 |
| 51. | San Clemente | 62 | 496(12.50%)#2 | 34,433(0.18%)#51 |
| 52. | West Babylon | 60 | 22,582(0.27%)#8 | 34,433(0.17%)#52 |
| 53. | New Hempstead | 60 | 22,582(0.27%)#9 | 34,433(0.17%)#53 |
| 54. | Mount Rainier | 59 | 916(6.44%)#4 | 34,433(0.17%)#54 |
| 55. | Rahway | 58 | 1,602(3.62%)#4 | 34,433(0.17%)#55 |
| 56. | Nashville | 56 | 85(65.88%)#1 | 34,433(0.16%)#56 |
| 57. | New Britain | 54 | 132(40.91%)#1 | 34,433(0.16%)#57 |
| 58. | Milford Mill | 54 | 916(5.90%)#5 | 34,433(0.16%)#58 |
| 59. | Stamford | 53 | 132(40.15%)#2 | 34,433(0.15%)#59 |
| 60. | Alafaya | 53 | 3,183(1.67%)#19 | 34,433(0.15%)#60 |
| 61. | Mililani Mauka | 52 | 99(52.53%)#1 | 34,433(0.15%)#61 |
| 62. | Atmore | 51 | 99(51.52%)#1 | 34,433(0.15%)#62 |
| 63. | Fort Worth | 50 | 621(8.05%)#3 | 34,433(0.15%)#63 |
| 64. | Rockwall | 50 | 621(8.05%)#4 | 34,433(0.15%)#64 |
| 65. | Poughkeepsie | 50 | 22,582(0.22%)#10 | 34,433(0.15%)#65 |
| 66. | North Valley Stream | 50 | 22,582(0.22%)#11 | 34,433(0.15%)#66 |
| 67. | Virginia Beach | 49 | 340(14.41%)#2 | 34,433(0.14%)#67 |
| 68. | Franklin Square | 49 | 22,582(0.22%)#12 | 34,433(0.14%)#68 |
| 69. | Roselle Borough | 49 | 1,602(3.06%)#5 | 34,433(0.14%)#69 |
| 70. | Lakeview | 49 | 22,582(0.22%)#13 | 34,433(0.14%)#70 |
| 71. | Asbury Park | 47 | 1,602(2.93%)#6 | 34,433(0.14%)#71 |
| 72. | Pembroke Pines | 46 | 3,183(1.45%)#20 | 34,433(0.13%)#72 |
| 73. | Silver Spring | 45 | 916(4.91%)#6 | 34,433(0.13%)#73 |
| 74. | Mascotte | 45 | 3,183(1.41%)#21 | 34,433(0.13%)#74 |
| 75. | Malabar | 45 | 3,183(1.41%)#22 | 34,433(0.13%)#75 |
| 76. | Tamarac | 43 | 3,183(1.35%)#23 | 34,433(0.12%)#76 |
| 77. | Atlanta | 42 | 874(4.81%)#2 | 34,433(0.12%)#77 |
| 78. | Apopka | 42 | 3,183(1.32%)#24 | 34,433(0.12%)#78 |
| 79. | Plainfield | 42 | 1,602(2.62%)#7 | 34,433(0.12%)#79 |
| 80. | Temescal Valley | 42 | 496(8.47%)#3 | 34,433(0.12%)#80 |
| 81. | Highland Springs | 40 | 340(11.76%)#3 | 34,433(0.12%)#81 |
| 82. | Paulsboro Borough | 40 | 1,602(2.50%)#8 | 34,433(0.12%)#82 |
| 83. | St Louis | 39 | 39(100.00%)#1 | 34,433(0.11%)#83 |
| 84. | Bay Shore | 39 | 22,582(0.17%)#14 | 34,433(0.11%)#84 |
| 85. | Roosevelt | 39 | 22,582(0.17%)#15 | 34,433(0.11%)#85 |
| 86. | Brookside | 38 | 139(27.34%)#2 | 34,433(0.11%)#86 |
| 87. | San Diego | 37 | 496(7.46%)#4 | 34,433(0.11%)#87 |
| 88. | Hicksville | 37 | 22,582(0.16%)#16 | 34,433(0.11%)#88 |
| 89. | Greer | 37 | 177(20.90%)#1 | 34,433(0.11%)#89 |
| 90. | South Laurel | 36 | 916(3.93%)#7 | 34,433(0.10%)#90 |
| 91. | Greenbelt | 36 | 916(3.93%)#8 | 34,433(0.10%)#91 |
| 92. | Jessup | 36 | 916(3.93%)#9 | 34,433(0.10%)#92 |
| 93. | Anchorage | 35 | 39(89.74%)#1 | 34,433(0.10%)#93 |
| 94. | New Rochelle | 34 | 22,582(0.15%)#17 | 34,433(0.10%)#94 |
| 95. | Palm Harbor | 34 | 3,183(1.07%)#25 | 34,433(0.10%)#95 |
| 96. | Bowie | 34 | 916(3.71%)#10 | 34,433(0.10%)#96 |
| 97. | Perth Amboy | 34 | 1,602(2.12%)#9 | 34,433(0.10%)#97 |
| 98. | Gladeview | 34 | 3,183(1.07%)#26 | 34,433(0.10%)#98 |
| 99. | Eatontown Borough | 34 | 1,602(2.12%)#10 | 34,433(0.10%)#99 |
| 100. | Woodlawn Cdp Prince George S County | 34 | 916(3.71%)#11 | 34,433(0.10%)#100 |
Common Questions
What are the Top 10 Cities with the Most Immigrants from Grenada in the United States?
Top 10 Cities with the Most Immigrants from Grenada in the United States are:
What city has the Most Immigrants from Grenada in the United States?
New York has the Most Immigrants from Grenada in the United States with 20,756.
What is the Total Immigrants from Grenada in the United States?
Total Immigrants from Grenada in the United States is 34,433.