Cities with the Most Immigrants from Czechoslovakia in the United States
RELATED REPORTS & OPTIONS
Czechoslovakia
United States
Compare Cities
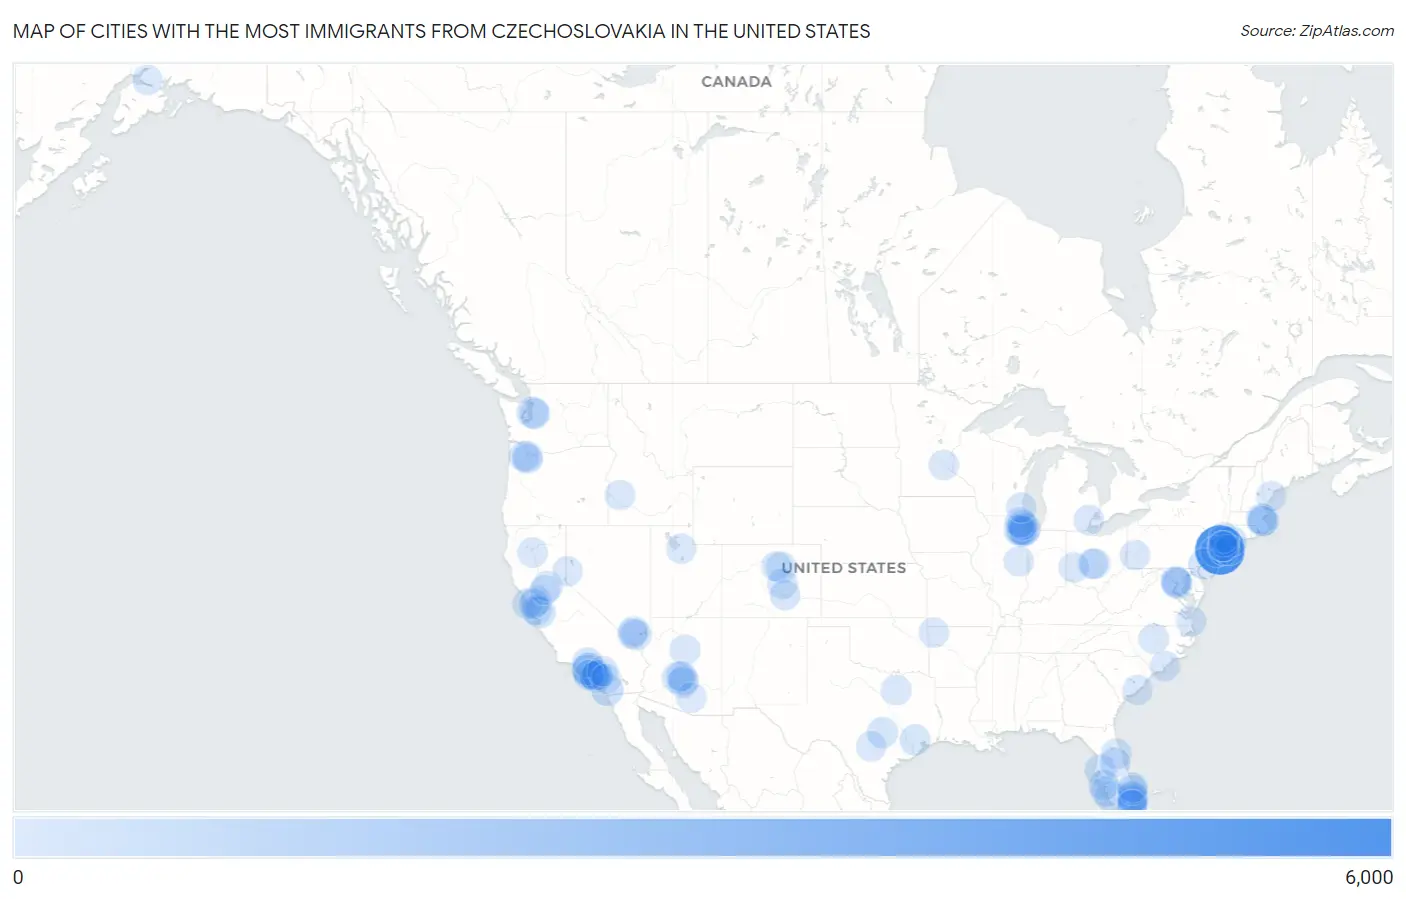
Map of Cities with the Most Immigrants from Czechoslovakia in the United States
0
6,000
Cities with the Most Immigrants from Czechoslovakia in the United States
| City | Czechoslovakia | vs State | vs National | |
| 1. | New York | 5,186 | 8,766(59.16%)#1 | 65,085(7.97%)#1 |
| 2. | Los Angeles | 1,113 | 9,241(12.04%)#1 | 65,085(1.71%)#2 |
| 3. | San Diego | 543 | 9,241(5.88%)#2 | 65,085(0.83%)#3 |
| 4. | Chicago | 487 | 4,741(10.27%)#1 | 65,085(0.75%)#4 |
| 5. | Seattle | 442 | 1,768(25.00%)#1 | 65,085(0.68%)#5 |
| 6. | Linden | 391 | 3,968(9.85%)#1 | 65,085(0.60%)#6 |
| 7. | Newport Beach | 371 | 9,241(4.01%)#3 | 65,085(0.57%)#7 |
| 8. | Phoenix | 345 | 1,678(20.56%)#1 | 65,085(0.53%)#8 |
| 9. | Boston | 313 | 1,846(16.96%)#1 | 65,085(0.48%)#9 |
| 10. | San Jose | 310 | 9,241(3.35%)#4 | 65,085(0.48%)#10 |
| 11. | Denver | 291 | 1,849(15.74%)#1 | 65,085(0.45%)#11 |
| 12. | Tampa | 277 | 8,038(3.45%)#1 | 65,085(0.43%)#12 |
| 13. | Cape Coral | 276 | 8,038(3.43%)#2 | 65,085(0.42%)#13 |
| 14. | Houston | 266 | 2,130(12.49%)#1 | 65,085(0.41%)#14 |
| 15. | Bridgeport | 266 | 1,208(22.02%)#1 | 65,085(0.41%)#15 |
| 16. | Long Beach | 254 | 9,241(2.75%)#5 | 65,085(0.39%)#16 |
| 17. | Austin | 248 | 2,130(11.64%)#2 | 65,085(0.38%)#17 |
| 18. | Fort Lauderdale | 243 | 8,038(3.02%)#3 | 65,085(0.37%)#18 |
| 19. | Philadelphia | 225 | 1,916(11.74%)#1 | 65,085(0.35%)#19 |
| 20. | Flagstaff | 213 | 1,678(12.69%)#2 | 65,085(0.33%)#20 |
| 21. | Washington | 205 | 205(100.00%)#1 | 65,085(0.31%)#21 |
| 22. | Bonita Springs | 196 | 8,038(2.44%)#4 | 65,085(0.30%)#22 |
| 23. | Naperville | 195 | 4,741(4.11%)#2 | 65,085(0.30%)#23 |
| 24. | North Port | 193 | 8,038(2.40%)#5 | 65,085(0.30%)#24 |
| 25. | Deland | 190 | 8,038(2.36%)#6 | 65,085(0.29%)#25 |
| 26. | Pleasant Hill | 188 | 9,241(2.03%)#6 | 65,085(0.29%)#26 |
| 27. | Colorado Springs | 186 | 1,849(10.06%)#2 | 65,085(0.29%)#27 |
| 28. | Boca Raton | 183 | 8,038(2.28%)#7 | 65,085(0.28%)#28 |
| 29. | San Francisco | 167 | 9,241(1.81%)#7 | 65,085(0.26%)#29 |
| 30. | Henderson | 166 | 786(21.12%)#1 | 65,085(0.26%)#30 |
| 31. | Huntington Beach | 160 | 9,241(1.73%)#8 | 65,085(0.25%)#31 |
| 32. | Elmont | 157 | 8,766(1.79%)#2 | 65,085(0.24%)#32 |
| 33. | Santa Monica | 156 | 9,241(1.69%)#9 | 65,085(0.24%)#33 |
| 34. | Gilbert | 154 | 1,678(9.18%)#3 | 65,085(0.24%)#34 |
| 35. | Reynoldsburg | 152 | 1,754(8.67%)#1 | 65,085(0.23%)#35 |
| 36. | Point Pleasant Beach Borough | 152 | 3,968(3.83%)#2 | 65,085(0.23%)#36 |
| 37. | Mountain View | 148 | 9,241(1.60%)#10 | 65,085(0.23%)#37 |
| 38. | Raleigh | 142 | 1,445(9.83%)#1 | 65,085(0.22%)#38 |
| 39. | Pompano Beach | 141 | 8,038(1.75%)#8 | 65,085(0.22%)#39 |
| 40. | Santa Clarita | 140 | 9,241(1.51%)#11 | 65,085(0.22%)#40 |
| 41. | Costa Mesa | 139 | 9,241(1.50%)#12 | 65,085(0.21%)#41 |
| 42. | Darien | 135 | 4,741(2.85%)#3 | 65,085(0.21%)#42 |
| 43. | Cambridge | 134 | 1,846(7.26%)#2 | 65,085(0.21%)#43 |
| 44. | Dearborn | 134 | 1,437(9.32%)#1 | 65,085(0.21%)#44 |
| 45. | Downers Grove | 134 | 4,741(2.83%)#4 | 65,085(0.21%)#45 |
| 46. | Dallas | 133 | 2,130(6.24%)#3 | 65,085(0.20%)#46 |
| 47. | Bellevue | 131 | 1,768(7.41%)#2 | 65,085(0.20%)#47 |
| 48. | Pueblo | 131 | 1,849(7.08%)#3 | 65,085(0.20%)#48 |
| 49. | Anchorage | 128 | 170(75.29%)#1 | 65,085(0.20%)#49 |
| 50. | Bethesda | 128 | 1,473(8.69%)#1 | 65,085(0.20%)#50 |
| 51. | North Lindenhurst | 128 | 8,766(1.46%)#3 | 65,085(0.20%)#51 |
| 52. | Mount Kisco | 128 | 8,766(1.46%)#4 | 65,085(0.20%)#52 |
| 53. | Trotwood | 127 | 1,754(7.24%)#2 | 65,085(0.20%)#53 |
| 54. | Saco | 127 | 400(31.75%)#1 | 65,085(0.20%)#54 |
| 55. | Quincy | 126 | 1,846(6.83%)#3 | 65,085(0.19%)#55 |
| 56. | Tustin | 126 | 9,241(1.36%)#13 | 65,085(0.19%)#56 |
| 57. | Bridgeview | 126 | 4,741(2.66%)#5 | 65,085(0.19%)#57 |
| 58. | Mahopac | 123 | 8,766(1.40%)#5 | 65,085(0.19%)#58 |
| 59. | Mesa | 122 | 1,678(7.27%)#4 | 65,085(0.19%)#59 |
| 60. | Wilmington | 122 | 1,445(8.44%)#2 | 65,085(0.19%)#60 |
| 61. | Springdale | 121 | 174(69.54%)#1 | 65,085(0.19%)#61 |
| 62. | Columbus | 120 | 1,754(6.84%)#3 | 65,085(0.18%)#62 |
| 63. | Salt Lake City | 120 | 489(24.54%)#1 | 65,085(0.18%)#63 |
| 64. | Lake Zurich | 120 | 4,741(2.53%)#6 | 65,085(0.18%)#64 |
| 65. | Des Plaines | 118 | 4,741(2.49%)#7 | 65,085(0.18%)#65 |
| 66. | Boise City | 116 | 166(69.88%)#1 | 65,085(0.18%)#66 |
| 67. | Maple Grove | 115 | 577(19.93%)#1 | 65,085(0.18%)#67 |
| 68. | Portland | 114 | 1,045(10.91%)#1 | 65,085(0.18%)#68 |
| 69. | Virginia Beach | 114 | 1,368(8.33%)#1 | 65,085(0.18%)#69 |
| 70. | Orlando | 114 | 8,038(1.42%)#9 | 65,085(0.18%)#70 |
| 71. | Greenfield | 113 | 953(11.86%)#1 | 65,085(0.17%)#71 |
| 72. | Las Vegas | 111 | 786(14.12%)#2 | 65,085(0.17%)#72 |
| 73. | Dania Beach | 111 | 8,038(1.38%)#10 | 65,085(0.17%)#73 |
| 74. | Redding | 110 | 9,241(1.19%)#14 | 65,085(0.17%)#74 |
| 75. | Miami | 108 | 8,038(1.34%)#11 | 65,085(0.17%)#75 |
| 76. | San Antonio | 107 | 2,130(5.02%)#4 | 65,085(0.16%)#76 |
| 77. | Marana | 107 | 1,678(6.38%)#5 | 65,085(0.16%)#77 |
| 78. | Lake Hopatcong | 106 | 3,968(2.67%)#3 | 65,085(0.16%)#78 |
| 79. | Hillsboro | 105 | 1,045(10.05%)#2 | 65,085(0.16%)#79 |
| 80. | Rancho Palos Verdes | 105 | 9,241(1.14%)#15 | 65,085(0.16%)#80 |
| 81. | Sleepy Hollow Lake | 105 | 8,766(1.20%)#6 | 65,085(0.16%)#81 |
| 82. | Yonkers | 104 | 8,766(1.19%)#7 | 65,085(0.16%)#82 |
| 83. | New Rochelle | 104 | 8,766(1.19%)#8 | 65,085(0.16%)#83 |
| 84. | North Bethesda | 104 | 1,473(7.06%)#2 | 65,085(0.16%)#84 |
| 85. | Oakland | 103 | 9,241(1.11%)#16 | 65,085(0.16%)#85 |
| 86. | Arvada | 102 | 1,849(5.52%)#4 | 65,085(0.16%)#86 |
| 87. | Urbana | 102 | 4,741(2.15%)#8 | 65,085(0.16%)#87 |
| 88. | Summerlin South | 102 | 786(12.98%)#3 | 65,085(0.16%)#88 |
| 89. | Riverside | 98 | 9,241(1.06%)#17 | 65,085(0.15%)#89 |
| 90. | Pittsburgh | 97 | 1,916(5.06%)#2 | 65,085(0.15%)#90 |
| 91. | Temecula | 97 | 9,241(1.05%)#18 | 65,085(0.15%)#91 |
| 92. | Mount Pleasant | 97 | 436(22.25%)#1 | 65,085(0.15%)#92 |
| 93. | Roseville | 96 | 9,241(1.04%)#19 | 65,085(0.15%)#93 |
| 94. | Lake Oswego | 96 | 1,045(9.19%)#3 | 65,085(0.15%)#94 |
| 95. | Reno | 95 | 786(12.09%)#4 | 65,085(0.15%)#95 |
| 96. | West Palm Beach | 95 | 8,038(1.18%)#12 | 65,085(0.15%)#96 |
| 97. | Jupiter | 95 | 8,038(1.18%)#13 | 65,085(0.15%)#97 |
| 98. | Miami Beach | 94 | 8,038(1.17%)#14 | 65,085(0.14%)#98 |
| 99. | Scottsdale | 93 | 1,678(5.54%)#6 | 65,085(0.14%)#99 |
| 100. | Sacramento | 92 | 9,241(1.00%)#20 | 65,085(0.14%)#100 |
Common Questions
What are the Top 10 Cities with the Most Immigrants from Czechoslovakia in the United States?
Top 10 Cities with the Most Immigrants from Czechoslovakia in the United States are:
What city has the Most Immigrants from Czechoslovakia in the United States?
New York has the Most Immigrants from Czechoslovakia in the United States with 5,186.
What is the Total Immigrants from Czechoslovakia in the United States?
Total Immigrants from Czechoslovakia in the United States is 65,085.