Cities with the Largest Estonian Community in the United States
RELATED REPORTS & OPTIONS
Estonian
United States
Compare Cities
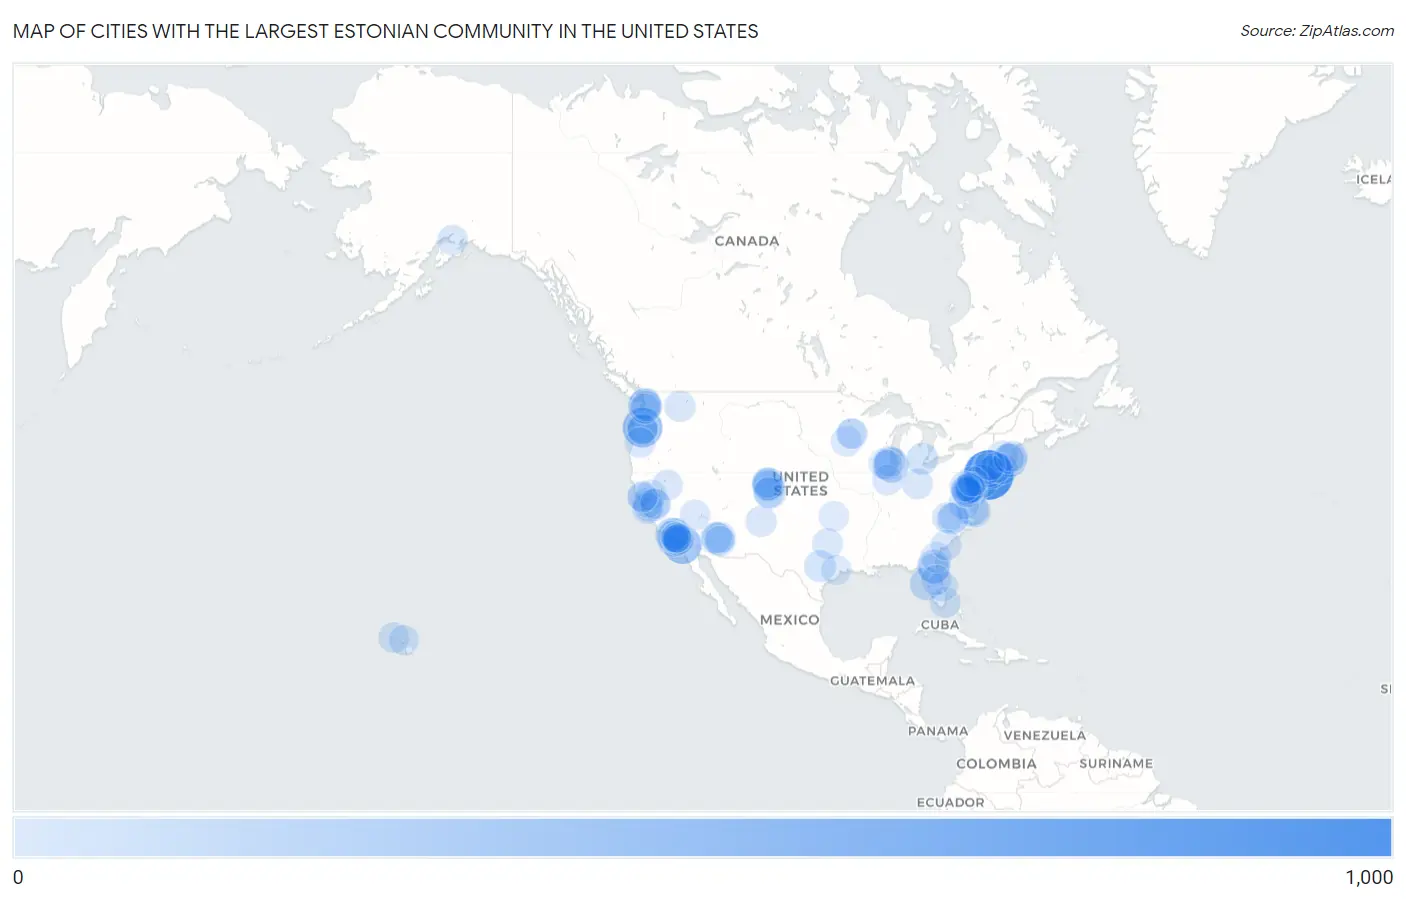
Map of Cities with the Largest Estonian Community in the United States
0
1,000
Cities with the Largest Estonian Community in the United States
| City | Estonian | vs State | vs National | |
| 1. | New York | 976 | 2,652(36.80%)#1 | 28,951(3.37%)#1 |
| 2. | Portland | 485 | 1,191(40.72%)#1 | 28,951(1.68%)#2 |
| 3. | San Diego | 417 | 4,096(10.18%)#1 | 28,951(1.44%)#3 |
| 4. | Chicago | 262 | 1,053(24.88%)#1 | 28,951(0.90%)#4 |
| 5. | Los Angeles | 243 | 4,096(5.93%)#2 | 28,951(0.84%)#5 |
| 6. | Seattle | 221 | 1,583(13.96%)#1 | 28,951(0.76%)#6 |
| 7. | Philadelphia | 213 | 1,049(20.31%)#1 | 28,951(0.74%)#7 |
| 8. | Boston | 212 | 1,043(20.33%)#1 | 28,951(0.73%)#8 |
| 9. | State College Borough | 183 | 1,049(17.45%)#2 | 28,951(0.63%)#9 |
| 10. | Jacksonville | 171 | 2,017(8.48%)#1 | 28,951(0.59%)#10 |
| 11. | Tarpon Springs | 169 | 2,017(8.38%)#2 | 28,951(0.58%)#11 |
| 12. | Rye Brook | 159 | 2,652(6.00%)#2 | 28,951(0.55%)#12 |
| 13. | Colorado Springs | 132 | 938(14.07%)#1 | 28,951(0.46%)#13 |
| 14. | Denver | 131 | 938(13.97%)#2 | 28,951(0.45%)#14 |
| 15. | Annapolis | 124 | 1,122(11.05%)#1 | 28,951(0.43%)#15 |
| 16. | San Clemente | 123 | 4,096(3.00%)#3 | 28,951(0.42%)#16 |
| 17. | Virginia Beach | 121 | 1,085(11.15%)#1 | 28,951(0.42%)#17 |
| 18. | Spring Valley | 119 | 2,652(4.49%)#3 | 28,951(0.41%)#18 |
| 19. | Vancouver | 116 | 1,583(7.33%)#2 | 28,951(0.40%)#19 |
| 20. | Alderwood Manor | 116 | 1,583(7.33%)#3 | 28,951(0.40%)#20 |
| 21. | Phoenix | 115 | 586(19.62%)#1 | 28,951(0.40%)#21 |
| 22. | Austin | 111 | 1,088(10.20%)#1 | 28,951(0.38%)#22 |
| 23. | Norfolk | 110 | 1,085(10.14%)#2 | 28,951(0.38%)#23 |
| 24. | Southfield | 110 | 565(19.47%)#1 | 28,951(0.38%)#24 |
| 25. | Turlock | 100 | 4,096(2.44%)#4 | 28,951(0.35%)#25 |
| 26. | Chapel Hill | 100 | 662(15.11%)#1 | 28,951(0.35%)#26 |
| 27. | Altadena | 97 | 4,096(2.37%)#5 | 28,951(0.34%)#27 |
| 28. | Avalon | 97 | 4,096(2.37%)#6 | 28,951(0.34%)#28 |
| 29. | Asbury Lake | 95 | 2,017(4.71%)#3 | 28,951(0.33%)#29 |
| 30. | Washington | 90 | 90(100.00%)#1 | 28,951(0.31%)#30 |
| 31. | Carney | 90 | 1,122(8.02%)#2 | 28,951(0.31%)#31 |
| 32. | Scottsdale | 89 | 586(15.19%)#2 | 28,951(0.31%)#32 |
| 33. | Highlands Ranch | 89 | 938(9.49%)#3 | 28,951(0.31%)#33 |
| 34. | Winchendon | 87 | 1,043(8.34%)#2 | 28,951(0.30%)#34 |
| 35. | Hermosa Beach | 85 | 4,096(2.08%)#7 | 28,951(0.29%)#35 |
| 36. | Miami | 83 | 2,017(4.12%)#4 | 28,951(0.29%)#36 |
| 37. | Spokane | 82 | 1,583(5.18%)#4 | 28,951(0.28%)#37 |
| 38. | Buena Borough | 82 | 1,900(4.32%)#1 | 28,951(0.28%)#38 |
| 39. | Richmond | 78 | 1,085(7.19%)#3 | 28,951(0.27%)#39 |
| 40. | Peoria | 78 | 586(13.31%)#3 | 28,951(0.27%)#40 |
| 41. | Lakewood | 78 | 938(8.32%)#4 | 28,951(0.27%)#41 |
| 42. | Santa Fe | 78 | 201(38.81%)#1 | 28,951(0.27%)#42 |
| 43. | Dixon Lane Meadow Creek | 78 | 4,096(1.90%)#8 | 28,951(0.27%)#43 |
| 44. | Beavercreek | 75 | 512(14.65%)#1 | 28,951(0.26%)#44 |
| 45. | Dana Point | 75 | 4,096(1.83%)#9 | 28,951(0.26%)#45 |
| 46. | Ilchester | 74 | 1,122(6.60%)#3 | 28,951(0.26%)#46 |
| 47. | San Jose | 73 | 4,096(1.78%)#10 | 28,951(0.25%)#47 |
| 48. | Gales Ferry | 72 | 1,129(6.38%)#1 | 28,951(0.25%)#48 |
| 49. | Plano | 71 | 1,088(6.53%)#2 | 28,951(0.25%)#49 |
| 50. | Sebastian | 71 | 2,017(3.52%)#5 | 28,951(0.25%)#50 |
| 51. | Darien | 71 | 236(30.08%)#1 | 28,951(0.25%)#51 |
| 52. | East Honolulu | 70 | 175(40.00%)#1 | 28,951(0.24%)#52 |
| 53. | Greensboro | 67 | 662(10.12%)#2 | 28,951(0.23%)#53 |
| 54. | Durham | 67 | 662(10.12%)#3 | 28,951(0.23%)#54 |
| 55. | Mission Viejo | 67 | 4,096(1.64%)#11 | 28,951(0.23%)#55 |
| 56. | Scotts Valley | 67 | 4,096(1.64%)#12 | 28,951(0.23%)#56 |
| 57. | Mankato | 66 | 556(11.87%)#1 | 28,951(0.23%)#57 |
| 58. | Northbrook | 66 | 1,053(6.27%)#2 | 28,951(0.23%)#58 |
| 59. | Bethesda | 65 | 1,122(5.79%)#4 | 28,951(0.22%)#59 |
| 60. | Charleston | 64 | 275(23.27%)#1 | 28,951(0.22%)#60 |
| 61. | Waterbury | 64 | 1,129(5.67%)#2 | 28,951(0.22%)#61 |
| 62. | Monroe | 64 | 2,652(2.41%)#4 | 28,951(0.22%)#62 |
| 63. | Stafford | 64 | 1,191(5.37%)#2 | 28,951(0.22%)#63 |
| 64. | Sacramento | 63 | 4,096(1.54%)#13 | 28,951(0.22%)#64 |
| 65. | San Ramon | 63 | 4,096(1.54%)#14 | 28,951(0.22%)#65 |
| 66. | Gloucester | 63 | 1,043(6.04%)#3 | 28,951(0.22%)#66 |
| 67. | Milwaukie | 63 | 1,191(5.29%)#3 | 28,951(0.22%)#67 |
| 68. | Las Vegas | 61 | 214(28.50%)#1 | 28,951(0.21%)#68 |
| 69. | Anchorage | 61 | 98(62.24%)#1 | 28,951(0.21%)#69 |
| 70. | Santa Rosa | 61 | 4,096(1.49%)#15 | 28,951(0.21%)#70 |
| 71. | Urbana | 61 | 1,053(5.79%)#3 | 28,951(0.21%)#71 |
| 72. | Eugene | 60 | 1,191(5.04%)#4 | 28,951(0.21%)#72 |
| 73. | Fernley | 60 | 214(28.04%)#2 | 28,951(0.21%)#73 |
| 74. | Haiku Pauwela | 60 | 175(34.29%)#2 | 28,951(0.21%)#74 |
| 75. | Altamonte Springs | 59 | 2,017(2.93%)#6 | 28,951(0.20%)#75 |
| 76. | Baltimore | 58 | 1,122(5.17%)#5 | 28,951(0.20%)#76 |
| 77. | Huntington | 58 | 1,085(5.35%)#4 | 28,951(0.20%)#77 |
| 78. | Collingswood Borough | 57 | 1,900(3.00%)#2 | 28,951(0.20%)#78 |
| 79. | Gilbert | 56 | 586(9.56%)#4 | 28,951(0.19%)#79 |
| 80. | North Bethesda | 56 | 1,122(4.99%)#6 | 28,951(0.19%)#80 |
| 81. | Dekalb | 56 | 1,053(5.32%)#4 | 28,951(0.19%)#81 |
| 82. | St Paul | 55 | 556(9.89%)#2 | 28,951(0.19%)#82 |
| 83. | Garden Grove | 55 | 4,096(1.34%)#16 | 28,951(0.19%)#83 |
| 84. | Houston | 54 | 1,088(4.96%)#3 | 28,951(0.19%)#84 |
| 85. | Westminster | 54 | 938(5.76%)#5 | 28,951(0.19%)#85 |
| 86. | Towson | 54 | 1,122(4.81%)#7 | 28,951(0.19%)#86 |
| 87. | Manitou Springs | 54 | 938(5.76%)#6 | 28,951(0.19%)#87 |
| 88. | Frederick | 53 | 1,122(4.72%)#8 | 28,951(0.18%)#88 |
| 89. | Des Moines | 53 | 1,583(3.35%)#5 | 28,951(0.18%)#89 |
| 90. | Narberth Borough | 53 | 1,049(5.05%)#3 | 28,951(0.18%)#90 |
| 91. | Haviland | 53 | 2,652(2.00%)#5 | 28,951(0.18%)#91 |
| 92. | Modesto | 52 | 4,096(1.27%)#17 | 28,951(0.18%)#92 |
| 93. | Bellevue | 51 | 1,583(3.22%)#6 | 28,951(0.18%)#93 |
| 94. | Naperville | 51 | 1,053(4.84%)#5 | 28,951(0.18%)#94 |
| 95. | Petaluma | 51 | 4,096(1.25%)#18 | 28,951(0.18%)#95 |
| 96. | Minneapolis | 50 | 556(8.99%)#3 | 28,951(0.17%)#96 |
| 97. | Tulsa | 50 | 170(29.41%)#1 | 28,951(0.17%)#97 |
| 98. | Costa Mesa | 50 | 4,096(1.22%)#19 | 28,951(0.17%)#98 |
| 99. | Arlington | 50 | 1,043(4.79%)#4 | 28,951(0.17%)#99 |
| 100. | Willow Street | 50 | 1,049(4.77%)#4 | 28,951(0.17%)#100 |
Common Questions
What are the Top 10 Cities with the Largest Estonian Community in the United States?
Top 10 Cities with the Largest Estonian Community in the United States are:
#1
976
#2
485
#3
417
#4
262
#5
243
#6
221
#7
213
#8
212
#9
171
#10
169
What city has the Largest Estonian Community in the United States?
New York has the Largest Estonian Community in the United States with 976.
What is the Total Estonian Population in the United States?
Total Estonian Population in the United States is 28,951.