Cities with the Most Immigrants from Netherlands in the United States
RELATED REPORTS & OPTIONS
Netherlands
United States
Compare Cities
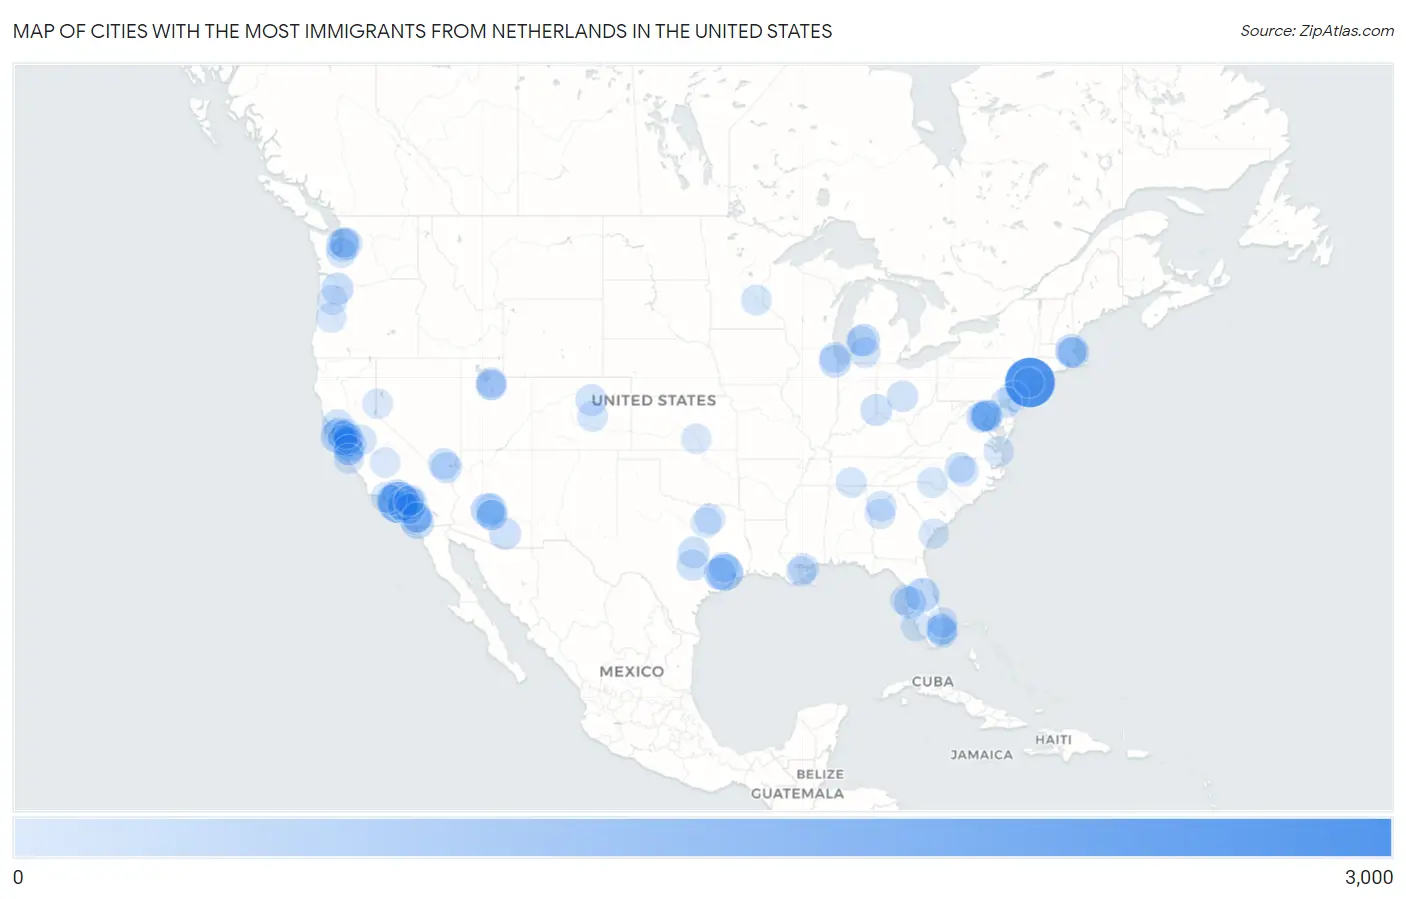
Map of Cities with the Most Immigrants from Netherlands in the United States
0
3,000
Cities with the Most Immigrants from Netherlands in the United States
| City | Netherlands | vs State | vs National | |
| 1. | New York | 2,903 | 5,189(55.95%)#1 | 83,187(3.49%)#1 |
| 2. | Los Angeles | 1,662 | 17,937(9.27%)#1 | 83,187(2.00%)#2 |
| 3. | Houston | 961 | 5,793(16.59%)#1 | 83,187(1.16%)#3 |
| 4. | Horizon West | 623 | 8,103(7.69%)#1 | 83,187(0.75%)#4 |
| 5. | San Francisco | 586 | 17,937(3.27%)#2 | 83,187(0.70%)#5 |
| 6. | Phoenix | 526 | 2,465(21.34%)#1 | 83,187(0.63%)#6 |
| 7. | San Diego | 459 | 17,937(2.56%)#3 | 83,187(0.55%)#7 |
| 8. | Seattle | 455 | 3,414(13.33%)#1 | 83,187(0.55%)#8 |
| 9. | San Jose | 417 | 17,937(2.32%)#4 | 83,187(0.50%)#9 |
| 10. | Chicago | 390 | 2,017(19.34%)#1 | 83,187(0.47%)#10 |
| 11. | Cinco Ranch | 390 | 5,793(6.73%)#2 | 83,187(0.47%)#11 |
| 12. | Grand Rapids | 386 | 3,681(10.49%)#1 | 83,187(0.46%)#12 |
| 13. | Tampa | 367 | 8,103(4.53%)#2 | 83,187(0.44%)#13 |
| 14. | Somerville | 354 | 2,231(15.87%)#1 | 83,187(0.43%)#14 |
| 15. | Portland | 330 | 2,055(16.06%)#1 | 83,187(0.40%)#15 |
| 16. | Harrison | 311 | 1,793(17.35%)#1 | 83,187(0.37%)#16 |
| 17. | Redmond | 310 | 3,414(9.08%)#2 | 83,187(0.37%)#17 |
| 18. | Encinitas | 304 | 17,937(1.69%)#5 | 83,187(0.37%)#18 |
| 19. | Tucson | 300 | 2,465(12.17%)#2 | 83,187(0.36%)#19 |
| 20. | Washington | 290 | 290(100.00%)#1 | 83,187(0.35%)#20 |
| 21. | Harker Heights | 274 | 5,793(4.73%)#3 | 83,187(0.33%)#21 |
| 22. | Austin | 266 | 5,793(4.59%)#4 | 83,187(0.32%)#22 |
| 23. | Irvine | 253 | 17,937(1.41%)#6 | 83,187(0.30%)#23 |
| 24. | Denver | 250 | 1,640(15.24%)#1 | 83,187(0.30%)#24 |
| 25. | Columbus | 240 | 1,793(13.39%)#2 | 83,187(0.29%)#25 |
| 26. | Santa Clarita | 240 | 17,937(1.34%)#7 | 83,187(0.29%)#26 |
| 27. | Santa Rosa | 240 | 17,937(1.34%)#8 | 83,187(0.29%)#27 |
| 28. | Boston | 234 | 2,231(10.49%)#2 | 83,187(0.28%)#28 |
| 29. | Las Vegas | 226 | 946(23.89%)#1 | 83,187(0.27%)#29 |
| 30. | Henderson | 224 | 946(23.68%)#2 | 83,187(0.27%)#30 |
| 31. | Scottsdale | 215 | 2,465(8.72%)#3 | 83,187(0.26%)#31 |
| 32. | Pasadena | 204 | 17,937(1.14%)#9 | 83,187(0.25%)#32 |
| 33. | Gilbert | 198 | 2,465(8.03%)#4 | 83,187(0.24%)#33 |
| 34. | Bethesda | 186 | 1,463(12.71%)#1 | 83,187(0.22%)#34 |
| 35. | Boca Raton | 172 | 8,103(2.12%)#3 | 83,187(0.21%)#35 |
| 36. | Huntington Beach | 171 | 17,937(0.95%)#10 | 83,187(0.21%)#36 |
| 37. | Kalamazoo | 170 | 3,681(4.62%)#2 | 83,187(0.20%)#37 |
| 38. | San Marcos | 169 | 17,937(0.94%)#11 | 83,187(0.20%)#38 |
| 39. | Long Beach | 167 | 17,937(0.93%)#12 | 83,187(0.20%)#39 |
| 40. | Philadelphia | 162 | 2,004(8.08%)#1 | 83,187(0.19%)#40 |
| 41. | Lakewood | 160 | 17,937(0.89%)#13 | 83,187(0.19%)#41 |
| 42. | Brookline | 159 | 2,231(7.13%)#3 | 83,187(0.19%)#42 |
| 43. | Bear | 159 | 434(36.64%)#1 | 83,187(0.19%)#43 |
| 44. | Evanston | 158 | 2,017(7.83%)#2 | 83,187(0.19%)#44 |
| 45. | Colorado Springs | 154 | 1,640(9.39%)#2 | 83,187(0.19%)#45 |
| 46. | San Buenaventura Ventura | 154 | 17,937(0.86%)#14 | 83,187(0.19%)#46 |
| 47. | The Woodlands | 148 | 5,793(2.55%)#5 | 83,187(0.18%)#47 |
| 48. | Charlotte | 143 | 1,461(9.79%)#1 | 83,187(0.17%)#48 |
| 49. | Tacoma | 141 | 3,414(4.13%)#3 | 83,187(0.17%)#49 |
| 50. | Santa Clara | 141 | 17,937(0.79%)#15 | 83,187(0.17%)#50 |
| 51. | Fayetteville | 139 | 618(22.49%)#1 | 83,187(0.17%)#51 |
| 52. | Atlanta | 137 | 1,911(7.17%)#1 | 83,187(0.16%)#52 |
| 53. | Mountain View | 137 | 17,937(0.76%)#16 | 83,187(0.16%)#53 |
| 54. | Iona | 137 | 8,103(1.69%)#4 | 83,187(0.16%)#54 |
| 55. | Modesto | 136 | 17,937(0.76%)#17 | 83,187(0.16%)#55 |
| 56. | Margate | 135 | 8,103(1.67%)#5 | 83,187(0.16%)#56 |
| 57. | Riverside | 134 | 17,937(0.75%)#18 | 83,187(0.16%)#57 |
| 58. | Jersey City | 134 | 2,616(5.12%)#1 | 83,187(0.16%)#58 |
| 59. | Rancho Cucamonga | 134 | 17,937(0.75%)#19 | 83,187(0.16%)#59 |
| 60. | Wylie | 133 | 5,793(2.30%)#6 | 83,187(0.16%)#60 |
| 61. | Sleepy Hollow | 130 | 17,937(0.72%)#20 | 83,187(0.16%)#61 |
| 62. | Minneapolis | 129 | 771(16.73%)#1 | 83,187(0.16%)#62 |
| 63. | Thousand Oaks | 129 | 17,937(0.72%)#21 | 83,187(0.16%)#63 |
| 64. | Tysons | 128 | 2,246(5.70%)#1 | 83,187(0.15%)#64 |
| 65. | Soquel | 127 | 17,937(0.71%)#22 | 83,187(0.15%)#65 |
| 66. | Raleigh | 126 | 1,461(8.62%)#2 | 83,187(0.15%)#66 |
| 67. | Fort Lauderdale | 126 | 8,103(1.55%)#6 | 83,187(0.15%)#67 |
| 68. | Rancho Santa Margarita | 126 | 17,937(0.70%)#23 | 83,187(0.15%)#68 |
| 69. | Oakland | 125 | 17,937(0.70%)#24 | 83,187(0.15%)#69 |
| 70. | Durham | 123 | 1,461(8.42%)#3 | 83,187(0.15%)#70 |
| 71. | New Orleans | 121 | 632(19.15%)#1 | 83,187(0.15%)#71 |
| 72. | Dallas | 120 | 5,793(2.07%)#7 | 83,187(0.14%)#72 |
| 73. | Reno | 120 | 946(12.68%)#3 | 83,187(0.14%)#73 |
| 74. | Fremont | 120 | 17,937(0.67%)#25 | 83,187(0.14%)#74 |
| 75. | Centreville | 120 | 2,246(5.34%)#2 | 83,187(0.14%)#75 |
| 76. | Peachtree City | 119 | 1,911(6.23%)#2 | 83,187(0.14%)#76 |
| 77. | Midvale | 119 | 1,545(7.70%)#1 | 83,187(0.14%)#77 |
| 78. | Eugene | 115 | 2,055(5.60%)#2 | 83,187(0.14%)#78 |
| 79. | Berkeley | 114 | 17,937(0.64%)#26 | 83,187(0.14%)#79 |
| 80. | Chandler | 113 | 2,465(4.58%)#5 | 83,187(0.14%)#80 |
| 81. | Arlington | 113 | 2,246(5.03%)#3 | 83,187(0.14%)#81 |
| 82. | Visalia | 112 | 17,937(0.62%)#27 | 83,187(0.13%)#82 |
| 83. | West Palm Beach | 112 | 8,103(1.38%)#7 | 83,187(0.13%)#83 |
| 84. | Escondido | 110 | 17,937(0.61%)#28 | 83,187(0.13%)#84 |
| 85. | Sandy | 110 | 1,545(7.12%)#2 | 83,187(0.13%)#85 |
| 86. | Salem | 109 | 2,055(5.30%)#3 | 83,187(0.13%)#86 |
| 87. | San Mateo | 109 | 17,937(0.61%)#29 | 83,187(0.13%)#87 |
| 88. | Gretna | 107 | 632(16.93%)#2 | 83,187(0.13%)#88 |
| 89. | Norfolk | 105 | 2,246(4.67%)#4 | 83,187(0.13%)#89 |
| 90. | Pleasanton | 105 | 17,937(0.59%)#30 | 83,187(0.13%)#90 |
| 91. | Kenmore | 104 | 3,414(3.05%)#4 | 83,187(0.13%)#91 |
| 92. | Upland | 103 | 17,937(0.57%)#31 | 83,187(0.12%)#92 |
| 93. | Hilton Head Island | 103 | 727(14.17%)#1 | 83,187(0.12%)#93 |
| 94. | Aptos | 103 | 17,937(0.57%)#32 | 83,187(0.12%)#94 |
| 95. | Millcreek | 102 | 1,545(6.60%)#3 | 83,187(0.12%)#95 |
| 96. | Tarpon Springs | 101 | 8,103(1.25%)#8 | 83,187(0.12%)#96 |
| 97. | Lafayette | 101 | 17,937(0.56%)#33 | 83,187(0.12%)#97 |
| 98. | Wichita | 100 | 363(27.55%)#1 | 83,187(0.12%)#98 |
| 99. | Hudsonville | 99 | 3,681(2.69%)#3 | 83,187(0.12%)#99 |
| 100. | Carmel By The Sea | 99 | 17,937(0.55%)#34 | 83,187(0.12%)#100 |
Common Questions
What are the Top 10 Cities with the Most Immigrants from Netherlands in the United States?
Top 10 Cities with the Most Immigrants from Netherlands in the United States are:
What city has the Most Immigrants from Netherlands in the United States?
New York has the Most Immigrants from Netherlands in the United States with 2,903.
What is the Total Immigrants from Netherlands in the United States?
Total Immigrants from Netherlands in the United States is 83,187.