Cities with the Largest Mexican American Indian Community in the United States
RELATED REPORTS & OPTIONS
Mexican American Indian
United States
Compare Cities
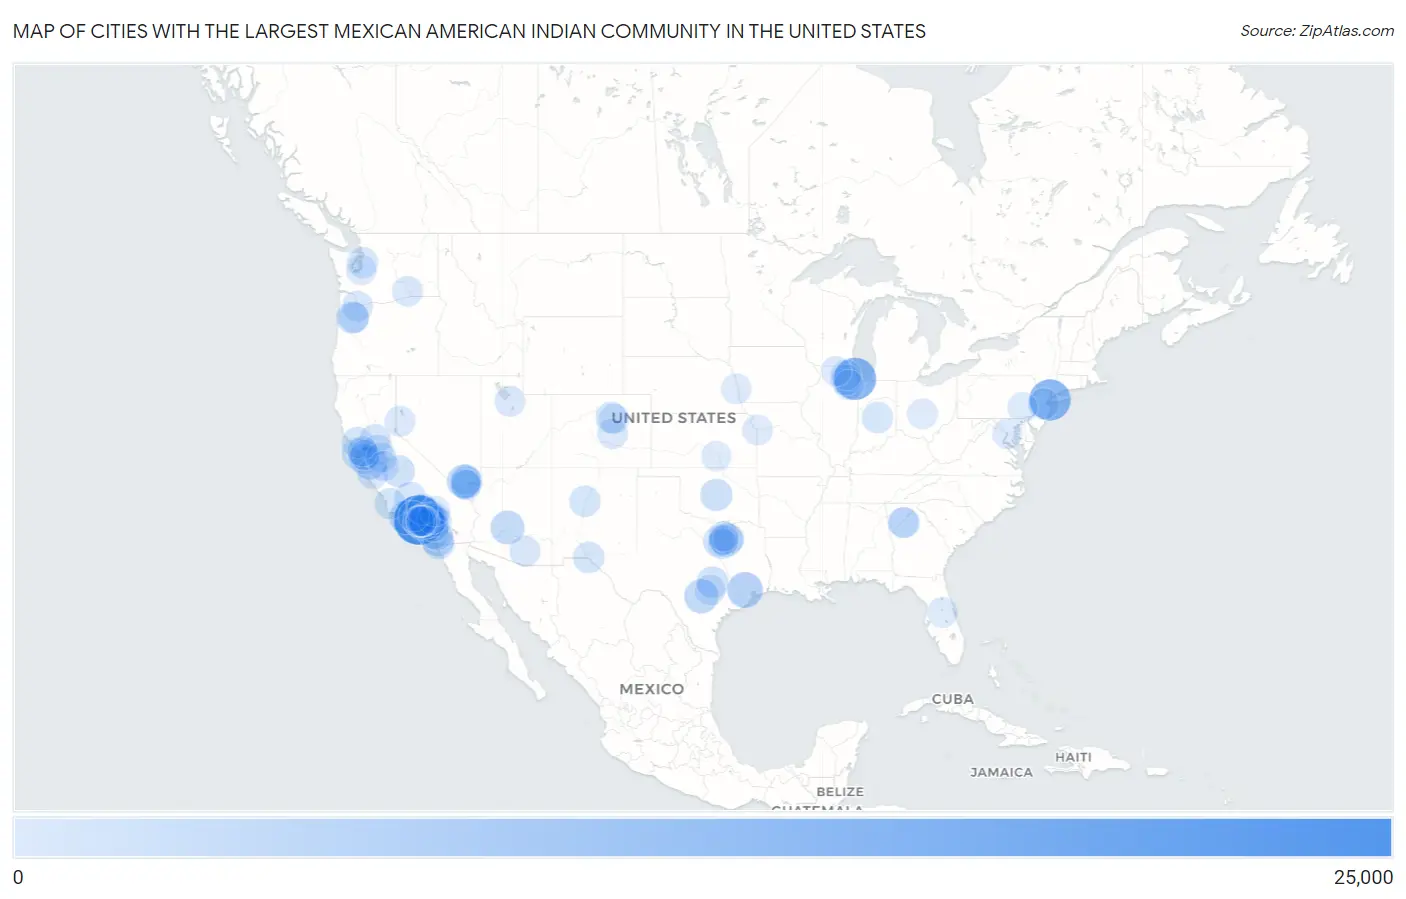
Map of Cities with the Largest Mexican American Indian Community in the United States
0
25,000
Cities with the Largest Mexican American Indian Community in the United States
| City | Mexican American Indian | vs State | vs National | |
| 1. | Los Angeles | 24,074 | 190,892(12.61%)#1 | 517,224(4.65%)#1 |
| 2. | Chicago | 14,918 | 37,033(40.28%)#1 | 517,224(2.88%)#2 |
| 3. | New York | 13,850 | 20,083(68.96%)#1 | 517,224(2.68%)#3 |
| 4. | Houston | 6,906 | 67,933(10.17%)#1 | 517,224(1.34%)#4 |
| 5. | San Antonio | 5,089 | 67,933(7.49%)#2 | 517,224(0.98%)#5 |
| 6. | San Jose | 5,024 | 190,892(2.63%)#2 | 517,224(0.97%)#6 |
| 7. | Phoenix | 4,766 | 13,482(35.35%)#1 | 517,224(0.92%)#7 |
| 8. | Oxnard | 4,602 | 190,892(2.41%)#3 | 517,224(0.89%)#8 |
| 9. | Dallas | 4,529 | 67,933(6.67%)#3 | 517,224(0.88%)#9 |
| 10. | Las Vegas | 4,489 | 13,594(33.02%)#1 | 517,224(0.87%)#10 |
| 11. | San Diego | 3,420 | 190,892(1.79%)#4 | 517,224(0.66%)#11 |
| 12. | Salem | 2,952 | 15,473(19.08%)#1 | 517,224(0.57%)#12 |
| 13. | Long Beach | 2,947 | 190,892(1.54%)#5 | 517,224(0.57%)#13 |
| 14. | Oklahoma City | 2,868 | 5,728(50.07%)#1 | 517,224(0.55%)#14 |
| 15. | Fresno | 2,550 | 190,892(1.34%)#6 | 517,224(0.49%)#15 |
| 16. | Austin | 2,523 | 67,933(3.71%)#4 | 517,224(0.49%)#16 |
| 17. | Santa Ana | 2,415 | 190,892(1.27%)#7 | 517,224(0.47%)#17 |
| 18. | Sunrise Manor | 2,397 | 13,594(17.63%)#2 | 517,224(0.46%)#18 |
| 19. | Baldwin Park | 2,372 | 190,892(1.24%)#8 | 517,224(0.46%)#19 |
| 20. | Pomona | 2,130 | 190,892(1.12%)#9 | 517,224(0.41%)#20 |
| 21. | Oakland | 1,988 | 190,892(1.04%)#10 | 517,224(0.38%)#21 |
| 22. | Sacramento | 1,977 | 190,892(1.04%)#11 | 517,224(0.38%)#22 |
| 23. | Chula Vista | 1,972 | 190,892(1.03%)#12 | 517,224(0.38%)#23 |
| 24. | El Paso | 1,920 | 67,933(2.83%)#5 | 517,224(0.37%)#24 |
| 25. | Fort Worth | 1,918 | 67,933(2.82%)#6 | 517,224(0.37%)#25 |
| 26. | Albuquerque | 1,865 | 4,972(37.51%)#1 | 517,224(0.36%)#26 |
| 27. | East Los Angeles | 1,832 | 190,892(0.96%)#13 | 517,224(0.35%)#27 |
| 28. | Denver | 1,822 | 10,533(17.30%)#1 | 517,224(0.35%)#28 |
| 29. | Bakersfield | 1,803 | 190,892(0.94%)#14 | 517,224(0.35%)#29 |
| 30. | San Francisco | 1,801 | 190,892(0.94%)#15 | 517,224(0.35%)#30 |
| 31. | El Monte | 1,772 | 190,892(0.93%)#16 | 517,224(0.34%)#31 |
| 32. | Santa Rosa | 1,767 | 190,892(0.93%)#17 | 517,224(0.34%)#32 |
| 33. | Santa Maria | 1,763 | 190,892(0.92%)#18 | 517,224(0.34%)#33 |
| 34. | San Bernardino | 1,727 | 190,892(0.90%)#19 | 517,224(0.33%)#34 |
| 35. | Anaheim | 1,682 | 190,892(0.88%)#20 | 517,224(0.33%)#35 |
| 36. | Indianapolis | 1,673 | 5,706(29.32%)#1 | 517,224(0.32%)#36 |
| 37. | Ontario | 1,596 | 190,892(0.84%)#21 | 517,224(0.31%)#37 |
| 38. | Hawthorne | 1,508 | 190,892(0.79%)#22 | 517,224(0.29%)#38 |
| 39. | Seattle | 1,491 | 15,097(9.88%)#1 | 517,224(0.29%)#39 |
| 40. | Riverside | 1,374 | 190,892(0.72%)#23 | 517,224(0.27%)#40 |
| 41. | Tucson | 1,346 | 13,482(9.98%)#2 | 517,224(0.26%)#41 |
| 42. | New Brunswick | 1,337 | 7,761(17.23%)#1 | 517,224(0.26%)#42 |
| 43. | Stockton | 1,307 | 190,892(0.68%)#24 | 517,224(0.25%)#43 |
| 44. | Portland | 1,294 | 15,473(8.36%)#2 | 517,224(0.25%)#44 |
| 45. | Rancho Cucamonga | 1,286 | 190,892(0.67%)#25 | 517,224(0.25%)#45 |
| 46. | Pasco | 1,244 | 15,097(8.24%)#2 | 517,224(0.24%)#46 |
| 47. | Oceanside | 1,207 | 190,892(0.63%)#26 | 517,224(0.23%)#47 |
| 48. | Chamblee | 1,198 | 12,883(9.30%)#1 | 517,224(0.23%)#48 |
| 49. | Brookhaven | 1,172 | 12,883(9.10%)#2 | 517,224(0.23%)#49 |
| 50. | Downey | 1,159 | 190,892(0.61%)#27 | 517,224(0.22%)#50 |
| 51. | Pico Rivera | 1,145 | 190,892(0.60%)#28 | 517,224(0.22%)#51 |
| 52. | Redwood City | 1,129 | 190,892(0.59%)#29 | 517,224(0.22%)#52 |
| 53. | San Marcos | 1,121 | 67,933(1.65%)#7 | 517,224(0.22%)#53 |
| 54. | Corona | 1,101 | 190,892(0.58%)#30 | 517,224(0.21%)#54 |
| 55. | Salinas | 1,092 | 190,892(0.57%)#31 | 517,224(0.21%)#55 |
| 56. | West Valley City | 1,088 | 5,763(18.88%)#1 | 517,224(0.21%)#56 |
| 57. | Sparks | 1,074 | 13,594(7.90%)#3 | 517,224(0.21%)#57 |
| 58. | Moreno Valley | 1,055 | 190,892(0.55%)#32 | 517,224(0.20%)#58 |
| 59. | Escondido | 1,038 | 190,892(0.54%)#33 | 517,224(0.20%)#59 |
| 60. | North Las Vegas | 1,034 | 13,594(7.61%)#4 | 517,224(0.20%)#60 |
| 61. | Aurora | 1,030 | 37,033(2.78%)#2 | 517,224(0.20%)#61 |
| 62. | Montebello | 1,028 | 190,892(0.54%)#34 | 517,224(0.20%)#62 |
| 63. | Lake Elsinore | 1,004 | 190,892(0.53%)#35 | 517,224(0.19%)#63 |
| 64. | Colorado Springs | 974 | 10,533(9.25%)#2 | 517,224(0.19%)#64 |
| 65. | Four Corners | 955 | 15,473(6.17%)#3 | 517,224(0.18%)#65 |
| 66. | Norwalk | 935 | 190,892(0.49%)#36 | 517,224(0.18%)#66 |
| 67. | San Leandro | 914 | 190,892(0.48%)#37 | 517,224(0.18%)#67 |
| 68. | Garland | 912 | 67,933(1.34%)#8 | 517,224(0.18%)#68 |
| 69. | Modesto | 912 | 190,892(0.48%)#38 | 517,224(0.18%)#69 |
| 70. | Garden Grove | 876 | 190,892(0.46%)#39 | 517,224(0.17%)#70 |
| 71. | Elgin | 874 | 37,033(2.36%)#3 | 517,224(0.17%)#71 |
| 72. | Lancaster | 872 | 190,892(0.46%)#40 | 517,224(0.17%)#72 |
| 73. | Florence Graham | 868 | 190,892(0.45%)#41 | 517,224(0.17%)#73 |
| 74. | South Gate | 865 | 190,892(0.45%)#42 | 517,224(0.17%)#74 |
| 75. | Grand Prairie | 862 | 67,933(1.27%)#9 | 517,224(0.17%)#75 |
| 76. | Huntington Park | 860 | 190,892(0.45%)#43 | 517,224(0.17%)#76 |
| 77. | Fontana | 833 | 190,892(0.44%)#44 | 517,224(0.16%)#77 |
| 78. | Reading | 830 | 4,631(17.92%)#1 | 517,224(0.16%)#78 |
| 79. | Columbus | 819 | 2,967(27.60%)#1 | 517,224(0.16%)#79 |
| 80. | Lewisville | 787 | 67,933(1.16%)#10 | 517,224(0.15%)#80 |
| 81. | Aurora | 773 | 10,533(7.34%)#3 | 517,224(0.15%)#81 |
| 82. | Kansas City | 772 | 2,285(33.79%)#1 | 517,224(0.15%)#82 |
| 83. | Horizon West | 772 | 13,892(5.56%)#1 | 517,224(0.15%)#83 |
| 84. | Tacoma | 768 | 15,097(5.09%)#3 | 517,224(0.15%)#84 |
| 85. | Joliet | 761 | 37,033(2.05%)#4 | 517,224(0.15%)#85 |
| 86. | Paradise | 758 | 13,594(5.58%)#5 | 517,224(0.15%)#86 |
| 87. | Richmond | 758 | 190,892(0.40%)#45 | 517,224(0.15%)#87 |
| 88. | Irving | 742 | 67,933(1.09%)#11 | 517,224(0.14%)#88 |
| 89. | Palmdale | 742 | 190,892(0.39%)#46 | 517,224(0.14%)#89 |
| 90. | Apple Valley | 740 | 190,892(0.39%)#47 | 517,224(0.14%)#90 |
| 91. | Henderson | 732 | 13,594(5.38%)#6 | 517,224(0.14%)#91 |
| 92. | Omaha | 725 | 2,324(31.20%)#1 | 517,224(0.14%)#92 |
| 93. | Whittier | 722 | 190,892(0.38%)#48 | 517,224(0.14%)#93 |
| 94. | Los Banos | 719 | 190,892(0.38%)#49 | 517,224(0.14%)#94 |
| 95. | Simi Valley | 715 | 190,892(0.37%)#50 | 517,224(0.14%)#95 |
| 96. | Lynwood | 715 | 190,892(0.37%)#51 | 517,224(0.14%)#96 |
| 97. | Washington | 709 | 709(100.00%)#1 | 517,224(0.14%)#97 |
| 98. | Inglewood | 705 | 190,892(0.37%)#52 | 517,224(0.14%)#98 |
| 99. | Rockford | 702 | 37,033(1.90%)#5 | 517,224(0.14%)#99 |
| 100. | Wichita | 697 | 3,066(22.73%)#1 | 517,224(0.13%)#100 |
Common Questions
What are the Top 10 Cities with the Largest Mexican American Indian Community in the United States?
Top 10 Cities with the Largest Mexican American Indian Community in the United States are:
What city has the Largest Mexican American Indian Community in the United States?
Los Angeles has the Largest Mexican American Indian Community in the United States with 24,074.
What is the Total Mexican American Indian Population in the United States?
Total Mexican American Indian Population in the United States is 517,224.