Cities with the Highest Renter-Occupied Median Costs of Housing in the United States
RELATED REPORTS & OPTIONS
Highest Renter Housing Costs
United States
Compare Cities
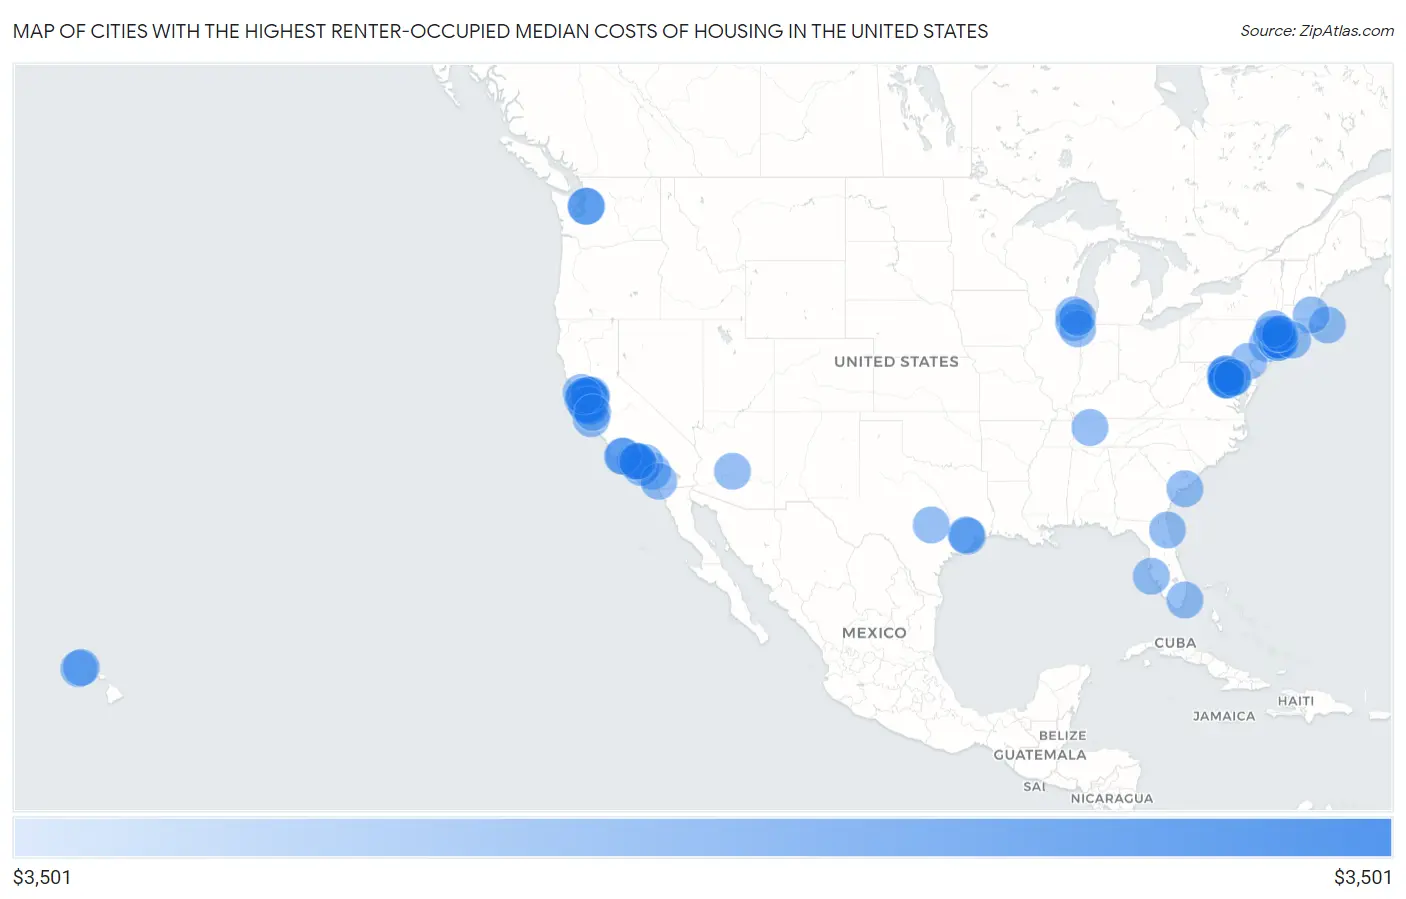
Map of Cities with the Highest Renter-Occupied Median Costs of Housing in the United States
$0
$4,000
Cities with the Highest Renter-Occupied Median Costs of Housing in the United States
| City | Housing Costs | vs State | vs National | |
| 1. | Cupertino | $3,501 | $1,856(+1.65k)#1 | $1,268(+2.23k)#1 |
| 2. | Danville | $3,501 | $1,856(+1.65k)#2 | $1,268(+2.23k)#2 |
| 3. | Foster City | $3,501 | $1,856(+1.65k)#3 | $1,268(+2.23k)#3 |
| 4. | Los Altos | $3,501 | $1,856(+1.65k)#4 | $1,268(+2.23k)#4 |
| 5. | Saratoga | $3,501 | $1,856(+1.65k)#5 | $1,268(+2.23k)#5 |
| 6. | Nocatee | $3,501 | $1,444(+2.06k)#1 | $1,268(+2.23k)#6 |
| 7. | La Canada Flintridge | $3,501 | $1,856(+1.65k)#6 | $1,268(+2.23k)#7 |
| 8. | Scarsdale | $3,501 | $1,507(+1.99k)#1 | $1,268(+2.23k)#8 |
| 9. | Fort Hunt | $3,501 | $1,440(+2.06k)#1 | $1,268(+2.23k)#9 |
| 10. | Wolf Trap | $3,501 | $1,440(+2.06k)#2 | $1,268(+2.23k)#10 |
| 11. | Coto De Caza | $3,501 | $1,856(+1.65k)#7 | $1,268(+2.23k)#11 |
| 12. | West University Place | $3,501 | $1,251(+2.25k)#1 | $1,268(+2.23k)#12 |
| 13. | Key Biscayne | $3,501 | $1,444(+2.06k)#2 | $1,268(+2.23k)#13 |
| 14. | Short Hills | $3,501 | $1,577(+1.92k)#1 | $1,268(+2.23k)#14 |
| 15. | Alamo | $3,501 | $1,856(+1.65k)#8 | $1,268(+2.23k)#15 |
| 16. | Hockessin | $3,501 | $1,286(+2.21k)#1 | $1,268(+2.23k)#16 |
| 17. | Paradise Valley | $3,501 | $1,308(+2.19k)#1 | $1,268(+2.23k)#17 |
| 18. | Brock Hall | $3,501 | $1,598(+1.90k)#1 | $1,268(+2.23k)#18 |
| 19. | San Marino | $3,501 | $1,856(+1.65k)#9 | $1,268(+2.23k)#19 |
| 20. | Dranesville | $3,501 | $1,440(+2.06k)#3 | $1,268(+2.23k)#20 |
| 21. | Hillsborough | $3,501 | $1,856(+1.65k)#10 | $1,268(+2.23k)#21 |
| 22. | Piedmont | $3,501 | $1,856(+1.65k)#11 | $1,268(+2.23k)#22 |
| 23. | Clayton | $3,501 | $1,856(+1.65k)#12 | $1,268(+2.23k)#23 |
| 24. | Blackhawk | $3,501 | $1,856(+1.65k)#13 | $1,268(+2.23k)#24 |
| 25. | Camp Pendleton Mainside | $3,501 | $1,856(+1.65k)#14 | $1,268(+2.23k)#25 |
| 26. | Hickam Housing | $3,501 | $1,868(+1.63k)#1 | $1,268(+2.23k)#26 |
| 27. | Dunn Loring | $3,501 | $1,440(+2.06k)#4 | $1,268(+2.23k)#27 |
| 28. | Montecito | $3,501 | $1,856(+1.65k)#15 | $1,268(+2.23k)#28 |
| 29. | Los Altos Hills | $3,501 | $1,856(+1.65k)#16 | $1,268(+2.23k)#29 |
| 30. | Upper Saddle River Borough | $3,501 | $1,577(+1.92k)#2 | $1,268(+2.23k)#30 |
| 31. | Long Grove | $3,501 | $1,179(+2.32k)#1 | $1,268(+2.23k)#31 |
| 32. | Rolling Hills Estates | $3,501 | $1,856(+1.65k)#17 | $1,268(+2.23k)#32 |
| 33. | Topanga | $3,501 | $1,856(+1.65k)#18 | $1,268(+2.23k)#33 |
| 34. | Oak Brook | $3,501 | $1,179(+2.32k)#2 | $1,268(+2.23k)#34 |
| 35. | Westlake Village | $3,501 | $1,856(+1.65k)#19 | $1,268(+2.23k)#35 |
| 36. | Atherton | $3,501 | $1,856(+1.65k)#20 | $1,268(+2.23k)#36 |
| 37. | Old Greenwich | $3,501 | $1,374(+2.13k)#1 | $1,268(+2.23k)#37 |
| 38. | Mountainside Borough | $3,501 | $1,577(+1.92k)#3 | $1,268(+2.23k)#38 |
| 39. | South Run | $3,501 | $1,440(+2.06k)#5 | $1,268(+2.23k)#39 |
| 40. | Darnestown | $3,501 | $1,598(+1.90k)#2 | $1,268(+2.23k)#40 |
| 41. | Lucas Valley Marinwood | $3,501 | $1,856(+1.65k)#21 | $1,268(+2.23k)#41 |
| 42. | Fair Haven Borough | $3,501 | $1,577(+1.92k)#4 | $1,268(+2.23k)#42 |
| 43. | Little Silver Borough | $3,501 | $1,577(+1.92k)#5 | $1,268(+2.23k)#43 |
| 44. | Daniels Farm | $3,501 | $1,374(+2.13k)#2 | $1,268(+2.23k)#44 |
| 45. | Tehaleh | $3,501 | $1,592(+1.91k)#1 | $1,268(+2.23k)#45 |
| 46. | Noroton | $3,501 | $1,374(+2.13k)#3 | $1,268(+2.23k)#46 |
| 47. | Kings Point | $3,501 | $1,507(+1.99k)#2 | $1,268(+2.23k)#47 |
| 48. | North Hills | $3,501 | $1,507(+1.99k)#3 | $1,268(+2.23k)#48 |
| 49. | Englewood Cliffs Borough | $3,501 | $1,577(+1.92k)#6 | $1,268(+2.23k)#49 |
| 50. | Kensington | $3,501 | $1,856(+1.65k)#22 | $1,268(+2.23k)#50 |
| 51. | Crosspointe | $3,501 | $1,440(+2.06k)#6 | $1,268(+2.23k)#51 |
| 52. | Woodside | $3,501 | $1,856(+1.65k)#23 | $1,268(+2.23k)#52 |
| 53. | Ardsley | $3,501 | $1,507(+1.99k)#4 | $1,268(+2.23k)#53 |
| 54. | Demarest Borough | $3,501 | $1,577(+1.92k)#7 | $1,268(+2.23k)#54 |
| 55. | Olympia Fields | $3,501 | $1,179(+2.32k)#3 | $1,268(+2.23k)#55 |
| 56. | Harrington Park Borough | $3,501 | $1,577(+1.92k)#8 | $1,268(+2.23k)#56 |
| 57. | Mountain Lakes Borough | $3,501 | $1,577(+1.92k)#9 | $1,268(+2.23k)#57 |
| 58. | Emerald Lake Hills | $3,501 | $1,856(+1.65k)#24 | $1,268(+2.23k)#58 |
| 59. | Broadmoor | $3,501 | $1,856(+1.65k)#25 | $1,268(+2.23k)#59 |
| 60. | Old Westbury | $3,501 | $1,507(+1.99k)#5 | $1,268(+2.23k)#60 |
| 61. | Portola Valley | $3,501 | $1,856(+1.65k)#26 | $1,268(+2.23k)#61 |
| 62. | Woodmore | $3,501 | $1,598(+1.90k)#3 | $1,268(+2.23k)#62 |
| 63. | Herricks | $3,501 | $1,507(+1.99k)#6 | $1,268(+2.23k)#63 |
| 64. | Spring Valley Village | $3,501 | $1,251(+2.25k)#2 | $1,268(+2.23k)#64 |
| 65. | Shrewsbury Borough | $3,501 | $1,577(+1.92k)#10 | $1,268(+2.23k)#65 |
| 66. | Northwest Harwich | $3,501 | $1,588(+1.91k)#1 | $1,268(+2.23k)#66 |
| 67. | Pomona | $3,501 | $1,507(+1.99k)#7 | $1,268(+2.23k)#67 |
| 68. | Loyola | $3,501 | $1,856(+1.65k)#27 | $1,268(+2.23k)#68 |
| 69. | Setauket | $3,501 | $1,507(+1.99k)#8 | $1,268(+2.23k)#69 |
| 70. | East Basin | $3,501 | $1,302(+2.20k)#1 | $1,268(+2.23k)#70 |
| 71. | Del Monte Forest | $3,501 | $1,856(+1.65k)#28 | $1,268(+2.23k)#71 |
| 72. | Reliez Valley | $3,501 | $1,856(+1.65k)#29 | $1,268(+2.23k)#72 |
| 73. | Clyde Hill | $3,501 | $1,592(+1.91k)#2 | $1,268(+2.23k)#73 |
| 74. | Greens Farms | $3,501 | $1,374(+2.13k)#4 | $1,268(+2.23k)#74 |
| 75. | Rancho Santa Fe | $3,501 | $1,856(+1.65k)#30 | $1,268(+2.23k)#75 |
| 76. | Belle Meade | $3,501 | $1,047(+2.45k)#1 | $1,268(+2.23k)#76 |
| 77. | Medina | $3,501 | $1,592(+1.91k)#3 | $1,268(+2.23k)#77 |
| 78. | One Loudoun | $3,501 | $1,440(+2.06k)#7 | $1,268(+2.23k)#78 |
| 79. | Highlands | $3,501 | $1,856(+1.65k)#31 | $1,268(+2.23k)#79 |
| 80. | Sands Point | $3,501 | $1,507(+1.99k)#9 | $1,268(+2.23k)#80 |
| 81. | Vamo | $3,501 | $1,444(+2.06k)#3 | $1,268(+2.23k)#81 |
| 82. | Kenilworth | $3,501 | $1,179(+2.32k)#4 | $1,268(+2.23k)#82 |
| 83. | Dover | $3,501 | $1,588(+1.91k)#2 | $1,268(+2.23k)#83 |
| 84. | The Hills | $3,501 | $1,251(+2.25k)#3 | $1,268(+2.23k)#84 |
| 85. | Mission Canyon | $3,501 | $1,856(+1.65k)#32 | $1,268(+2.23k)#85 |
| 86. | Belvedere | $3,501 | $1,856(+1.65k)#33 | $1,268(+2.23k)#86 |
| 87. | Essex Fells Borough | $3,501 | $1,577(+1.92k)#11 | $1,268(+2.23k)#87 |
| 88. | Hidden Hills | $3,501 | $1,856(+1.65k)#34 | $1,268(+2.23k)#88 |
| 89. | Maunawili | $3,501 | $1,868(+1.63k)#2 | $1,268(+2.23k)#89 |
| 90. | Seabrook Island | $3,501 | $1,065(+2.44k)#1 | $1,268(+2.23k)#90 |
| 91. | Laurel Hollow | $3,501 | $1,507(+1.99k)#10 | $1,268(+2.23k)#91 |
| 92. | Harmony Grove | $3,501 | $1,856(+1.65k)#35 | $1,268(+2.23k)#93 |
| 93. | Lattingtown | $3,501 | $1,507(+1.99k)#11 | $1,268(+2.23k)#94 |
| 94. | Sea Girt Borough | $3,501 | $1,577(+1.92k)#12 | $1,268(+2.23k)#95 |
| 95. | Aquebogue | $3,501 | $1,507(+1.99k)#12 | $1,268(+2.23k)#96 |
| 96. | Katonah | $3,501 | $1,507(+1.99k)#13 | $1,268(+2.23k)#97 |
| 97. | Merritt Park | $3,501 | $1,507(+1.99k)#14 | $1,268(+2.23k)#98 |
| 98. | Aptos Hills Larkin Valley | $3,501 | $1,856(+1.65k)#36 | $1,268(+2.23k)#99 |
| 99. | Baywood Park | $3,501 | $1,856(+1.65k)#37 | $1,268(+2.23k)#100 |
| 100. | Georgetown | $3,501 | $1,374(+2.13k)#5 | $1,268(+2.23k)#101 |
Common Questions
What are the Top 10 Cities with the Highest Renter-Occupied Median Costs of Housing in the United States?
Top 10 Cities with the Highest Renter-Occupied Median Costs of Housing in the United States are:
What city has the Highest Renter-Occupied Median Costs of Housing in the United States?
Cupertino has the Highest Renter-Occupied Median Costs of Housing in the United States with $3,501.
What is the Median Renter-Occupied Housing Costs in the United States?
Median Renter-Occupied Housing Costs in the United States is $1,268.