Charleston, SC Map & Demographics
Charleston Map
Charleston Overview
$55,890
PER CAPITA INCOME
$117,849
AVG FAMILY INCOME
$83,891
AVG HOUSEHOLD INCOME
22.5%
WAGE / INCOME GAP [ % ]
77.5¢/ $1
WAGE / INCOME GAP [ $ ]
$11,336
FAMILY INCOME DEFICIT
0.50
INEQUALITY / GINI INDEX
149,960
TOTAL POPULATION
71,182
MALE POPULATION
78,778
FEMALE POPULATION
90.36
MALES / 100 FEMALES
110.67
FEMALES / 100 MALES
36.3
MEDIAN AGE
2.9
AVG FAMILY SIZE
2.2
AVG HOUSEHOLD SIZE
86,145
LABOR FORCE [ PEOPLE ]
67.6%
PERCENT IN LABOR FORCE
3.7%
UNEMPLOYMENT RATE
Charleston Area Codes
Income in Charleston
Income Overview in Charleston
Per Capita Income in Charleston is $55,890, while median incomes of families and households are $117,849 and $83,891 respectively.
| Characteristic | Number | Measure |
| Per Capita Income | 149,960 | $55,890 |
| Median Family Income | 33,833 | $117,849 |
| Mean Family Income | 33,833 | $163,046 |
| Median Household Income | 65,198 | $83,891 |
| Mean Household Income | 65,198 | $123,658 |
| Income Deficit | 33,833 | $11,336 |
| Wage / Income Gap (%) | 149,960 | 22.50% |
| Wage / Income Gap ($) | 149,960 | 77.50¢ per $1 |
| Gini / Inequality Index | 149,960 | 0.50 |
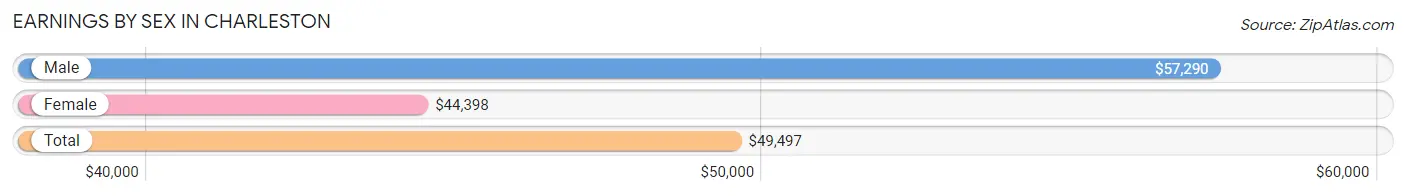
Earnings by Sex in Charleston
Average Earnings in Charleston are $49,497, $57,290 for men and $44,398 for women, a difference of 22.5%.
| Sex | Number | Average Earnings |
| Male | 45,269 (50.1%) | $57,290 |
| Female | 45,020 (49.9%) | $44,398 |
| Total | 90,289 (100.0%) | $49,497 |
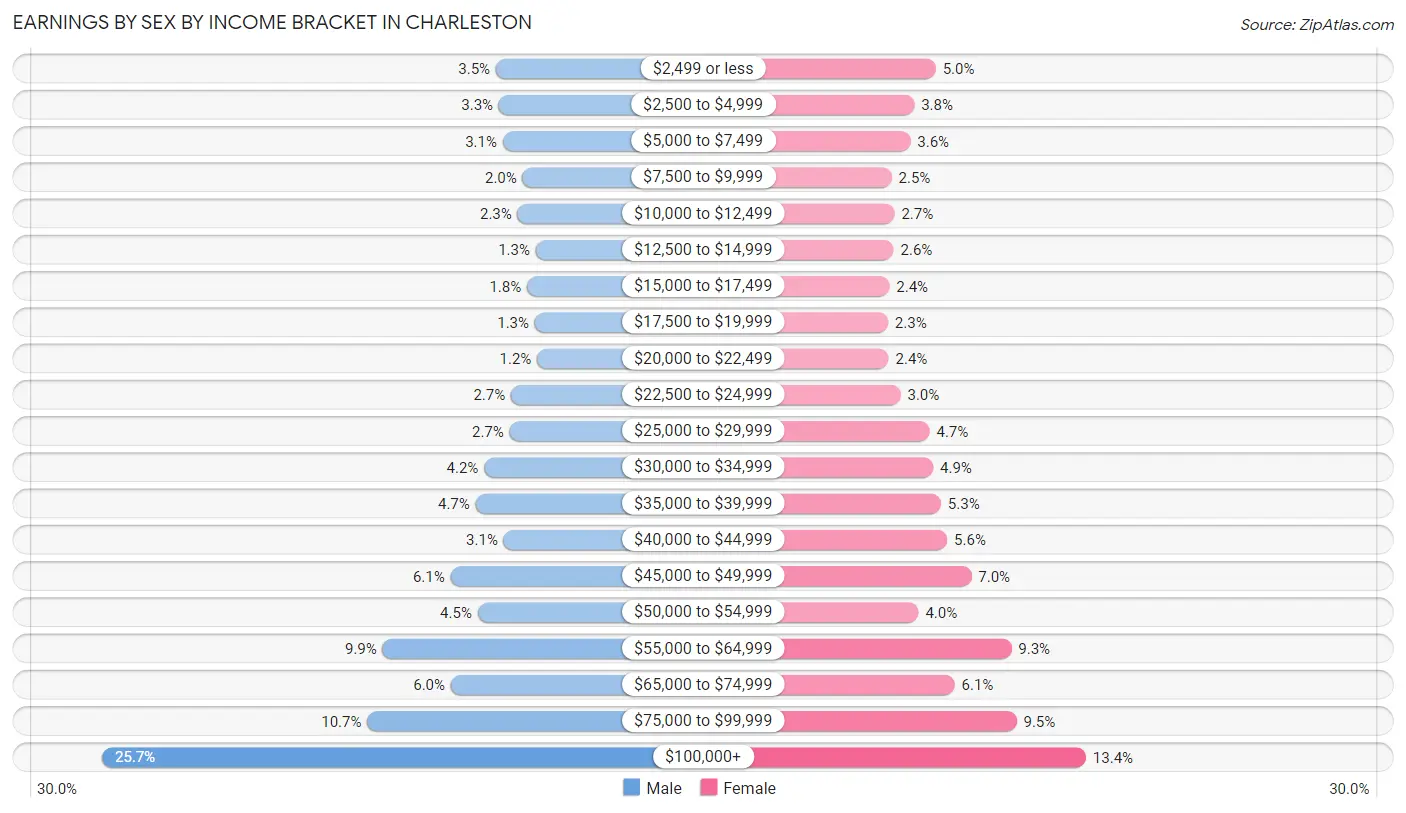
Earnings by Sex by Income Bracket in Charleston
The most common earnings brackets in Charleston are $100,000+ for men (11,611 | 25.7%) and $100,000+ for women (6,049 | 13.4%).
| Income | Male | Female |
| $2,499 or less | 1,589 (3.5%) | 2,251 (5.0%) |
| $2,500 to $4,999 | 1,512 (3.3%) | 1,705 (3.8%) |
| $5,000 to $7,499 | 1,413 (3.1%) | 1,608 (3.6%) |
| $7,500 to $9,999 | 911 (2.0%) | 1,135 (2.5%) |
| $10,000 to $12,499 | 1,035 (2.3%) | 1,208 (2.7%) |
| $12,500 to $14,999 | 576 (1.3%) | 1,185 (2.6%) |
| $15,000 to $17,499 | 798 (1.8%) | 1,075 (2.4%) |
| $17,500 to $19,999 | 596 (1.3%) | 1,038 (2.3%) |
| $20,000 to $22,499 | 537 (1.2%) | 1,056 (2.4%) |
| $22,500 to $24,999 | 1,203 (2.7%) | 1,359 (3.0%) |
| $25,000 to $29,999 | 1,242 (2.7%) | 2,095 (4.6%) |
| $30,000 to $34,999 | 1,889 (4.2%) | 2,185 (4.9%) |
| $35,000 to $39,999 | 2,107 (4.6%) | 2,381 (5.3%) |
| $40,000 to $44,999 | 1,388 (3.1%) | 2,539 (5.6%) |
| $45,000 to $49,999 | 2,744 (6.1%) | 3,151 (7.0%) |
| $50,000 to $54,999 | 2,052 (4.5%) | 1,816 (4.0%) |
| $55,000 to $64,999 | 4,471 (9.9%) | 4,163 (9.2%) |
| $65,000 to $74,999 | 2,733 (6.0%) | 2,727 (6.1%) |
| $75,000 to $99,999 | 4,862 (10.7%) | 4,294 (9.5%) |
| $100,000+ | 11,611 (25.7%) | 6,049 (13.4%) |
| Total | 45,269 (100.0%) | 45,020 (100.0%) |
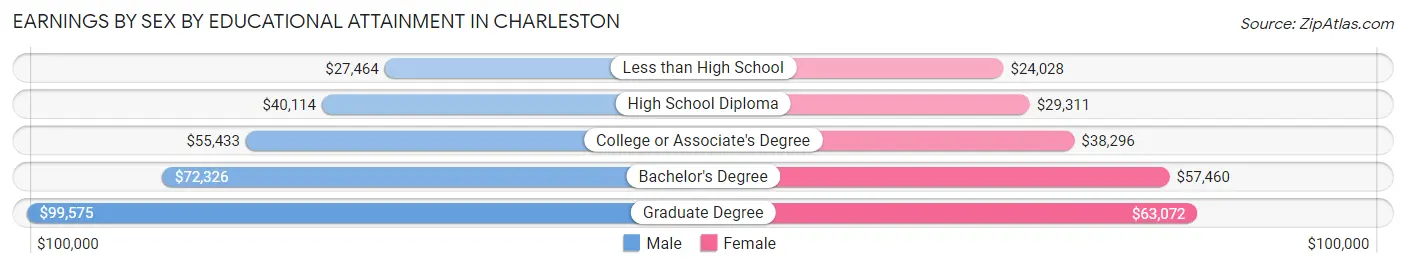
Earnings by Sex by Educational Attainment in Charleston
Average earnings in Charleston are $63,197 for men and $49,150 for women, a difference of 22.2%. Men with an educational attainment of graduate degree enjoy the highest average annual earnings of $99,575, while those with less than high school education earn the least with $27,464. Women with an educational attainment of graduate degree earn the most with the average annual earnings of $63,072, while those with less than high school education have the smallest earnings of $24,028.
| Educational Attainment | Male Income | Female Income |
| Less than High School | $27,464 | $24,028 |
| High School Diploma | $40,114 | $29,311 |
| College or Associate's Degree | $55,433 | $38,296 |
| Bachelor's Degree | $72,326 | $57,460 |
| Graduate Degree | $99,575 | $63,072 |
| Total | $63,197 | $49,150 |
Family Income in Charleston
Family Income Brackets in Charleston
According to the Charleston family income data, there are 7,714 families falling into the $200,000+ income range, which is the most common income bracket and makes up 22.8% of all families. Conversely, the $10,000 to $14,999 income bracket is the least frequent group with only 372 families (1.1%) belonging to this category.
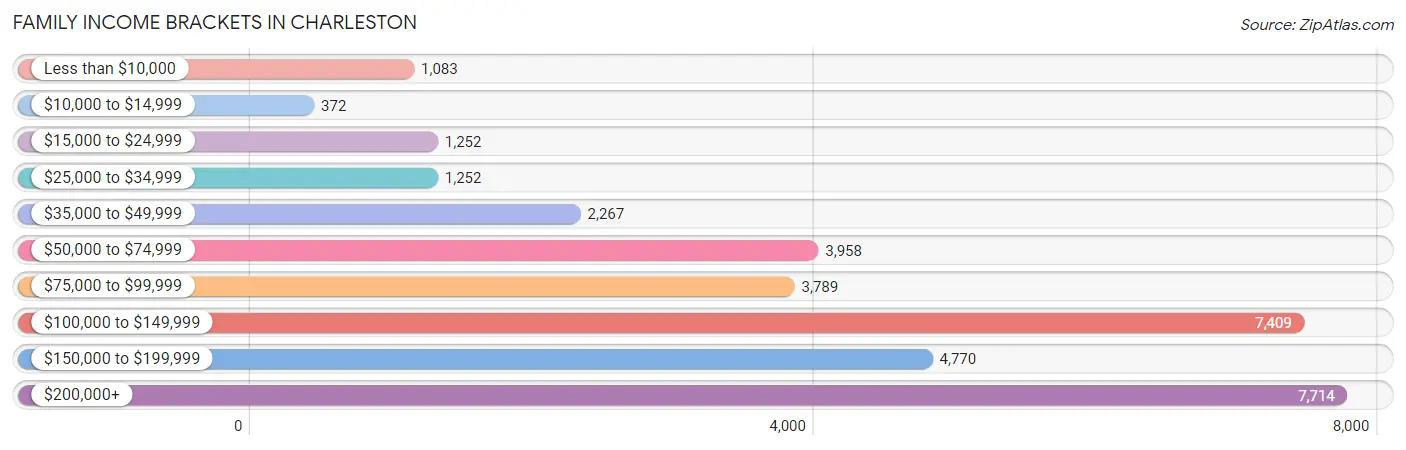
| Income Bracket | # Families | % Families |
| Less than $10,000 | 1,083 | 3.2% |
| $10,000 to $14,999 | 372 | 1.1% |
| $15,000 to $24,999 | 1,252 | 3.7% |
| $25,000 to $34,999 | 1,252 | 3.7% |
| $35,000 to $49,999 | 2,267 | 6.7% |
| $50,000 to $74,999 | 3,958 | 11.7% |
| $75,000 to $99,999 | 3,789 | 11.2% |
| $100,000 to $149,999 | 7,409 | 21.9% |
| $150,000 to $199,999 | 4,770 | 14.1% |
| $200,000+ | 7,714 | 22.8% |
Family Income by Famaliy Size in Charleston
5-person families (1,522 | 4.5%) account for the highest median family income in Charleston with $160,076 per family, while 2-person families (19,178 | 56.7%) have the highest median income of $53,228 per family member.
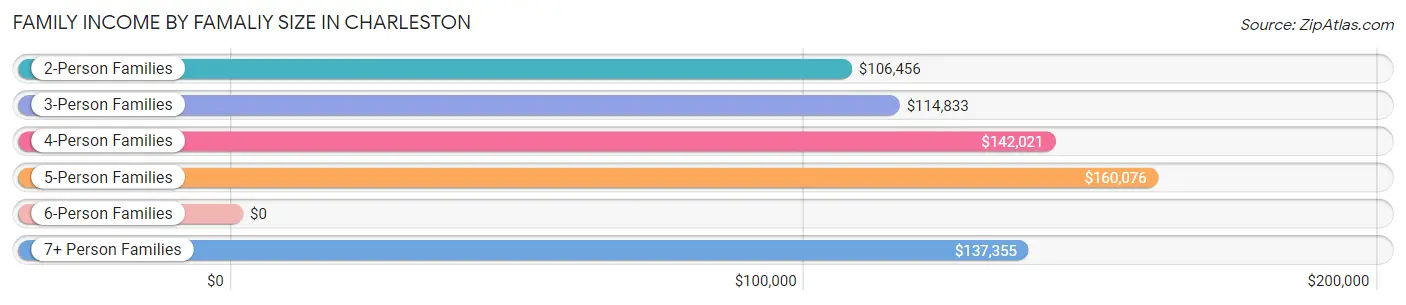
| Income Bracket | # Families | Median Income |
| 2-Person Families | 19,178 (56.7%) | $106,456 |
| 3-Person Families | 7,088 (20.9%) | $114,833 |
| 4-Person Families | 5,367 (15.9%) | $142,021 |
| 5-Person Families | 1,522 (4.5%) | $160,076 |
| 6-Person Families | 517 (1.5%) | $0 |
| 7+ Person Families | 161 (0.5%) | $137,355 |
| Total | 33,833 (100.0%) | $117,849 |
Family Income by Number of Earners in Charleston
The median family income in Charleston is $117,849, with families comprising 3+ earners (2,028) having the highest median family income of $164,615, while families with no earners (5,115) have the lowest median family income of $59,145, accounting for 6.0% and 15.1% of families, respectively.
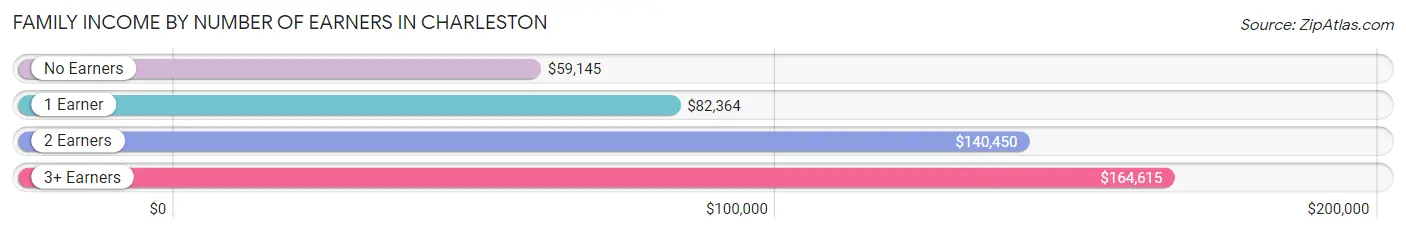
| Number of Earners | # Families | Median Income |
| No Earners | 5,115 (15.1%) | $59,145 |
| 1 Earner | 9,869 (29.2%) | $82,364 |
| 2 Earners | 16,821 (49.7%) | $140,450 |
| 3+ Earners | 2,028 (6.0%) | $164,615 |
| Total | 33,833 (100.0%) | $117,849 |
Household Income in Charleston
Household Income Brackets in Charleston
With 11,931 households falling in the category, the $100,000 to $149,999 income range is the most frequent in Charleston, accounting for 18.3% of all households. In contrast, only 1,434 households (2.2%) fall into the $10,000 to $14,999 income bracket, making it the least populous group.
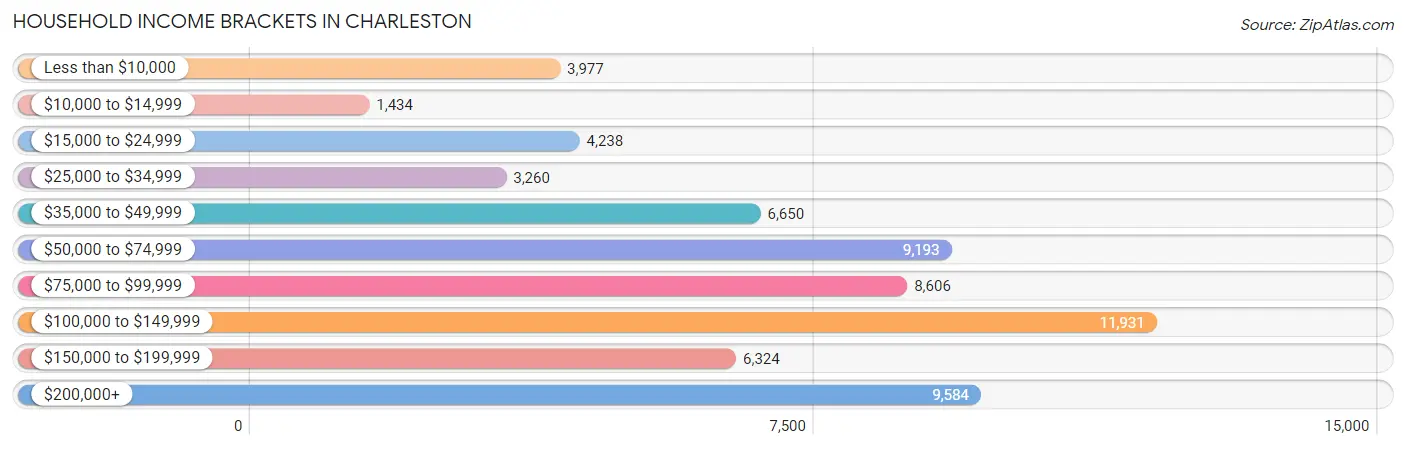
| Income Bracket | # Households | % Households |
| Less than $10,000 | 3,977 | 6.1% |
| $10,000 to $14,999 | 1,434 | 2.2% |
| $15,000 to $24,999 | 4,238 | 6.5% |
| $25,000 to $34,999 | 3,260 | 5.0% |
| $35,000 to $49,999 | 6,650 | 10.2% |
| $50,000 to $74,999 | 9,193 | 14.1% |
| $75,000 to $99,999 | 8,606 | 13.2% |
| $100,000 to $149,999 | 11,931 | 18.3% |
| $150,000 to $199,999 | 6,324 | 9.7% |
| $200,000+ | 9,584 | 14.7% |
Household Income by Householder Age in Charleston
The median household income in Charleston is $83,891, with the highest median household income of $106,345 found in the 45 to 64 years age bracket for the primary householder. A total of 19,342 households (29.7%) fall into this category. Meanwhile, the 15 to 24 years age bracket for the primary householder has the lowest median household income of $37,598, with 3,826 households (5.9%) in this group.
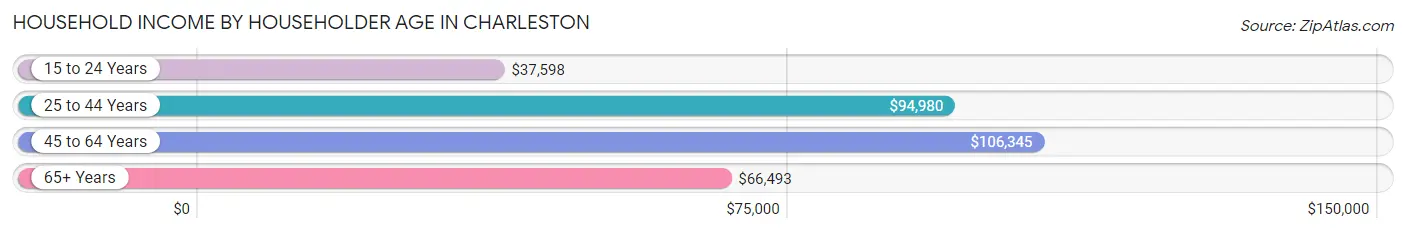
| Income Bracket | # Households | Median Income |
| 15 to 24 Years | 3,826 (5.9%) | $37,598 |
| 25 to 44 Years | 26,107 (40.0%) | $94,980 |
| 45 to 64 Years | 19,342 (29.7%) | $106,345 |
| 65+ Years | 15,923 (24.4%) | $66,493 |
| Total | 65,198 (100.0%) | $83,891 |
Poverty in Charleston
Income Below Poverty by Sex and Age in Charleston
With 10.6% poverty level for males and 14.4% for females among the residents of Charleston, 5 year old males and 18 to 24 year old females are the most vulnerable to poverty, with 326 males (36.8%) and 3,534 females (49.9%) in their respective age groups living below the poverty level.
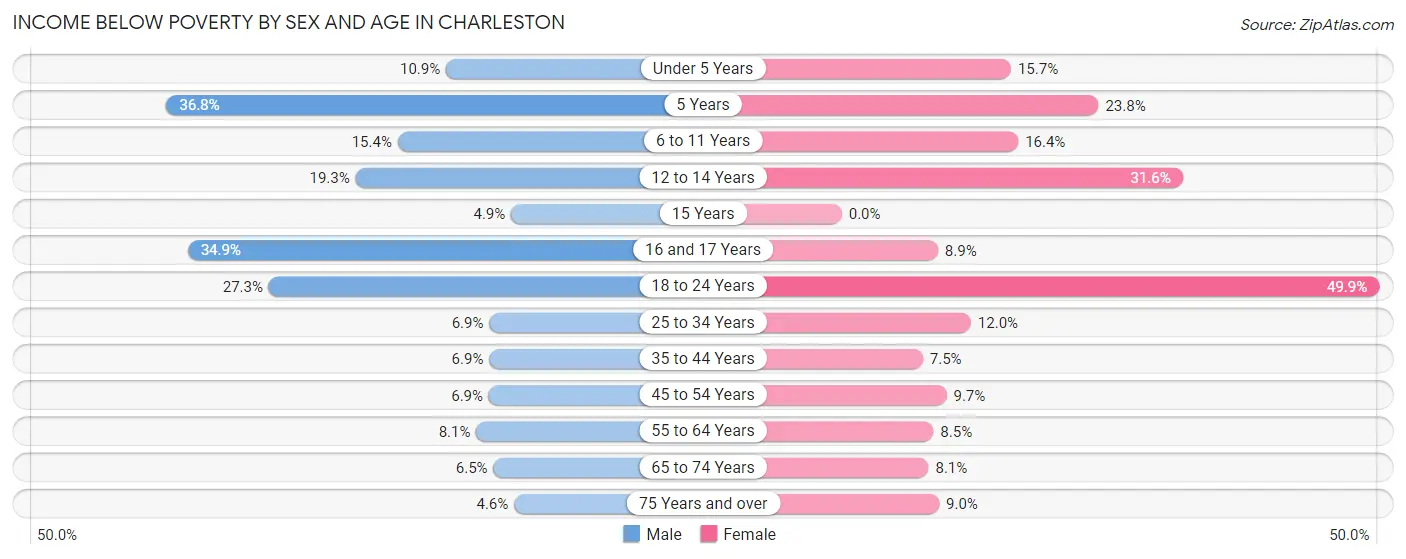
| Age Bracket | Male | Female |
| Under 5 Years | 376 (10.9%) | 682 (15.7%) |
| 5 Years | 326 (36.8%) | 162 (23.8%) |
| 6 to 11 Years | 689 (15.4%) | 581 (16.4%) |
| 12 to 14 Years | 294 (19.3%) | 567 (31.6%) |
| 15 Years | 38 (4.9%) | 0 (0.0%) |
| 16 and 17 Years | 404 (34.9%) | 126 (8.9%) |
| 18 to 24 Years | 1,630 (27.3%) | 3,534 (49.9%) |
| 25 to 34 Years | 973 (6.9%) | 1,783 (12.0%) |
| 35 to 44 Years | 682 (6.9%) | 761 (7.5%) |
| 45 to 54 Years | 515 (6.9%) | 821 (9.7%) |
| 55 to 64 Years | 649 (8.1%) | 790 (8.5%) |
| 65 to 74 Years | 393 (6.5%) | 665 (8.1%) |
| 75 Years and over | 158 (4.6%) | 554 (9.0%) |
| Total | 7,127 (10.6%) | 11,026 (14.4%) |
Income Above Poverty by Sex and Age in Charleston
According to the poverty statistics in Charleston, males aged 75 years and over and females aged 15 years are the age groups that are most secure financially, with 95.4% of males and 100.0% of females in these age groups living above the poverty line.
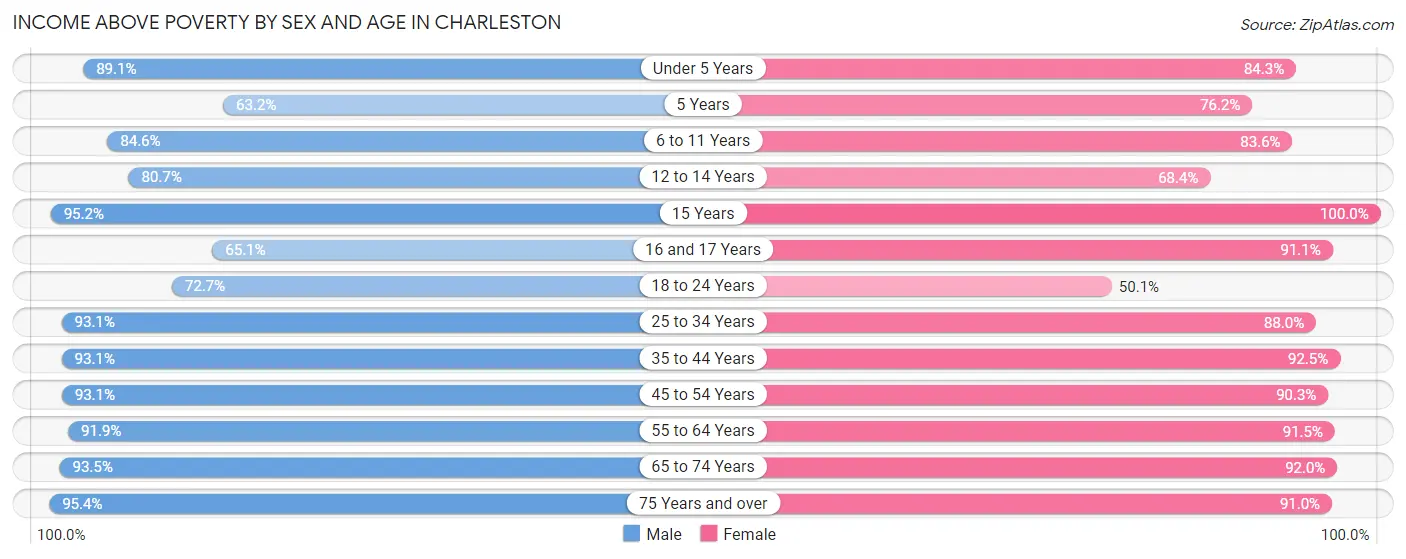
| Age Bracket | Male | Female |
| Under 5 Years | 3,078 (89.1%) | 3,663 (84.3%) |
| 5 Years | 559 (63.2%) | 518 (76.2%) |
| 6 to 11 Years | 3,795 (84.6%) | 2,968 (83.6%) |
| 12 to 14 Years | 1,230 (80.7%) | 1,226 (68.4%) |
| 15 Years | 746 (95.2%) | 756 (100.0%) |
| 16 and 17 Years | 755 (65.1%) | 1,287 (91.1%) |
| 18 to 24 Years | 4,332 (72.7%) | 3,554 (50.1%) |
| 25 to 34 Years | 13,197 (93.1%) | 13,101 (88.0%) |
| 35 to 44 Years | 9,231 (93.1%) | 9,365 (92.5%) |
| 45 to 54 Years | 6,941 (93.1%) | 7,622 (90.3%) |
| 55 to 64 Years | 7,379 (91.9%) | 8,501 (91.5%) |
| 65 to 74 Years | 5,663 (93.5%) | 7,591 (91.9%) |
| 75 Years and over | 3,300 (95.4%) | 5,583 (91.0%) |
| Total | 60,206 (89.4%) | 65,735 (85.6%) |
Income Below Poverty Among Married-Couple Families in Charleston
The poverty statistics for married-couple families in Charleston show that 3.3% or 881 of the total 26,475 families live below the poverty line. Families with 3 or 4 children have the highest poverty rate of 12.1%, comprising of 160 families. On the other hand, families with 5 or more children have the lowest poverty rate of 0.0%, which includes 0 families.
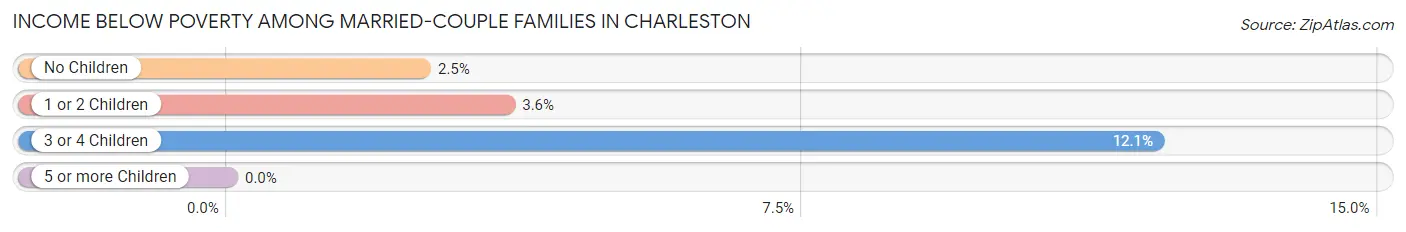
| Children | Above Poverty | Below Poverty |
| No Children | 16,529 (97.5%) | 427 (2.5%) |
| 1 or 2 Children | 7,828 (96.4%) | 294 (3.6%) |
| 3 or 4 Children | 1,162 (87.9%) | 160 (12.1%) |
| 5 or more Children | 75 (100.0%) | 0 (0.0%) |
| Total | 25,594 (96.7%) | 881 (3.3%) |
Income Below Poverty Among Single-Parent Households in Charleston
According to the poverty data in Charleston, 12.7% or 219 single-father households and 22.6% or 1,273 single-mother households are living below the poverty line. Among single-father households, those with 1 or 2 children have the highest poverty rate, with 153 households (21.3%) experiencing poverty. Likewise, among single-mother households, those with 5 or more children have the highest poverty rate, with 47 households (100.0%) falling below the poverty line.
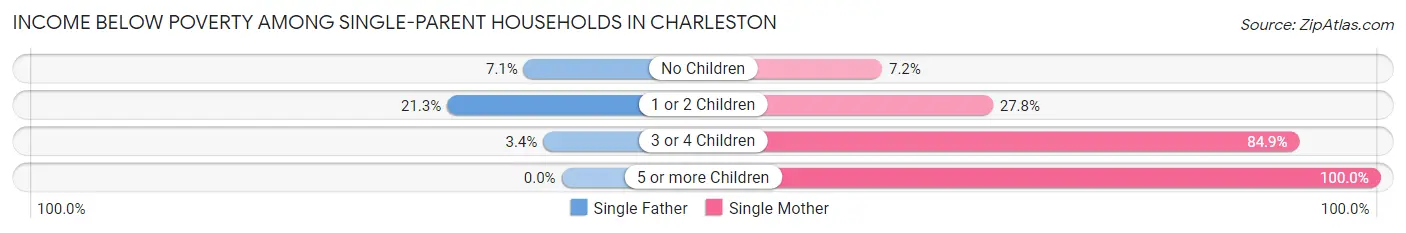
| Children | Single Father | Single Mother |
| No Children | 61 (7.0%) | 175 (7.1%) |
| 1 or 2 Children | 153 (21.3%) | 782 (27.8%) |
| 3 or 4 Children | 5 (3.4%) | 269 (84.9%) |
| 5 or more Children | 0 (0.0%) | 47 (100.0%) |
| Total | 219 (12.7%) | 1,273 (22.6%) |
Income Below Poverty Among Married-Couple vs Single-Parent Households in Charleston
The poverty data for Charleston shows that 881 of the married-couple family households (3.3%) and 1,492 of the single-parent households (20.3%) are living below the poverty level. Within the married-couple family households, those with 3 or 4 children have the highest poverty rate, with 160 households (12.1%) falling below the poverty line. Among the single-parent households, those with 5 or more children have the highest poverty rate, with 47 household (100.0%) living below poverty.
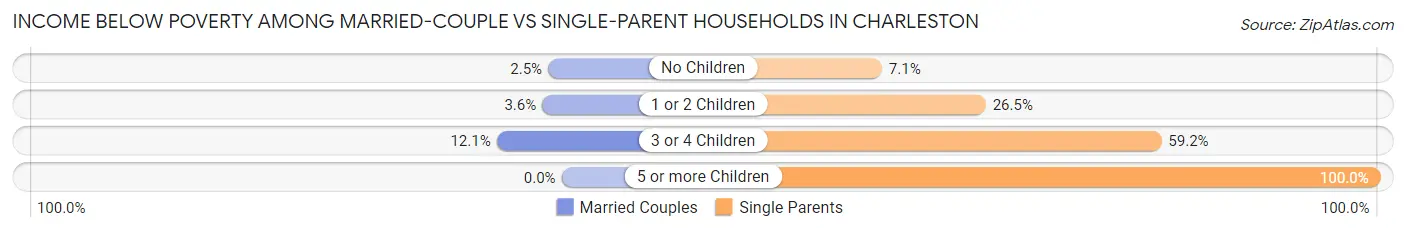
| Children | Married-Couple Families | Single-Parent Households |
| No Children | 427 (2.5%) | 236 (7.1%) |
| 1 or 2 Children | 294 (3.6%) | 935 (26.5%) |
| 3 or 4 Children | 160 (12.1%) | 274 (59.2%) |
| 5 or more Children | 0 (0.0%) | 47 (100.0%) |
| Total | 881 (3.3%) | 1,492 (20.3%) |
Race in Charleston
The most populous races in Charleston are White / Caucasian (110,517 | 73.7%), Black / African American (27,305 | 18.2%), and Hispanic or Latino (7,245 | 4.8%).
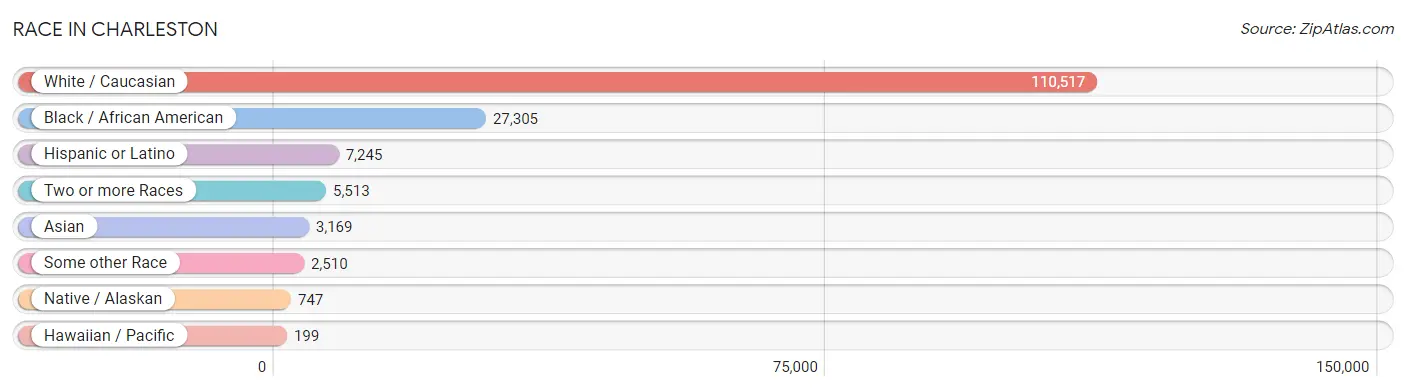
| Race | # Population | % Population |
| Asian | 3,169 | 2.1% |
| Black / African American | 27,305 | 18.2% |
| Hawaiian / Pacific | 199 | 0.1% |
| Hispanic or Latino | 7,245 | 4.8% |
| Native / Alaskan | 747 | 0.5% |
| White / Caucasian | 110,517 | 73.7% |
| Two or more Races | 5,513 | 3.7% |
| Some other Race | 2,510 | 1.7% |
| Total | 149,960 | 100.0% |
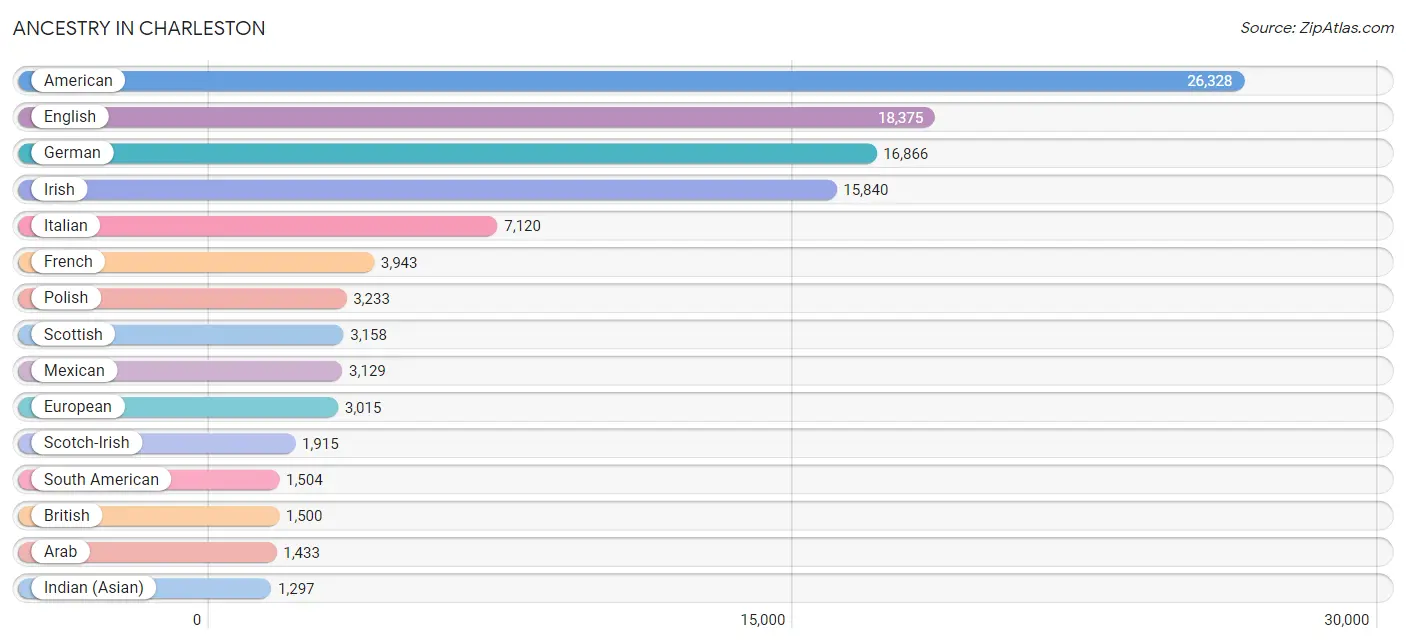
Ancestry in Charleston
The most populous ancestries reported in Charleston are American (26,328 | 17.6%), English (18,375 | 12.2%), German (16,866 | 11.3%), Irish (15,840 | 10.6%), and Italian (7,120 | 4.8%), together accounting for 56.4% of all Charleston residents.
| Ancestry | # Population | % Population |
| African | 696 | 0.5% |
| Albanian | 36 | 0.0% |
| Alsatian | 45 | 0.0% |
| American | 26,328 | 17.6% |
| Arab | 1,433 | 1.0% |
| Argentinean | 326 | 0.2% |
| Armenian | 116 | 0.1% |
| Australian | 115 | 0.1% |
| Austrian | 460 | 0.3% |
| Bahamian | 21 | 0.0% |
| Barbadian | 31 | 0.0% |
| Basque | 8 | 0.0% |
| Belgian | 17 | 0.0% |
| Belizean | 4 | 0.0% |
| Bhutanese | 196 | 0.1% |
| Blackfeet | 51 | 0.0% |
| Bolivian | 50 | 0.0% |
| Brazilian | 60 | 0.0% |
| British | 1,500 | 1.0% |
| British West Indian | 7 | 0.0% |
| Burmese | 451 | 0.3% |
| Cajun | 14 | 0.0% |
| Canadian | 134 | 0.1% |
| Celtic | 39 | 0.0% |
| Central American | 589 | 0.4% |
| Central American Indian | 624 | 0.4% |
| Cherokee | 281 | 0.2% |
| Cheyenne | 1 | 0.0% |
| Chickasaw | 11 | 0.0% |
| Chilean | 118 | 0.1% |
| Chippewa | 22 | 0.0% |
| Choctaw | 16 | 0.0% |
| Colombian | 346 | 0.2% |
| Costa Rican | 46 | 0.0% |
| Creek | 38 | 0.0% |
| Croatian | 215 | 0.1% |
| Cuban | 161 | 0.1% |
| Czech | 421 | 0.3% |
| Czechoslovakian | 38 | 0.0% |
| Danish | 291 | 0.2% |
| Dominican | 91 | 0.1% |
| Dutch | 1,075 | 0.7% |
| Eastern European | 461 | 0.3% |
| Ecuadorian | 316 | 0.2% |
| Egyptian | 265 | 0.2% |
| English | 18,375 | 12.2% |
| Estonian | 64 | 0.0% |
| Ethiopian | 37 | 0.0% |
| European | 3,015 | 2.0% |
| Filipino | 126 | 0.1% |
| Finnish | 306 | 0.2% |
| French | 3,943 | 2.6% |
| French Canadian | 683 | 0.5% |
| German | 16,866 | 11.3% |
| Ghanaian | 4 | 0.0% |
| Greek | 863 | 0.6% |
| Guamanian / Chamorro | 44 | 0.0% |
| Guatemalan | 106 | 0.1% |
| Guyanese | 11 | 0.0% |
| Haitian | 9 | 0.0% |
| Honduran | 299 | 0.2% |
| Hungarian | 597 | 0.4% |
| Icelander | 14 | 0.0% |
| Indian (Asian) | 1,297 | 0.9% |
| Indonesian | 42 | 0.0% |
| Iranian | 55 | 0.0% |
| Iraqi | 3 | 0.0% |
| Irish | 15,840 | 10.6% |
| Iroquois | 18 | 0.0% |
| Israeli | 36 | 0.0% |
| Italian | 7,120 | 4.8% |
| Jamaican | 884 | 0.6% |
| Jordanian | 25 | 0.0% |
| Korean | 631 | 0.4% |
| Laotian | 51 | 0.0% |
| Latvian | 31 | 0.0% |
| Lebanese | 556 | 0.4% |
| Lithuanian | 249 | 0.2% |
| Luxembourger | 18 | 0.0% |
| Malaysian | 31 | 0.0% |
| Maltese | 5 | 0.0% |
| Mexican | 3,129 | 2.1% |
| Mexican American Indian | 25 | 0.0% |
| Moroccan | 8 | 0.0% |
| Native Hawaiian | 83 | 0.1% |
| Nicaraguan | 21 | 0.0% |
| Nigerian | 71 | 0.1% |
| Northern European | 366 | 0.2% |
| Norwegian | 830 | 0.5% |
| Osage | 5 | 0.0% |
| Pakistani | 264 | 0.2% |
| Palestinian | 392 | 0.3% |
| Panamanian | 47 | 0.0% |
| Pennsylvania German | 29 | 0.0% |
| Peruvian | 49 | 0.0% |
| Pima | 7 | 0.0% |
| Polish | 3,233 | 2.2% |
| Portuguese | 177 | 0.1% |
| Potawatomi | 10 | 0.0% |
| Puerto Rican | 853 | 0.6% |
| Romanian | 344 | 0.2% |
| Russian | 1,106 | 0.7% |
| Salvadoran | 70 | 0.1% |
| Scandinavian | 567 | 0.4% |
| Scotch-Irish | 1,915 | 1.3% |
| Scottish | 3,158 | 2.1% |
| Serbian | 36 | 0.0% |
| Sioux | 24 | 0.0% |
| Slavic | 28 | 0.0% |
| Slovak | 145 | 0.1% |
| Slovene | 54 | 0.0% |
| South African | 170 | 0.1% |
| South American | 1,504 | 1.0% |
| South American Indian | 5 | 0.0% |
| Spaniard | 237 | 0.2% |
| Spanish | 171 | 0.1% |
| Sri Lankan | 343 | 0.2% |
| Subsaharan African | 1,044 | 0.7% |
| Swedish | 1,040 | 0.7% |
| Swiss | 256 | 0.2% |
| Syrian | 38 | 0.0% |
| Thai | 941 | 0.6% |
| Tlingit-Haida | 3 | 0.0% |
| Trinidadian and Tobagonian | 63 | 0.0% |
| Turkish | 59 | 0.0% |
| Ukrainian | 315 | 0.2% |
| Venezuelan | 289 | 0.2% |
| Welsh | 874 | 0.6% |
| West Indian | 36 | 0.0% |
| Yugoslavian | 50 | 0.0% |
| Yup'ik | 5 | 0.0% |
| Zimbabwean | 10 | 0.0% | View All 132 Rows |
Immigrants in Charleston
The most numerous immigrant groups reported in Charleston came from Latin America (2,756 | 1.8%), Asia (2,578 | 1.7%), Europe (1,891 | 1.3%), Central America (1,232 | 0.8%), and South America (1,058 | 0.7%), together accounting for 6.4% of all Charleston residents.

| Immigration Origin | # Population | % Population |
| Africa | 433 | 0.3% |
| Albania | 20 | 0.0% |
| Argentina | 242 | 0.2% |
| Asia | 2,578 | 1.7% |
| Australia | 87 | 0.1% |
| Austria | 43 | 0.0% |
| Bahamas | 4 | 0.0% |
| Belarus | 7 | 0.0% |
| Belgium | 8 | 0.0% |
| Belize | 4 | 0.0% |
| Bolivia | 25 | 0.0% |
| Brazil | 199 | 0.1% |
| Canada | 264 | 0.2% |
| Caribbean | 466 | 0.3% |
| Central America | 1,232 | 0.8% |
| Chile | 24 | 0.0% |
| China | 759 | 0.5% |
| Colombia | 215 | 0.1% |
| Costa Rica | 33 | 0.0% |
| Denmark | 5 | 0.0% |
| Dominican Republic | 65 | 0.0% |
| Eastern Africa | 60 | 0.0% |
| Eastern Asia | 999 | 0.7% |
| Eastern Europe | 605 | 0.4% |
| Ecuador | 75 | 0.1% |
| Egypt | 180 | 0.1% |
| El Salvador | 17 | 0.0% |
| England | 172 | 0.1% |
| Ethiopia | 37 | 0.0% |
| Europe | 1,891 | 1.3% |
| France | 158 | 0.1% |
| Germany | 317 | 0.2% |
| Greece | 82 | 0.1% |
| Guatemala | 92 | 0.1% |
| Guyana | 10 | 0.0% |
| Honduras | 239 | 0.2% |
| Hong Kong | 136 | 0.1% |
| Hungary | 71 | 0.1% |
| India | 423 | 0.3% |
| Iran | 77 | 0.1% |
| Ireland | 47 | 0.0% |
| Israel | 19 | 0.0% |
| Italy | 154 | 0.1% |
| Jamaica | 311 | 0.2% |
| Japan | 21 | 0.0% |
| Jordan | 66 | 0.0% |
| Kazakhstan | 53 | 0.0% |
| Korea | 219 | 0.2% |
| Latin America | 2,756 | 1.8% |
| Lebanon | 18 | 0.0% |
| Mexico | 847 | 0.6% |
| Micronesia | 34 | 0.0% |
| Nepal | 14 | 0.0% |
| Netherlands | 63 | 0.0% |
| Nigeria | 3 | 0.0% |
| Northern Africa | 254 | 0.2% |
| Northern Europe | 405 | 0.3% |
| Oceania | 127 | 0.1% |
| Pakistan | 18 | 0.0% |
| Peru | 10 | 0.0% |
| Philippines | 233 | 0.2% |
| Poland | 42 | 0.0% |
| Portugal | 29 | 0.0% |
| Romania | 140 | 0.1% |
| Russia | 203 | 0.1% |
| Saudi Arabia | 57 | 0.0% |
| Scotland | 21 | 0.0% |
| South Africa | 116 | 0.1% |
| South America | 1,058 | 0.7% |
| South Central Asia | 585 | 0.4% |
| South Eastern Asia | 504 | 0.3% |
| Southern Europe | 265 | 0.2% |
| Switzerland | 9 | 0.0% |
| Taiwan | 113 | 0.1% |
| Trinidad and Tobago | 68 | 0.1% |
| Turkey | 35 | 0.0% |
| Ukraine | 51 | 0.0% |
| Venezuela | 258 | 0.2% |
| Vietnam | 229 | 0.2% |
| West Indies | 18 | 0.0% |
| Western Africa | 3 | 0.0% |
| Western Asia | 214 | 0.1% |
| Western Europe | 616 | 0.4% |
| Zimbabwe | 7 | 0.0% | View All 84 Rows |
Sex and Age in Charleston
Sex and Age in Charleston
The most populous age groups in Charleston are 30 to 34 Years (7,375 | 10.4%) for men and 30 to 34 Years (7,915 | 10.1%) for women.
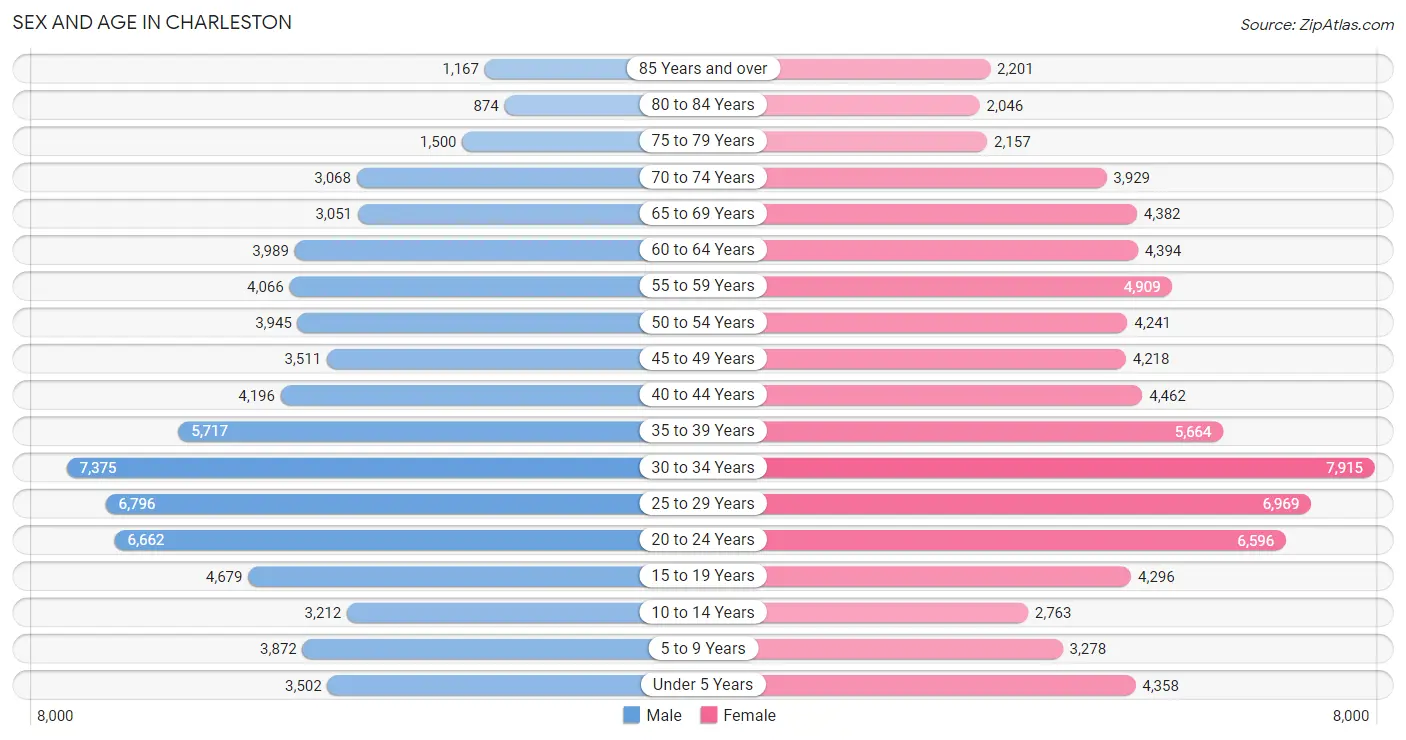
| Age Bracket | Male | Female |
| Under 5 Years | 3,502 (4.9%) | 4,358 (5.5%) |
| 5 to 9 Years | 3,872 (5.4%) | 3,278 (4.2%) |
| 10 to 14 Years | 3,212 (4.5%) | 2,763 (3.5%) |
| 15 to 19 Years | 4,679 (6.6%) | 4,296 (5.4%) |
| 20 to 24 Years | 6,662 (9.4%) | 6,596 (8.4%) |
| 25 to 29 Years | 6,796 (9.6%) | 6,969 (8.8%) |
| 30 to 34 Years | 7,375 (10.4%) | 7,915 (10.1%) |
| 35 to 39 Years | 5,717 (8.0%) | 5,664 (7.2%) |
| 40 to 44 Years | 4,196 (5.9%) | 4,462 (5.7%) |
| 45 to 49 Years | 3,511 (4.9%) | 4,218 (5.3%) |
| 50 to 54 Years | 3,945 (5.5%) | 4,241 (5.4%) |
| 55 to 59 Years | 4,066 (5.7%) | 4,909 (6.2%) |
| 60 to 64 Years | 3,989 (5.6%) | 4,394 (5.6%) |
| 65 to 69 Years | 3,051 (4.3%) | 4,382 (5.6%) |
| 70 to 74 Years | 3,068 (4.3%) | 3,929 (5.0%) |
| 75 to 79 Years | 1,500 (2.1%) | 2,157 (2.7%) |
| 80 to 84 Years | 874 (1.2%) | 2,046 (2.6%) |
| 85 Years and over | 1,167 (1.6%) | 2,201 (2.8%) |
| Total | 71,182 (100.0%) | 78,778 (100.0%) |
Families and Households in Charleston
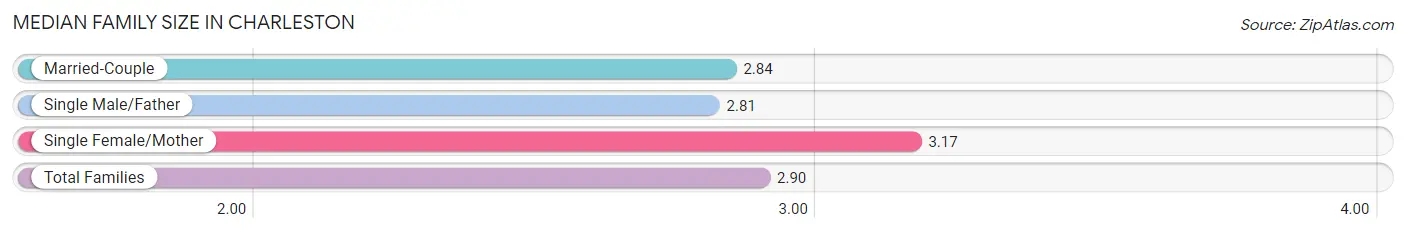
Median Family Size in Charleston
The median family size in Charleston is 2.90 persons per family, with single female/mother families (5,629 | 16.6%) accounting for the largest median family size of 3.17 persons per family. On the other hand, single male/father families (1,729 | 5.1%) represent the smallest median family size with 2.81 persons per family.
| Family Type | # Families | Family Size |
| Married-Couple | 26,475 (78.2%) | 2.84 |
| Single Male/Father | 1,729 (5.1%) | 2.81 |
| Single Female/Mother | 5,629 (16.6%) | 3.17 |
| Total Families | 33,833 (100.0%) | 2.90 |
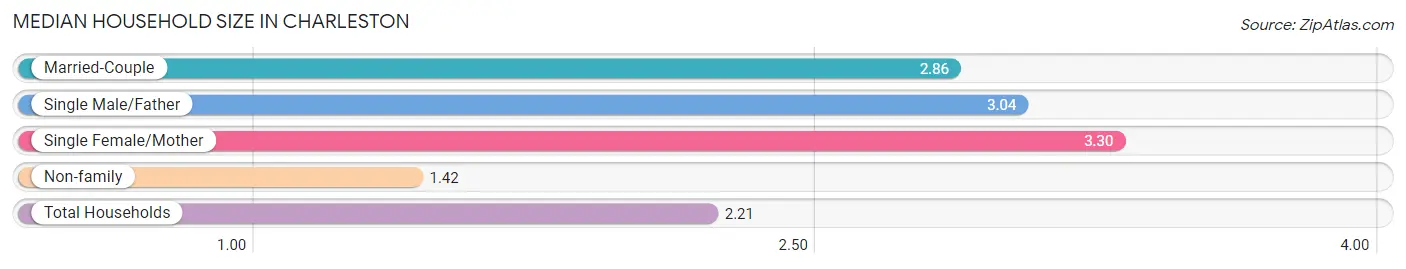
Median Household Size in Charleston
The median household size in Charleston is 2.21 persons per household, with single female/mother households (5,629 | 8.6%) accounting for the largest median household size of 3.3 persons per household. non-family households (31,365 | 48.1%) represent the smallest median household size with 1.42 persons per household.
| Household Type | # Households | Household Size |
| Married-Couple | 26,475 (40.6%) | 2.86 |
| Single Male/Father | 1,729 (2.6%) | 3.04 |
| Single Female/Mother | 5,629 (8.6%) | 3.30 |
| Non-family | 31,365 (48.1%) | 1.42 |
| Total Households | 65,198 (100.0%) | 2.21 |
Household Size by Marriage Status in Charleston
Out of a total of 65,198 households in Charleston, 33,833 (51.9%) are family households, while 31,365 (48.1%) are nonfamily households. The most numerous type of family households are 2-person households, comprising 18,645, and the most common type of nonfamily households are 1-person households, comprising 22,670.
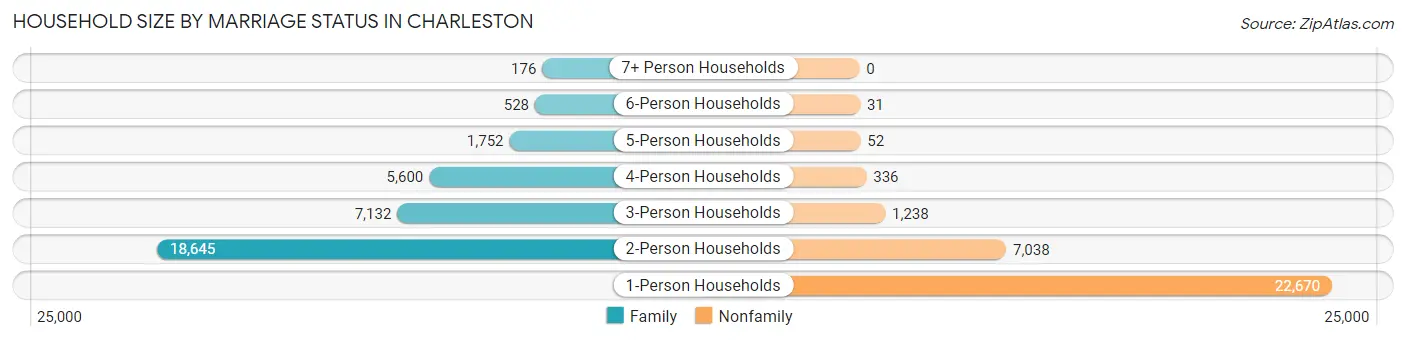
| Household Size | Family Households | Nonfamily Households |
| 1-Person Households | - | 22,670 (34.8%) |
| 2-Person Households | 18,645 (28.6%) | 7,038 (10.8%) |
| 3-Person Households | 7,132 (10.9%) | 1,238 (1.9%) |
| 4-Person Households | 5,600 (8.6%) | 336 (0.5%) |
| 5-Person Households | 1,752 (2.7%) | 52 (0.1%) |
| 6-Person Households | 528 (0.8%) | 31 (0.1%) |
| 7+ Person Households | 176 (0.3%) | 0 (0.0%) |
| Total | 33,833 (51.9%) | 31,365 (48.1%) |
Female Fertility in Charleston
Fertility by Age in Charleston
Average fertility rate in Charleston is 53.0 births per 1,000 women. Women in the age bracket of 20 to 34 years have the highest fertility rate with 77.0 births per 1,000 women. Women in the age bracket of 20 to 34 years acount for 75.2% of all women with births.
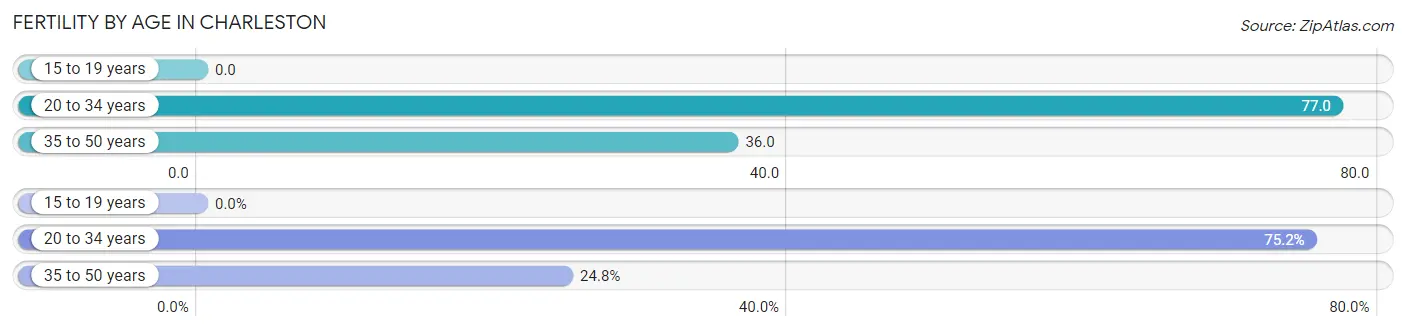
| Age Bracket | Women with Births | Births / 1,000 Women |
| 15 to 19 years | 0 (0.0%) | 0.0 |
| 20 to 34 years | 1,648 (75.2%) | 77.0 |
| 35 to 50 years | 543 (24.8%) | 36.0 |
| Total | 2,191 (100.0%) | 53.0 |
Fertility by Age by Marriage Status in Charleston
67.8% of women with births (2,191) in Charleston are married. The highest percentage of unmarried women with births falls into 20 to 34 years age bracket with 39.6% of them unmarried at the time of birth, while the lowest percentage of unmarried women with births belong to 35 to 50 years age bracket with 9.8% of them unmarried.
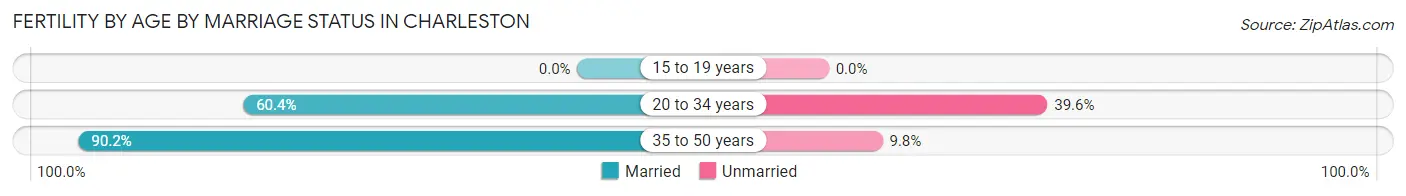
| Age Bracket | Married | Unmarried |
| 15 to 19 years | 0 (0.0%) | 0 (0.0%) |
| 20 to 34 years | 995 (60.4%) | 653 (39.6%) |
| 35 to 50 years | 490 (90.2%) | 53 (9.8%) |
| Total | 1,485 (67.8%) | 706 (32.2%) |
Fertility by Education in Charleston
Average fertility rate in Charleston is 53.0 births per 1,000 women. Women with the education attainment of bachelor's degree have the highest fertility rate of 57.0 births per 1,000 women, while women with the education attainment of less than high school have the lowest fertility at 41.0 births per 1,000 women. Women with the education attainment of bachelor's degree represent 38.1% of all women with births.
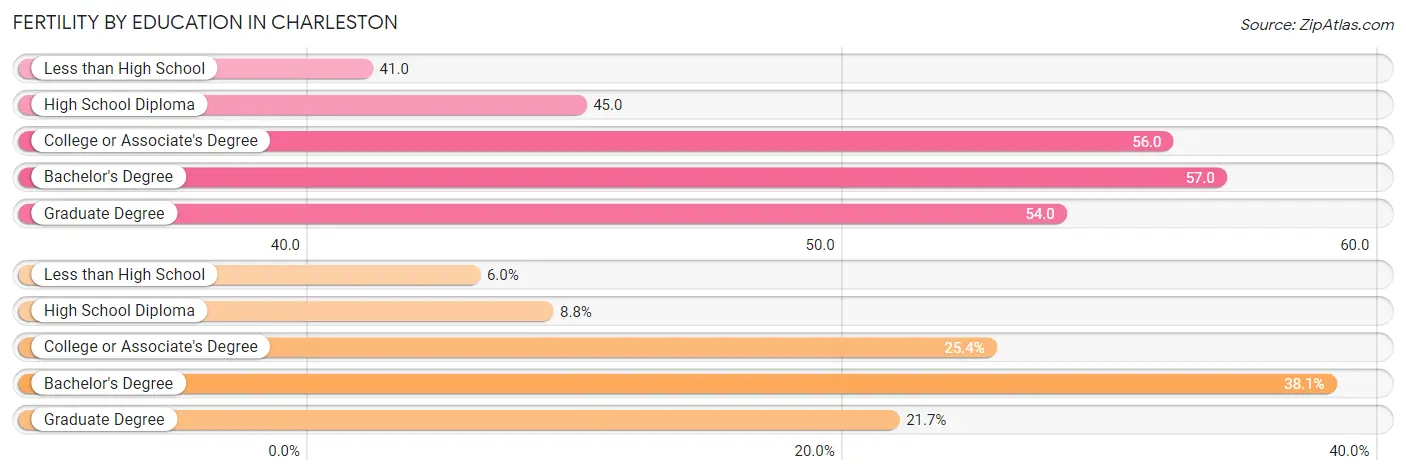
| Educational Attainment | Women with Births | Births / 1,000 Women |
| Less than High School | 132 (6.0%) | 41.0 |
| High School Diploma | 192 (8.8%) | 45.0 |
| College or Associate's Degree | 556 (25.4%) | 56.0 |
| Bachelor's Degree | 835 (38.1%) | 57.0 |
| Graduate Degree | 476 (21.7%) | 54.0 |
| Total | 2,191 (100.0%) | 53.0 |
Fertility by Education by Marriage Status in Charleston
32.2% of women with births in Charleston are unmarried. Women with the educational attainment of graduate degree are most likely to be married with 98.5% of them married at childbirth, while women with the educational attainment of less than high school are least likely to be married with 86.4% of them unmarried at childbirth.
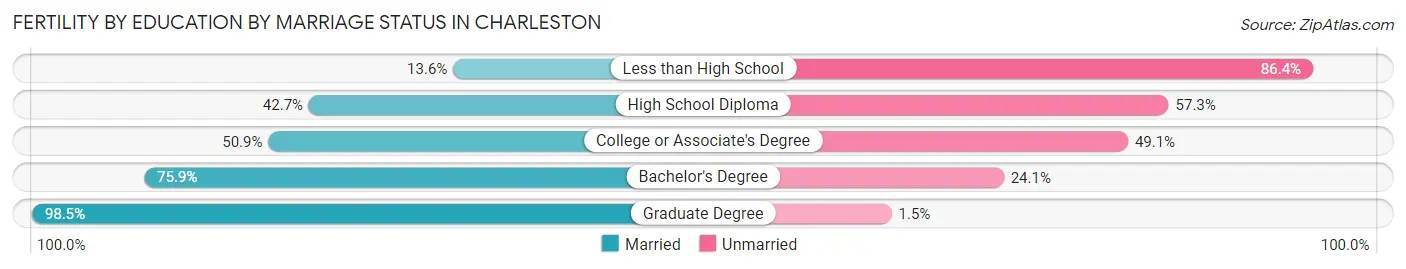
| Educational Attainment | Married | Unmarried |
| Less than High School | 18 (13.6%) | 114 (86.4%) |
| High School Diploma | 82 (42.7%) | 110 (57.3%) |
| College or Associate's Degree | 283 (50.9%) | 273 (49.1%) |
| Bachelor's Degree | 634 (75.9%) | 201 (24.1%) |
| Graduate Degree | 469 (98.5%) | 7 (1.5%) |
| Total | 1,485 (67.8%) | 706 (32.2%) |
Employment Characteristics in Charleston
Employment by Class of Employer in Charleston
Among the 81,634 employed individuals in Charleston, private company employees (52,037 | 63.7%), state government employees (6,173 | 7.6%), and not-for-profit organizations (5,430 | 6.7%) make up the most common classes of employment.
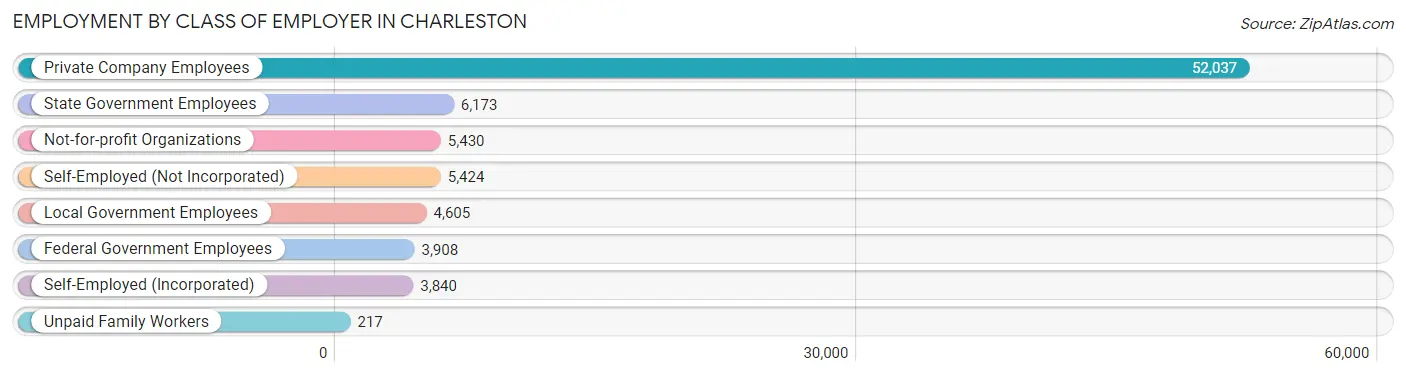
| Employer Class | # Employees | % Employees |
| Private Company Employees | 52,037 | 63.7% |
| Self-Employed (Incorporated) | 3,840 | 4.7% |
| Self-Employed (Not Incorporated) | 5,424 | 6.6% |
| Not-for-profit Organizations | 5,430 | 6.7% |
| Local Government Employees | 4,605 | 5.6% |
| State Government Employees | 6,173 | 7.6% |
| Federal Government Employees | 3,908 | 4.8% |
| Unpaid Family Workers | 217 | 0.3% |
| Total | 81,634 | 100.0% |
Employment Status by Age in Charleston
According to the labor force statistics for Charleston, out of the total population over 16 years of age (127,433), 67.6% or 86,145 individuals are in the labor force, with 3.7% or 3,187 of them unemployed. The age group with the highest labor force participation rate is 30 to 34 years, with 93.0% or 14,220 individuals in the labor force. Within the labor force, the 16 to 19 years age range has the highest percentage of unemployed individuals, with 14.2% or 292 of them being unemployed.
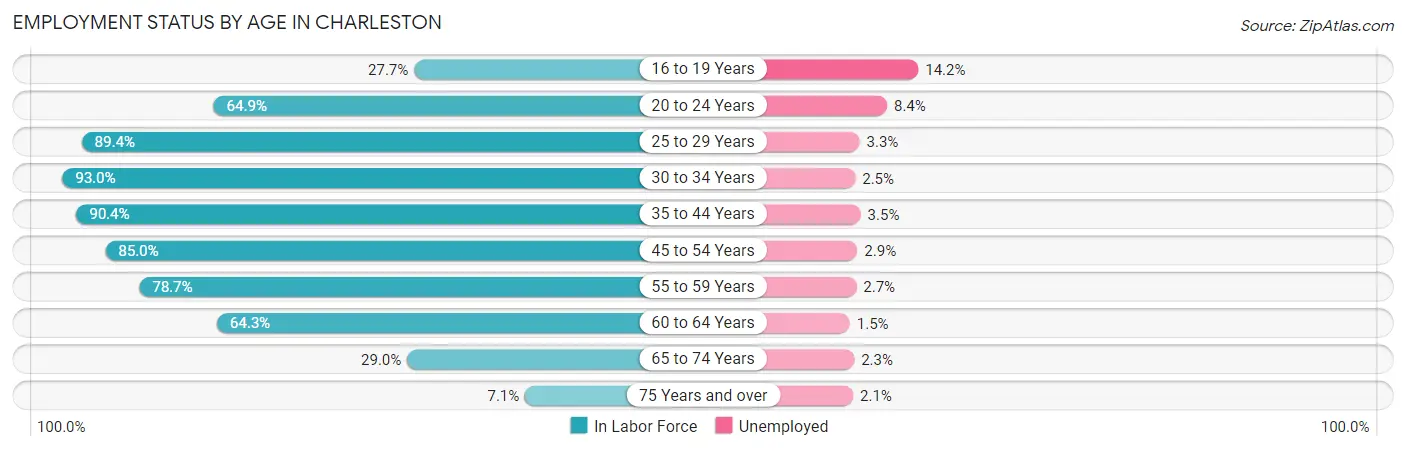
| Age Bracket | In Labor Force | Unemployed |
| 16 to 19 Years | 2,059 (27.7%) | 292 (14.2%) |
| 20 to 24 Years | 8,604 (64.9%) | 723 (8.4%) |
| 25 to 29 Years | 12,306 (89.4%) | 406 (3.3%) |
| 30 to 34 Years | 14,220 (93.0%) | 356 (2.5%) |
| 35 to 44 Years | 18,115 (90.4%) | 634 (3.5%) |
| 45 to 54 Years | 13,528 (85.0%) | 392 (2.9%) |
| 55 to 59 Years | 7,063 (78.7%) | 191 (2.7%) |
| 60 to 64 Years | 5,390 (64.3%) | 81 (1.5%) |
| 65 to 74 Years | 4,185 (29.0%) | 96 (2.3%) |
| 75 Years and over | 706 (7.1%) | 15 (2.1%) |
| Total | 86,145 (67.6%) | 3,187 (3.7%) |
Employment Status by Educational Attainment in Charleston
According to labor force statistics for Charleston, 85.7% of individuals (70,589) out of the total population between 25 and 64 years of age (82,367) are in the labor force, with 2.9% or 2,047 of them being unemployed. The group with the highest labor force participation rate are those with the educational attainment of bachelor's degree or higher, with 88.8% or 44,158 individuals in the labor force. Within the labor force, individuals with less than high school education have the highest percentage of unemployment, with 6.0% or 138 of them being unemployed.
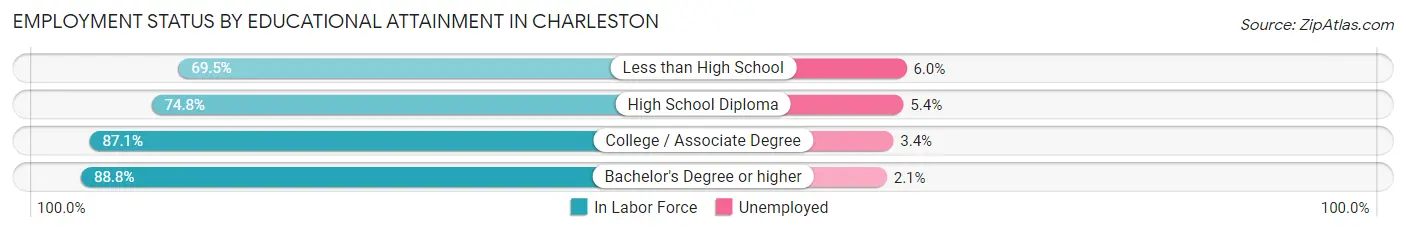
| Educational Attainment | In Labor Force | Unemployed |
| Less than High School | 2,304 (69.5%) | 199 (6.0%) |
| High School Diploma | 8,399 (74.8%) | 606 (5.4%) |
| College / Associate Degree | 15,762 (87.1%) | 615 (3.4%) |
| Bachelor's Degree or higher | 44,158 (88.8%) | 1,044 (2.1%) |
| Total | 70,589 (85.7%) | 2,389 (2.9%) |
Employment Occupations by Sex in Charleston
Management, Business, Science and Arts Occupations
The most common Management, Business, Science and Arts occupations in Charleston are Management (11,839 | 14.5%), Community & Social Service (11,078 | 13.6%), Health Diagnosing & Treating (7,471 | 9.1%), Computers, Engineering & Science (6,978 | 8.5%), and Health Technologists (6,126 | 7.5%).
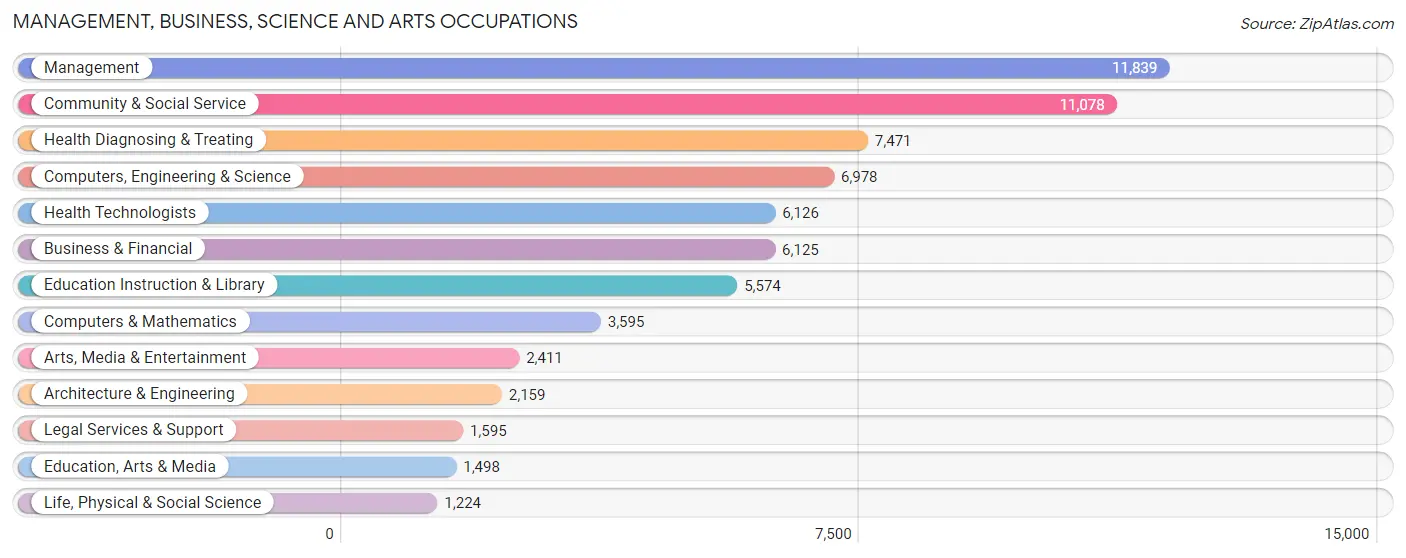
Management, Business, Science and Arts Occupations by Sex
Within the Management, Business, Science and Arts occupations in Charleston, the most male-oriented occupations are Architecture & Engineering (75.7%), Computers & Mathematics (75.0%), and Computers, Engineering & Science (67.3%), while the most female-oriented occupations are Health Technologists (73.2%), Health Diagnosing & Treating (73.1%), and Education Instruction & Library (72.8%).
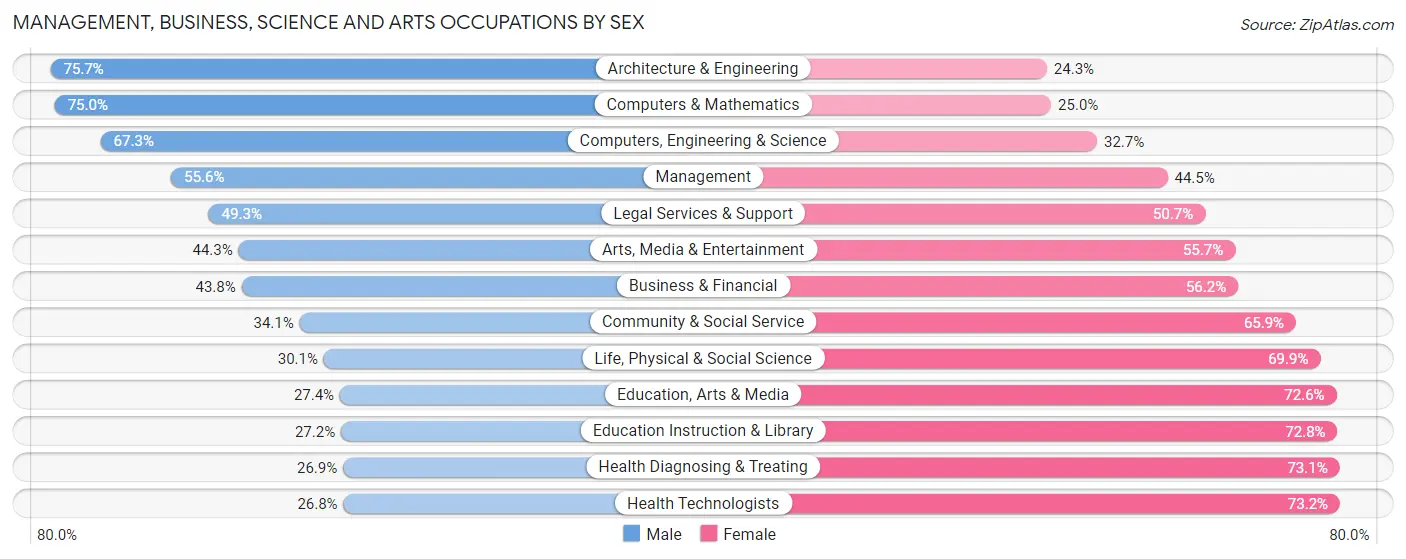
| Occupation | Male | Female |
| Management | 6,576 (55.5%) | 5,263 (44.5%) |
| Business & Financial | 2,683 (43.8%) | 3,442 (56.2%) |
| Computers, Engineering & Science | 4,697 (67.3%) | 2,281 (32.7%) |
| Computers & Mathematics | 2,695 (75.0%) | 900 (25.0%) |
| Architecture & Engineering | 1,634 (75.7%) | 525 (24.3%) |
| Life, Physical & Social Science | 368 (30.1%) | 856 (69.9%) |
| Community & Social Service | 3,780 (34.1%) | 7,298 (65.9%) |
| Education, Arts & Media | 410 (27.4%) | 1,088 (72.6%) |
| Legal Services & Support | 786 (49.3%) | 809 (50.7%) |
| Education Instruction & Library | 1,516 (27.2%) | 4,058 (72.8%) |
| Arts, Media & Entertainment | 1,068 (44.3%) | 1,343 (55.7%) |
| Health Diagnosing & Treating | 2,007 (26.9%) | 5,464 (73.1%) |
| Health Technologists | 1,641 (26.8%) | 4,485 (73.2%) |
| Total (Category) | 19,743 (45.4%) | 23,748 (54.6%) |
| Total (Overall) | 40,610 (49.7%) | 41,064 (50.3%) |
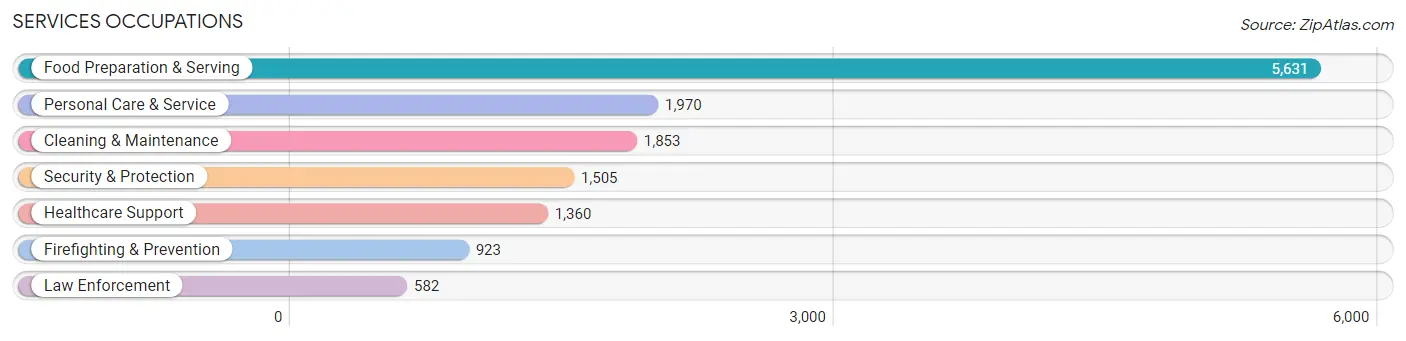
Services Occupations
The most common Services occupations in Charleston are Food Preparation & Serving (5,631 | 6.9%), Personal Care & Service (1,970 | 2.4%), Cleaning & Maintenance (1,853 | 2.3%), Security & Protection (1,505 | 1.8%), and Healthcare Support (1,360 | 1.7%).
Services Occupations by Sex
Within the Services occupations in Charleston, the most male-oriented occupations are Law Enforcement (83.3%), Security & Protection (81.1%), and Firefighting & Prevention (79.6%), while the most female-oriented occupations are Healthcare Support (89.3%), Personal Care & Service (61.5%), and Food Preparation & Serving (48.1%).
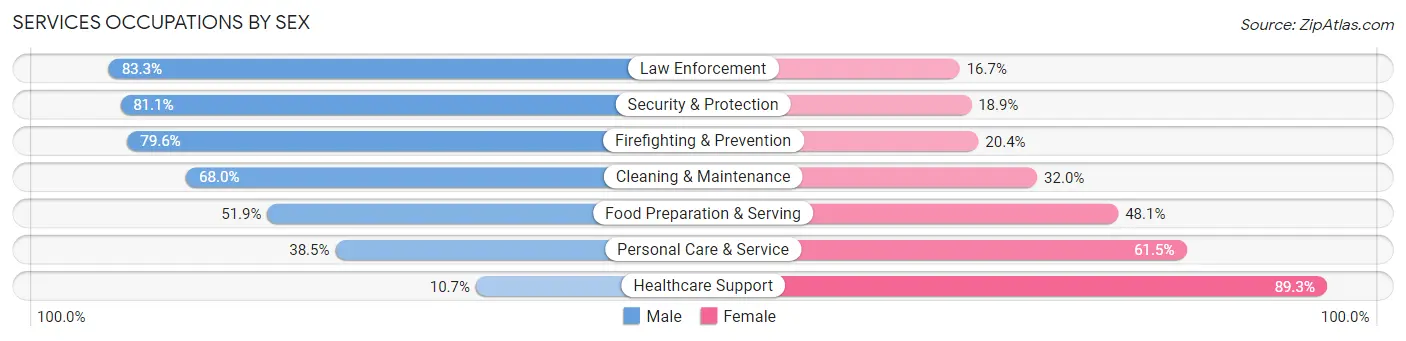
| Occupation | Male | Female |
| Healthcare Support | 145 (10.7%) | 1,215 (89.3%) |
| Security & Protection | 1,220 (81.1%) | 285 (18.9%) |
| Firefighting & Prevention | 735 (79.6%) | 188 (20.4%) |
| Law Enforcement | 485 (83.3%) | 97 (16.7%) |
| Food Preparation & Serving | 2,925 (51.9%) | 2,706 (48.1%) |
| Cleaning & Maintenance | 1,260 (68.0%) | 593 (32.0%) |
| Personal Care & Service | 758 (38.5%) | 1,212 (61.5%) |
| Total (Category) | 6,308 (51.2%) | 6,011 (48.8%) |
| Total (Overall) | 40,610 (49.7%) | 41,064 (50.3%) |
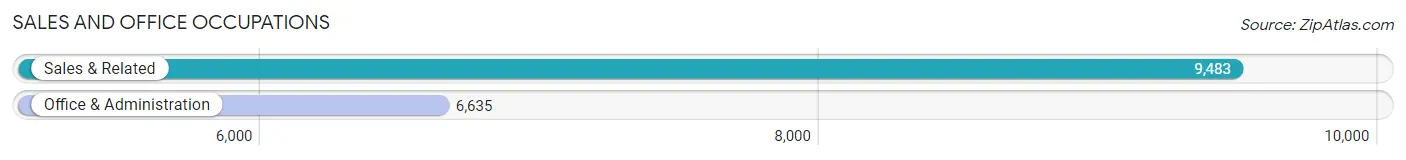
Sales and Office Occupations
The most common Sales and Office occupations in Charleston are Sales & Related (9,483 | 11.6%), and Office & Administration (6,635 | 8.1%).
Sales and Office Occupations by Sex
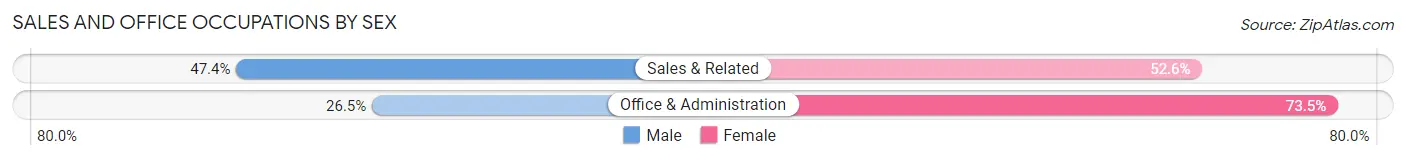
| Occupation | Male | Female |
| Sales & Related | 4,498 (47.4%) | 4,985 (52.6%) |
| Office & Administration | 1,761 (26.5%) | 4,874 (73.5%) |
| Total (Category) | 6,259 (38.8%) | 9,859 (61.2%) |
| Total (Overall) | 40,610 (49.7%) | 41,064 (50.3%) |
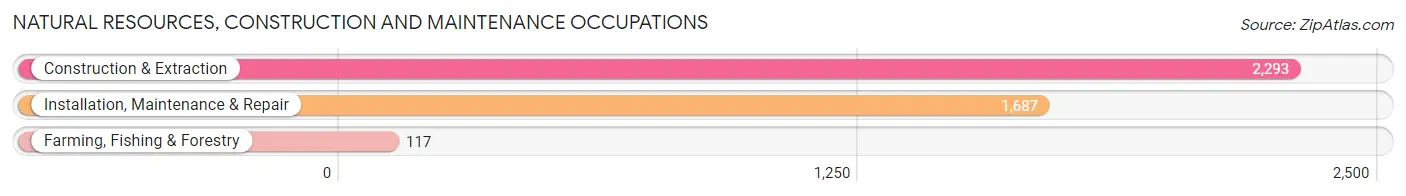
Natural Resources, Construction and Maintenance Occupations
The most common Natural Resources, Construction and Maintenance occupations in Charleston are Construction & Extraction (2,293 | 2.8%), Installation, Maintenance & Repair (1,687 | 2.1%), and Farming, Fishing & Forestry (117 | 0.1%).
Natural Resources, Construction and Maintenance Occupations by Sex
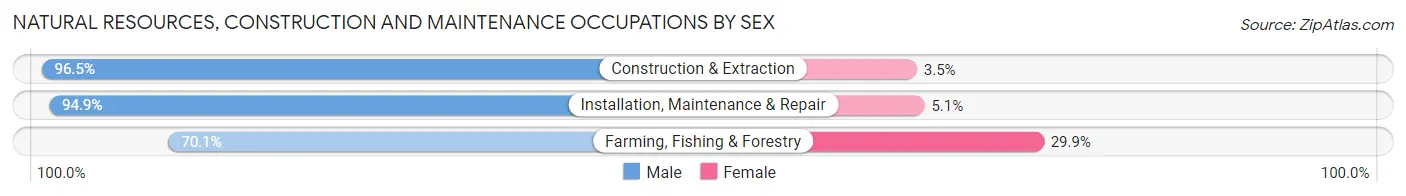
| Occupation | Male | Female |
| Farming, Fishing & Forestry | 82 (70.1%) | 35 (29.9%) |
| Construction & Extraction | 2,212 (96.5%) | 81 (3.5%) |
| Installation, Maintenance & Repair | 1,601 (94.9%) | 86 (5.1%) |
| Total (Category) | 3,895 (95.1%) | 202 (4.9%) |
| Total (Overall) | 40,610 (49.7%) | 41,064 (50.3%) |
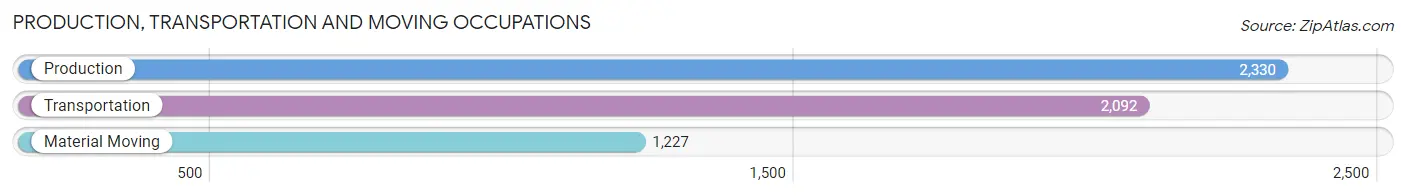
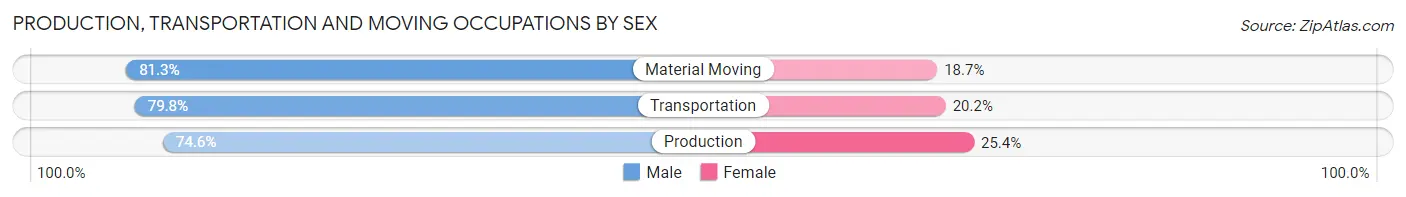
Production, Transportation and Moving Occupations
The most common Production, Transportation and Moving occupations in Charleston are Production (2,330 | 2.9%), Transportation (2,092 | 2.6%), and Material Moving (1,227 | 1.5%).
Production, Transportation and Moving Occupations by Sex
| Occupation | Male | Female |
| Production | 1,738 (74.6%) | 592 (25.4%) |
| Transportation | 1,669 (79.8%) | 423 (20.2%) |
| Material Moving | 998 (81.3%) | 229 (18.7%) |
| Total (Category) | 4,405 (78.0%) | 1,244 (22.0%) |
| Total (Overall) | 40,610 (49.7%) | 41,064 (50.3%) |
Employment Industries by Sex in Charleston
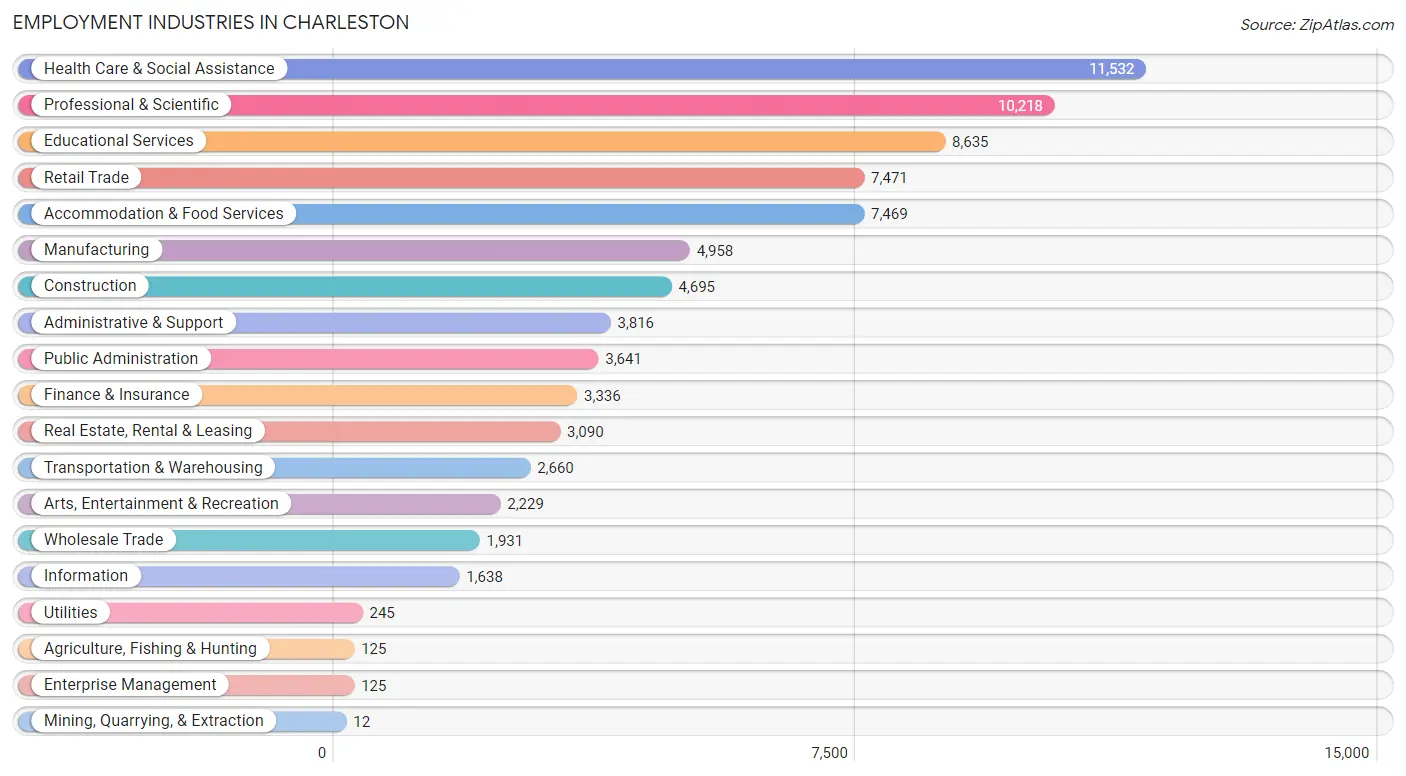
Employment Industries in Charleston
The major employment industries in Charleston include Health Care & Social Assistance (11,532 | 14.1%), Professional & Scientific (10,218 | 12.5%), Educational Services (8,635 | 10.6%), Retail Trade (7,471 | 9.1%), and Accommodation & Food Services (7,469 | 9.1%).
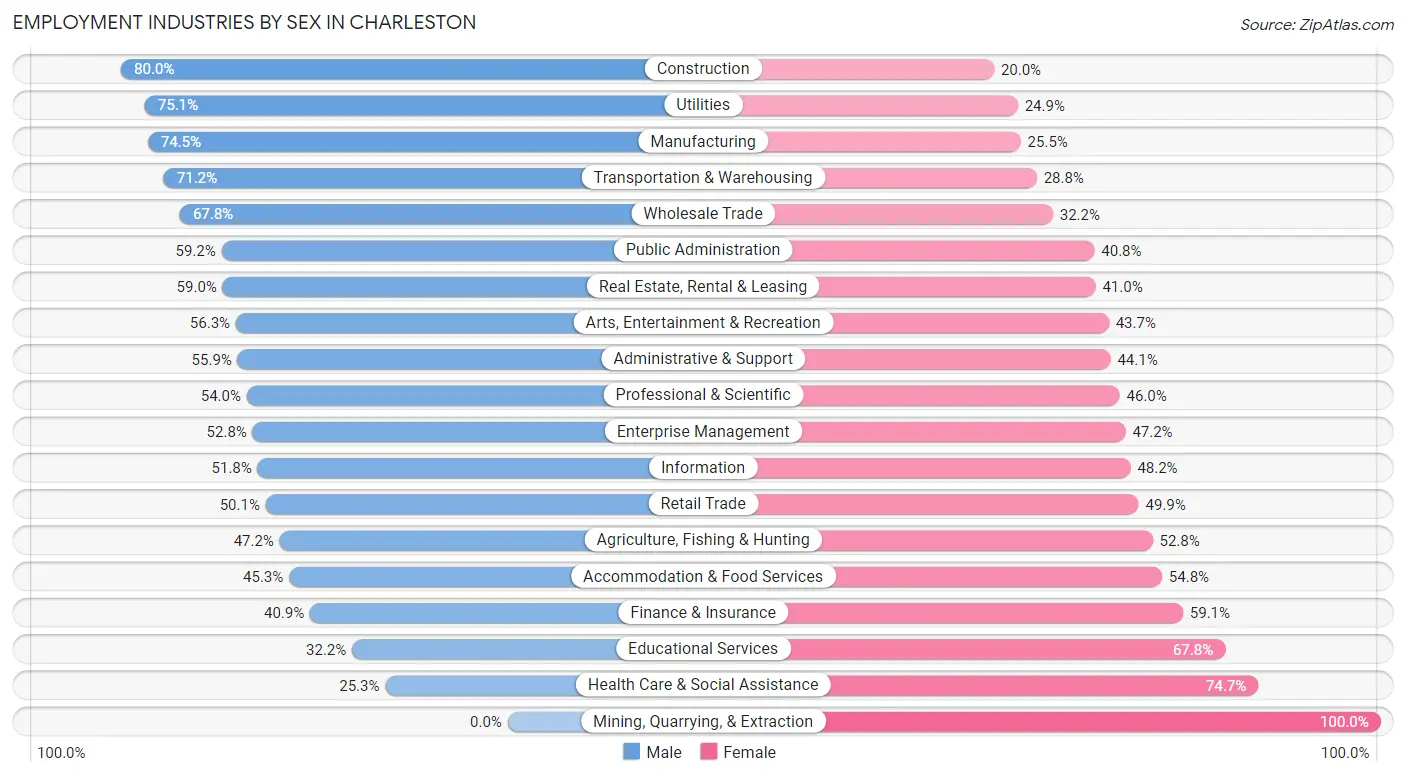
Employment Industries by Sex in Charleston
The Charleston industries that see more men than women are Construction (80.0%), Utilities (75.1%), and Manufacturing (74.5%), whereas the industries that tend to have a higher number of women are Mining, Quarrying, & Extraction (100.0%), Health Care & Social Assistance (74.7%), and Educational Services (67.8%).
| Industry | Male | Female |
| Agriculture, Fishing & Hunting | 59 (47.2%) | 66 (52.8%) |
| Mining, Quarrying, & Extraction | 0 (0.0%) | 12 (100.0%) |
| Construction | 3,757 (80.0%) | 938 (20.0%) |
| Manufacturing | 3,693 (74.5%) | 1,265 (25.5%) |
| Wholesale Trade | 1,310 (67.8%) | 621 (32.2%) |
| Retail Trade | 3,742 (50.1%) | 3,729 (49.9%) |
| Transportation & Warehousing | 1,893 (71.2%) | 767 (28.8%) |
| Utilities | 184 (75.1%) | 61 (24.9%) |
| Information | 848 (51.8%) | 790 (48.2%) |
| Finance & Insurance | 1,365 (40.9%) | 1,971 (59.1%) |
| Real Estate, Rental & Leasing | 1,823 (59.0%) | 1,267 (41.0%) |
| Professional & Scientific | 5,519 (54.0%) | 4,699 (46.0%) |
| Enterprise Management | 66 (52.8%) | 59 (47.2%) |
| Administrative & Support | 2,133 (55.9%) | 1,683 (44.1%) |
| Educational Services | 2,781 (32.2%) | 5,854 (67.8%) |
| Health Care & Social Assistance | 2,922 (25.3%) | 8,610 (74.7%) |
| Arts, Entertainment & Recreation | 1,254 (56.3%) | 975 (43.7%) |
| Accommodation & Food Services | 3,380 (45.3%) | 4,089 (54.7%) |
| Public Administration | 2,157 (59.2%) | 1,484 (40.8%) |
| Total | 40,610 (49.7%) | 41,064 (50.3%) |
Education in Charleston
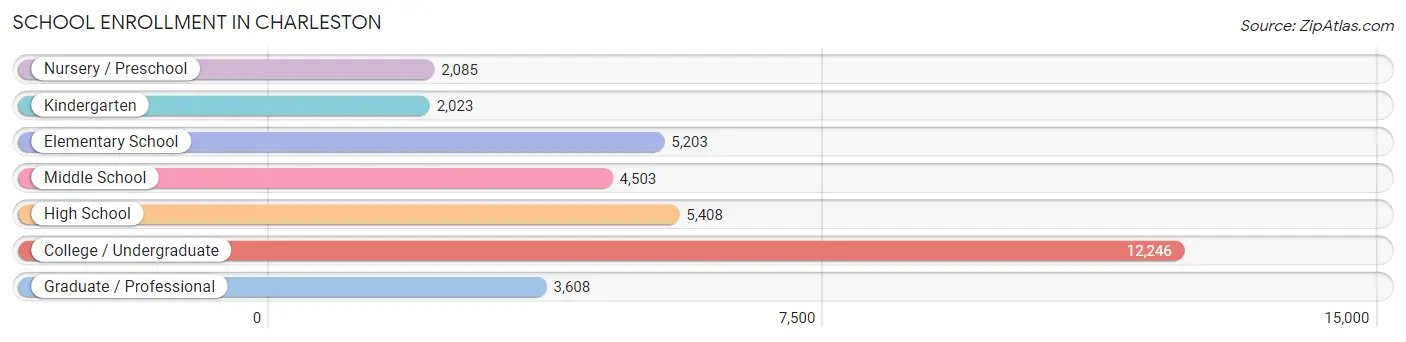
School Enrollment in Charleston
The most common levels of schooling among the 35,076 students in Charleston are college / undergraduate (12,246 | 34.9%), high school (5,408 | 15.4%), and elementary school (5,203 | 14.8%).
| School Level | # Students | % Students |
| Nursery / Preschool | 2,085 | 5.9% |
| Kindergarten | 2,023 | 5.8% |
| Elementary School | 5,203 | 14.8% |
| Middle School | 4,503 | 12.8% |
| High School | 5,408 | 15.4% |
| College / Undergraduate | 12,246 | 34.9% |
| Graduate / Professional | 3,608 | 10.3% |
| Total | 35,076 | 100.0% |
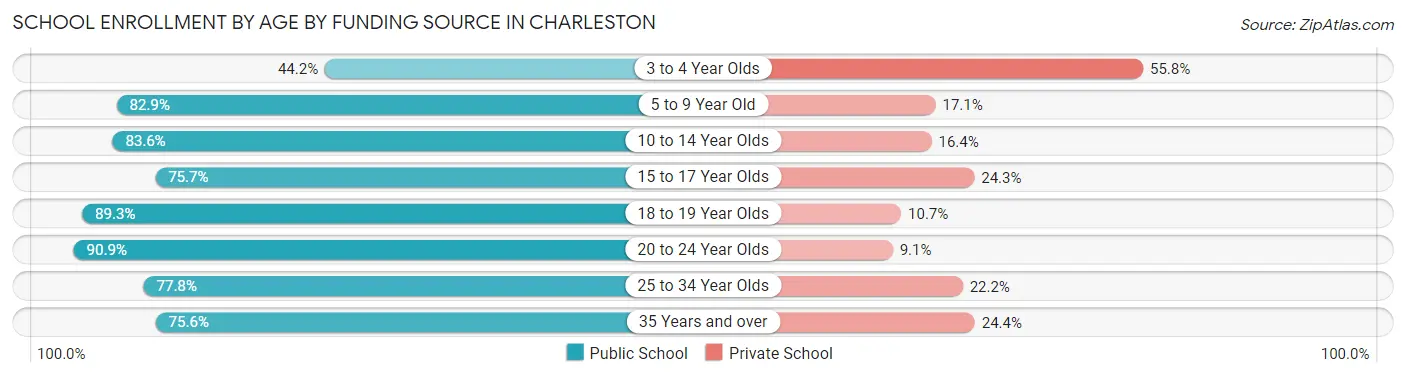
School Enrollment by Age by Funding Source in Charleston
Out of a total of 35,076 students who are enrolled in schools in Charleston, 6,279 (17.9%) attend a private institution, while the remaining 28,797 (82.1%) are enrolled in public schools. The age group of 3 to 4 year olds has the highest likelihood of being enrolled in private schools, with 944 (55.8% in the age bracket) enrolled. Conversely, the age group of 20 to 24 year olds has the lowest likelihood of being enrolled in a private school, with 6,998 (90.9% in the age bracket) attending a public institution.
| Age Bracket | Public School | Private School |
| 3 to 4 Year Olds | 749 (44.2%) | 944 (55.8%) |
| 5 to 9 Year Old | 5,566 (82.9%) | 1,150 (17.1%) |
| 10 to 14 Year Olds | 4,935 (83.6%) | 966 (16.4%) |
| 15 to 17 Year Olds | 3,048 (75.7%) | 980 (24.3%) |
| 18 to 19 Year Olds | 3,896 (89.3%) | 467 (10.7%) |
| 20 to 24 Year Olds | 6,998 (90.9%) | 704 (9.1%) |
| 25 to 34 Year Olds | 2,155 (77.8%) | 614 (22.2%) |
| 35 Years and over | 1,439 (75.6%) | 465 (24.4%) |
| Total | 28,797 (82.1%) | 6,279 (17.9%) |
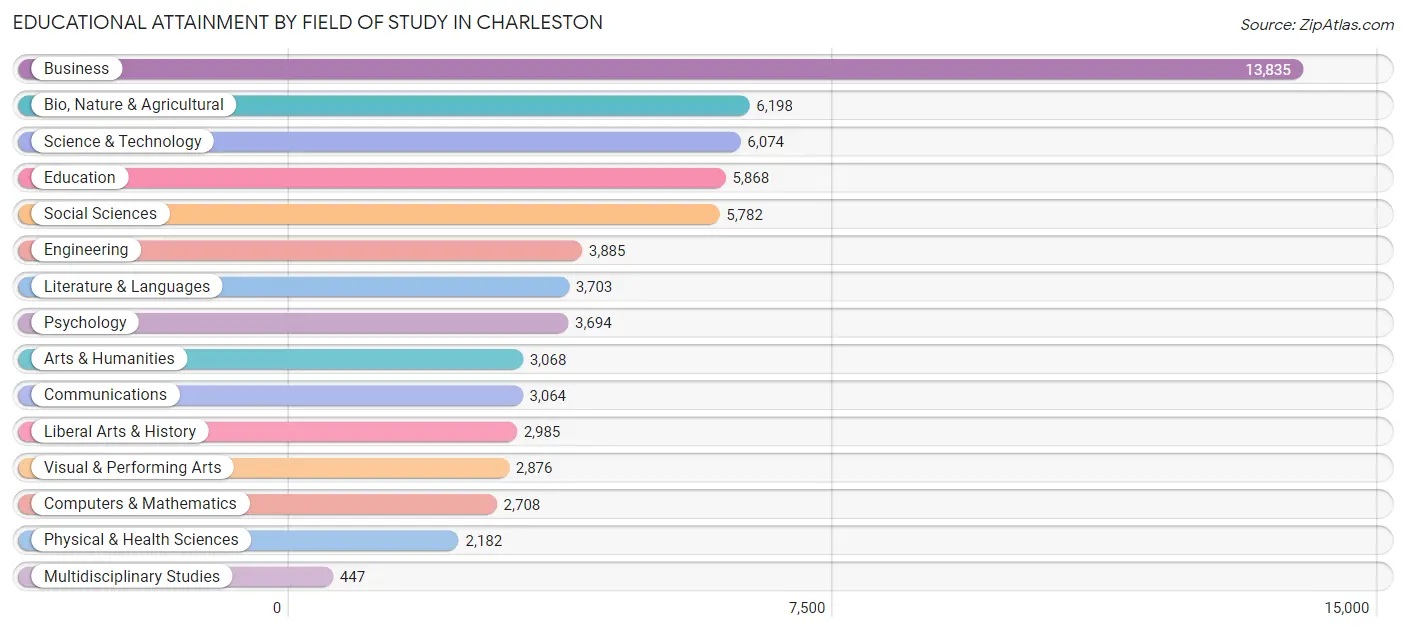
Educational Attainment by Field of Study in Charleston
Business (13,835 | 20.8%), bio, nature & agricultural (6,198 | 9.3%), science & technology (6,074 | 9.1%), education (5,868 | 8.8%), and social sciences (5,782 | 8.7%) are the most common fields of study among 66,369 individuals in Charleston who have obtained a bachelor's degree or higher.
| Field of Study | # Graduates | % Graduates |
| Computers & Mathematics | 2,708 | 4.1% |
| Bio, Nature & Agricultural | 6,198 | 9.3% |
| Physical & Health Sciences | 2,182 | 3.3% |
| Psychology | 3,694 | 5.6% |
| Social Sciences | 5,782 | 8.7% |
| Engineering | 3,885 | 5.9% |
| Multidisciplinary Studies | 447 | 0.7% |
| Science & Technology | 6,074 | 9.1% |
| Business | 13,835 | 20.8% |
| Education | 5,868 | 8.8% |
| Literature & Languages | 3,703 | 5.6% |
| Liberal Arts & History | 2,985 | 4.5% |
| Visual & Performing Arts | 2,876 | 4.3% |
| Communications | 3,064 | 4.6% |
| Arts & Humanities | 3,068 | 4.6% |
| Total | 66,369 | 100.0% |
Transportation & Commute in Charleston
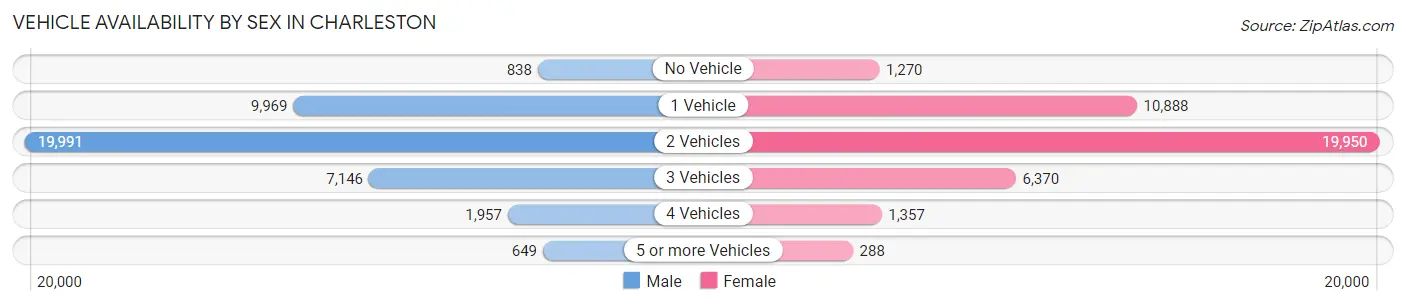
Vehicle Availability by Sex in Charleston
The most prevalent vehicle ownership categories in Charleston are males with 2 vehicles (19,991, accounting for 49.3%) and females with 2 vehicles (19,950, making up 49.8%).
| Vehicles Available | Male | Female |
| No Vehicle | 838 (2.1%) | 1,270 (3.2%) |
| 1 Vehicle | 9,969 (24.6%) | 10,888 (27.1%) |
| 2 Vehicles | 19,991 (49.3%) | 19,950 (49.7%) |
| 3 Vehicles | 7,146 (17.6%) | 6,370 (15.9%) |
| 4 Vehicles | 1,957 (4.8%) | 1,357 (3.4%) |
| 5 or more Vehicles | 649 (1.6%) | 288 (0.7%) |
| Total | 40,550 (100.0%) | 40,123 (100.0%) |
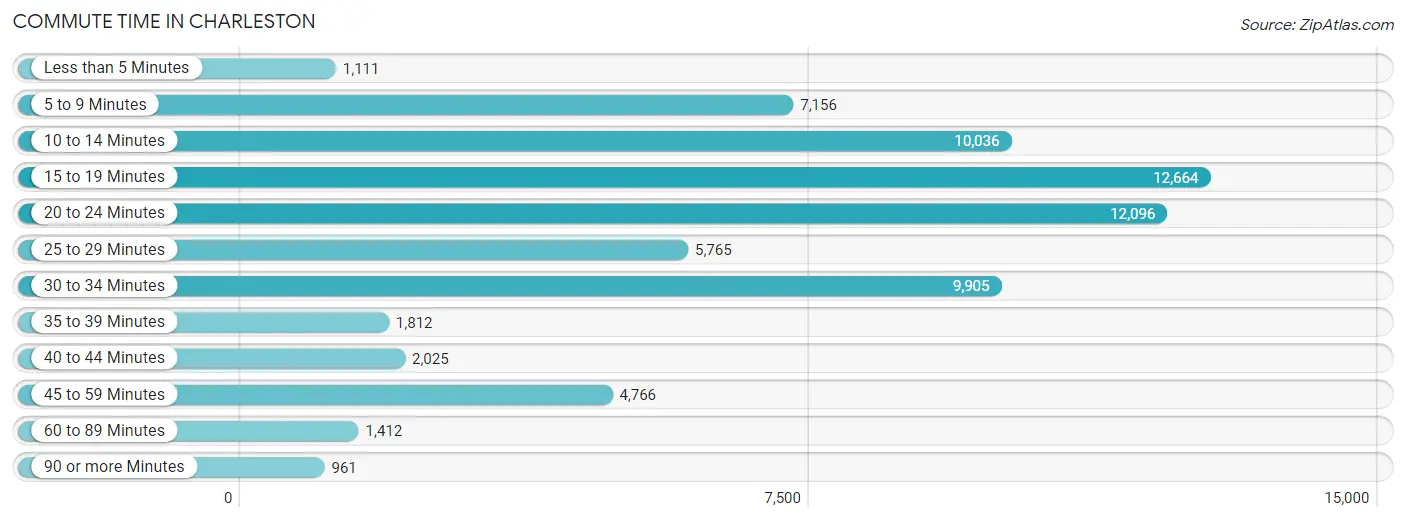
Commute Time in Charleston
The most frequently occuring commute durations in Charleston are 15 to 19 minutes (12,664 commuters, 18.2%), 20 to 24 minutes (12,096 commuters, 17.3%), and 10 to 14 minutes (10,036 commuters, 14.4%).
| Commute Time | # Commuters | % Commuters |
| Less than 5 Minutes | 1,111 | 1.6% |
| 5 to 9 Minutes | 7,156 | 10.3% |
| 10 to 14 Minutes | 10,036 | 14.4% |
| 15 to 19 Minutes | 12,664 | 18.2% |
| 20 to 24 Minutes | 12,096 | 17.3% |
| 25 to 29 Minutes | 5,765 | 8.3% |
| 30 to 34 Minutes | 9,905 | 14.2% |
| 35 to 39 Minutes | 1,812 | 2.6% |
| 40 to 44 Minutes | 2,025 | 2.9% |
| 45 to 59 Minutes | 4,766 | 6.8% |
| 60 to 89 Minutes | 1,412 | 2.0% |
| 90 or more Minutes | 961 | 1.4% |
Commute Time by Sex in Charleston
The most common commute times in Charleston are 15 to 19 minutes (6,136 commuters, 17.3%) for males and 15 to 19 minutes (6,528 commuters, 19.1%) for females.
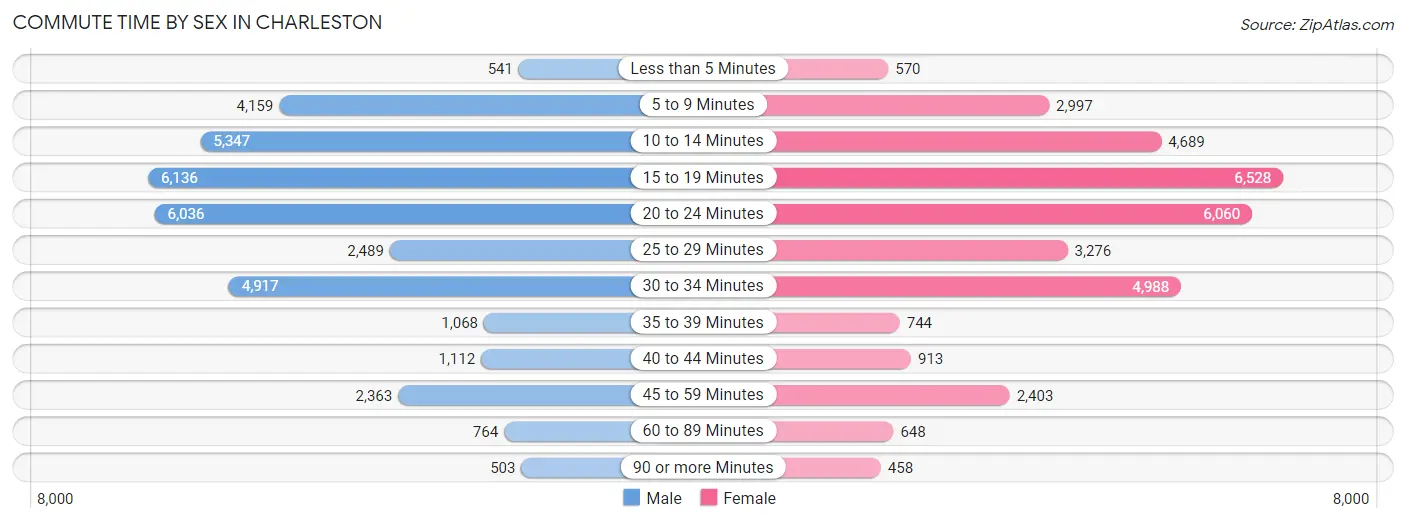
| Commute Time | Male | Female |
| Less than 5 Minutes | 541 (1.5%) | 570 (1.7%) |
| 5 to 9 Minutes | 4,159 (11.7%) | 2,997 (8.7%) |
| 10 to 14 Minutes | 5,347 (15.1%) | 4,689 (13.7%) |
| 15 to 19 Minutes | 6,136 (17.3%) | 6,528 (19.1%) |
| 20 to 24 Minutes | 6,036 (17.0%) | 6,060 (17.7%) |
| 25 to 29 Minutes | 2,489 (7.0%) | 3,276 (9.6%) |
| 30 to 34 Minutes | 4,917 (13.9%) | 4,988 (14.5%) |
| 35 to 39 Minutes | 1,068 (3.0%) | 744 (2.2%) |
| 40 to 44 Minutes | 1,112 (3.1%) | 913 (2.7%) |
| 45 to 59 Minutes | 2,363 (6.7%) | 2,403 (7.0%) |
| 60 to 89 Minutes | 764 (2.2%) | 648 (1.9%) |
| 90 or more Minutes | 503 (1.4%) | 458 (1.3%) |
Time of Departure to Work by Sex in Charleston
The most frequent times of departure to work in Charleston are 7:00 AM to 7:29 AM (5,233, 14.8%) for males and 8:00 AM to 8:29 AM (6,008, 17.5%) for females.
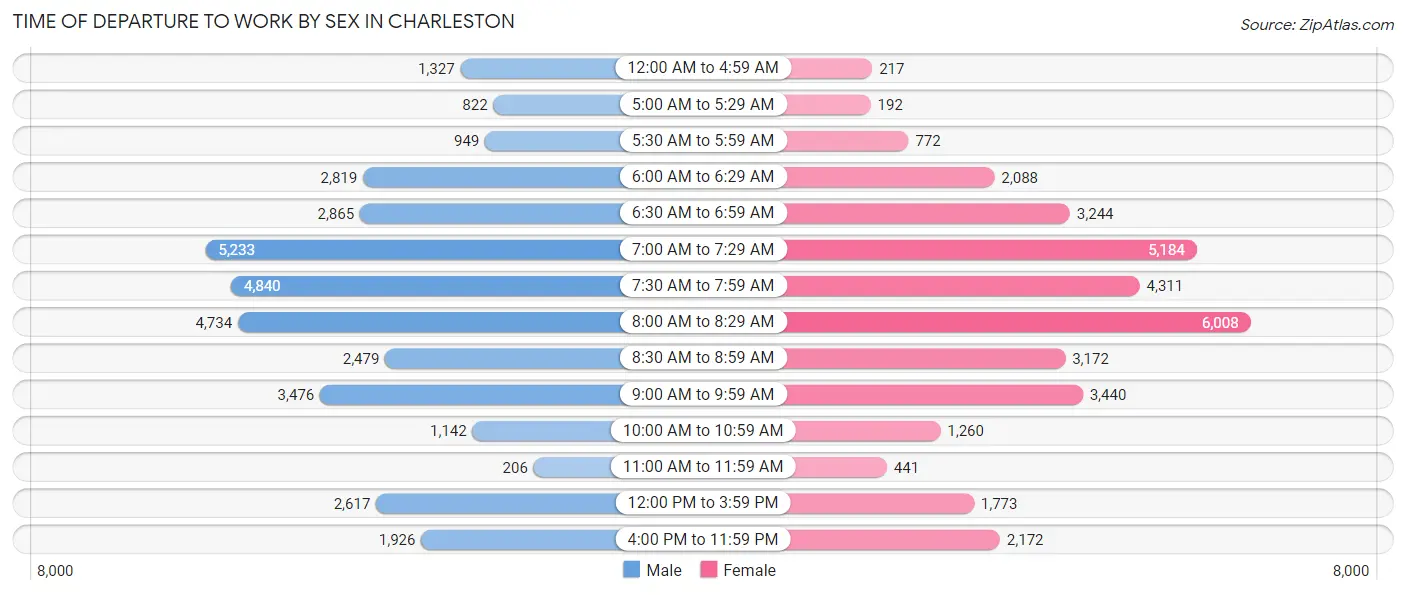
| Time of Departure | Male | Female |
| 12:00 AM to 4:59 AM | 1,327 (3.7%) | 217 (0.6%) |
| 5:00 AM to 5:29 AM | 822 (2.3%) | 192 (0.6%) |
| 5:30 AM to 5:59 AM | 949 (2.7%) | 772 (2.2%) |
| 6:00 AM to 6:29 AM | 2,819 (8.0%) | 2,088 (6.1%) |
| 6:30 AM to 6:59 AM | 2,865 (8.1%) | 3,244 (9.5%) |
| 7:00 AM to 7:29 AM | 5,233 (14.8%) | 5,184 (15.1%) |
| 7:30 AM to 7:59 AM | 4,840 (13.7%) | 4,311 (12.6%) |
| 8:00 AM to 8:29 AM | 4,734 (13.4%) | 6,008 (17.5%) |
| 8:30 AM to 8:59 AM | 2,479 (7.0%) | 3,172 (9.2%) |
| 9:00 AM to 9:59 AM | 3,476 (9.8%) | 3,440 (10.0%) |
| 10:00 AM to 10:59 AM | 1,142 (3.2%) | 1,260 (3.7%) |
| 11:00 AM to 11:59 AM | 206 (0.6%) | 441 (1.3%) |
| 12:00 PM to 3:59 PM | 2,617 (7.4%) | 1,773 (5.2%) |
| 4:00 PM to 11:59 PM | 1,926 (5.4%) | 2,172 (6.3%) |
| Total | 35,435 (100.0%) | 34,274 (100.0%) |
Housing Occupancy in Charleston
Occupancy by Ownership in Charleston
Of the total 65,198 dwellings in Charleston, owner-occupied units account for 36,251 (55.6%), while renter-occupied units make up 28,947 (44.4%).
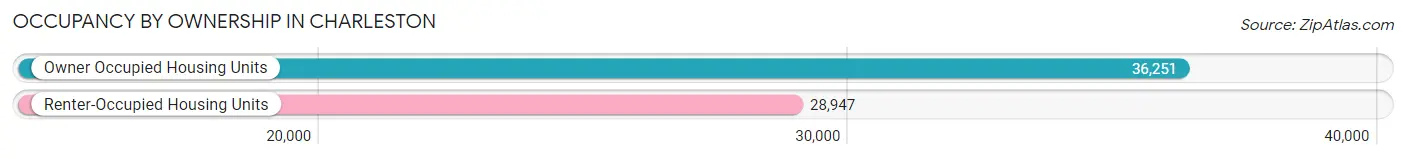
| Occupancy | # Housing Units | % Housing Units |
| Owner Occupied Housing Units | 36,251 | 55.6% |
| Renter-Occupied Housing Units | 28,947 | 44.4% |
| Total Occupied Housing Units | 65,198 | 100.0% |
Occupancy by Household Size in Charleston
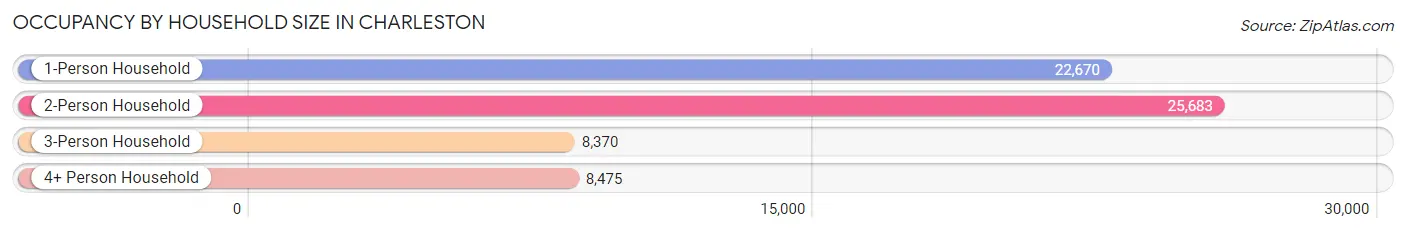
| Household Size | # Housing Units | % Housing Units |
| 1-Person Household | 22,670 | 34.8% |
| 2-Person Household | 25,683 | 39.4% |
| 3-Person Household | 8,370 | 12.8% |
| 4+ Person Household | 8,475 | 13.0% |
| Total Housing Units | 65,198 | 100.0% |
Occupancy by Ownership by Household Size in Charleston
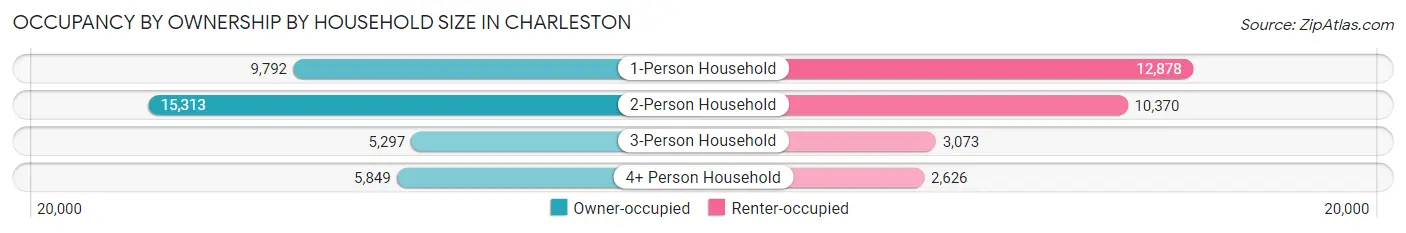
| Household Size | Owner-occupied | Renter-occupied |
| 1-Person Household | 9,792 (43.2%) | 12,878 (56.8%) |
| 2-Person Household | 15,313 (59.6%) | 10,370 (40.4%) |
| 3-Person Household | 5,297 (63.3%) | 3,073 (36.7%) |
| 4+ Person Household | 5,849 (69.0%) | 2,626 (31.0%) |
| Total Housing Units | 36,251 (55.6%) | 28,947 (44.4%) |
Occupancy by Educational Attainment in Charleston
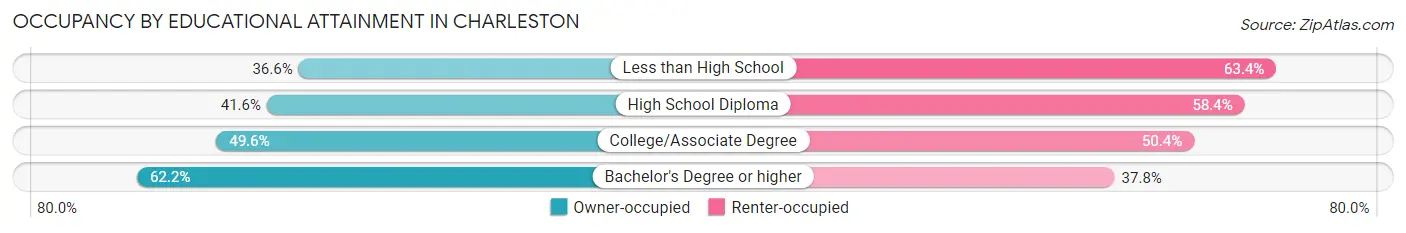
| Household Size | Owner-occupied | Renter-occupied |
| Less than High School | 794 (36.6%) | 1,378 (63.4%) |
| High School Diploma | 3,627 (41.6%) | 5,095 (58.4%) |
| College/Associate Degree | 7,619 (49.6%) | 7,744 (50.4%) |
| Bachelor's Degree or higher | 24,211 (62.2%) | 14,730 (37.8%) |
Occupancy by Age of Householder in Charleston
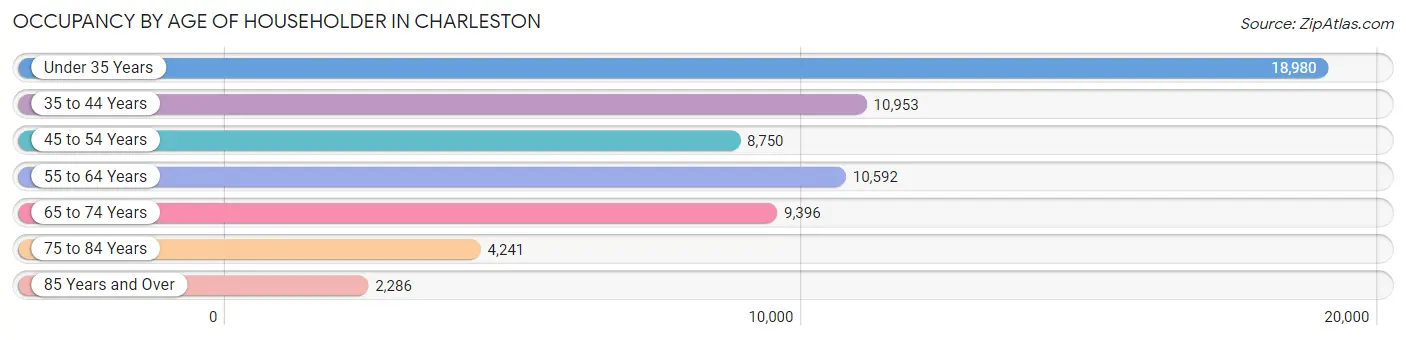
| Age Bracket | # Households | % Households |
| Under 35 Years | 18,980 | 29.1% |
| 35 to 44 Years | 10,953 | 16.8% |
| 45 to 54 Years | 8,750 | 13.4% |
| 55 to 64 Years | 10,592 | 16.3% |
| 65 to 74 Years | 9,396 | 14.4% |
| 75 to 84 Years | 4,241 | 6.5% |
| 85 Years and Over | 2,286 | 3.5% |
| Total | 65,198 | 100.0% |
Housing Finances in Charleston
Median Income by Occupancy in Charleston
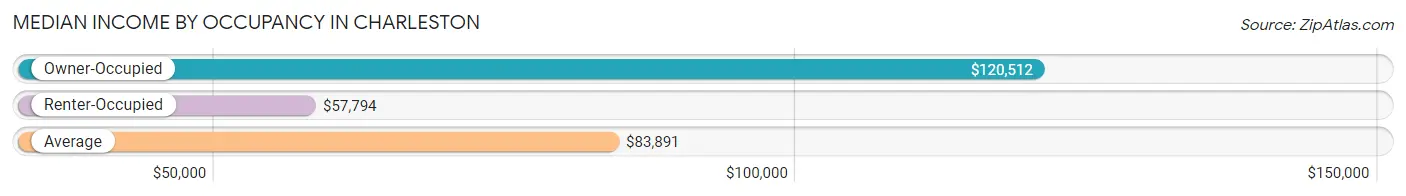
| Occupancy Type | # Households | Median Income |
| Owner-Occupied | 36,251 (55.6%) | $120,512 |
| Renter-Occupied | 28,947 (44.4%) | $57,794 |
| Average | 65,198 (100.0%) | $83,891 |
Occupancy by Householder Income Bracket in Charleston
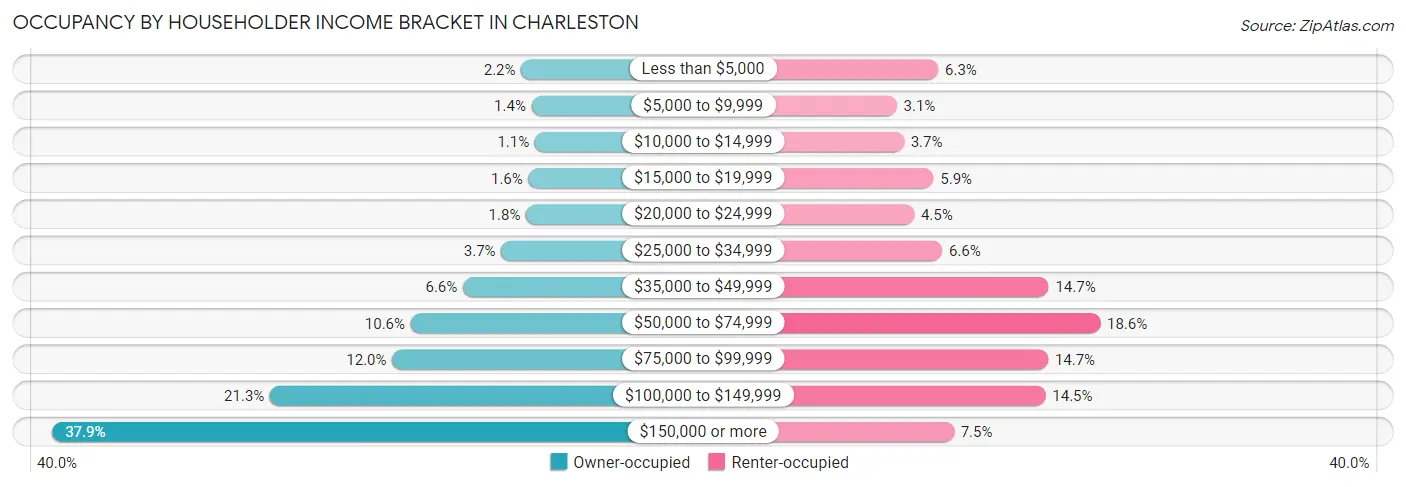
| Income Bracket | Owner-occupied | Renter-occupied |
| Less than $5,000 | 779 (2.1%) | 1,822 (6.3%) |
| $5,000 to $9,999 | 494 (1.4%) | 907 (3.1%) |
| $10,000 to $14,999 | 401 (1.1%) | 1,063 (3.7%) |
| $15,000 to $19,999 | 581 (1.6%) | 1,716 (5.9%) |
| $20,000 to $24,999 | 645 (1.8%) | 1,288 (4.4%) |
| $25,000 to $34,999 | 1,329 (3.7%) | 1,908 (6.6%) |
| $35,000 to $49,999 | 2,390 (6.6%) | 4,256 (14.7%) |
| $50,000 to $74,999 | 3,833 (10.6%) | 5,392 (18.6%) |
| $75,000 to $99,999 | 4,344 (12.0%) | 4,244 (14.7%) |
| $100,000 to $149,999 | 7,718 (21.3%) | 4,186 (14.5%) |
| $150,000 or more | 13,737 (37.9%) | 2,165 (7.5%) |
| Total | 36,251 (100.0%) | 28,947 (100.0%) |
Monthly Housing Cost Tiers in Charleston
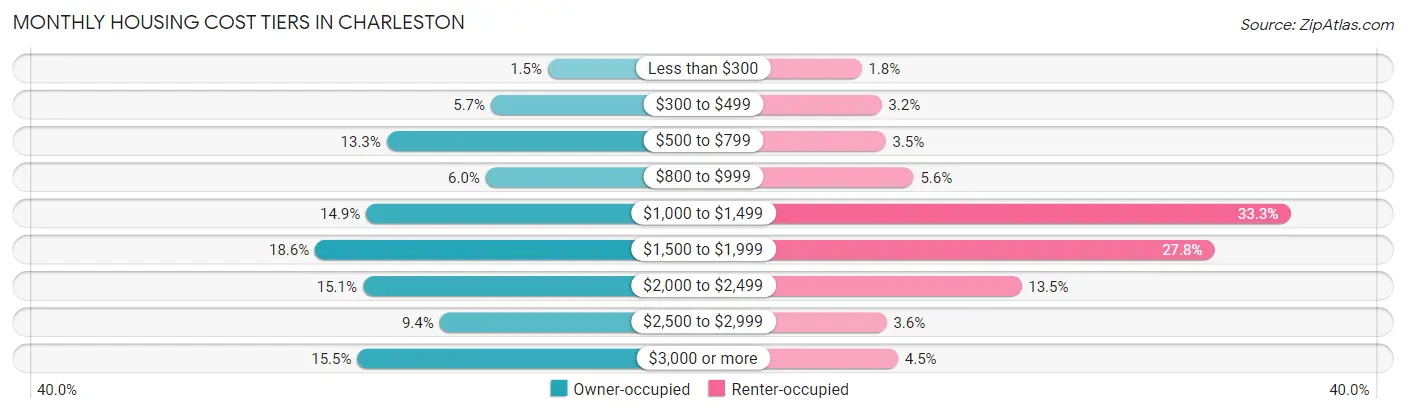
| Monthly Cost | Owner-occupied | Renter-occupied |
| Less than $300 | 534 (1.5%) | 513 (1.8%) |
| $300 to $499 | 2,050 (5.7%) | 939 (3.2%) |
| $500 to $799 | 4,837 (13.3%) | 1,026 (3.5%) |
| $800 to $999 | 2,190 (6.0%) | 1,622 (5.6%) |
| $1,000 to $1,499 | 5,382 (14.8%) | 9,652 (33.3%) |
| $1,500 to $1,999 | 6,745 (18.6%) | 8,032 (27.8%) |
| $2,000 to $2,499 | 5,471 (15.1%) | 3,920 (13.5%) |
| $2,500 to $2,999 | 3,423 (9.4%) | 1,044 (3.6%) |
| $3,000 or more | 5,619 (15.5%) | 1,288 (4.4%) |
| Total | 36,251 (100.0%) | 28,947 (100.0%) |
Physical Housing Characteristics in Charleston
Housing Structures in Charleston
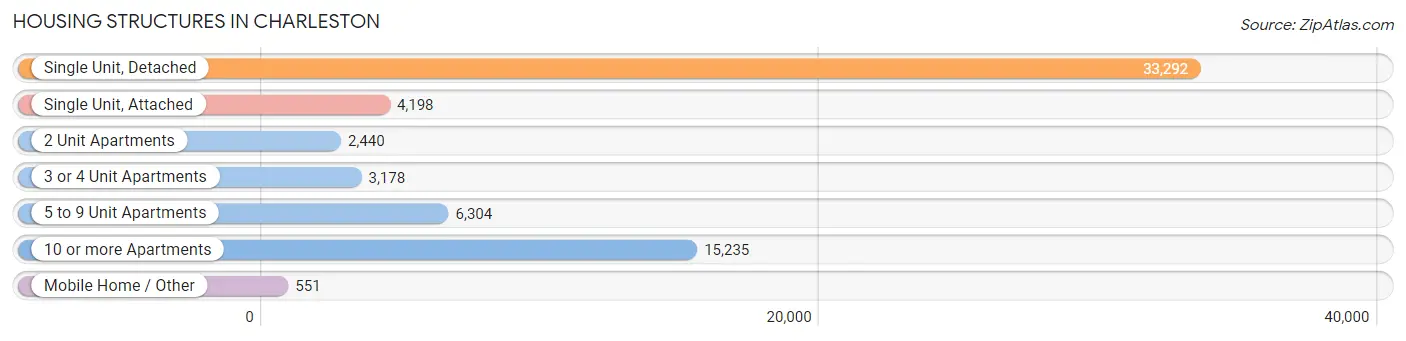
| Structure Type | # Housing Units | % Housing Units |
| Single Unit, Detached | 33,292 | 51.1% |
| Single Unit, Attached | 4,198 | 6.4% |
| 2 Unit Apartments | 2,440 | 3.7% |
| 3 or 4 Unit Apartments | 3,178 | 4.9% |
| 5 to 9 Unit Apartments | 6,304 | 9.7% |
| 10 or more Apartments | 15,235 | 23.4% |
| Mobile Home / Other | 551 | 0.9% |
| Total | 65,198 | 100.0% |
Housing Structures by Occupancy in Charleston
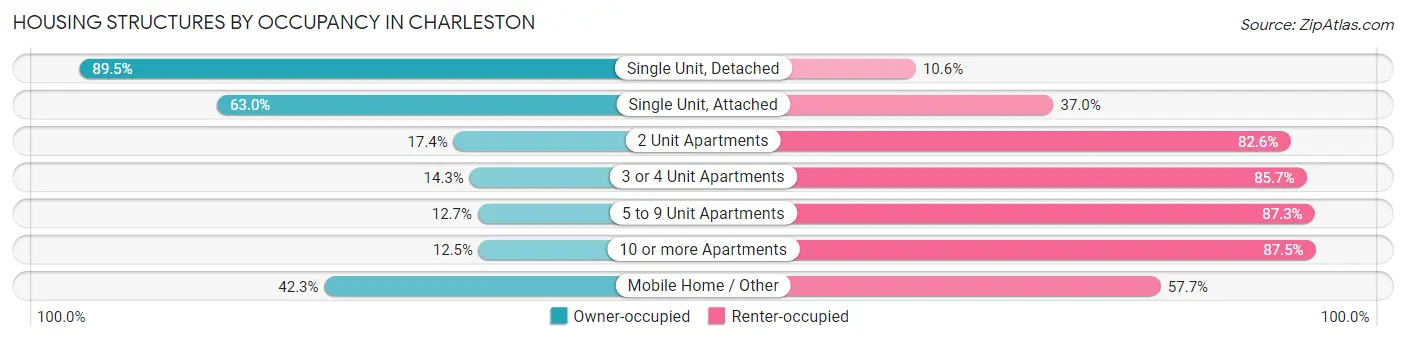
| Structure Type | Owner-occupied | Renter-occupied |
| Single Unit, Detached | 29,781 (89.4%) | 3,511 (10.5%) |
| Single Unit, Attached | 2,643 (63.0%) | 1,555 (37.0%) |
| 2 Unit Apartments | 425 (17.4%) | 2,015 (82.6%) |
| 3 or 4 Unit Apartments | 455 (14.3%) | 2,723 (85.7%) |
| 5 to 9 Unit Apartments | 803 (12.7%) | 5,501 (87.3%) |
| 10 or more Apartments | 1,911 (12.5%) | 13,324 (87.5%) |
| Mobile Home / Other | 233 (42.3%) | 318 (57.7%) |
| Total | 36,251 (55.6%) | 28,947 (44.4%) |
Housing Structures by Number of Rooms in Charleston
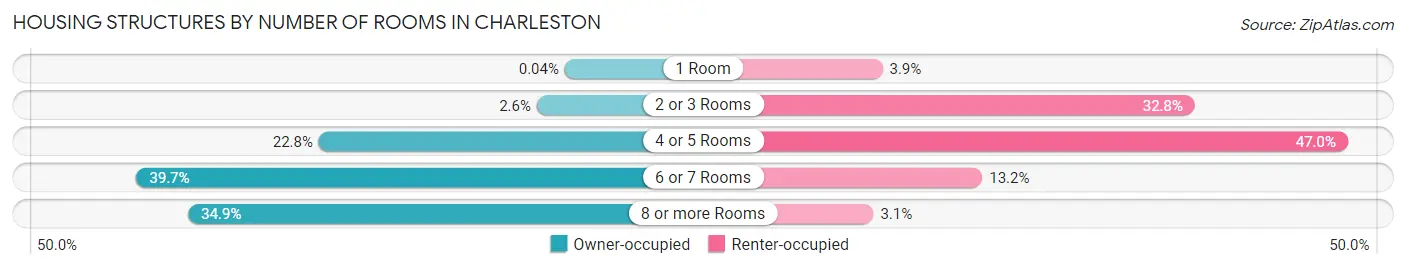
| Number of Rooms | Owner-occupied | Renter-occupied |
| 1 Room | 13 (0.0%) | 1,141 (3.9%) |
| 2 or 3 Rooms | 954 (2.6%) | 9,501 (32.8%) |
| 4 or 5 Rooms | 8,263 (22.8%) | 13,596 (47.0%) |
| 6 or 7 Rooms | 14,378 (39.7%) | 3,812 (13.2%) |
| 8 or more Rooms | 12,643 (34.9%) | 897 (3.1%) |
| Total | 36,251 (100.0%) | 28,947 (100.0%) |
Housing Structure by Heating Type in Charleston
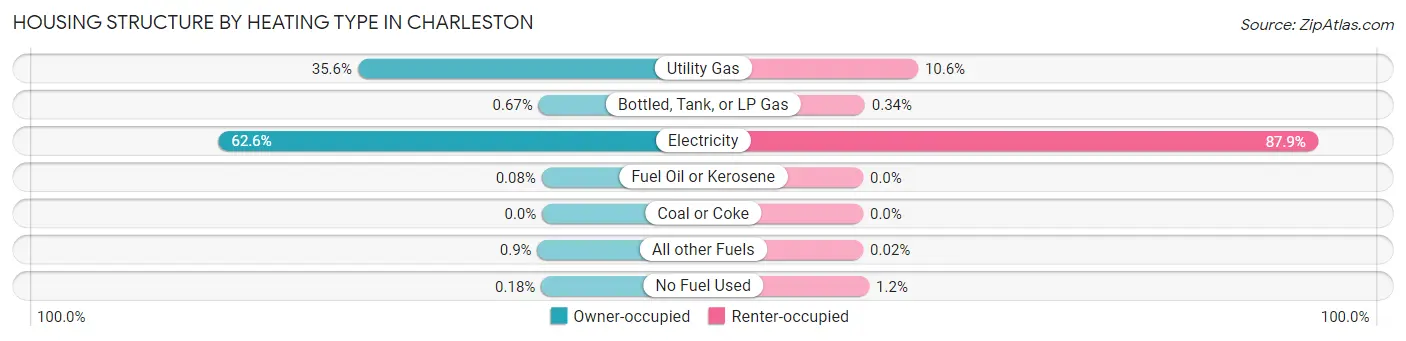
| Heating Type | Owner-occupied | Renter-occupied |
| Utility Gas | 12,913 (35.6%) | 3,072 (10.6%) |
| Bottled, Tank, or LP Gas | 243 (0.7%) | 98 (0.3%) |
| Electricity | 22,674 (62.5%) | 25,429 (87.8%) |
| Fuel Oil or Kerosene | 28 (0.1%) | 0 (0.0%) |
| Coal or Coke | 0 (0.0%) | 0 (0.0%) |
| All other Fuels | 326 (0.9%) | 7 (0.0%) |
| No Fuel Used | 67 (0.2%) | 341 (1.2%) |
| Total | 36,251 (100.0%) | 28,947 (100.0%) |
Household Vehicle Usage in Charleston
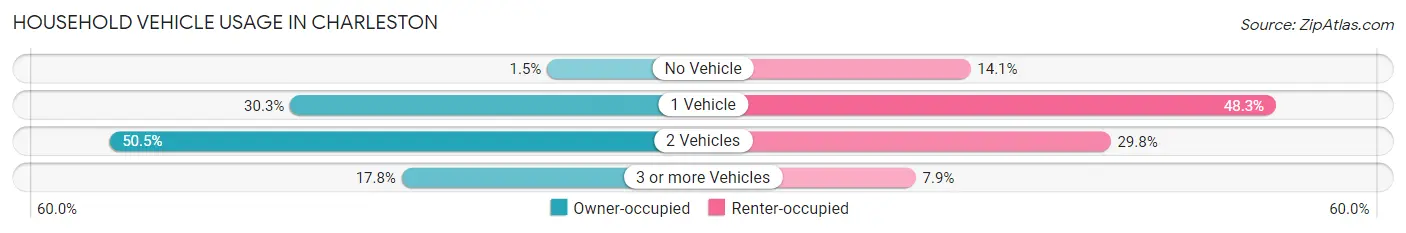
| Vehicles per Household | Owner-occupied | Renter-occupied |
| No Vehicle | 530 (1.5%) | 4,066 (14.1%) |
| 1 Vehicle | 10,967 (30.2%) | 13,976 (48.3%) |
| 2 Vehicles | 18,315 (50.5%) | 8,612 (29.7%) |
| 3 or more Vehicles | 6,439 (17.8%) | 2,293 (7.9%) |
| Total | 36,251 (100.0%) | 28,947 (100.0%) |
Real Estate & Mortgages in Charleston
Real Estate and Mortgage Overview in Charleston
| Characteristic | Without Mortgage | With Mortgage |
| Housing Units | 11,132 | 25,119 |
| Median Property Value | $448,700 | $435,200 |
| Median Household Income | $84,733 | $10,751 |
| Monthly Housing Costs | $686 | $5,505 |
| Real Estate Taxes | $1,936 | $252 |
Property Value by Mortgage Status in Charleston
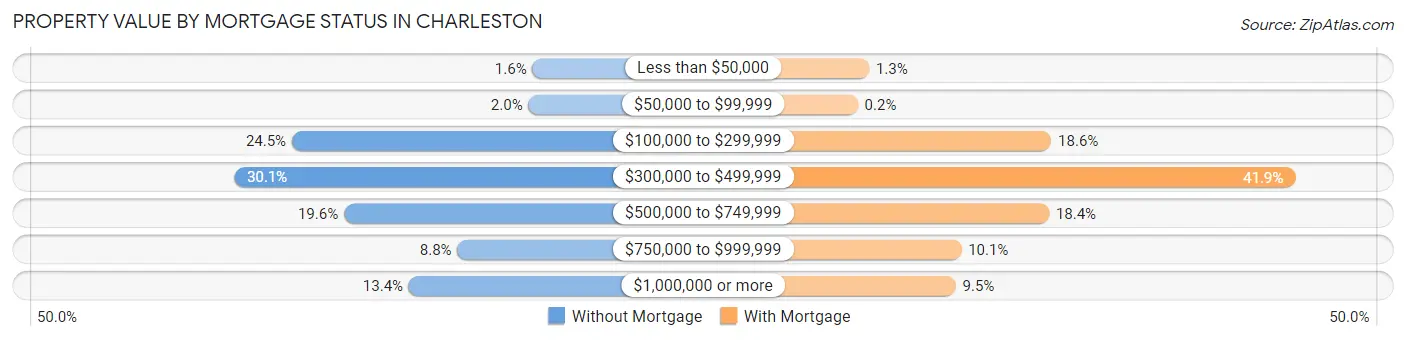
| Property Value | Without Mortgage | With Mortgage |
| Less than $50,000 | 181 (1.6%) | 322 (1.3%) |
| $50,000 to $99,999 | 224 (2.0%) | 51 (0.2%) |
| $100,000 to $299,999 | 2,732 (24.5%) | 4,679 (18.6%) |
| $300,000 to $499,999 | 3,346 (30.1%) | 10,520 (41.9%) |
| $500,000 to $749,999 | 2,180 (19.6%) | 4,626 (18.4%) |
| $750,000 to $999,999 | 977 (8.8%) | 2,526 (10.1%) |
| $1,000,000 or more | 1,492 (13.4%) | 2,395 (9.5%) |
| Total | 11,132 (100.0%) | 25,119 (100.0%) |
Household Income by Mortgage Status in Charleston
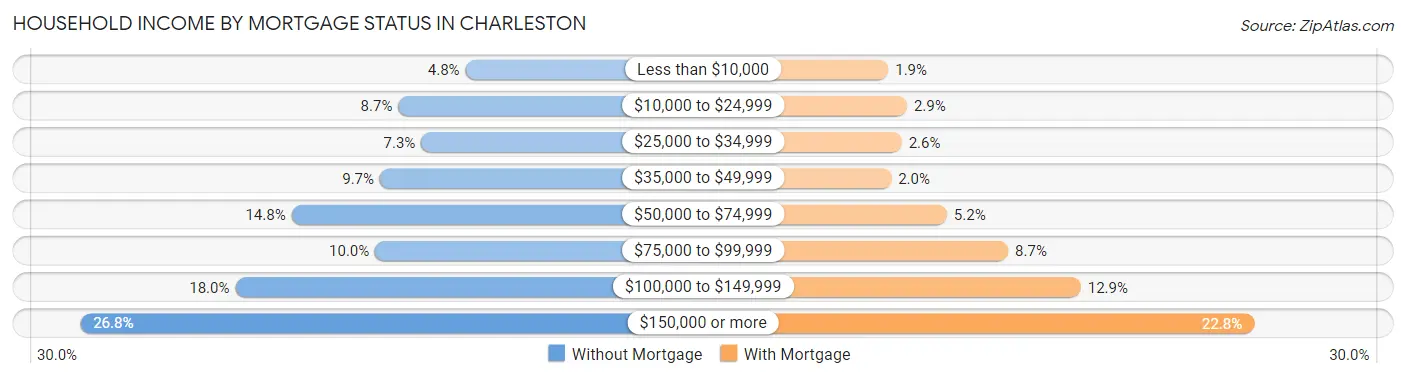
| Household Income | Without Mortgage | With Mortgage |
| Less than $10,000 | 535 (4.8%) | 469 (1.9%) |
| $10,000 to $24,999 | 963 (8.6%) | 738 (2.9%) |
| $25,000 to $34,999 | 817 (7.3%) | 664 (2.6%) |
| $35,000 to $49,999 | 1,080 (9.7%) | 512 (2.0%) |
| $50,000 to $74,999 | 1,642 (14.7%) | 1,310 (5.2%) |
| $75,000 to $99,999 | 1,110 (10.0%) | 2,191 (8.7%) |
| $100,000 to $149,999 | 1,999 (18.0%) | 3,234 (12.9%) |
| $150,000 or more | 2,986 (26.8%) | 5,719 (22.8%) |
| Total | 11,132 (100.0%) | 25,119 (100.0%) |
Property Value to Household Income Ratio in Charleston
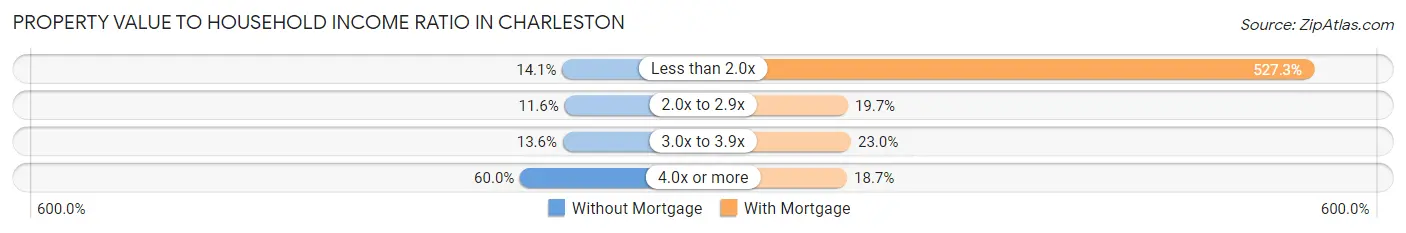
| Value-to-Income Ratio | Without Mortgage | With Mortgage |
| Less than 2.0x | 1,570 (14.1%) | 132,456 (527.3%) |
| 2.0x to 2.9x | 1,292 (11.6%) | 4,937 (19.7%) |
| 3.0x to 3.9x | 1,511 (13.6%) | 5,784 (23.0%) |
| 4.0x or more | 6,680 (60.0%) | 4,708 (18.7%) |
| Total | 11,132 (100.0%) | 25,119 (100.0%) |
Real Estate Taxes by Mortgage Status in Charleston
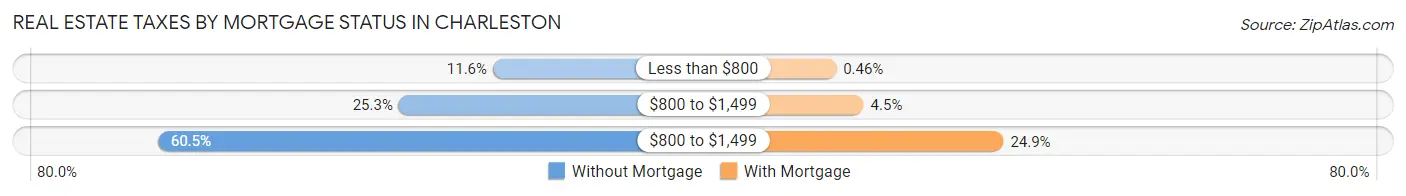
| Property Taxes | Without Mortgage | With Mortgage |
| Less than $800 | 1,289 (11.6%) | 115 (0.5%) |
| $800 to $1,499 | 2,820 (25.3%) | 1,124 (4.5%) |
| $800 to $1,499 | 6,738 (60.5%) | 6,255 (24.9%) |
| Total | 11,132 (100.0%) | 25,119 (100.0%) |
Health & Disability in Charleston
Health Insurance Coverage by Age in Charleston
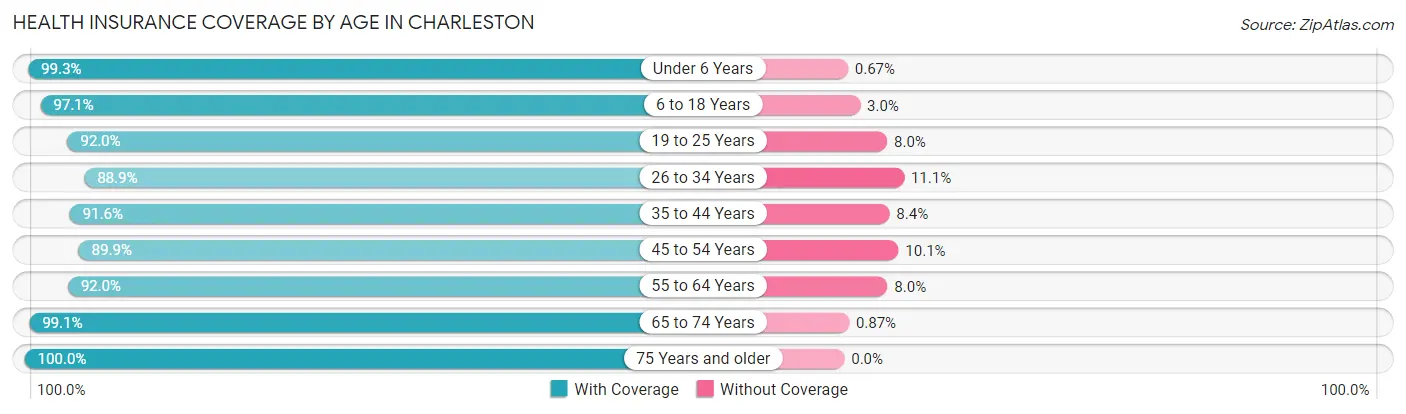
| Age Bracket | With Coverage | Without Coverage |
| Under 6 Years | 9,388 (99.3%) | 63 (0.7%) |
| 6 to 18 Years | 17,407 (97.1%) | 530 (2.9%) |
| 19 to 25 Years | 16,794 (92.0%) | 1,456 (8.0%) |
| 26 to 34 Years | 22,654 (88.9%) | 2,838 (11.1%) |
| 35 to 44 Years | 18,147 (91.6%) | 1,667 (8.4%) |
| 45 to 54 Years | 14,255 (89.9%) | 1,599 (10.1%) |
| 55 to 64 Years | 15,926 (92.0%) | 1,393 (8.0%) |
| 65 to 74 Years | 14,187 (99.1%) | 125 (0.9%) |
| 75 Years and older | 9,595 (100.0%) | 0 (0.0%) |
| Total | 138,353 (93.5%) | 9,671 (6.5%) |
Health Insurance Coverage by Citizenship Status in Charleston
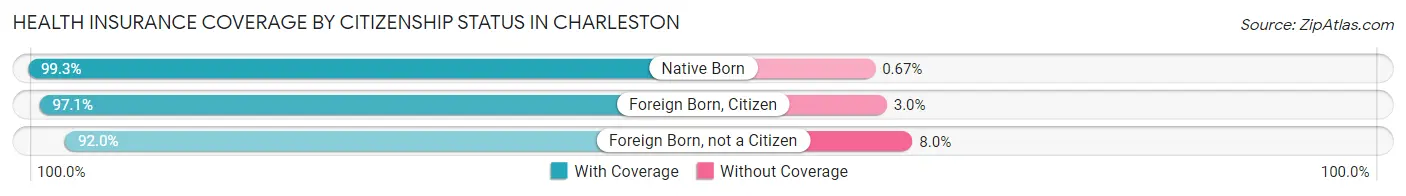
| Citizenship Status | With Coverage | Without Coverage |
| Native Born | 9,388 (99.3%) | 63 (0.7%) |
| Foreign Born, Citizen | 17,407 (97.1%) | 530 (2.9%) |
| Foreign Born, not a Citizen | 16,794 (92.0%) | 1,456 (8.0%) |
Health Insurance Coverage by Household Income in Charleston
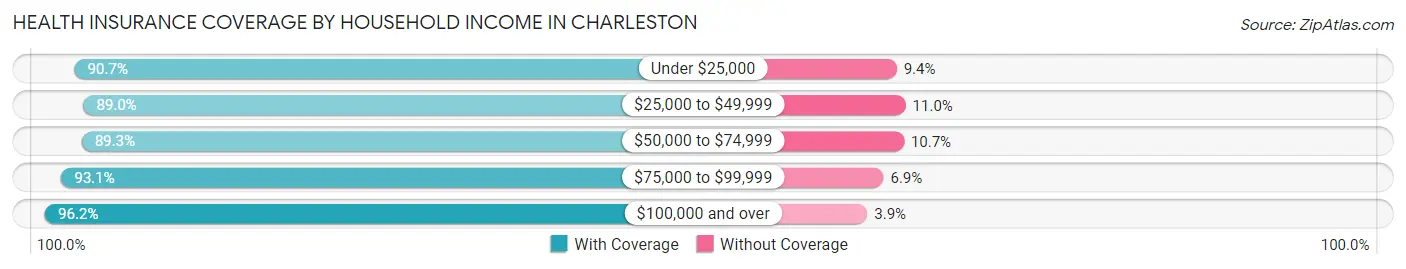
| Household Income | With Coverage | Without Coverage |
| Under $25,000 | 15,880 (90.6%) | 1,638 (9.3%) |
| $25,000 to $49,999 | 15,106 (89.0%) | 1,872 (11.0%) |
| $50,000 to $74,999 | 15,447 (89.3%) | 1,853 (10.7%) |
| $75,000 to $99,999 | 16,479 (93.1%) | 1,217 (6.9%) |
| $100,000 and over | 70,254 (96.2%) | 2,815 (3.8%) |
Public vs Private Health Insurance Coverage by Age in Charleston
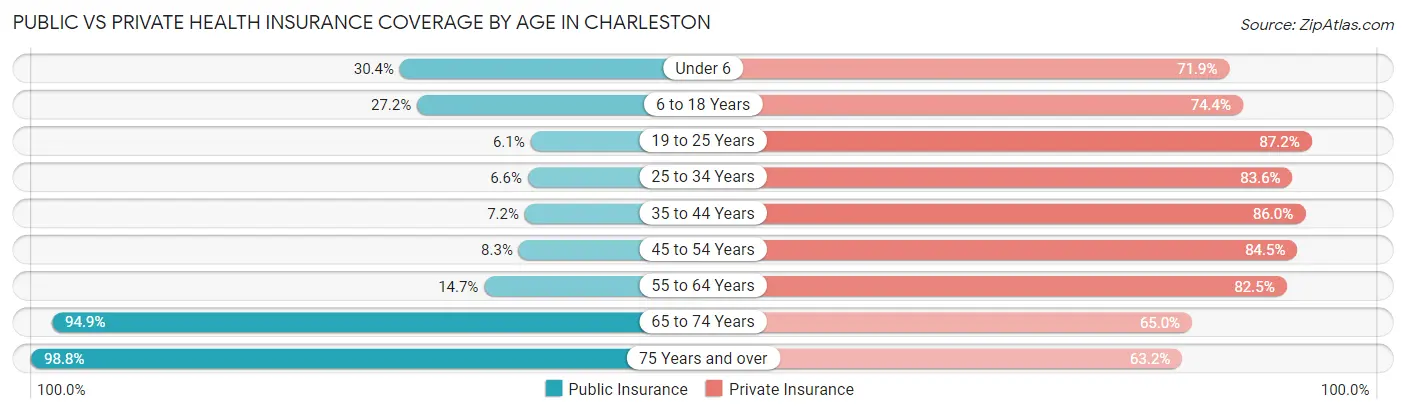
| Age Bracket | Public Insurance | Private Insurance |
| Under 6 | 2,869 (30.4%) | 6,797 (71.9%) |
| 6 to 18 Years | 4,872 (27.2%) | 13,350 (74.4%) |
| 19 to 25 Years | 1,109 (6.1%) | 15,910 (87.2%) |
| 25 to 34 Years | 1,682 (6.6%) | 21,320 (83.6%) |
| 35 to 44 Years | 1,419 (7.2%) | 17,036 (86.0%) |
| 45 to 54 Years | 1,313 (8.3%) | 13,402 (84.5%) |
| 55 to 64 Years | 2,545 (14.7%) | 14,294 (82.5%) |
| 65 to 74 Years | 13,581 (94.9%) | 9,301 (65.0%) |
| 75 Years and over | 9,480 (98.8%) | 6,061 (63.2%) |
| Total | 38,870 (26.3%) | 117,471 (79.4%) |
Disability Status by Sex by Age in Charleston
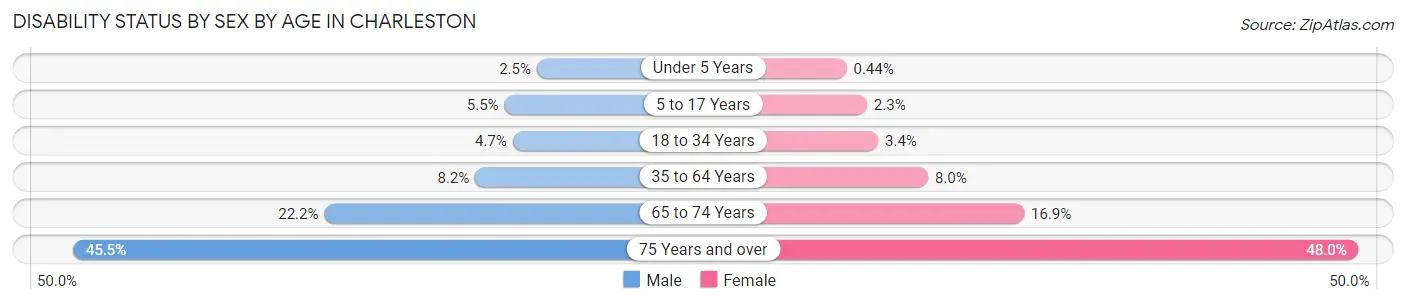
| Age Bracket | Male | Female |
| Under 5 Years | 86 (2.5%) | 19 (0.4%) |
| 5 to 17 Years | 494 (5.5%) | 191 (2.3%) |
| 18 to 34 Years | 1,067 (4.7%) | 786 (3.4%) |
| 35 to 64 Years | 2,057 (8.2%) | 2,229 (8.0%) |
| 65 to 74 Years | 1,344 (22.2%) | 1,397 (16.9%) |
| 75 Years and over | 1,574 (45.5%) | 2,943 (48.0%) |
Disability Class by Sex by Age in Charleston
Disability Class: Hearing Difficulty
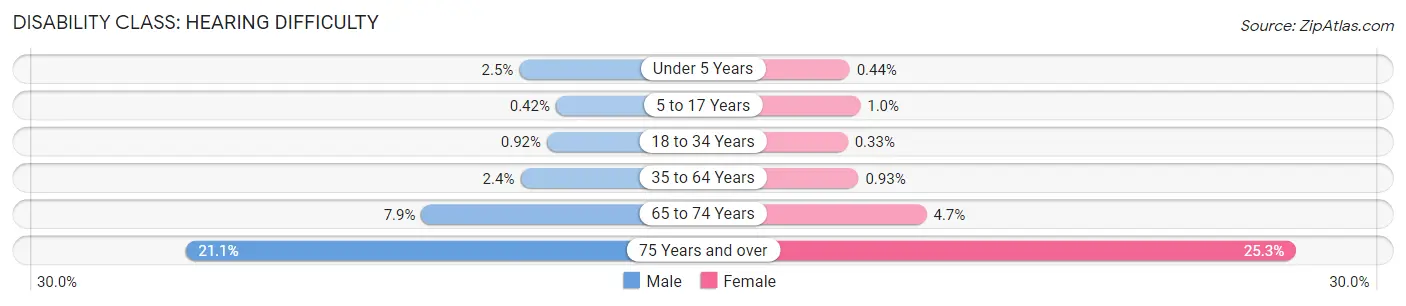
| Age Bracket | Male | Female |
| Under 5 Years | 86 (2.5%) | 19 (0.4%) |
| 5 to 17 Years | 38 (0.4%) | 85 (1.0%) |
| 18 to 34 Years | 208 (0.9%) | 76 (0.3%) |
| 35 to 64 Years | 602 (2.4%) | 258 (0.9%) |
| 65 to 74 Years | 479 (7.9%) | 390 (4.7%) |
| 75 Years and over | 728 (21.0%) | 1,552 (25.3%) |
Disability Class: Vision Difficulty
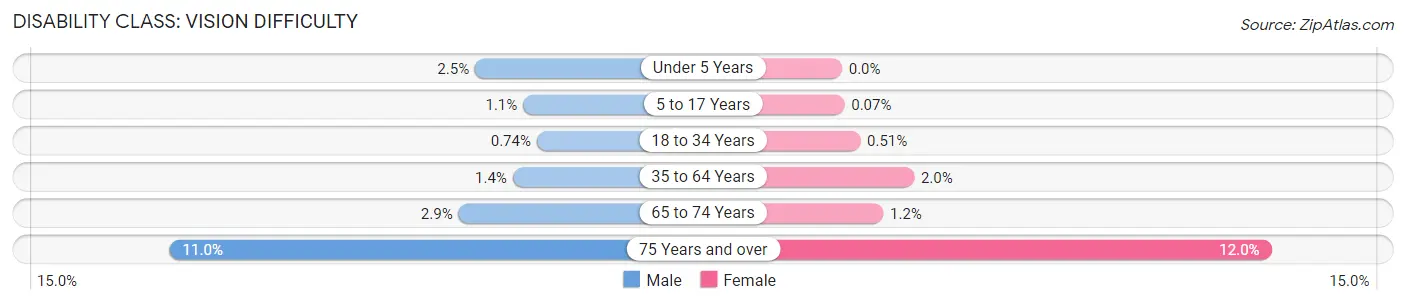
| Age Bracket | Male | Female |
| Under 5 Years | 86 (2.5%) | 0 (0.0%) |
| 5 to 17 Years | 101 (1.1%) | 6 (0.1%) |
| 18 to 34 Years | 167 (0.7%) | 120 (0.5%) |
| 35 to 64 Years | 355 (1.4%) | 561 (2.0%) |
| 65 to 74 Years | 177 (2.9%) | 95 (1.1%) |
| 75 Years and over | 379 (11.0%) | 734 (12.0%) |
Disability Class: Cognitive Difficulty
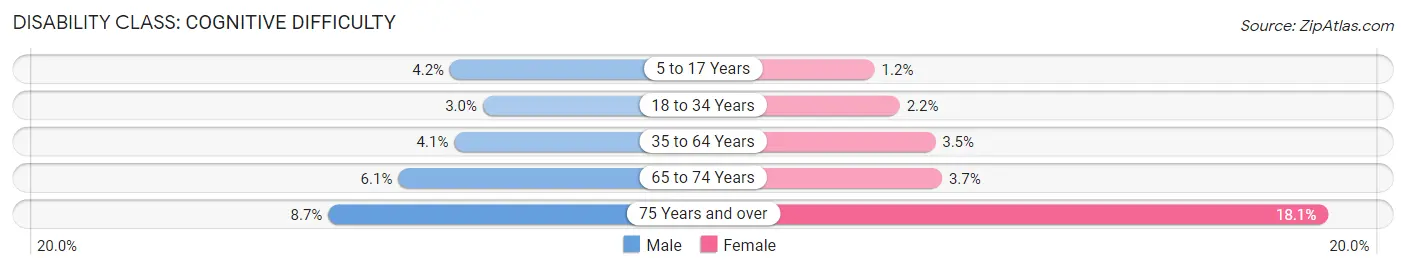
| Age Bracket | Male | Female |
| 5 to 17 Years | 380 (4.2%) | 100 (1.2%) |
| 18 to 34 Years | 679 (3.0%) | 501 (2.1%) |
| 35 to 64 Years | 1,019 (4.1%) | 967 (3.5%) |
| 65 to 74 Years | 371 (6.1%) | 307 (3.7%) |
| 75 Years and over | 302 (8.7%) | 1,108 (18.0%) |
Disability Class: Ambulatory Difficulty
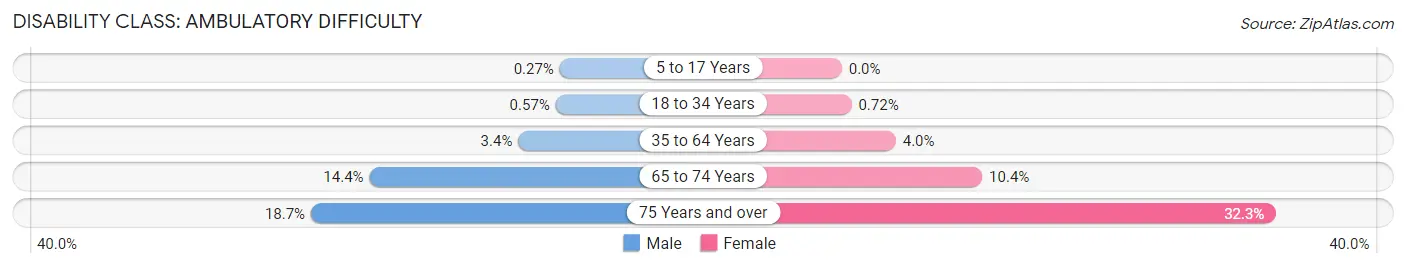
| Age Bracket | Male | Female |
| 5 to 17 Years | 24 (0.3%) | 0 (0.0%) |
| 18 to 34 Years | 130 (0.6%) | 169 (0.7%) |
| 35 to 64 Years | 841 (3.4%) | 1,118 (4.0%) |
| 65 to 74 Years | 872 (14.4%) | 860 (10.4%) |
| 75 Years and over | 648 (18.7%) | 1,979 (32.3%) |
Disability Class: Self-Care Difficulty
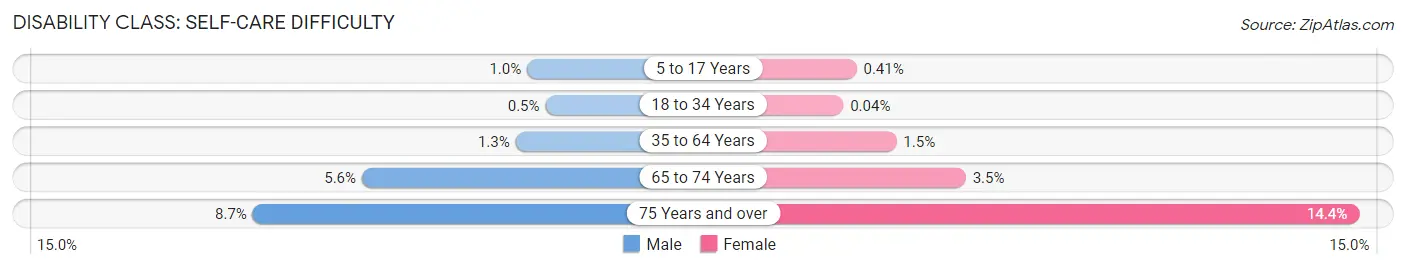
| Age Bracket | Male | Female |
| 5 to 17 Years | 91 (1.0%) | 34 (0.4%) |
| 18 to 34 Years | 114 (0.5%) | 9 (0.0%) |
| 35 to 64 Years | 333 (1.3%) | 424 (1.5%) |
| 65 to 74 Years | 340 (5.6%) | 285 (3.5%) |
| 75 Years and over | 299 (8.6%) | 884 (14.4%) |
Technology Access in Charleston
Computing Device Access in Charleston
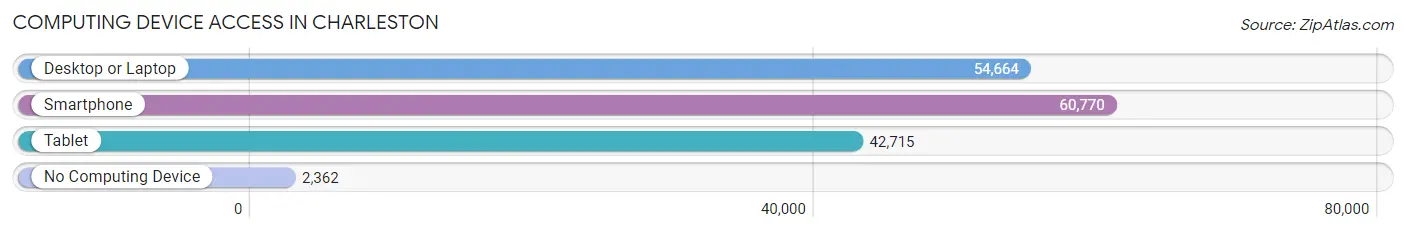
| Device Type | # Households | % Households |
| Desktop or Laptop | 54,664 | 83.8% |
| Smartphone | 60,770 | 93.2% |
| Tablet | 42,715 | 65.5% |
| No Computing Device | 2,362 | 3.6% |
| Total | 65,198 | 100.0% |
Internet Access in Charleston
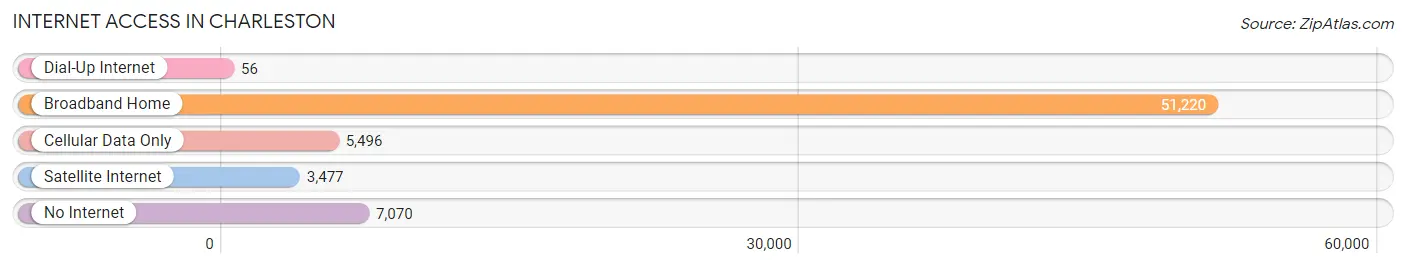
| Internet Type | # Households | % Households |
| Dial-Up Internet | 56 | 0.1% |
| Broadband Home | 51,220 | 78.6% |
| Cellular Data Only | 5,496 | 8.4% |
| Satellite Internet | 3,477 | 5.3% |
| No Internet | 7,070 | 10.8% |
| Total | 65,198 | 100.0% |
Charleston Summary
Charleston, South Carolina is a city located in the southeastern United States, on the Atlantic coast. It is the county seat of Charleston County and the largest city in the state. The city is known for its rich history, culture, and architecture, and is a popular tourist destination.
Geography
Charleston is located on the Ashley and Cooper Rivers, which flow into the Atlantic Ocean. The city is situated on a peninsula between the two rivers, and is bordered by the Ashley River to the west and the Cooper River to the east. The city is located at 32°47'N 79°56'W. The city has a total area of 127.5 square miles, of which 121.2 square miles is land and 6.3 square miles is water.
Climate
Charleston has a humid subtropical climate, with hot, humid summers and mild winters. The average annual temperature is 64°F, with an average high of 81°F in July and an average low of 46°F in January. The average annual precipitation is 48.5 inches, with an average of 5.5 inches of snow per year.
Demographics
As of the 2010 census, Charleston had a population of 120,083. The racial makeup of the city was 57.2% White, 33.3% African American, 0.3% Native American, 2.7% Asian, 0.1% Pacific Islander, 4.2% from other races, and 2.4% from two or more races. Hispanic or Latino of any race were 8.2% of the population.
Economy
Charleston is a major port city and a major center for tourism, manufacturing, and finance. The city is home to several major companies, including Boeing, Blackbaud, and Benefitfocus. The city is also home to the Charleston Naval Shipyard, which is the largest employer in the city.
The city's economy is also supported by its thriving tourism industry. The city is home to several popular attractions, including the South Carolina Aquarium, the Charleston Museum, and the USS Yorktown. The city also hosts several annual festivals and events, such as the Spoleto Festival USA and the Southeastern Wildlife Exposition.
History
Charleston was founded in 1670 by English settlers. The city was named after King Charles II of England, and quickly became a major port city. The city was a major center of the slave trade, and was the site of the first shots of the Civil War in 1861.
The city was occupied by Union forces during the Civil War, and was the site of several major battles. After the war, the city was rebuilt and became a major center of commerce and industry. The city was also a major center of the civil rights movement in the 1960s.
Today, Charleston is a major tourist destination, and is known for its rich history, culture, and architecture. The city is home to several historic sites, including Fort Sumter, the Old Slave Mart Museum, and the Old Exchange Building. The city is also home to several universities, including the College of Charleston, the Citadel, and the Medical University of South Carolina.
Common Questions
What is Per Capita Income in Charleston?
Per Capita income in Charleston is $55,890.
What is the Median Family Income in Charleston?
Median Family Income in Charleston is $117,849.
What is the Median Household income in Charleston?
Median Household Income in Charleston is $83,891.
What is Income or Wage Gap in Charleston?
Income or Wage Gap in Charleston is 22.5%.
Women in Charleston earn 77.5 cents for every dollar earned by a man.
What is Family Income Deficit in Charleston?
Family Income Deficit in Charleston is $11,336.
Families that are below poverty line in Charleston earn $11,336 less on average than the poverty threshold level.
What is Inequality or Gini Index in Charleston?
Inequality or Gini Index in Charleston is 0.50.
What is the Total Population of Charleston?
Total Population of Charleston is 149,960.
What is the Total Male Population of Charleston?
Total Male Population of Charleston is 71,182.
What is the Total Female Population of Charleston?
Total Female Population of Charleston is 78,778.
What is the Ratio of Males per 100 Females in Charleston?
There are 90.36 Males per 100 Females in Charleston.
What is the Ratio of Females per 100 Males in Charleston?
There are 110.67 Females per 100 Males in Charleston.
What is the Median Population Age in Charleston?
Median Population Age in Charleston is 36.3 Years.
What is the Average Family Size in Charleston
Average Family Size in Charleston is 2.9 People.
What is the Average Household Size in Charleston
Average Household Size in Charleston is 2.2 People.
How Large is the Labor Force in Charleston?
There are 86,145 People in the Labor Forcein in Charleston.
What is the Percentage of People in the Labor Force in Charleston?
67.6% of People are in the Labor Force in Charleston.
What is the Unemployment Rate in Charleston?
Unemployment Rate in Charleston is 3.7%.