Greenwood, SC Map & Demographics
Greenwood Map
Greenwood Overview
$21,399
PER CAPITA INCOME
$47,910
AVG FAMILY INCOME
$38,884
AVG HOUSEHOLD INCOME
20.7%
WAGE / INCOME GAP [ % ]
79.3¢/ $1
WAGE / INCOME GAP [ $ ]
0.44
INEQUALITY / GINI INDEX
22,528
TOTAL POPULATION
10,451
MALE POPULATION
12,077
FEMALE POPULATION
86.54
MALES / 100 FEMALES
115.56
FEMALES / 100 MALES
32.7
MEDIAN AGE
3.4
AVG FAMILY SIZE
2.3
AVG HOUSEHOLD SIZE
9,650
LABOR FORCE [ PEOPLE ]
55.0%
PERCENT IN LABOR FORCE
7.3%
UNEMPLOYMENT RATE
Greenwood Area Codes
Income in Greenwood
Income Overview in Greenwood
Per Capita Income in Greenwood is $21,399, while median incomes of families and households are $47,910 and $38,884 respectively.
| Characteristic | Number | Measure |
| Per Capita Income | 22,528 | $21,399 |
| Median Family Income | 4,238 | $47,910 |
| Mean Family Income | 4,238 | $61,853 |
| Median Household Income | 8,719 | $38,884 |
| Mean Household Income | 8,719 | $49,844 |
| Income Deficit | 4,238 | $0 |
| Wage / Income Gap (%) | 22,528 | 20.74% |
| Wage / Income Gap ($) | 22,528 | 79.26¢ per $1 |
| Gini / Inequality Index | 22,528 | 0.44 |
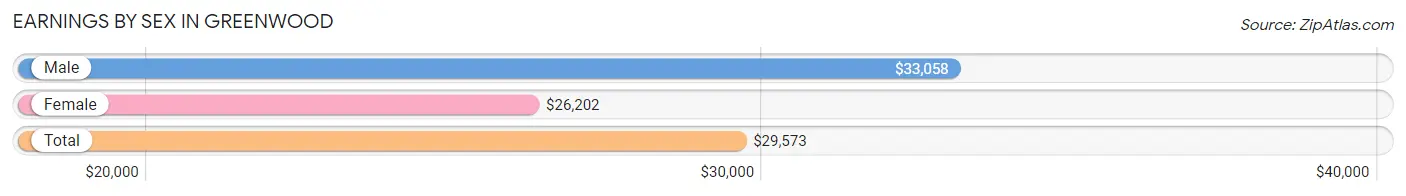
Earnings by Sex in Greenwood
Average Earnings in Greenwood are $29,573, $33,058 for men and $26,202 for women, a difference of 20.7%.
| Sex | Number | Average Earnings |
| Male | 4,817 (46.6%) | $33,058 |
| Female | 5,531 (53.4%) | $26,202 |
| Total | 10,348 (100.0%) | $29,573 |
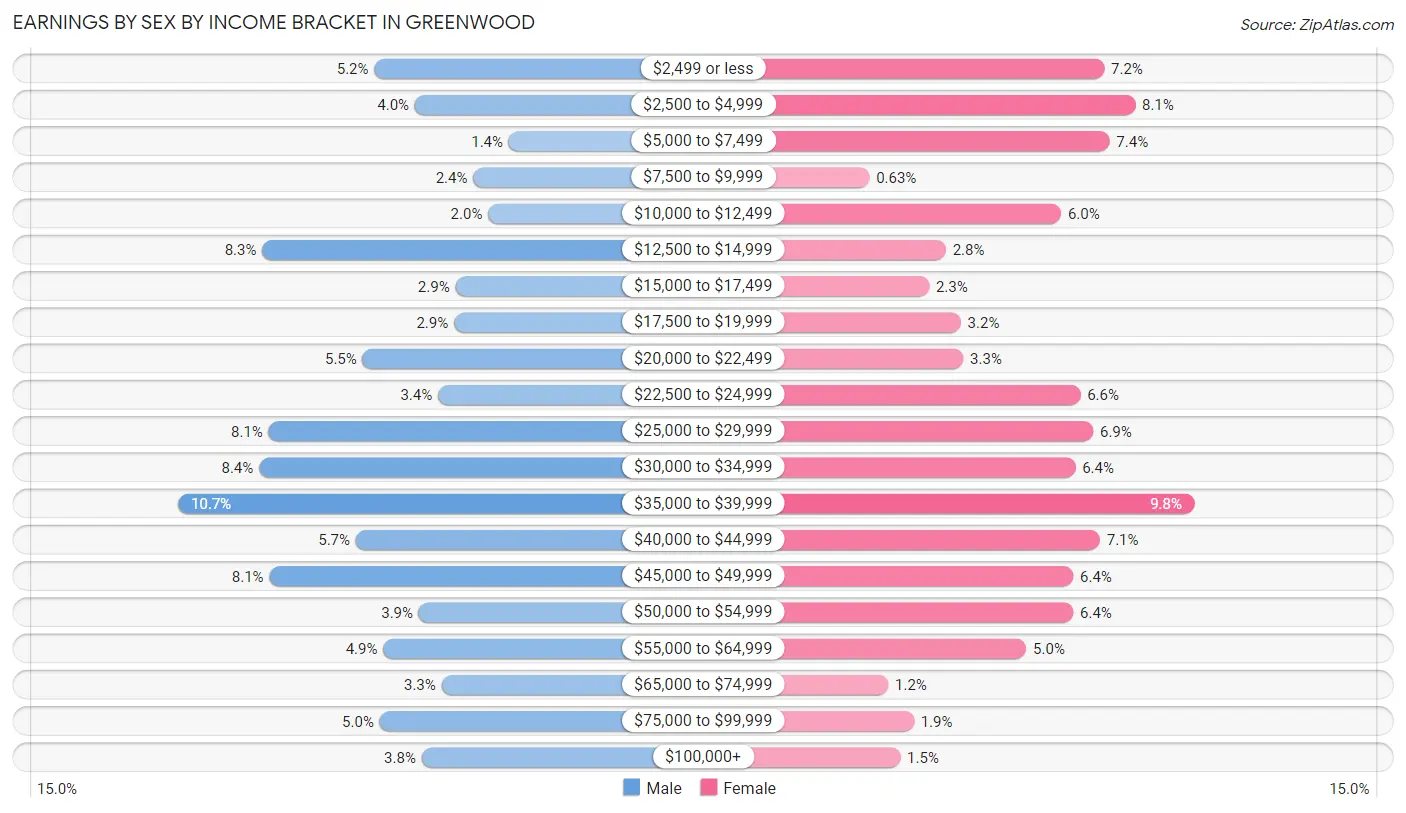
Earnings by Sex by Income Bracket in Greenwood
The most common earnings brackets in Greenwood are $35,000 to $39,999 for men (515 | 10.7%) and $35,000 to $39,999 for women (539 | 9.8%).
| Income | Male | Female |
| $2,499 or less | 249 (5.2%) | 400 (7.2%) |
| $2,500 to $4,999 | 194 (4.0%) | 448 (8.1%) |
| $5,000 to $7,499 | 67 (1.4%) | 408 (7.4%) |
| $7,500 to $9,999 | 115 (2.4%) | 35 (0.6%) |
| $10,000 to $12,499 | 95 (2.0%) | 333 (6.0%) |
| $12,500 to $14,999 | 401 (8.3%) | 154 (2.8%) |
| $15,000 to $17,499 | 139 (2.9%) | 128 (2.3%) |
| $17,500 to $19,999 | 141 (2.9%) | 177 (3.2%) |
| $20,000 to $22,499 | 265 (5.5%) | 181 (3.3%) |
| $22,500 to $24,999 | 163 (3.4%) | 363 (6.6%) |
| $25,000 to $29,999 | 392 (8.1%) | 383 (6.9%) |
| $30,000 to $34,999 | 405 (8.4%) | 355 (6.4%) |
| $35,000 to $39,999 | 515 (10.7%) | 539 (9.8%) |
| $40,000 to $44,999 | 274 (5.7%) | 393 (7.1%) |
| $45,000 to $49,999 | 391 (8.1%) | 352 (6.4%) |
| $50,000 to $54,999 | 189 (3.9%) | 352 (6.4%) |
| $55,000 to $64,999 | 237 (4.9%) | 279 (5.0%) |
| $65,000 to $74,999 | 158 (3.3%) | 64 (1.2%) |
| $75,000 to $99,999 | 242 (5.0%) | 104 (1.9%) |
| $100,000+ | 185 (3.8%) | 83 (1.5%) |
| Total | 4,817 (100.0%) | 5,531 (100.0%) |
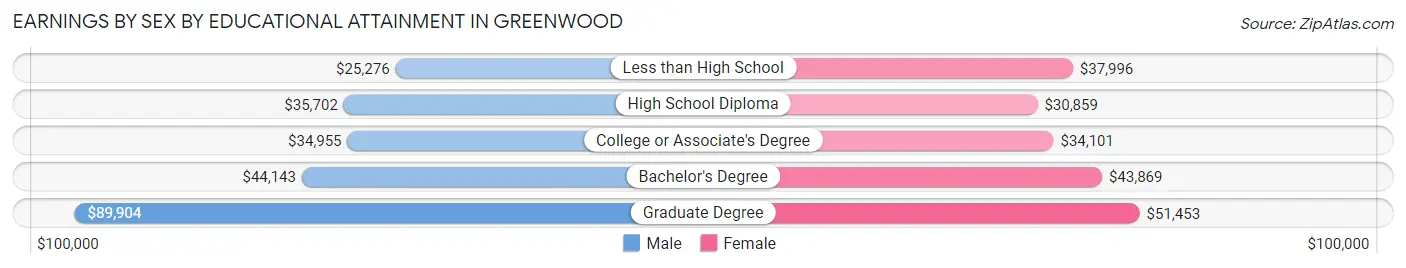
Earnings by Sex by Educational Attainment in Greenwood
Average earnings in Greenwood are $35,969 for men and $37,267 for women, a difference of 3.5%. Men with an educational attainment of graduate degree enjoy the highest average annual earnings of $89,904, while those with less than high school education earn the least with $25,276. Women with an educational attainment of graduate degree earn the most with the average annual earnings of $51,453, while those with high school diploma education have the smallest earnings of $30,859.
| Educational Attainment | Male Income | Female Income |
| Less than High School | $25,276 | $37,996 |
| High School Diploma | $35,702 | $30,859 |
| College or Associate's Degree | $34,955 | $34,101 |
| Bachelor's Degree | $44,143 | $43,869 |
| Graduate Degree | $89,904 | $51,453 |
| Total | $35,969 | $37,267 |
Family Income in Greenwood
Family Income Brackets in Greenwood
According to the Greenwood family income data, there are 1,072 families falling into the $35,000 to $49,999 income range, which is the most common income bracket and makes up 25.3% of all families. Conversely, the $200,000+ income bracket is the least frequent group with only 89 families (2.1%) belonging to this category.
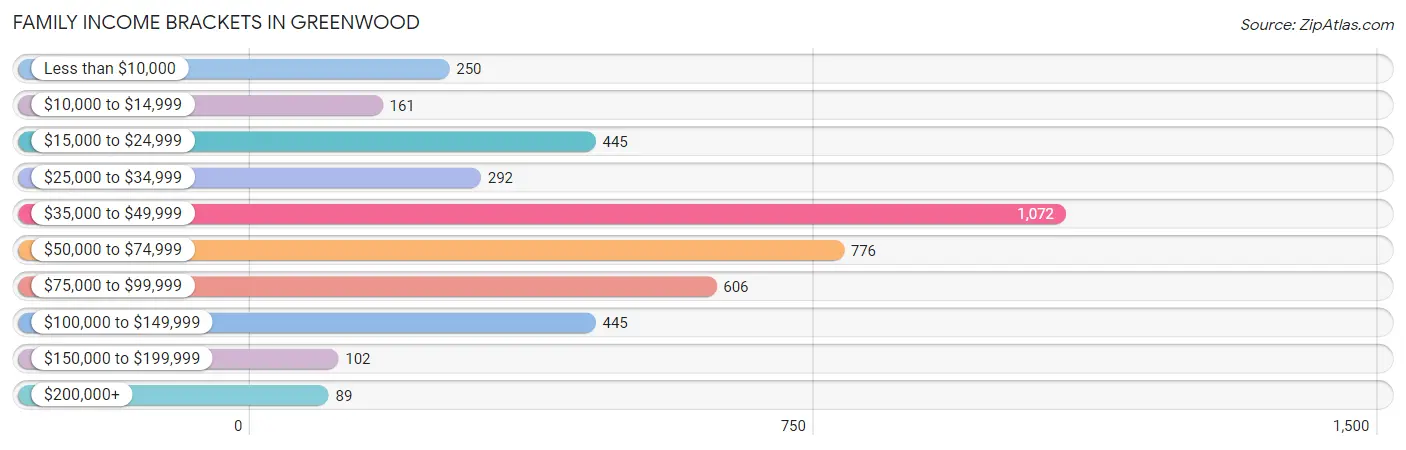
| Income Bracket | # Families | % Families |
| Less than $10,000 | 250 | 5.9% |
| $10,000 to $14,999 | 161 | 3.8% |
| $15,000 to $24,999 | 445 | 10.5% |
| $25,000 to $34,999 | 292 | 6.9% |
| $35,000 to $49,999 | 1,072 | 25.3% |
| $50,000 to $74,999 | 776 | 18.3% |
| $75,000 to $99,999 | 606 | 14.3% |
| $100,000 to $149,999 | 445 | 10.5% |
| $150,000 to $199,999 | 102 | 2.4% |
| $200,000+ | 89 | 2.1% |
Family Income by Famaliy Size in Greenwood
3-person families (1,361 | 32.1%) account for the highest median family income in Greenwood with $53,697 per family, while 2-person families (1,844 | 43.5%) have the highest median income of $22,922 per family member.
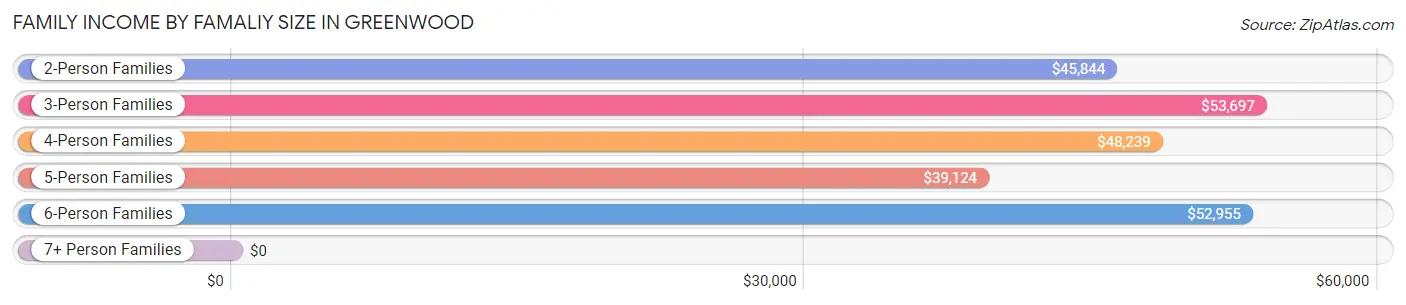
| Income Bracket | # Families | Median Income |
| 2-Person Families | 1,844 (43.5%) | $45,844 |
| 3-Person Families | 1,361 (32.1%) | $53,697 |
| 4-Person Families | 327 (7.7%) | $48,239 |
| 5-Person Families | 484 (11.4%) | $39,124 |
| 6-Person Families | 222 (5.2%) | $52,955 |
| 7+ Person Families | 0 (0.0%) | $0 |
| Total | 4,238 (100.0%) | $47,910 |
Family Income by Number of Earners in Greenwood
The median family income in Greenwood is $47,910, with families comprising 3+ earners (210) having the highest median family income of $111,042, while families with no earners (771) have the lowest median family income of $27,894, accounting for 5.0% and 18.2% of families, respectively.
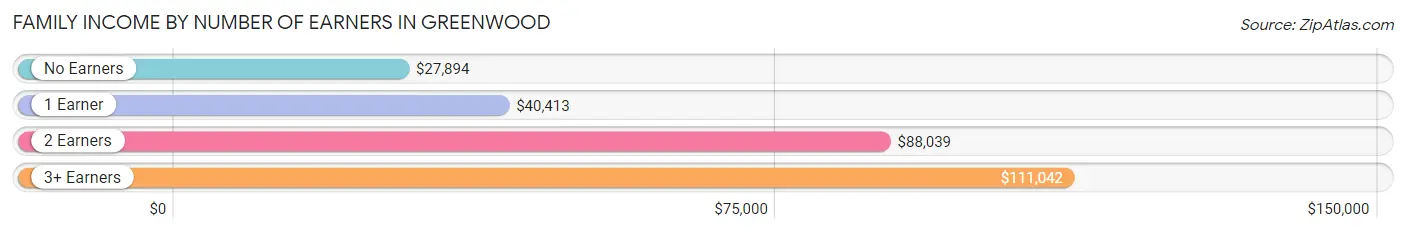
| Number of Earners | # Families | Median Income |
| No Earners | 771 (18.2%) | $27,894 |
| 1 Earner | 2,062 (48.7%) | $40,413 |
| 2 Earners | 1,195 (28.2%) | $88,039 |
| 3+ Earners | 210 (5.0%) | $111,042 |
| Total | 4,238 (100.0%) | $47,910 |
Household Income in Greenwood
Household Income Brackets in Greenwood
With 1,831 households falling in the category, the $35,000 to $49,999 income range is the most frequent in Greenwood, accounting for 21.0% of all households. In contrast, only 122 households (1.4%) fall into the $200,000+ income bracket, making it the least populous group.
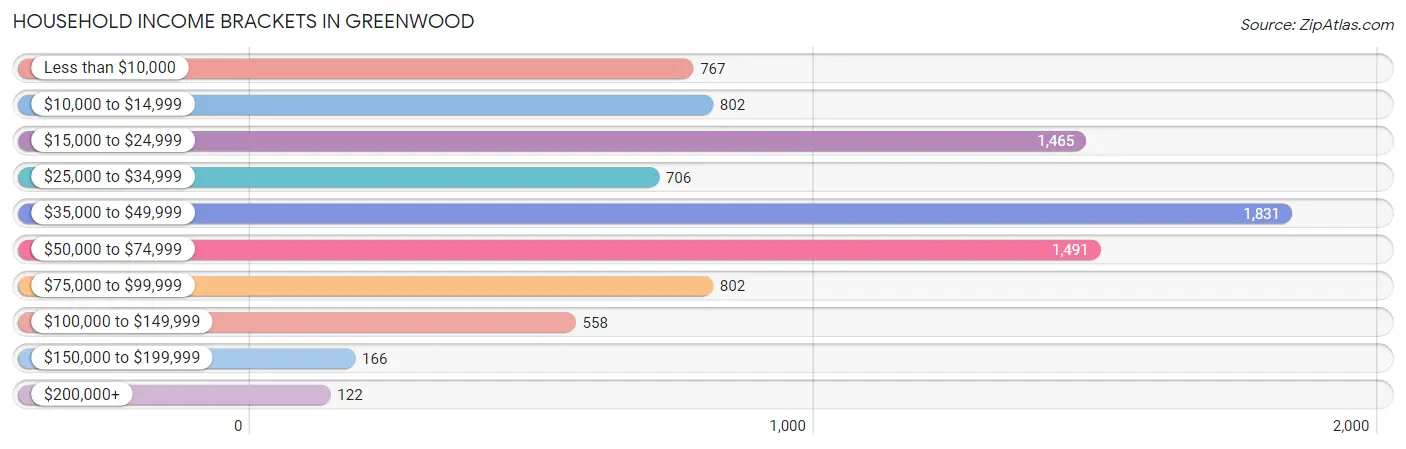
| Income Bracket | # Households | % Households |
| Less than $10,000 | 767 | 8.8% |
| $10,000 to $14,999 | 802 | 9.2% |
| $15,000 to $24,999 | 1,465 | 16.8% |
| $25,000 to $34,999 | 706 | 8.1% |
| $35,000 to $49,999 | 1,831 | 21.0% |
| $50,000 to $74,999 | 1,491 | 17.1% |
| $75,000 to $99,999 | 802 | 9.2% |
| $100,000 to $149,999 | 558 | 6.4% |
| $150,000 to $199,999 | 166 | 1.9% |
| $200,000+ | 122 | 1.4% |
Household Income by Householder Age in Greenwood
The median household income in Greenwood is $38,884, with the highest median household income of $44,875 found in the 45 to 64 years age bracket for the primary householder. A total of 3,081 households (35.3%) fall into this category. Meanwhile, the 65+ years age bracket for the primary householder has the lowest median household income of $24,761, with 2,275 households (26.1%) in this group.
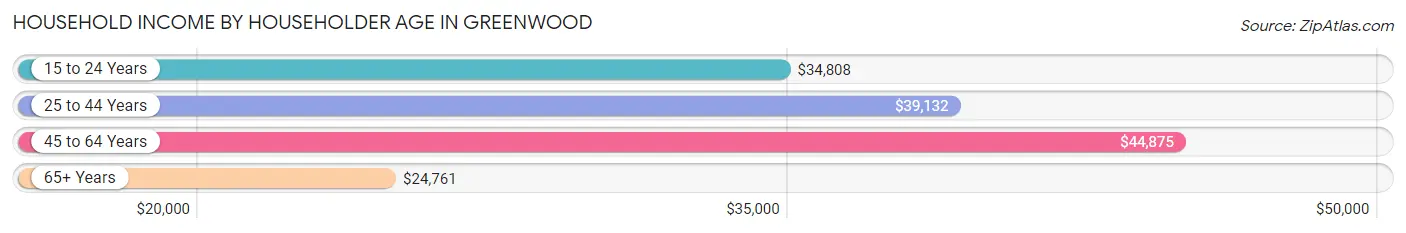
| Income Bracket | # Households | Median Income |
| 15 to 24 Years | 244 (2.8%) | $34,808 |
| 25 to 44 Years | 3,119 (35.8%) | $39,132 |
| 45 to 64 Years | 3,081 (35.3%) | $44,875 |
| 65+ Years | 2,275 (26.1%) | $24,761 |
| Total | 8,719 (100.0%) | $38,884 |
Poverty in Greenwood
Income Below Poverty by Sex and Age in Greenwood
With 25.7% poverty level for males and 23.7% for females among the residents of Greenwood, 6 to 11 year old males and 5 year old females are the most vulnerable to poverty, with 480 males (44.7%) and 118 females (61.8%) in their respective age groups living below the poverty level.
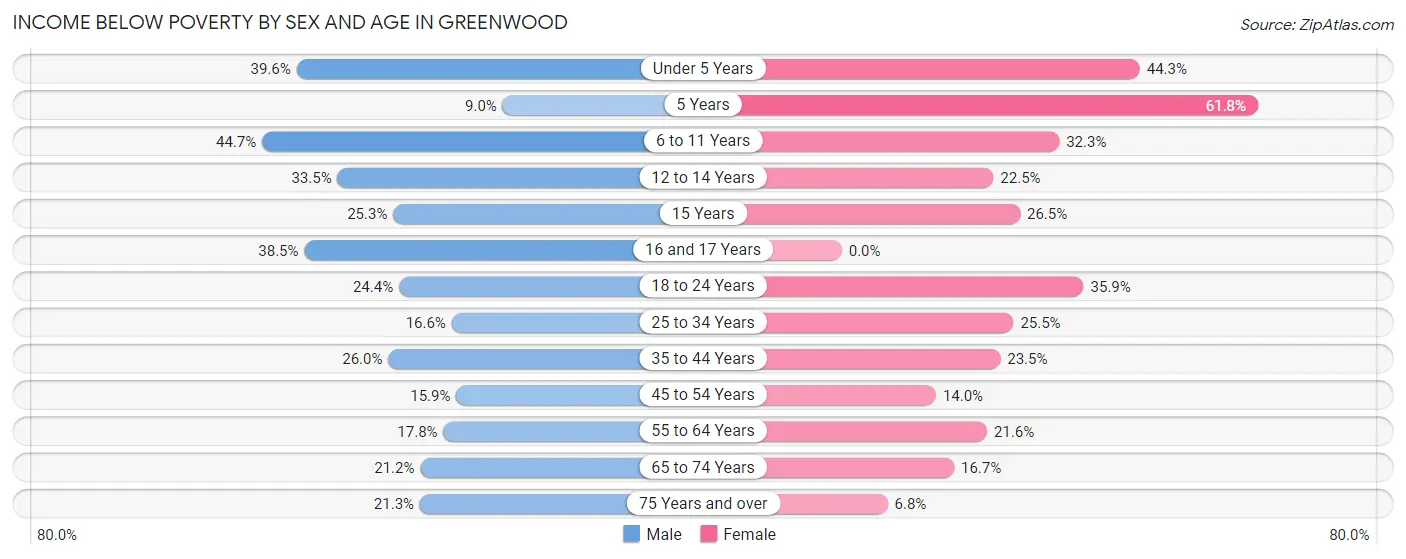
| Age Bracket | Male | Female |
| Under 5 Years | 385 (39.6%) | 273 (44.3%) |
| 5 Years | 20 (9.0%) | 118 (61.8%) |
| 6 to 11 Years | 480 (44.7%) | 278 (32.3%) |
| 12 to 14 Years | 107 (33.5%) | 86 (22.5%) |
| 15 Years | 24 (25.3%) | 36 (26.5%) |
| 16 and 17 Years | 75 (38.5%) | 0 (0.0%) |
| 18 to 24 Years | 290 (24.4%) | 320 (35.9%) |
| 25 to 34 Years | 187 (16.6%) | 376 (25.5%) |
| 35 to 44 Years | 356 (26.0%) | 324 (23.5%) |
| 45 to 54 Years | 141 (15.9%) | 170 (14.0%) |
| 55 to 64 Years | 229 (17.8%) | 265 (21.6%) |
| 65 to 74 Years | 127 (21.2%) | 131 (16.7%) |
| 75 Years and over | 121 (21.3%) | 72 (6.8%) |
| Total | 2,542 (25.7%) | 2,449 (23.7%) |
Income Above Poverty by Sex and Age in Greenwood
According to the poverty statistics in Greenwood, males aged 5 years and females aged 16 and 17 years are the age groups that are most secure financially, with 91.0% of males and 100.0% of females in these age groups living above the poverty line.
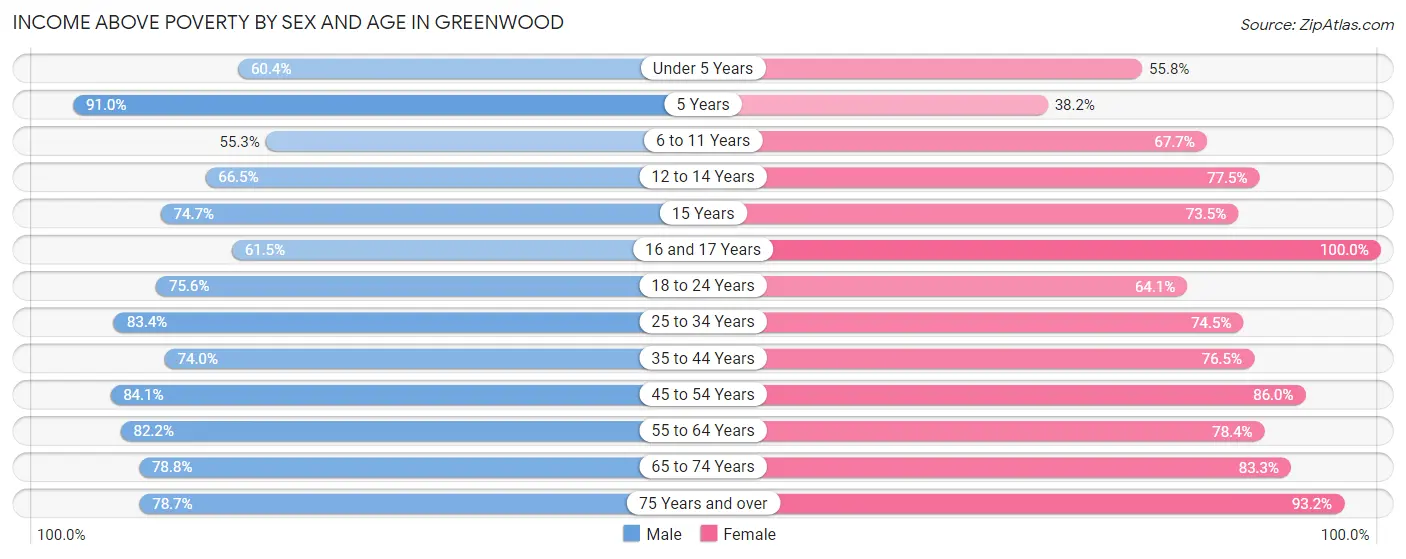
| Age Bracket | Male | Female |
| Under 5 Years | 587 (60.4%) | 344 (55.7%) |
| 5 Years | 202 (91.0%) | 73 (38.2%) |
| 6 to 11 Years | 593 (55.3%) | 583 (67.7%) |
| 12 to 14 Years | 212 (66.5%) | 296 (77.5%) |
| 15 Years | 71 (74.7%) | 100 (73.5%) |
| 16 and 17 Years | 120 (61.5%) | 109 (100.0%) |
| 18 to 24 Years | 898 (75.6%) | 571 (64.1%) |
| 25 to 34 Years | 941 (83.4%) | 1,099 (74.5%) |
| 35 to 44 Years | 1,014 (74.0%) | 1,053 (76.5%) |
| 45 to 54 Years | 746 (84.1%) | 1,046 (86.0%) |
| 55 to 64 Years | 1,057 (82.2%) | 964 (78.4%) |
| 65 to 74 Years | 471 (78.8%) | 655 (83.3%) |
| 75 Years and over | 447 (78.7%) | 987 (93.2%) |
| Total | 7,359 (74.3%) | 7,880 (76.3%) |
Income Below Poverty Among Married-Couple Families in Greenwood
The poverty statistics for married-couple families in Greenwood show that 5.7% or 121 of the total 2,140 families live below the poverty line. Families with 3 or 4 children have the highest poverty rate of 40.8%, comprising of 67 families. On the other hand, families with no children have the lowest poverty rate of 1.3%, which includes 18 families.
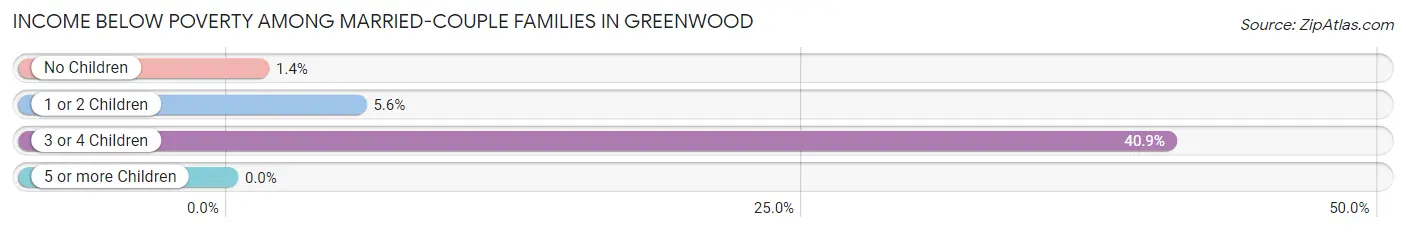
| Children | Above Poverty | Below Poverty |
| No Children | 1,314 (98.7%) | 18 (1.3%) |
| 1 or 2 Children | 608 (94.4%) | 36 (5.6%) |
| 3 or 4 Children | 97 (59.2%) | 67 (40.8%) |
| 5 or more Children | 0 (0.0%) | 0 (0.0%) |
| Total | 2,019 (94.4%) | 121 (5.7%) |
Income Below Poverty Among Single-Parent Households in Greenwood
According to the poverty data in Greenwood, 7.6% or 38 single-father households and 37.1% or 593 single-mother households are living below the poverty line. Among single-father households, those with 1 or 2 children have the highest poverty rate, with 38 households (21.6%) experiencing poverty. Likewise, among single-mother households, those with 5 or more children have the highest poverty rate, with 76 households (100.0%) falling below the poverty line.
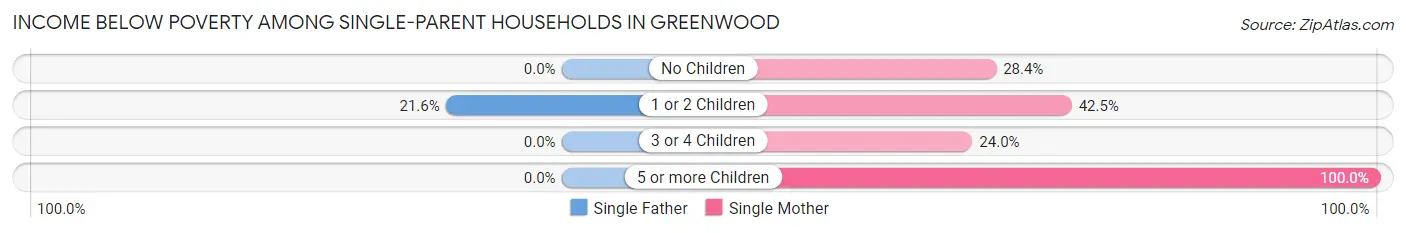
| Children | Single Father | Single Mother |
| No Children | 0 (0.0%) | 98 (28.4%) |
| 1 or 2 Children | 38 (21.6%) | 313 (42.5%) |
| 3 or 4 Children | 0 (0.0%) | 106 (24.0%) |
| 5 or more Children | 0 (0.0%) | 76 (100.0%) |
| Total | 38 (7.6%) | 593 (37.1%) |
Income Below Poverty Among Married-Couple vs Single-Parent Households in Greenwood
The poverty data for Greenwood shows that 121 of the married-couple family households (5.7%) and 631 of the single-parent households (30.1%) are living below the poverty level. Within the married-couple family households, those with 3 or 4 children have the highest poverty rate, with 67 households (40.8%) falling below the poverty line. Among the single-parent households, those with 5 or more children have the highest poverty rate, with 76 household (100.0%) living below poverty.
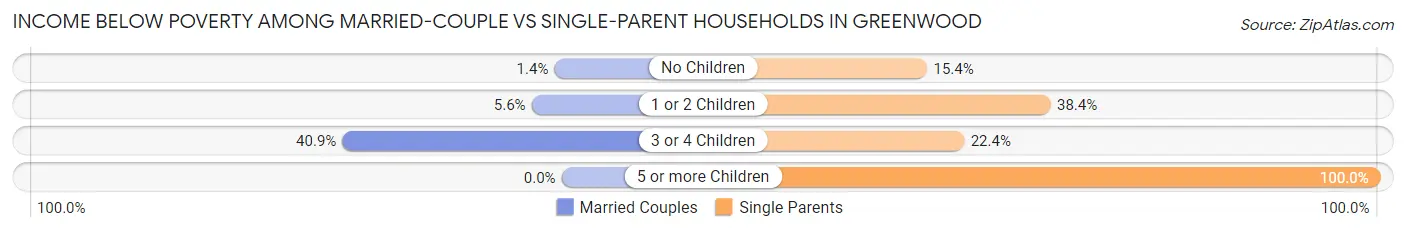
| Children | Married-Couple Families | Single-Parent Households |
| No Children | 18 (1.3%) | 98 (15.4%) |
| 1 or 2 Children | 36 (5.6%) | 351 (38.4%) |
| 3 or 4 Children | 67 (40.8%) | 106 (22.4%) |
| 5 or more Children | 0 (0.0%) | 76 (100.0%) |
| Total | 121 (5.7%) | 631 (30.1%) |
Race in Greenwood
The most populous races in Greenwood are Black / African American (10,838 | 48.1%), White / Caucasian (10,017 | 44.5%), and Hispanic or Latino (2,192 | 9.7%).
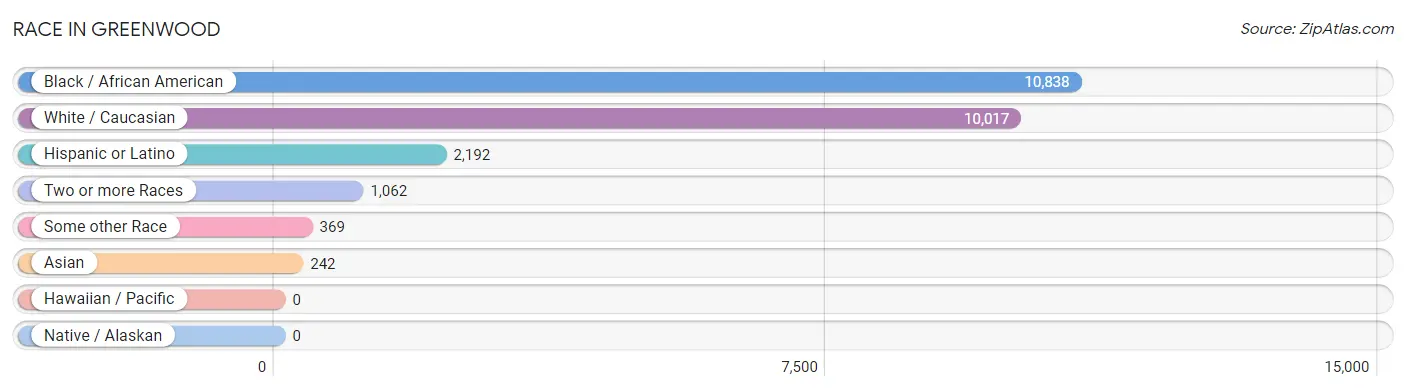
| Race | # Population | % Population |
| Asian | 242 | 1.1% |
| Black / African American | 10,838 | 48.1% |
| Hawaiian / Pacific | 0 | 0.0% |
| Hispanic or Latino | 2,192 | 9.7% |
| Native / Alaskan | 0 | 0.0% |
| White / Caucasian | 10,017 | 44.5% |
| Two or more Races | 1,062 | 4.7% |
| Some other Race | 369 | 1.6% |
| Total | 22,528 | 100.0% |
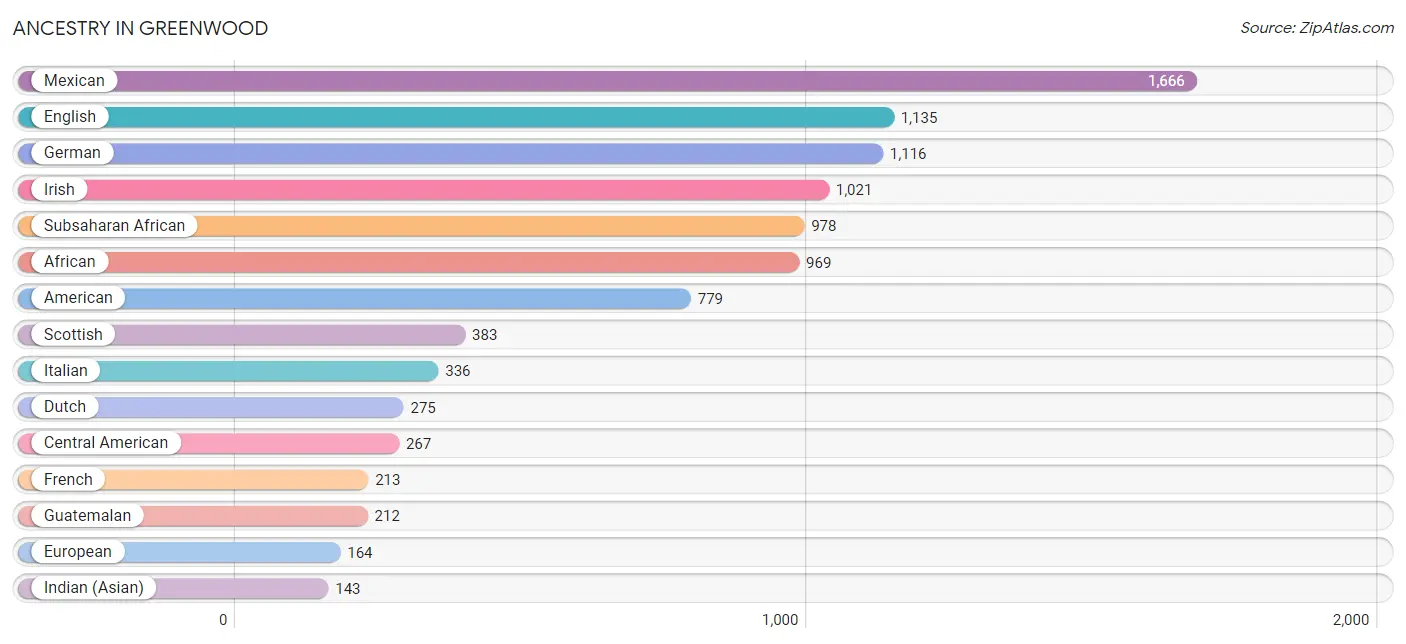
Ancestry in Greenwood
The most populous ancestries reported in Greenwood are Mexican (1,666 | 7.4%), English (1,135 | 5.0%), German (1,116 | 5.0%), Irish (1,021 | 4.5%), and Subsaharan African (978 | 4.3%), together accounting for 26.3% of all Greenwood residents.
| Ancestry | # Population | % Population |
| African | 969 | 4.3% |
| Alaskan Athabascan | 12 | 0.1% |
| American | 779 | 3.5% |
| Austrian | 20 | 0.1% |
| Brazilian | 14 | 0.1% |
| British | 73 | 0.3% |
| Canadian | 3 | 0.0% |
| Carpatho Rusyn | 10 | 0.0% |
| Central American | 267 | 1.2% |
| Cherokee | 38 | 0.2% |
| Cuban | 17 | 0.1% |
| Czech | 21 | 0.1% |
| Czechoslovakian | 11 | 0.1% |
| Dominican | 30 | 0.1% |
| Dutch | 275 | 1.2% |
| Eastern European | 8 | 0.0% |
| Ecuadorian | 5 | 0.0% |
| English | 1,135 | 5.0% |
| Estonian | 16 | 0.1% |
| European | 164 | 0.7% |
| French | 213 | 0.9% |
| French Canadian | 17 | 0.1% |
| German | 1,116 | 5.0% |
| Greek | 7 | 0.0% |
| Guatemalan | 212 | 0.9% |
| Honduran | 49 | 0.2% |
| Hungarian | 25 | 0.1% |
| Indian (Asian) | 143 | 0.6% |
| Irish | 1,021 | 4.5% |
| Italian | 336 | 1.5% |
| Jamaican | 9 | 0.0% |
| Korean | 97 | 0.4% |
| Mexican | 1,666 | 7.4% |
| Mexican American Indian | 27 | 0.1% |
| Navajo | 105 | 0.5% |
| Northern European | 8 | 0.0% |
| Norwegian | 51 | 0.2% |
| Polish | 54 | 0.2% |
| Puerto Rican | 135 | 0.6% |
| Romanian | 9 | 0.0% |
| Salvadoran | 6 | 0.0% |
| Scandinavian | 9 | 0.0% |
| Scotch-Irish | 122 | 0.5% |
| Scottish | 383 | 1.7% |
| Sierra Leonean | 10 | 0.0% |
| Sioux | 10 | 0.0% |
| South American | 17 | 0.1% |
| Subsaharan African | 978 | 4.3% |
| Swedish | 52 | 0.2% |
| Swiss | 7 | 0.0% |
| Thai | 46 | 0.2% |
| Ukrainian | 13 | 0.1% |
| Uruguayan | 12 | 0.1% |
| Welsh | 126 | 0.6% |
| West Indian | 9 | 0.0% |
| Zimbabwean | 9 | 0.0% | View All 56 Rows |
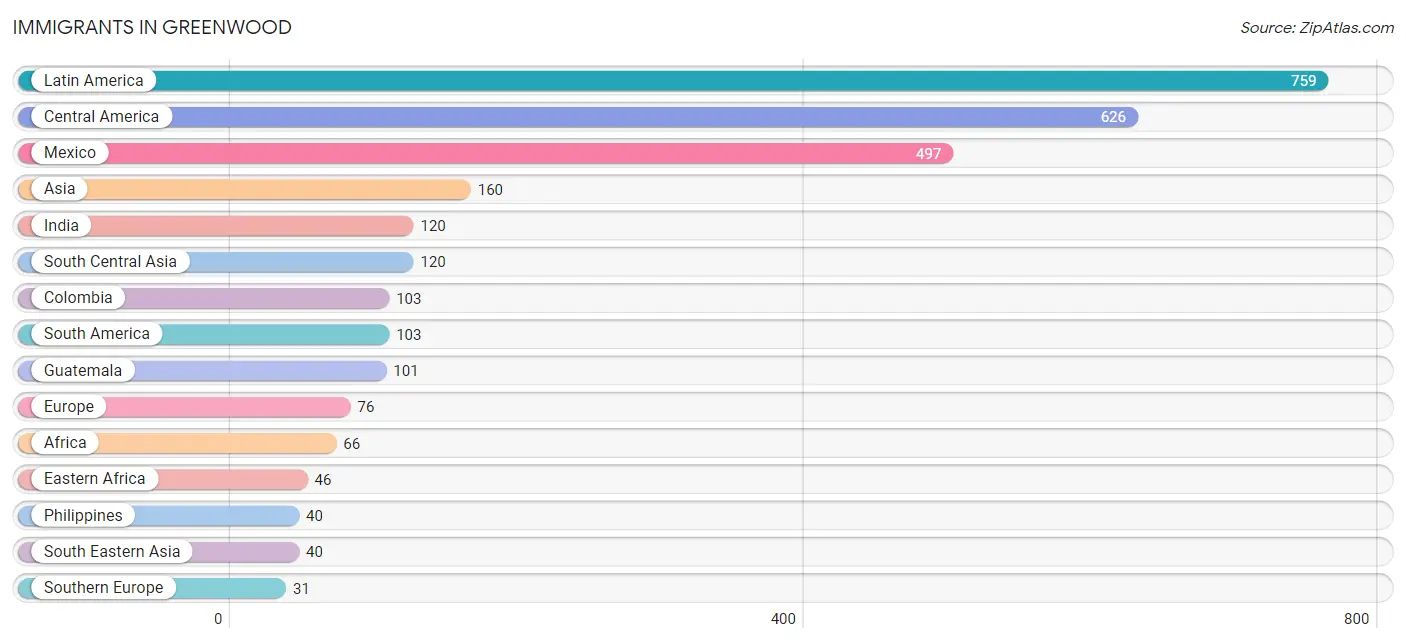
Immigrants in Greenwood
The most numerous immigrant groups reported in Greenwood came from Latin America (759 | 3.4%), Central America (626 | 2.8%), Mexico (497 | 2.2%), Asia (160 | 0.7%), and India (120 | 0.5%), together accounting for 9.6% of all Greenwood residents.
| Immigration Origin | # Population | % Population |
| Africa | 66 | 0.3% |
| Asia | 160 | 0.7% |
| Caribbean | 30 | 0.1% |
| Central America | 626 | 2.8% |
| Colombia | 103 | 0.5% |
| Dominican Republic | 30 | 0.1% |
| Eastern Africa | 46 | 0.2% |
| Eastern Europe | 16 | 0.1% |
| England | 7 | 0.0% |
| Europe | 76 | 0.3% |
| Germany | 5 | 0.0% |
| Guatemala | 101 | 0.4% |
| Honduras | 28 | 0.1% |
| India | 120 | 0.5% |
| Kenya | 6 | 0.0% |
| Latin America | 759 | 3.4% |
| Liberia | 10 | 0.0% |
| Mexico | 497 | 2.2% |
| Northern Europe | 24 | 0.1% |
| Philippines | 40 | 0.2% |
| South America | 103 | 0.5% |
| South Central Asia | 120 | 0.5% |
| South Eastern Asia | 40 | 0.2% |
| Southern Europe | 31 | 0.1% |
| Spain | 31 | 0.1% |
| Sweden | 17 | 0.1% |
| Western Africa | 10 | 0.0% |
| Western Europe | 5 | 0.0% |
| Zimbabwe | 9 | 0.0% | View All 29 Rows |
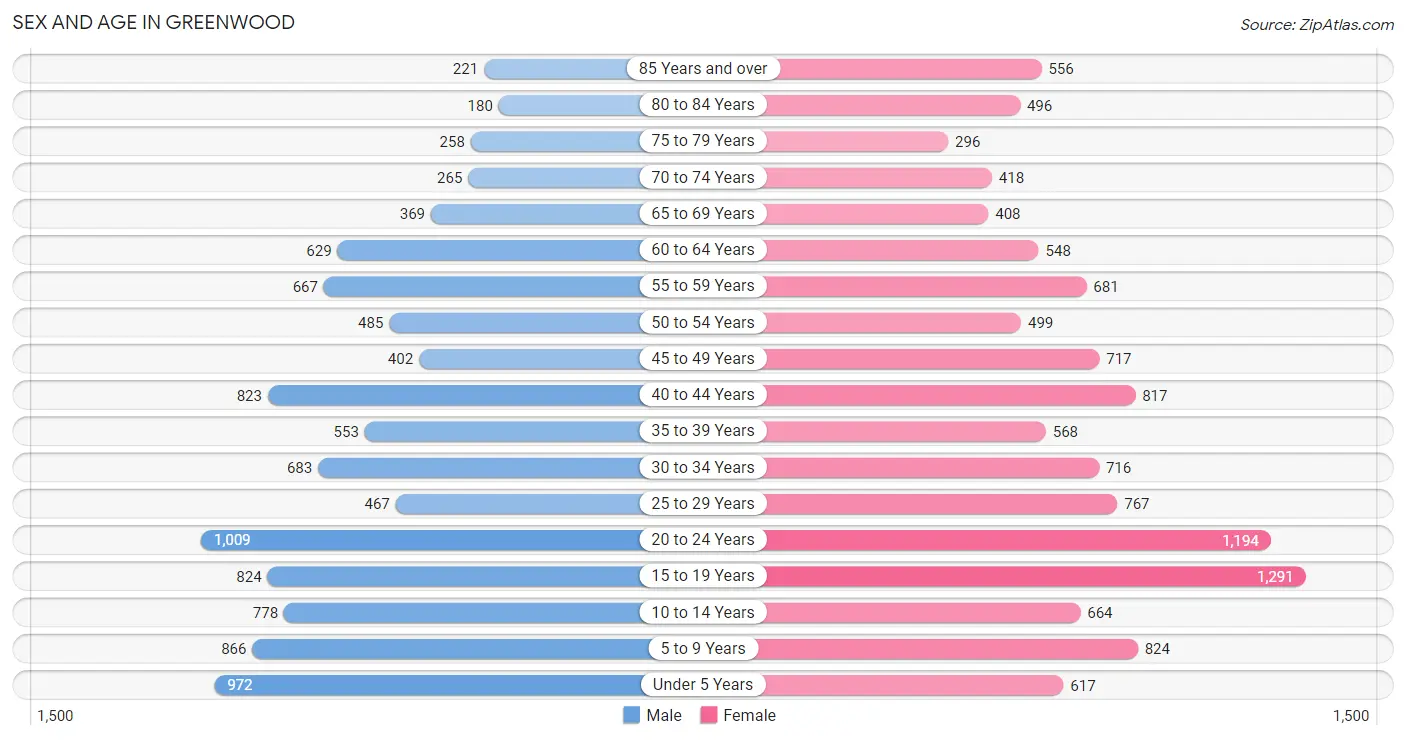
Sex and Age in Greenwood
Sex and Age in Greenwood
The most populous age groups in Greenwood are 20 to 24 Years (1,009 | 9.7%) for men and 15 to 19 Years (1,291 | 10.7%) for women.
| Age Bracket | Male | Female |
| Under 5 Years | 972 (9.3%) | 617 (5.1%) |
| 5 to 9 Years | 866 (8.3%) | 824 (6.8%) |
| 10 to 14 Years | 778 (7.4%) | 664 (5.5%) |
| 15 to 19 Years | 824 (7.9%) | 1,291 (10.7%) |
| 20 to 24 Years | 1,009 (9.7%) | 1,194 (9.9%) |
| 25 to 29 Years | 467 (4.5%) | 767 (6.4%) |
| 30 to 34 Years | 683 (6.5%) | 716 (5.9%) |
| 35 to 39 Years | 553 (5.3%) | 568 (4.7%) |
| 40 to 44 Years | 823 (7.9%) | 817 (6.8%) |
| 45 to 49 Years | 402 (3.8%) | 717 (5.9%) |
| 50 to 54 Years | 485 (4.6%) | 499 (4.1%) |
| 55 to 59 Years | 667 (6.4%) | 681 (5.6%) |
| 60 to 64 Years | 629 (6.0%) | 548 (4.5%) |
| 65 to 69 Years | 369 (3.5%) | 408 (3.4%) |
| 70 to 74 Years | 265 (2.5%) | 418 (3.5%) |
| 75 to 79 Years | 258 (2.5%) | 296 (2.5%) |
| 80 to 84 Years | 180 (1.7%) | 496 (4.1%) |
| 85 Years and over | 221 (2.1%) | 556 (4.6%) |
| Total | 10,451 (100.0%) | 12,077 (100.0%) |
Families and Households in Greenwood
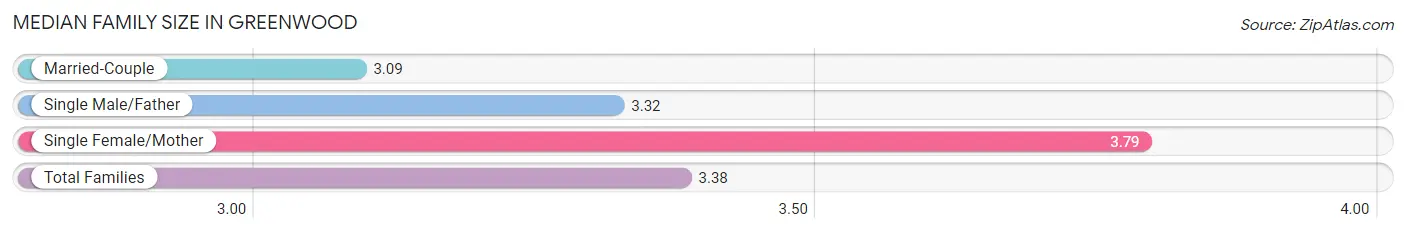
Median Family Size in Greenwood
The median family size in Greenwood is 3.38 persons per family, with single female/mother families (1,600 | 37.8%) accounting for the largest median family size of 3.79 persons per family. On the other hand, married-couple families (2,140 | 50.5%) represent the smallest median family size with 3.09 persons per family.
| Family Type | # Families | Family Size |
| Married-Couple | 2,140 (50.5%) | 3.09 |
| Single Male/Father | 498 (11.7%) | 3.32 |
| Single Female/Mother | 1,600 (37.8%) | 3.79 |
| Total Families | 4,238 (100.0%) | 3.38 |
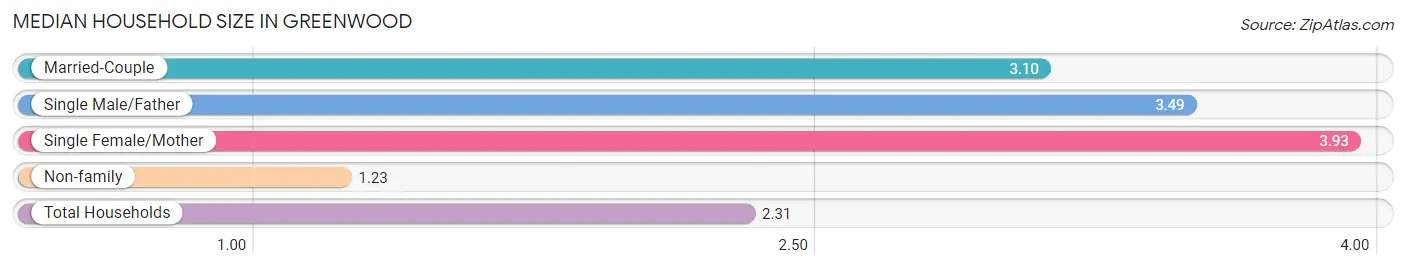
Median Household Size in Greenwood
The median household size in Greenwood is 2.31 persons per household, with single female/mother households (1,600 | 18.3%) accounting for the largest median household size of 3.93 persons per household. non-family households (4,481 | 51.4%) represent the smallest median household size with 1.23 persons per household.
| Household Type | # Households | Household Size |
| Married-Couple | 2,140 (24.5%) | 3.10 |
| Single Male/Father | 498 (5.7%) | 3.49 |
| Single Female/Mother | 1,600 (18.3%) | 3.93 |
| Non-family | 4,481 (51.4%) | 1.23 |
| Total Households | 8,719 (100.0%) | 2.31 |
Household Size by Marriage Status in Greenwood
Out of a total of 8,719 households in Greenwood, 4,238 (48.6%) are family households, while 4,481 (51.4%) are nonfamily households. The most numerous type of family households are 2-person households, comprising 1,756, and the most common type of nonfamily households are 1-person households, comprising 3,863.
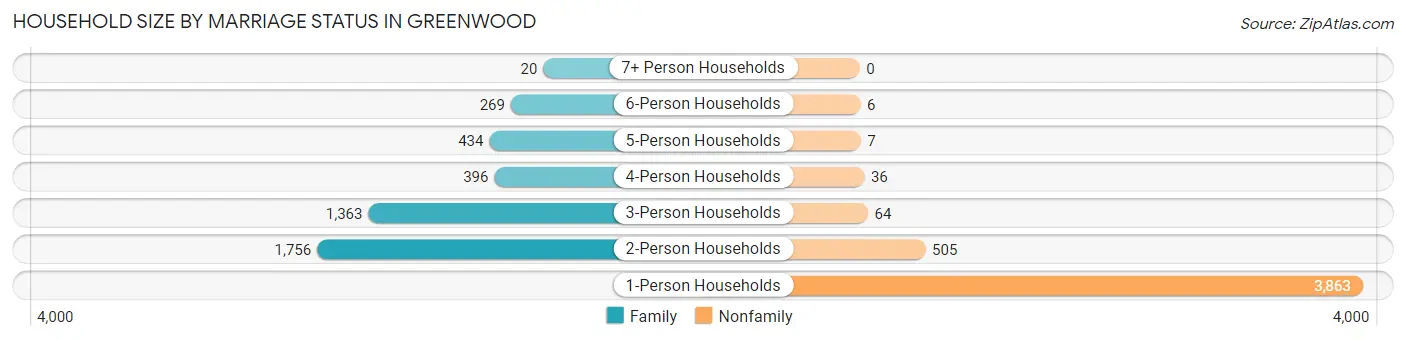
| Household Size | Family Households | Nonfamily Households |
| 1-Person Households | - | 3,863 (44.3%) |
| 2-Person Households | 1,756 (20.1%) | 505 (5.8%) |
| 3-Person Households | 1,363 (15.6%) | 64 (0.7%) |
| 4-Person Households | 396 (4.5%) | 36 (0.4%) |
| 5-Person Households | 434 (5.0%) | 7 (0.1%) |
| 6-Person Households | 269 (3.1%) | 6 (0.1%) |
| 7+ Person Households | 20 (0.2%) | 0 (0.0%) |
| Total | 4,238 (48.6%) | 4,481 (51.4%) |
Female Fertility in Greenwood
Fertility by Age in Greenwood
Average fertility rate in Greenwood is 37.0 births per 1,000 women. Women in the age bracket of 20 to 34 years have the highest fertility rate with 68.0 births per 1,000 women. Women in the age bracket of 20 to 34 years acount for 79.1% of all women with births.
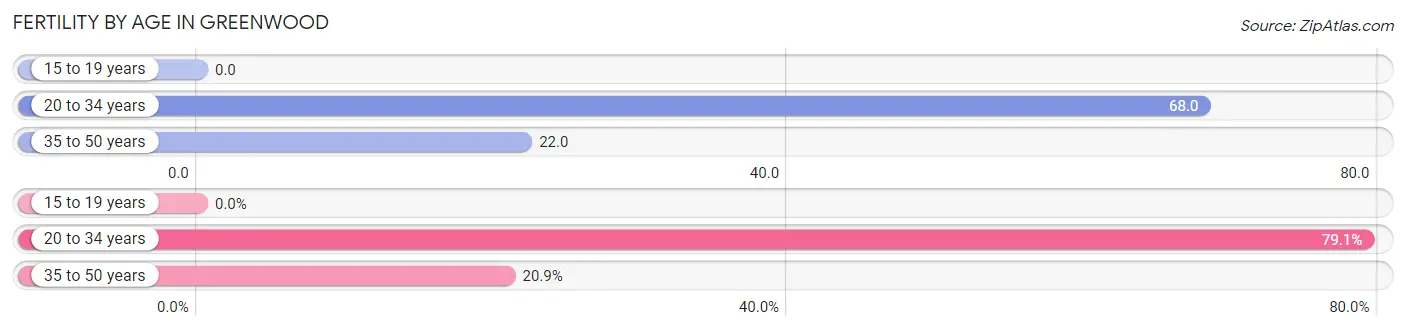
| Age Bracket | Women with Births | Births / 1,000 Women |
| 15 to 19 years | 0 (0.0%) | 0.0 |
| 20 to 34 years | 182 (79.1%) | 68.0 |
| 35 to 50 years | 48 (20.9%) | 22.0 |
| Total | 230 (100.0%) | 37.0 |
Fertility by Age by Marriage Status in Greenwood
35.7% of women with births (230) in Greenwood are married. The highest percentage of unmarried women with births falls into 20 to 34 years age bracket with 68.7% of them unmarried at the time of birth, while the lowest percentage of unmarried women with births belong to 35 to 50 years age bracket with 47.9% of them unmarried.
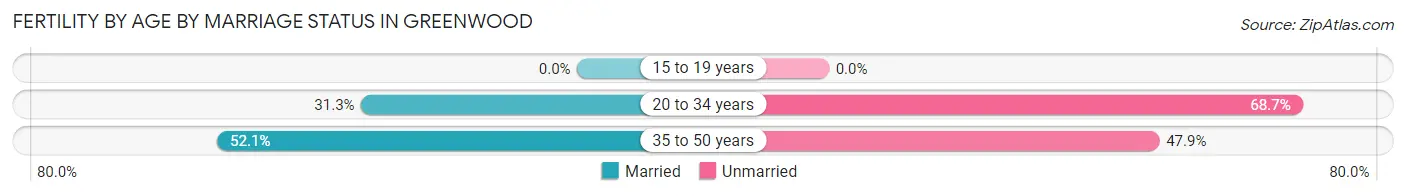
| Age Bracket | Married | Unmarried |
| 15 to 19 years | 0 (0.0%) | 0 (0.0%) |
| 20 to 34 years | 57 (31.3%) | 125 (68.7%) |
| 35 to 50 years | 25 (52.1%) | 23 (47.9%) |
| Total | 82 (35.6%) | 148 (64.3%) |
Fertility by Education in Greenwood
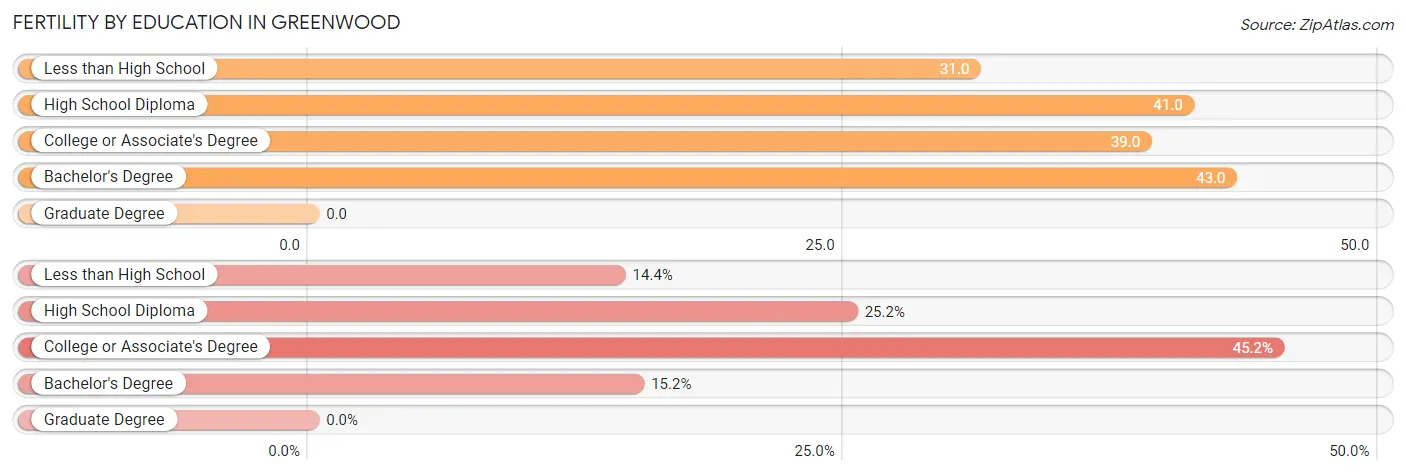
| Educational Attainment | Women with Births | Births / 1,000 Women |
| Less than High School | 33 (14.3%) | 31.0 |
| High School Diploma | 58 (25.2%) | 41.0 |
| College or Associate's Degree | 104 (45.2%) | 39.0 |
| Bachelor's Degree | 35 (15.2%) | 43.0 |
| Graduate Degree | 0 (0.0%) | 0.0 |
| Total | 230 (100.0%) | 37.0 |
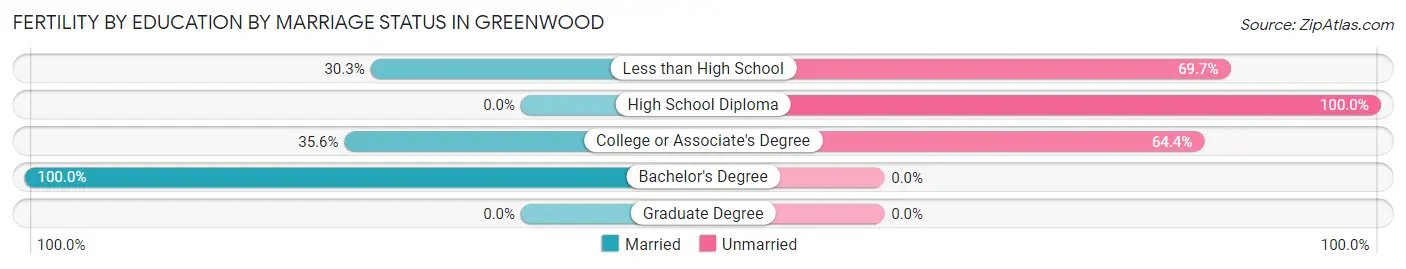
Fertility by Education by Marriage Status in Greenwood
64.3% of women with births in Greenwood are unmarried. Women with the educational attainment of bachelor's degree are most likely to be married with 100.0% of them married at childbirth, while women with the educational attainment of high school diploma are least likely to be married with 100.0% of them unmarried at childbirth.
| Educational Attainment | Married | Unmarried |
| Less than High School | 10 (30.3%) | 23 (69.7%) |
| High School Diploma | 0 (0.0%) | 58 (100.0%) |
| College or Associate's Degree | 37 (35.6%) | 67 (64.4%) |
| Bachelor's Degree | 35 (100.0%) | 0 (0.0%) |
| Graduate Degree | 0 (0.0%) | 0 (0.0%) |
| Total | 82 (35.6%) | 148 (64.3%) |
Employment Characteristics in Greenwood
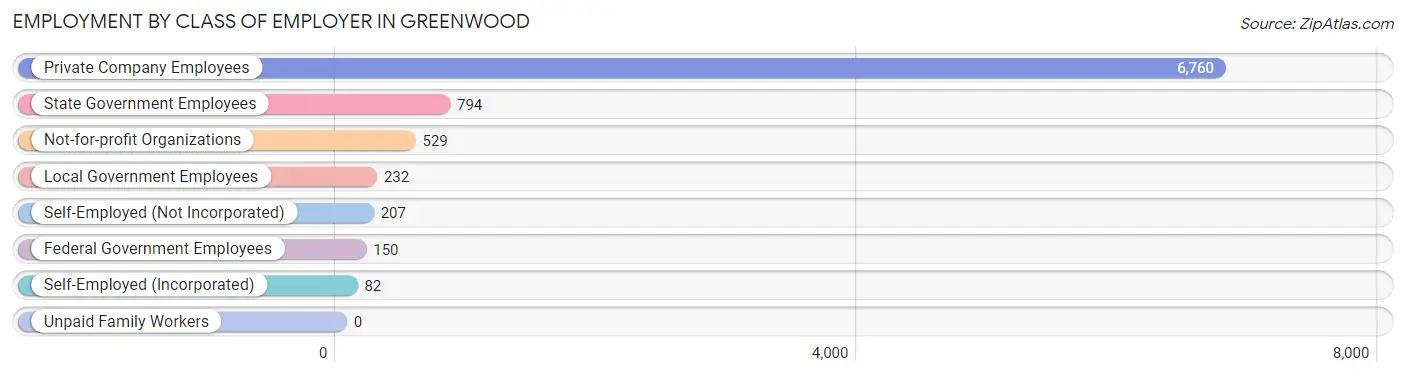
Employment by Class of Employer in Greenwood
Among the 8,754 employed individuals in Greenwood, private company employees (6,760 | 77.2%), state government employees (794 | 9.1%), and not-for-profit organizations (529 | 6.0%) make up the most common classes of employment.
| Employer Class | # Employees | % Employees |
| Private Company Employees | 6,760 | 77.2% |
| Self-Employed (Incorporated) | 82 | 0.9% |
| Self-Employed (Not Incorporated) | 207 | 2.4% |
| Not-for-profit Organizations | 529 | 6.0% |
| Local Government Employees | 232 | 2.6% |
| State Government Employees | 794 | 9.1% |
| Federal Government Employees | 150 | 1.7% |
| Unpaid Family Workers | 0 | 0.0% |
| Total | 8,754 | 100.0% |
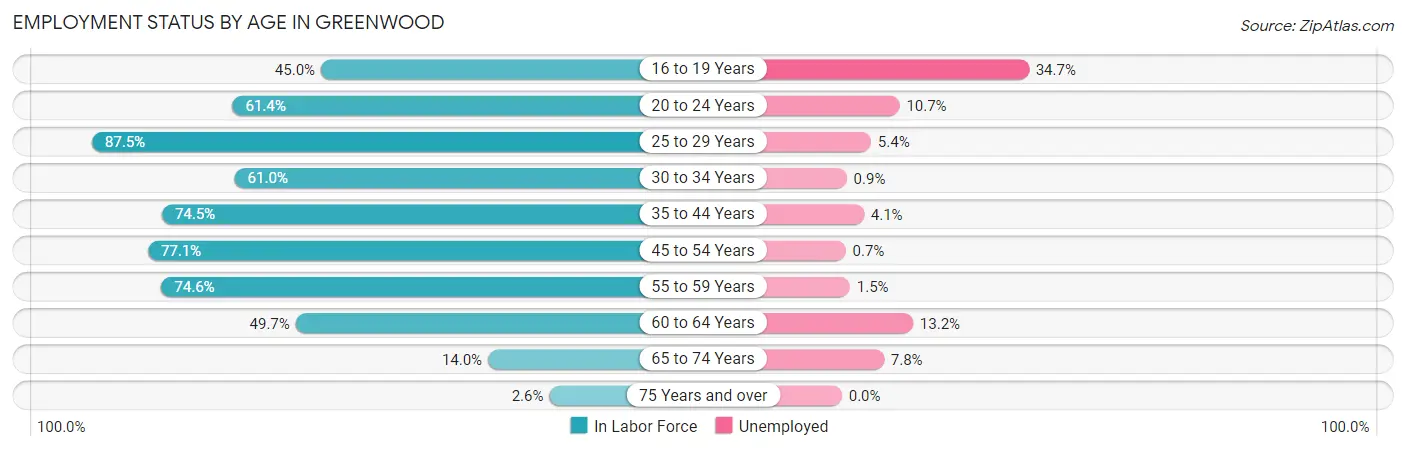
Employment Status by Age in Greenwood
According to the labor force statistics for Greenwood, out of the total population over 16 years of age (17,546), 55.0% or 9,650 individuals are in the labor force, with 7.3% or 704 of them unemployed. The age group with the highest labor force participation rate is 25 to 29 years, with 87.5% or 1,080 individuals in the labor force. Within the labor force, the 16 to 19 years age range has the highest percentage of unemployed individuals, with 34.7% or 289 of them being unemployed.
| Age Bracket | In Labor Force | Unemployed |
| 16 to 19 Years | 834 (45.0%) | 289 (34.7%) |
| 20 to 24 Years | 1,353 (61.4%) | 145 (10.7%) |
| 25 to 29 Years | 1,080 (87.5%) | 58 (5.4%) |
| 30 to 34 Years | 853 (61.0%) | 8 (0.9%) |
| 35 to 44 Years | 2,057 (74.5%) | 84 (4.1%) |
| 45 to 54 Years | 1,621 (77.1%) | 11 (0.7%) |
| 55 to 59 Years | 1,006 (74.6%) | 15 (1.5%) |
| 60 to 64 Years | 585 (49.7%) | 77 (13.2%) |
| 65 to 74 Years | 204 (14.0%) | 16 (7.8%) |
| 75 Years and over | 52 (2.6%) | 0 (0.0%) |
| Total | 9,650 (55.0%) | 704 (7.3%) |
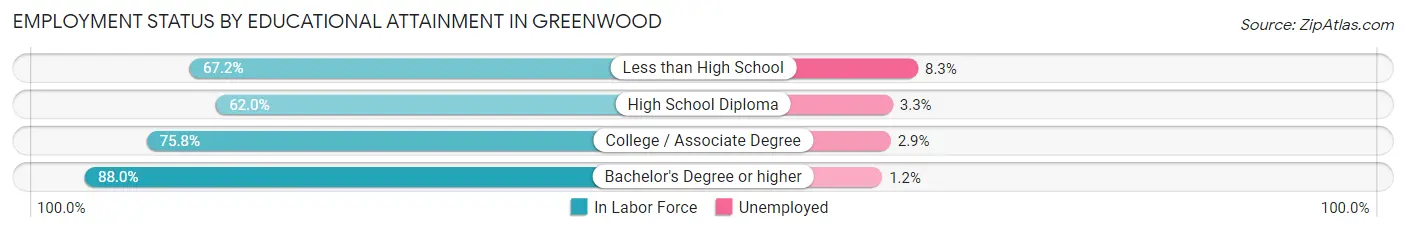
Employment Status by Educational Attainment in Greenwood
According to labor force statistics for Greenwood, 71.9% of individuals (7,206) out of the total population between 25 and 64 years of age (10,022) are in the labor force, with 3.5% or 252 of them being unemployed. The group with the highest labor force participation rate are those with the educational attainment of bachelor's degree or higher, with 88.0% or 1,805 individuals in the labor force. Within the labor force, individuals with less than high school education have the highest percentage of unemployment, with 8.3% or 107 of them being unemployed.
| Educational Attainment | In Labor Force | Unemployed |
| Less than High School | 1,290 (67.2%) | 159 (8.3%) |
| High School Diploma | 2,151 (62.0%) | 115 (3.3%) |
| College / Associate Degree | 1,956 (75.8%) | 75 (2.9%) |
| Bachelor's Degree or higher | 1,805 (88.0%) | 25 (1.2%) |
| Total | 7,206 (71.9%) | 351 (3.5%) |
Employment Occupations by Sex in Greenwood
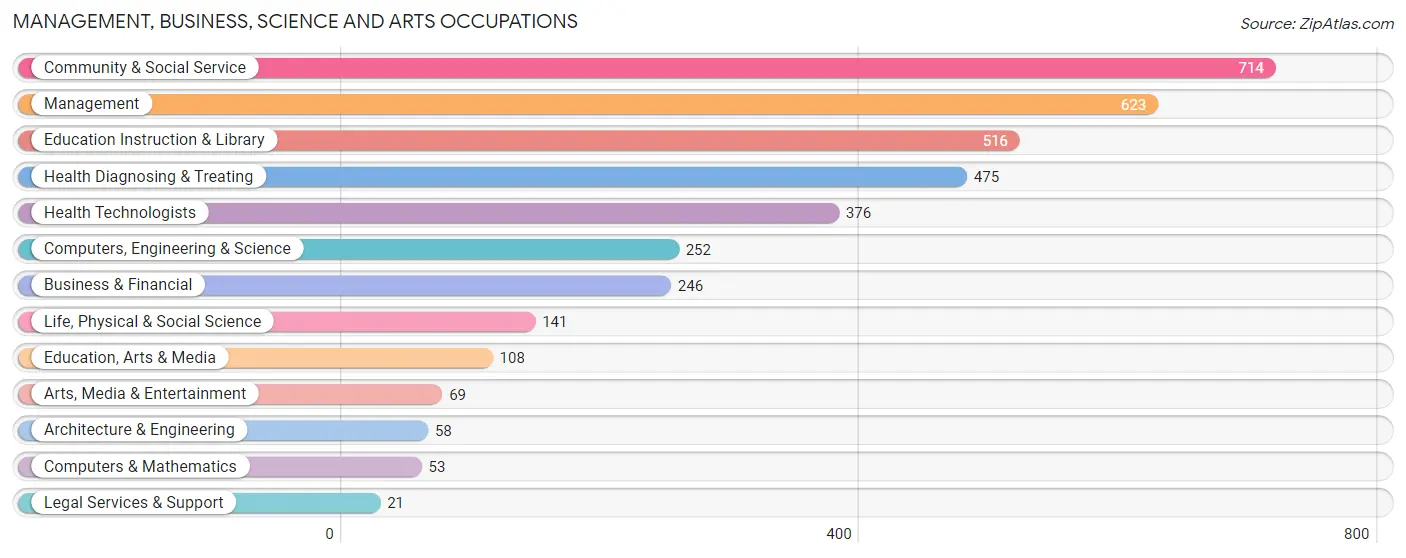
Management, Business, Science and Arts Occupations
The most common Management, Business, Science and Arts occupations in Greenwood are Community & Social Service (714 | 8.0%), Management (623 | 7.0%), Education Instruction & Library (516 | 5.8%), Health Diagnosing & Treating (475 | 5.3%), and Health Technologists (376 | 4.2%).
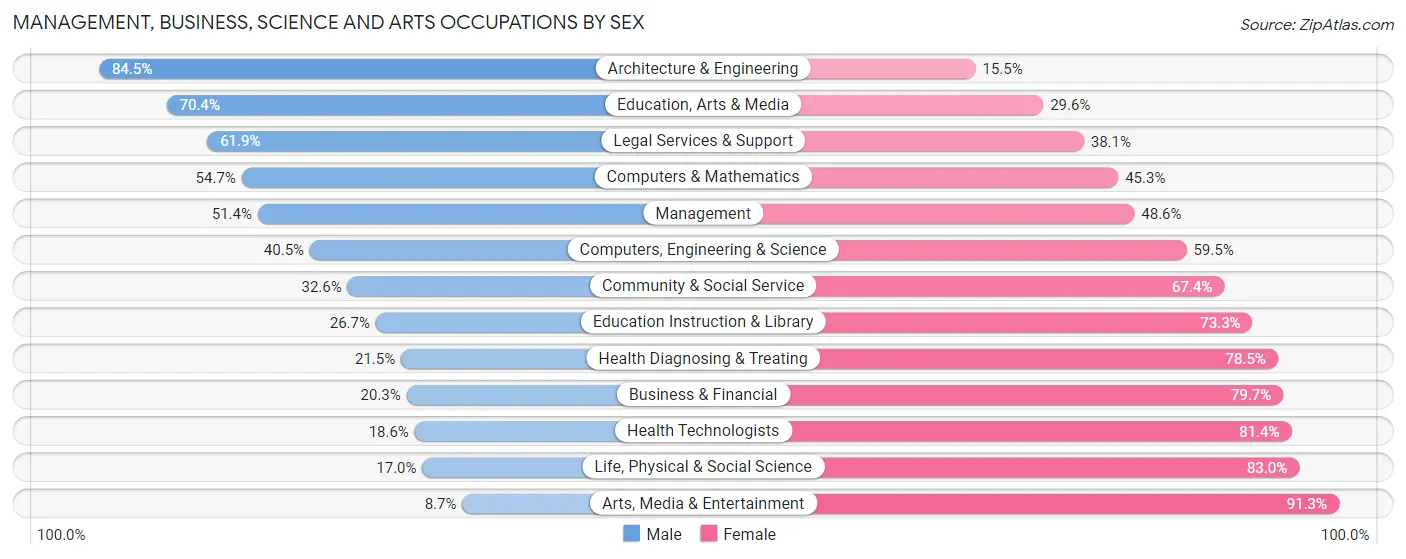
Management, Business, Science and Arts Occupations by Sex
Within the Management, Business, Science and Arts occupations in Greenwood, the most male-oriented occupations are Architecture & Engineering (84.5%), Education, Arts & Media (70.4%), and Legal Services & Support (61.9%), while the most female-oriented occupations are Arts, Media & Entertainment (91.3%), Life, Physical & Social Science (83.0%), and Health Technologists (81.4%).
| Occupation | Male | Female |
| Management | 320 (51.4%) | 303 (48.6%) |
| Business & Financial | 50 (20.3%) | 196 (79.7%) |
| Computers, Engineering & Science | 102 (40.5%) | 150 (59.5%) |
| Computers & Mathematics | 29 (54.7%) | 24 (45.3%) |
| Architecture & Engineering | 49 (84.5%) | 9 (15.5%) |
| Life, Physical & Social Science | 24 (17.0%) | 117 (83.0%) |
| Community & Social Service | 233 (32.6%) | 481 (67.4%) |
| Education, Arts & Media | 76 (70.4%) | 32 (29.6%) |
| Legal Services & Support | 13 (61.9%) | 8 (38.1%) |
| Education Instruction & Library | 138 (26.7%) | 378 (73.3%) |
| Arts, Media & Entertainment | 6 (8.7%) | 63 (91.3%) |
| Health Diagnosing & Treating | 102 (21.5%) | 373 (78.5%) |
| Health Technologists | 70 (18.6%) | 306 (81.4%) |
| Total (Category) | 807 (34.9%) | 1,503 (65.1%) |
| Total (Overall) | 4,250 (47.7%) | 4,666 (52.3%) |
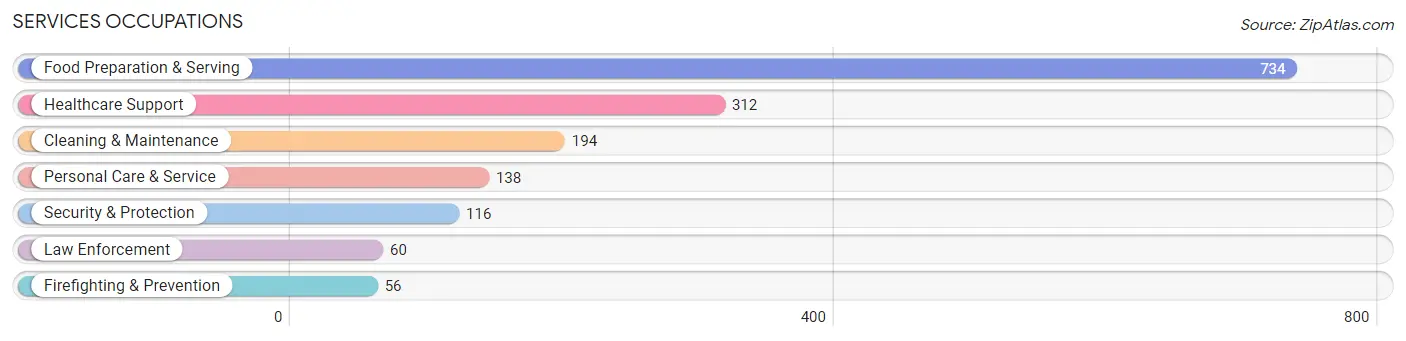
Services Occupations
The most common Services occupations in Greenwood are Food Preparation & Serving (734 | 8.2%), Healthcare Support (312 | 3.5%), Cleaning & Maintenance (194 | 2.2%), Personal Care & Service (138 | 1.5%), and Security & Protection (116 | 1.3%).
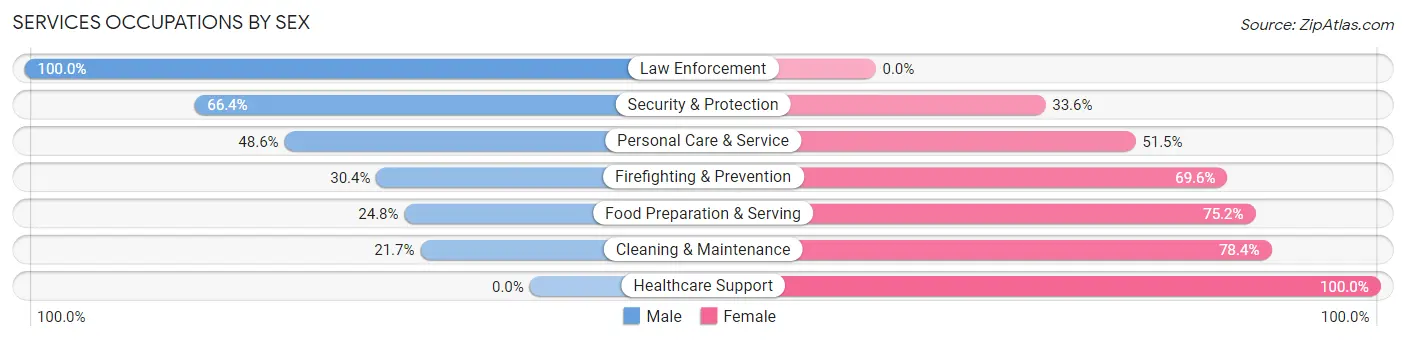
Services Occupations by Sex
Within the Services occupations in Greenwood, the most male-oriented occupations are Law Enforcement (100.0%), Security & Protection (66.4%), and Personal Care & Service (48.5%), while the most female-oriented occupations are Healthcare Support (100.0%), Cleaning & Maintenance (78.3%), and Food Preparation & Serving (75.2%).
| Occupation | Male | Female |
| Healthcare Support | 0 (0.0%) | 312 (100.0%) |
| Security & Protection | 77 (66.4%) | 39 (33.6%) |
| Firefighting & Prevention | 17 (30.4%) | 39 (69.6%) |
| Law Enforcement | 60 (100.0%) | 0 (0.0%) |
| Food Preparation & Serving | 182 (24.8%) | 552 (75.2%) |
| Cleaning & Maintenance | 42 (21.6%) | 152 (78.3%) |
| Personal Care & Service | 67 (48.5%) | 71 (51.4%) |
| Total (Category) | 368 (24.6%) | 1,126 (75.4%) |
| Total (Overall) | 4,250 (47.7%) | 4,666 (52.3%) |
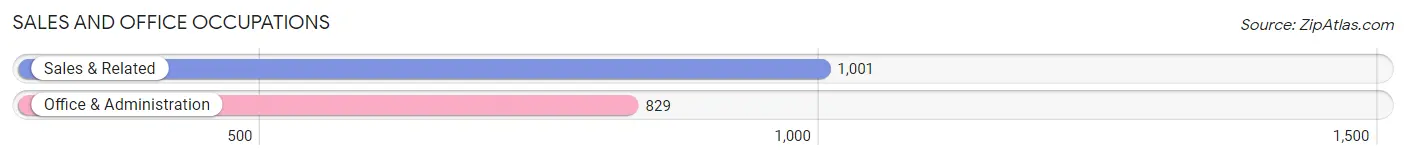
Sales and Office Occupations
The most common Sales and Office occupations in Greenwood are Sales & Related (1,001 | 11.2%), and Office & Administration (829 | 9.3%).
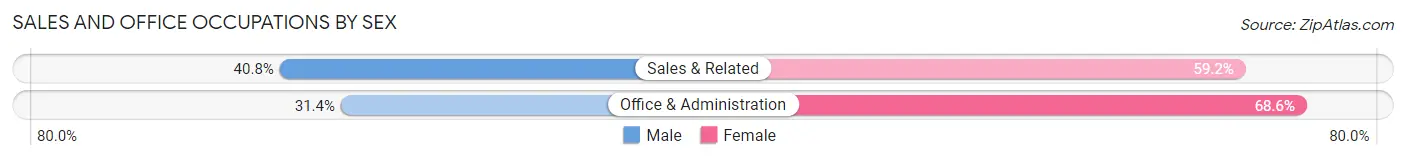
Sales and Office Occupations by Sex
| Occupation | Male | Female |
| Sales & Related | 408 (40.8%) | 593 (59.2%) |
| Office & Administration | 260 (31.4%) | 569 (68.6%) |
| Total (Category) | 668 (36.5%) | 1,162 (63.5%) |
| Total (Overall) | 4,250 (47.7%) | 4,666 (52.3%) |
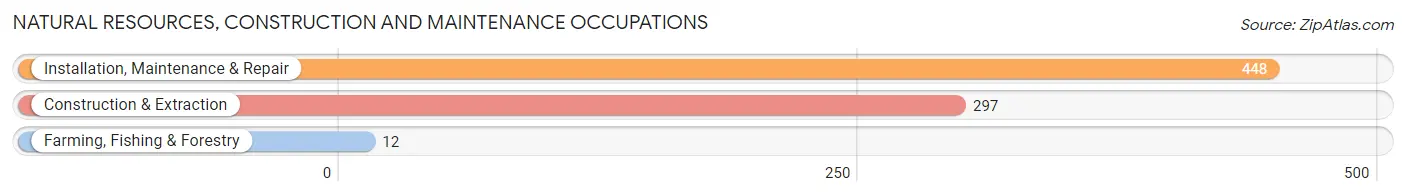
Natural Resources, Construction and Maintenance Occupations
The most common Natural Resources, Construction and Maintenance occupations in Greenwood are Installation, Maintenance & Repair (448 | 5.0%), Construction & Extraction (297 | 3.3%), and Farming, Fishing & Forestry (12 | 0.1%).
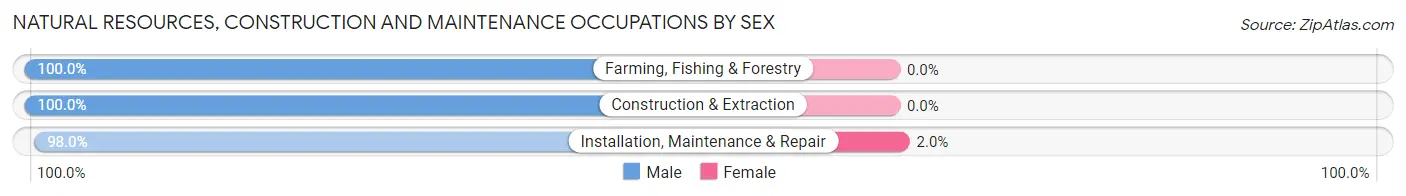
Natural Resources, Construction and Maintenance Occupations by Sex
| Occupation | Male | Female |
| Farming, Fishing & Forestry | 12 (100.0%) | 0 (0.0%) |
| Construction & Extraction | 297 (100.0%) | 0 (0.0%) |
| Installation, Maintenance & Repair | 439 (98.0%) | 9 (2.0%) |
| Total (Category) | 748 (98.8%) | 9 (1.2%) |
| Total (Overall) | 4,250 (47.7%) | 4,666 (52.3%) |
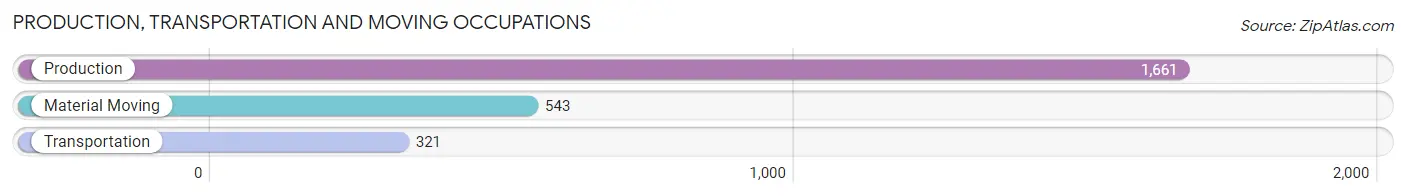
Production, Transportation and Moving Occupations
The most common Production, Transportation and Moving occupations in Greenwood are Production (1,661 | 18.6%), Material Moving (543 | 6.1%), and Transportation (321 | 3.6%).
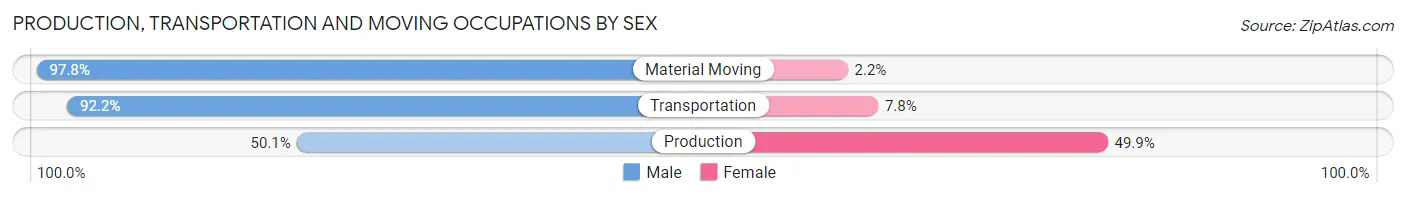
Production, Transportation and Moving Occupations by Sex
| Occupation | Male | Female |
| Production | 832 (50.1%) | 829 (49.9%) |
| Transportation | 296 (92.2%) | 25 (7.8%) |
| Material Moving | 531 (97.8%) | 12 (2.2%) |
| Total (Category) | 1,659 (65.7%) | 866 (34.3%) |
| Total (Overall) | 4,250 (47.7%) | 4,666 (52.3%) |
Employment Industries by Sex in Greenwood
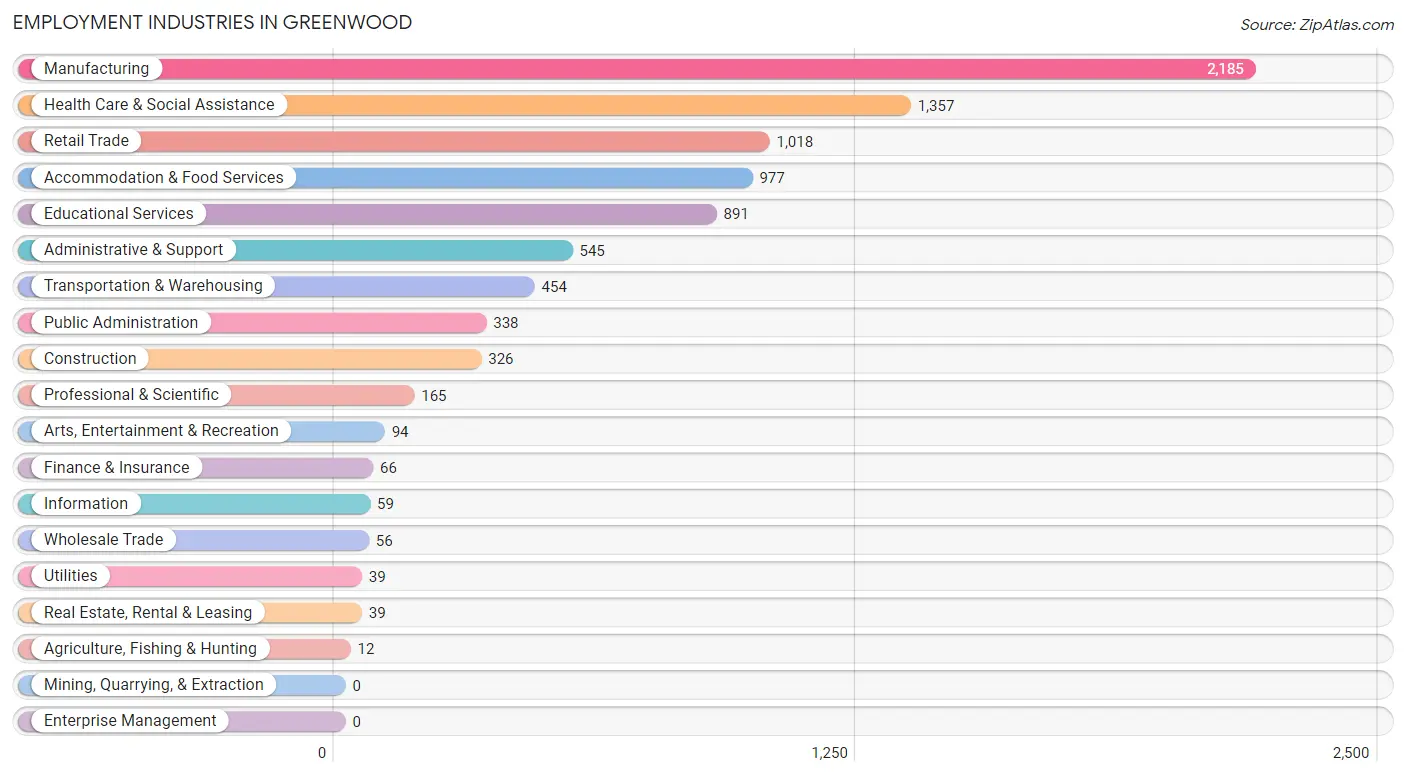
Employment Industries in Greenwood
The major employment industries in Greenwood include Manufacturing (2,185 | 24.5%), Health Care & Social Assistance (1,357 | 15.2%), Retail Trade (1,018 | 11.4%), Accommodation & Food Services (977 | 11.0%), and Educational Services (891 | 10.0%).
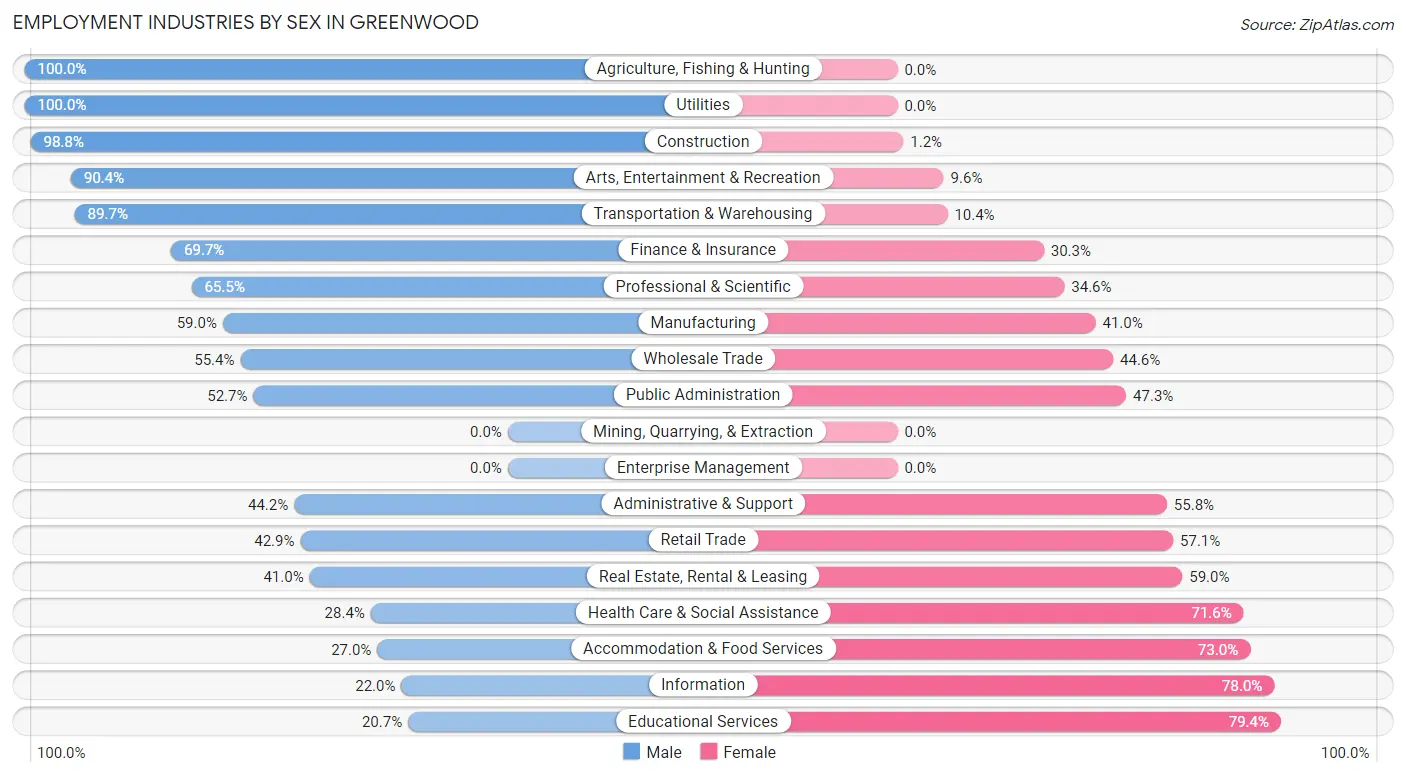
Employment Industries by Sex in Greenwood
The Greenwood industries that see more men than women are Agriculture, Fishing & Hunting (100.0%), Utilities (100.0%), and Construction (98.8%), whereas the industries that tend to have a higher number of women are Educational Services (79.3%), Information (78.0%), and Accommodation & Food Services (73.0%).
| Industry | Male | Female |
| Agriculture, Fishing & Hunting | 12 (100.0%) | 0 (0.0%) |
| Mining, Quarrying, & Extraction | 0 (0.0%) | 0 (0.0%) |
| Construction | 322 (98.8%) | 4 (1.2%) |
| Manufacturing | 1,289 (59.0%) | 896 (41.0%) |
| Wholesale Trade | 31 (55.4%) | 25 (44.6%) |
| Retail Trade | 437 (42.9%) | 581 (57.1%) |
| Transportation & Warehousing | 407 (89.6%) | 47 (10.3%) |
| Utilities | 39 (100.0%) | 0 (0.0%) |
| Information | 13 (22.0%) | 46 (78.0%) |
| Finance & Insurance | 46 (69.7%) | 20 (30.3%) |
| Real Estate, Rental & Leasing | 16 (41.0%) | 23 (59.0%) |
| Professional & Scientific | 108 (65.4%) | 57 (34.5%) |
| Enterprise Management | 0 (0.0%) | 0 (0.0%) |
| Administrative & Support | 241 (44.2%) | 304 (55.8%) |
| Educational Services | 184 (20.6%) | 707 (79.3%) |
| Health Care & Social Assistance | 385 (28.4%) | 972 (71.6%) |
| Arts, Entertainment & Recreation | 85 (90.4%) | 9 (9.6%) |
| Accommodation & Food Services | 264 (27.0%) | 713 (73.0%) |
| Public Administration | 178 (52.7%) | 160 (47.3%) |
| Total | 4,250 (47.7%) | 4,666 (52.3%) |
Education in Greenwood
School Enrollment in Greenwood
The most common levels of schooling among the 6,756 students in Greenwood are college / undergraduate (2,731 | 40.4%), elementary school (1,495 | 22.1%), and middle school (860 | 12.7%).
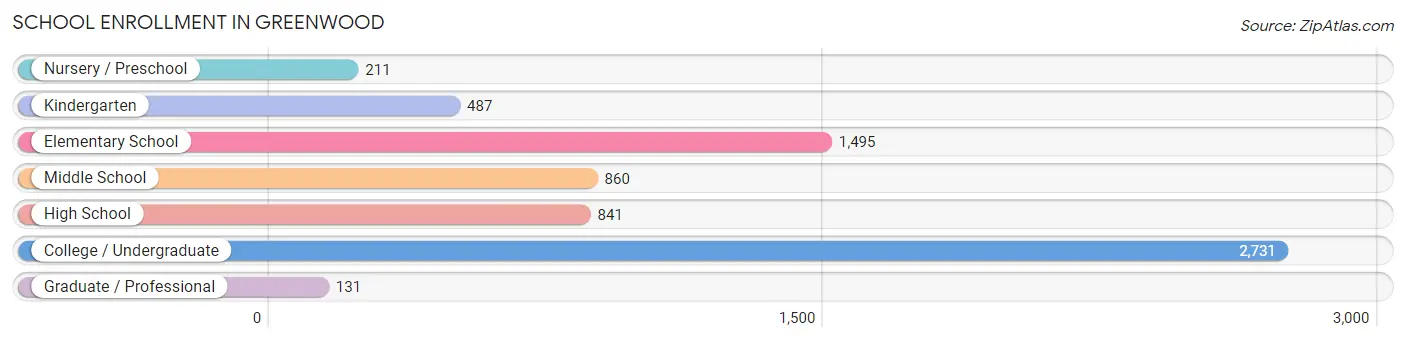
| School Level | # Students | % Students |
| Nursery / Preschool | 211 | 3.1% |
| Kindergarten | 487 | 7.2% |
| Elementary School | 1,495 | 22.1% |
| Middle School | 860 | 12.7% |
| High School | 841 | 12.4% |
| College / Undergraduate | 2,731 | 40.4% |
| Graduate / Professional | 131 | 1.9% |
| Total | 6,756 | 100.0% |
School Enrollment by Age by Funding Source in Greenwood
Out of a total of 6,756 students who are enrolled in schools in Greenwood, 230 (3.4%) attend a private institution, while the remaining 6,526 (96.6%) are enrolled in public schools. The age group of 3 to 4 year olds has the highest likelihood of being enrolled in private schools, with 32 (25.4% in the age bracket) enrolled. Conversely, the age group of 5 to 9 year old has the lowest likelihood of being enrolled in a private school, with 1,647 (99.8% in the age bracket) attending a public institution.
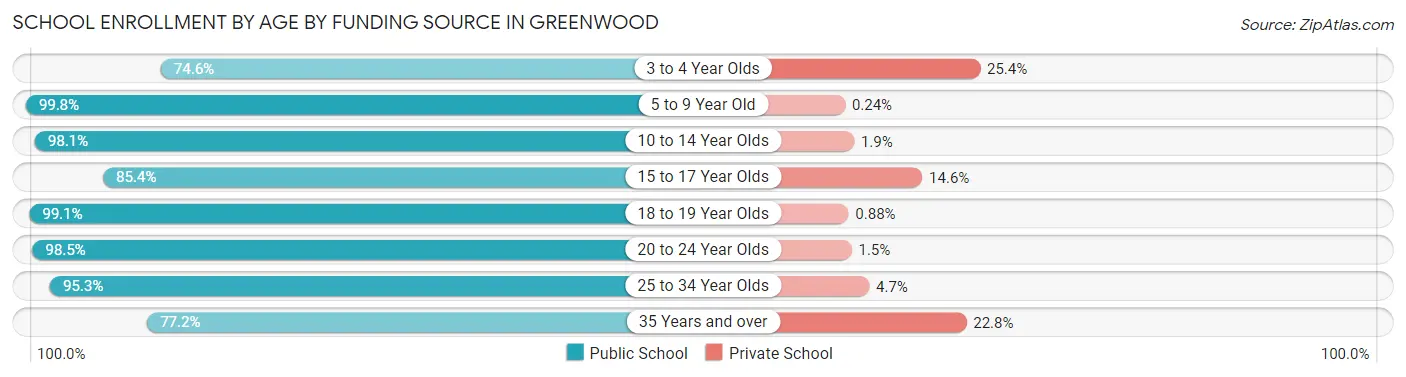
| Age Bracket | Public School | Private School |
| 3 to 4 Year Olds | 94 (74.6%) | 32 (25.4%) |
| 5 to 9 Year Old | 1,647 (99.8%) | 4 (0.2%) |
| 10 to 14 Year Olds | 1,331 (98.1%) | 26 (1.9%) |
| 15 to 17 Year Olds | 514 (85.4%) | 88 (14.6%) |
| 18 to 19 Year Olds | 1,237 (99.1%) | 11 (0.9%) |
| 20 to 24 Year Olds | 1,420 (98.5%) | 21 (1.5%) |
| 25 to 34 Year Olds | 161 (95.3%) | 8 (4.7%) |
| 35 Years and over | 125 (77.2%) | 37 (22.8%) |
| Total | 6,526 (96.6%) | 230 (3.4%) |
Educational Attainment by Field of Study in Greenwood
Business (643 | 20.3%), education (633 | 20.0%), engineering (365 | 11.6%), science & technology (325 | 10.3%), and literature & languages (255 | 8.1%) are the most common fields of study among 3,159 individuals in Greenwood who have obtained a bachelor's degree or higher.
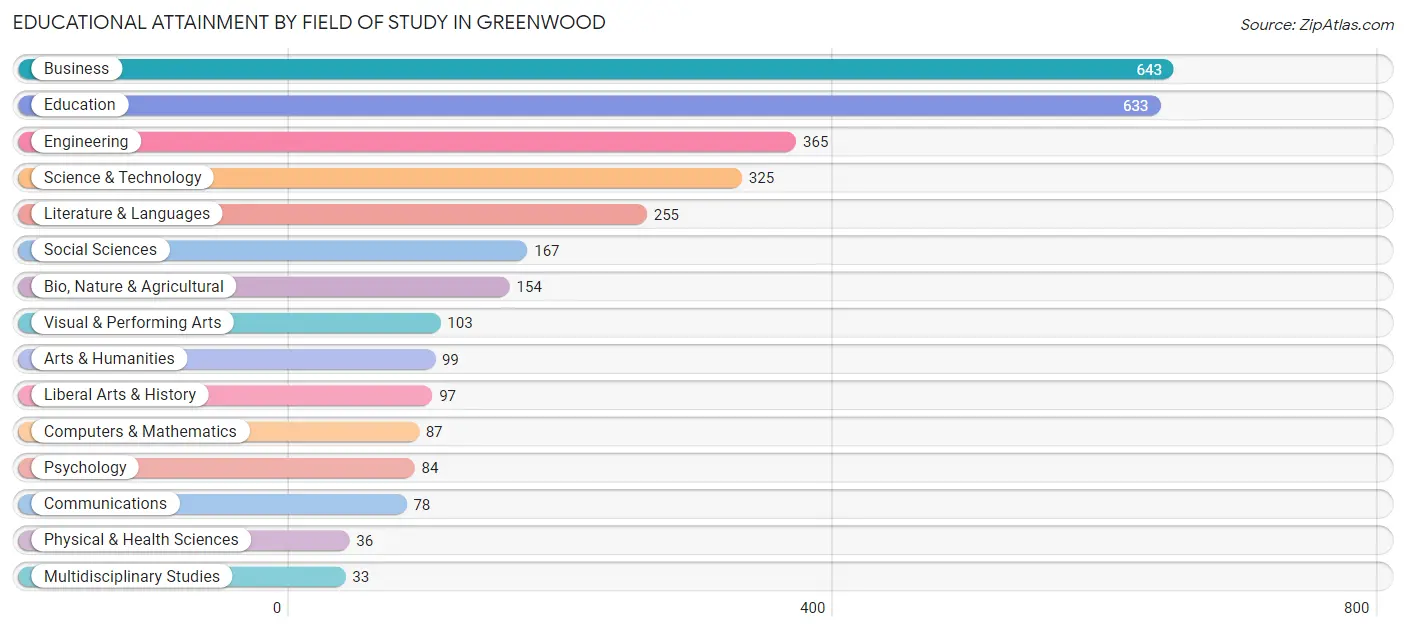
| Field of Study | # Graduates | % Graduates |
| Computers & Mathematics | 87 | 2.8% |
| Bio, Nature & Agricultural | 154 | 4.9% |
| Physical & Health Sciences | 36 | 1.1% |
| Psychology | 84 | 2.7% |
| Social Sciences | 167 | 5.3% |
| Engineering | 365 | 11.6% |
| Multidisciplinary Studies | 33 | 1.0% |
| Science & Technology | 325 | 10.3% |
| Business | 643 | 20.3% |
| Education | 633 | 20.0% |
| Literature & Languages | 255 | 8.1% |
| Liberal Arts & History | 97 | 3.1% |
| Visual & Performing Arts | 103 | 3.3% |
| Communications | 78 | 2.5% |
| Arts & Humanities | 99 | 3.1% |
| Total | 3,159 | 100.0% |
Transportation & Commute in Greenwood
Vehicle Availability by Sex in Greenwood
The most prevalent vehicle ownership categories in Greenwood are males with 2 vehicles (1,909, accounting for 47.9%) and females with 2 vehicles (1,463, making up 46.6%).
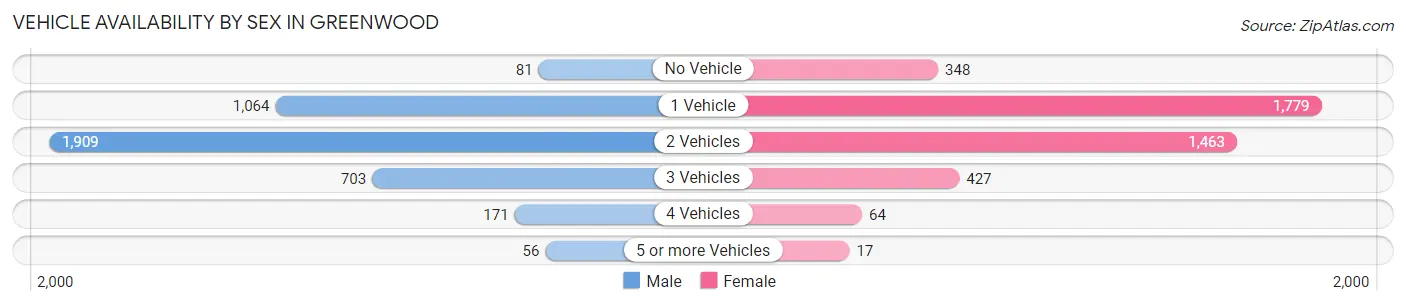
| Vehicles Available | Male | Female |
| No Vehicle | 81 (2.0%) | 348 (8.5%) |
| 1 Vehicle | 1,064 (26.7%) | 1,779 (43.4%) |
| 2 Vehicles | 1,909 (47.9%) | 1,463 (35.7%) |
| 3 Vehicles | 703 (17.6%) | 427 (10.4%) |
| 4 Vehicles | 171 (4.3%) | 64 (1.6%) |
| 5 or more Vehicles | 56 (1.4%) | 17 (0.4%) |
| Total | 3,984 (100.0%) | 4,098 (100.0%) |
Commute Time in Greenwood
The most frequently occuring commute durations in Greenwood are 10 to 14 minutes (2,490 commuters, 29.3%), 15 to 19 minutes (1,557 commuters, 18.3%), and 5 to 9 minutes (1,274 commuters, 15.0%).
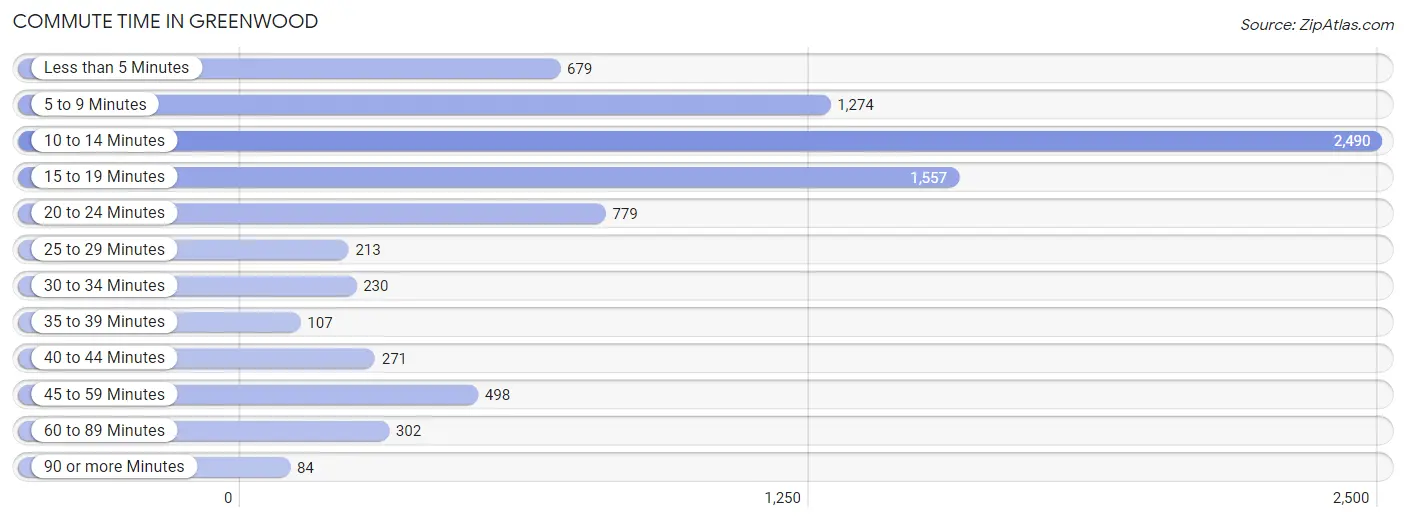
| Commute Time | # Commuters | % Commuters |
| Less than 5 Minutes | 679 | 8.0% |
| 5 to 9 Minutes | 1,274 | 15.0% |
| 10 to 14 Minutes | 2,490 | 29.3% |
| 15 to 19 Minutes | 1,557 | 18.3% |
| 20 to 24 Minutes | 779 | 9.2% |
| 25 to 29 Minutes | 213 | 2.5% |
| 30 to 34 Minutes | 230 | 2.7% |
| 35 to 39 Minutes | 107 | 1.3% |
| 40 to 44 Minutes | 271 | 3.2% |
| 45 to 59 Minutes | 498 | 5.9% |
| 60 to 89 Minutes | 302 | 3.6% |
| 90 or more Minutes | 84 | 1.0% |
Commute Time by Sex in Greenwood
The most common commute times in Greenwood are 10 to 14 minutes (1,116 commuters, 27.8%) for males and 10 to 14 minutes (1,374 commuters, 30.8%) for females.
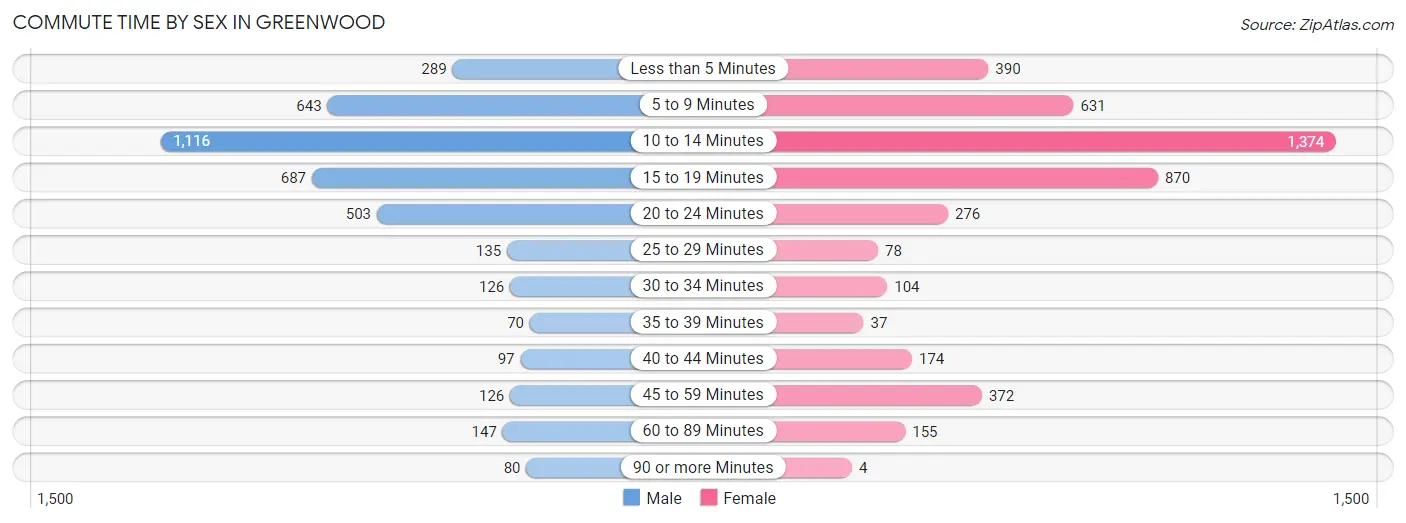
| Commute Time | Male | Female |
| Less than 5 Minutes | 289 (7.2%) | 390 (8.7%) |
| 5 to 9 Minutes | 643 (16.0%) | 631 (14.1%) |
| 10 to 14 Minutes | 1,116 (27.8%) | 1,374 (30.8%) |
| 15 to 19 Minutes | 687 (17.1%) | 870 (19.5%) |
| 20 to 24 Minutes | 503 (12.5%) | 276 (6.2%) |
| 25 to 29 Minutes | 135 (3.4%) | 78 (1.8%) |
| 30 to 34 Minutes | 126 (3.1%) | 104 (2.3%) |
| 35 to 39 Minutes | 70 (1.7%) | 37 (0.8%) |
| 40 to 44 Minutes | 97 (2.4%) | 174 (3.9%) |
| 45 to 59 Minutes | 126 (3.1%) | 372 (8.3%) |
| 60 to 89 Minutes | 147 (3.7%) | 155 (3.5%) |
| 90 or more Minutes | 80 (2.0%) | 4 (0.1%) |
Time of Departure to Work by Sex in Greenwood
The most frequent times of departure to work in Greenwood are 6:30 AM to 6:59 AM (610, 15.2%) for males and 7:30 AM to 7:59 AM (763, 17.1%) for females.
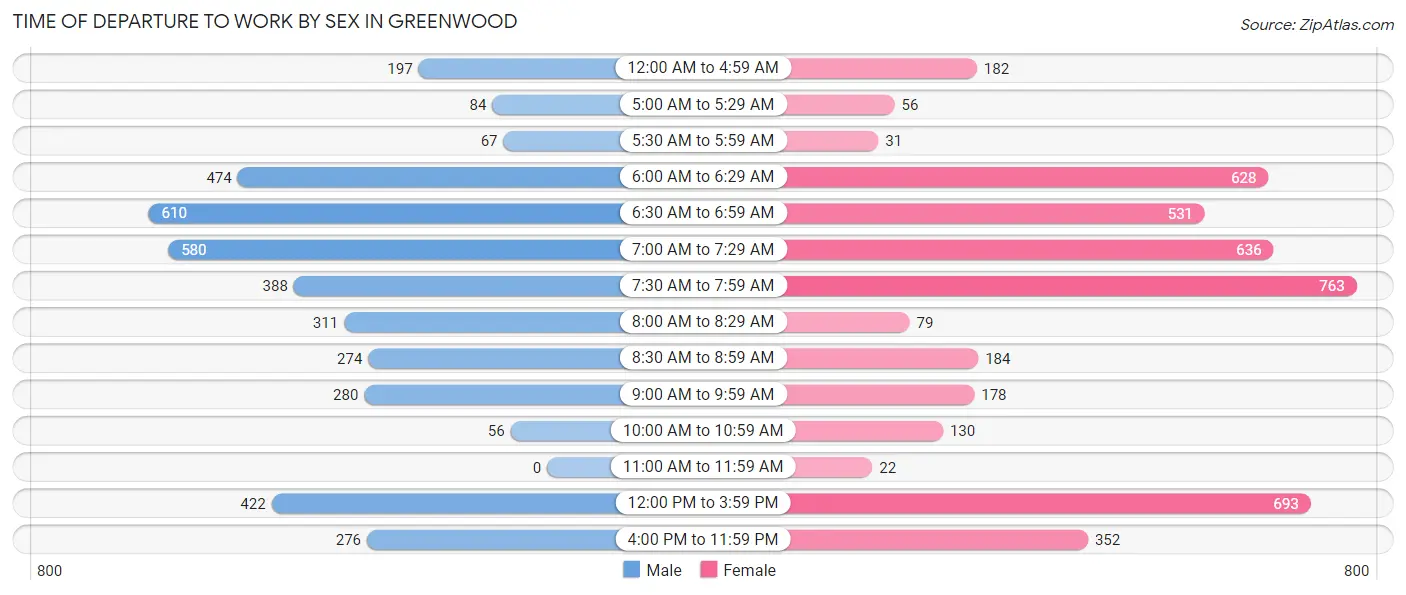
| Time of Departure | Male | Female |
| 12:00 AM to 4:59 AM | 197 (4.9%) | 182 (4.1%) |
| 5:00 AM to 5:29 AM | 84 (2.1%) | 56 (1.3%) |
| 5:30 AM to 5:59 AM | 67 (1.7%) | 31 (0.7%) |
| 6:00 AM to 6:29 AM | 474 (11.8%) | 628 (14.1%) |
| 6:30 AM to 6:59 AM | 610 (15.2%) | 531 (11.9%) |
| 7:00 AM to 7:29 AM | 580 (14.4%) | 636 (14.2%) |
| 7:30 AM to 7:59 AM | 388 (9.7%) | 763 (17.1%) |
| 8:00 AM to 8:29 AM | 311 (7.7%) | 79 (1.8%) |
| 8:30 AM to 8:59 AM | 274 (6.8%) | 184 (4.1%) |
| 9:00 AM to 9:59 AM | 280 (7.0%) | 178 (4.0%) |
| 10:00 AM to 10:59 AM | 56 (1.4%) | 130 (2.9%) |
| 11:00 AM to 11:59 AM | 0 (0.0%) | 22 (0.5%) |
| 12:00 PM to 3:59 PM | 422 (10.5%) | 693 (15.5%) |
| 4:00 PM to 11:59 PM | 276 (6.9%) | 352 (7.9%) |
| Total | 4,019 (100.0%) | 4,465 (100.0%) |
Housing Occupancy in Greenwood
Occupancy by Ownership in Greenwood
Of the total 8,719 dwellings in Greenwood, owner-occupied units account for 3,868 (44.4%), while renter-occupied units make up 4,851 (55.6%).
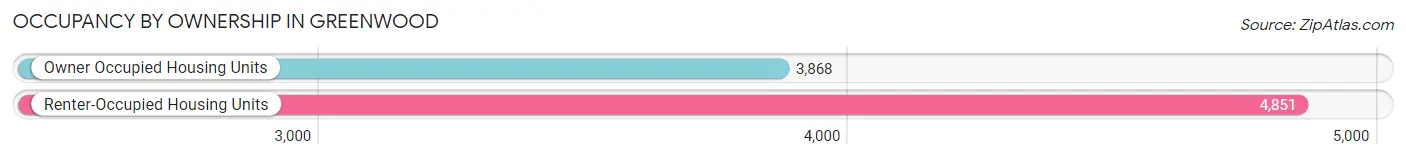
| Occupancy | # Housing Units | % Housing Units |
| Owner Occupied Housing Units | 3,868 | 44.4% |
| Renter-Occupied Housing Units | 4,851 | 55.6% |
| Total Occupied Housing Units | 8,719 | 100.0% |
Occupancy by Household Size in Greenwood
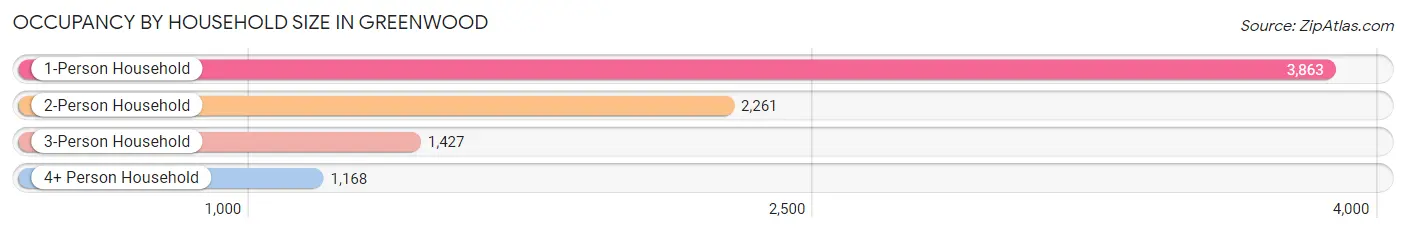
| Household Size | # Housing Units | % Housing Units |
| 1-Person Household | 3,863 | 44.3% |
| 2-Person Household | 2,261 | 25.9% |
| 3-Person Household | 1,427 | 16.4% |
| 4+ Person Household | 1,168 | 13.4% |
| Total Housing Units | 8,719 | 100.0% |
Occupancy by Ownership by Household Size in Greenwood
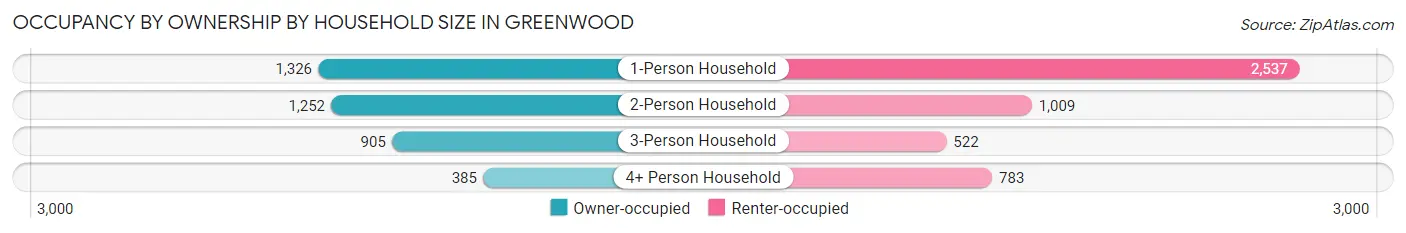
| Household Size | Owner-occupied | Renter-occupied |
| 1-Person Household | 1,326 (34.3%) | 2,537 (65.7%) |
| 2-Person Household | 1,252 (55.4%) | 1,009 (44.6%) |
| 3-Person Household | 905 (63.4%) | 522 (36.6%) |
| 4+ Person Household | 385 (33.0%) | 783 (67.0%) |
| Total Housing Units | 3,868 (44.4%) | 4,851 (55.6%) |
Occupancy by Educational Attainment in Greenwood
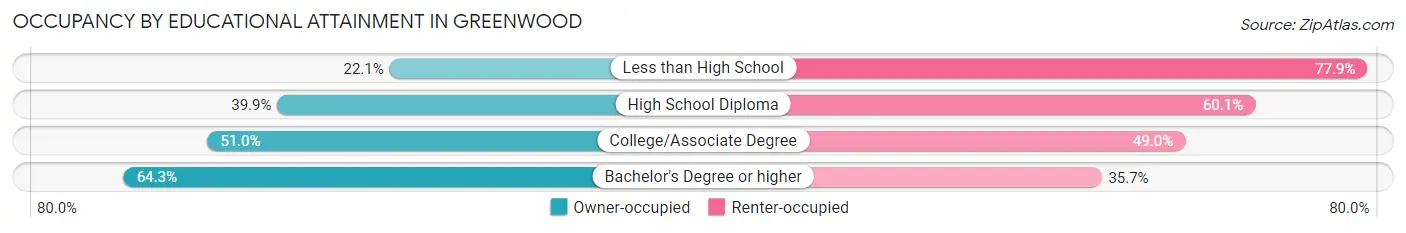
| Household Size | Owner-occupied | Renter-occupied |
| Less than High School | 378 (22.1%) | 1,332 (77.9%) |
| High School Diploma | 1,125 (39.9%) | 1,693 (60.1%) |
| College/Associate Degree | 1,264 (51.0%) | 1,214 (49.0%) |
| Bachelor's Degree or higher | 1,101 (64.3%) | 612 (35.7%) |
Occupancy by Age of Householder in Greenwood
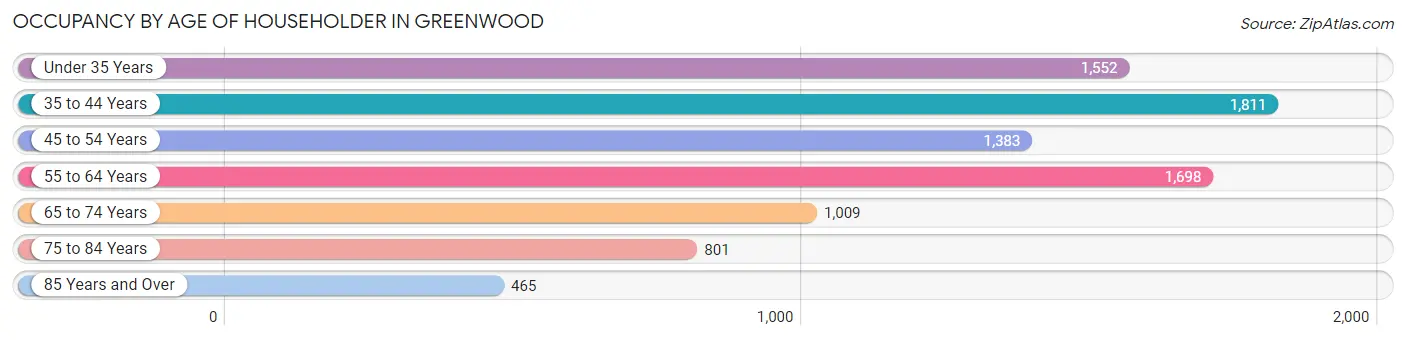
| Age Bracket | # Households | % Households |
| Under 35 Years | 1,552 | 17.8% |
| 35 to 44 Years | 1,811 | 20.8% |
| 45 to 54 Years | 1,383 | 15.9% |
| 55 to 64 Years | 1,698 | 19.5% |
| 65 to 74 Years | 1,009 | 11.6% |
| 75 to 84 Years | 801 | 9.2% |
| 85 Years and Over | 465 | 5.3% |
| Total | 8,719 | 100.0% |
Housing Finances in Greenwood
Median Income by Occupancy in Greenwood
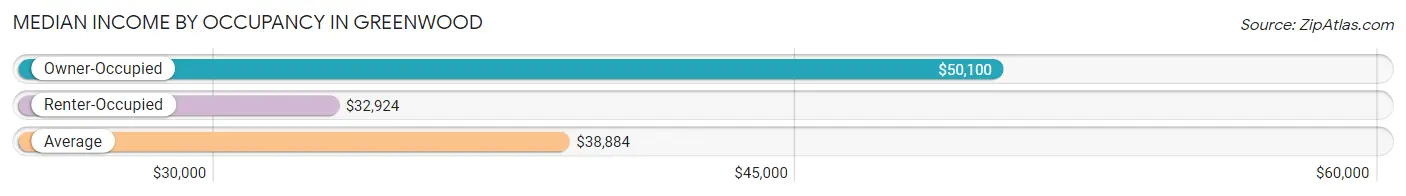
| Occupancy Type | # Households | Median Income |
| Owner-Occupied | 3,868 (44.4%) | $50,100 |
| Renter-Occupied | 4,851 (55.6%) | $32,924 |
| Average | 8,719 (100.0%) | $38,884 |
Occupancy by Householder Income Bracket in Greenwood
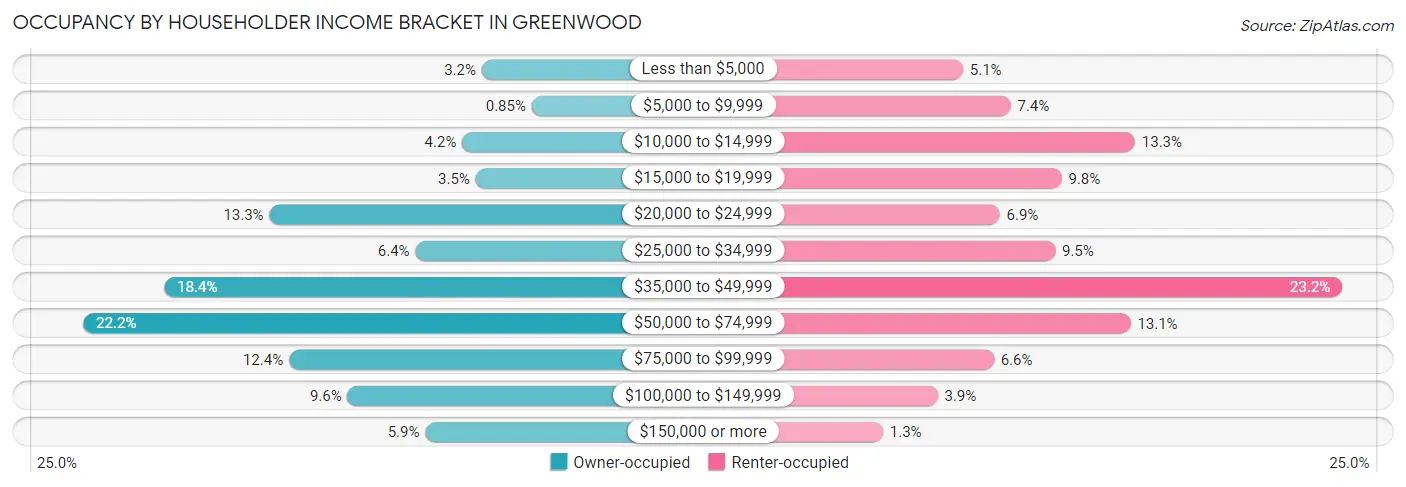
| Income Bracket | Owner-occupied | Renter-occupied |
| Less than $5,000 | 125 (3.2%) | 248 (5.1%) |
| $5,000 to $9,999 | 33 (0.9%) | 358 (7.4%) |
| $10,000 to $14,999 | 161 (4.2%) | 645 (13.3%) |
| $15,000 to $19,999 | 136 (3.5%) | 476 (9.8%) |
| $20,000 to $24,999 | 516 (13.3%) | 333 (6.9%) |
| $25,000 to $34,999 | 247 (6.4%) | 461 (9.5%) |
| $35,000 to $49,999 | 710 (18.4%) | 1,124 (23.2%) |
| $50,000 to $74,999 | 859 (22.2%) | 635 (13.1%) |
| $75,000 to $99,999 | 480 (12.4%) | 319 (6.6%) |
| $100,000 to $149,999 | 372 (9.6%) | 189 (3.9%) |
| $150,000 or more | 229 (5.9%) | 63 (1.3%) |
| Total | 3,868 (100.0%) | 4,851 (100.0%) |
Monthly Housing Cost Tiers in Greenwood
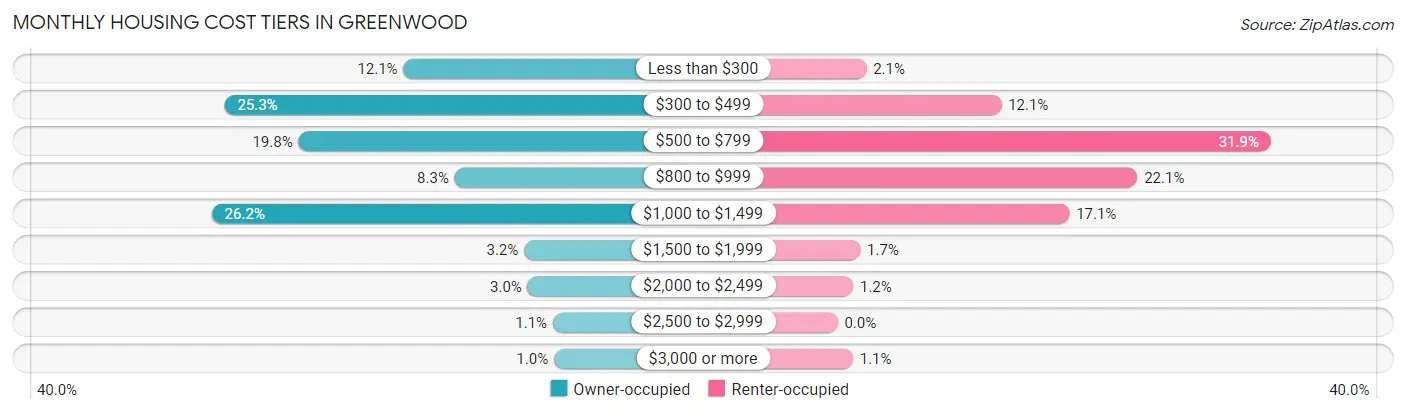
| Monthly Cost | Owner-occupied | Renter-occupied |
| Less than $300 | 468 (12.1%) | 103 (2.1%) |
| $300 to $499 | 978 (25.3%) | 585 (12.1%) |
| $500 to $799 | 767 (19.8%) | 1,548 (31.9%) |
| $800 to $999 | 322 (8.3%) | 1,071 (22.1%) |
| $1,000 to $1,499 | 1,014 (26.2%) | 828 (17.1%) |
| $1,500 to $1,999 | 124 (3.2%) | 81 (1.7%) |
| $2,000 to $2,499 | 114 (2.9%) | 56 (1.1%) |
| $2,500 to $2,999 | 42 (1.1%) | 0 (0.0%) |
| $3,000 or more | 39 (1.0%) | 55 (1.1%) |
| Total | 3,868 (100.0%) | 4,851 (100.0%) |
Physical Housing Characteristics in Greenwood
Housing Structures in Greenwood
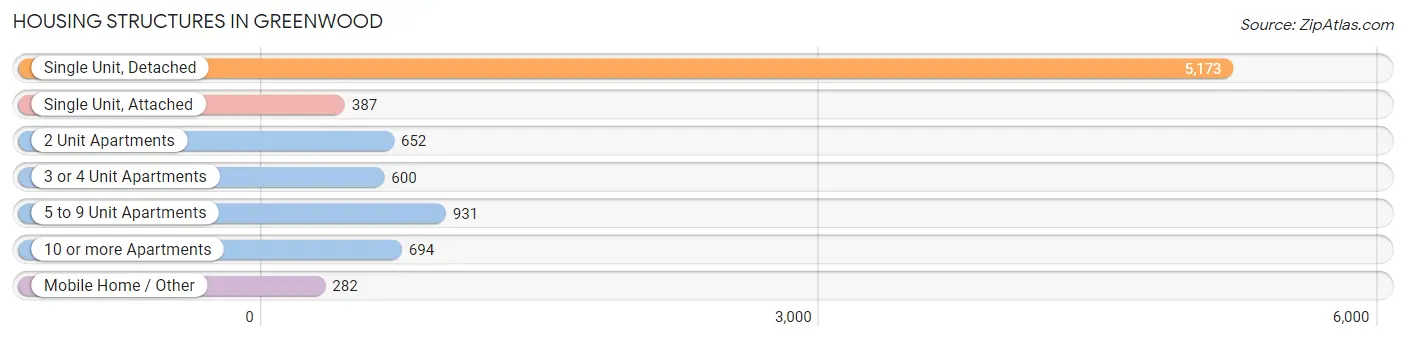
| Structure Type | # Housing Units | % Housing Units |
| Single Unit, Detached | 5,173 | 59.3% |
| Single Unit, Attached | 387 | 4.4% |
| 2 Unit Apartments | 652 | 7.5% |
| 3 or 4 Unit Apartments | 600 | 6.9% |
| 5 to 9 Unit Apartments | 931 | 10.7% |
| 10 or more Apartments | 694 | 8.0% |
| Mobile Home / Other | 282 | 3.2% |
| Total | 8,719 | 100.0% |
Housing Structures by Occupancy in Greenwood
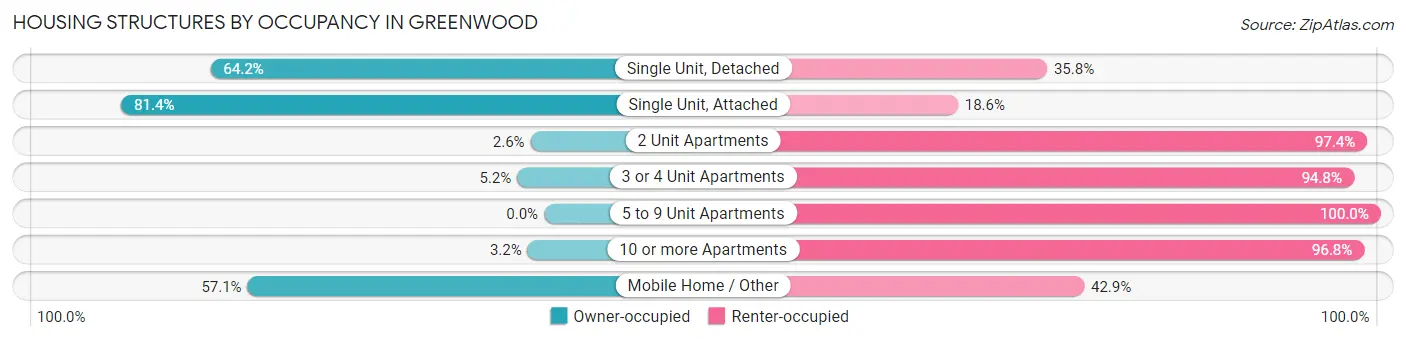
| Structure Type | Owner-occupied | Renter-occupied |
| Single Unit, Detached | 3,322 (64.2%) | 1,851 (35.8%) |
| Single Unit, Attached | 315 (81.4%) | 72 (18.6%) |
| 2 Unit Apartments | 17 (2.6%) | 635 (97.4%) |
| 3 or 4 Unit Apartments | 31 (5.2%) | 569 (94.8%) |
| 5 to 9 Unit Apartments | 0 (0.0%) | 931 (100.0%) |
| 10 or more Apartments | 22 (3.2%) | 672 (96.8%) |
| Mobile Home / Other | 161 (57.1%) | 121 (42.9%) |
| Total | 3,868 (44.4%) | 4,851 (55.6%) |
Housing Structures by Number of Rooms in Greenwood
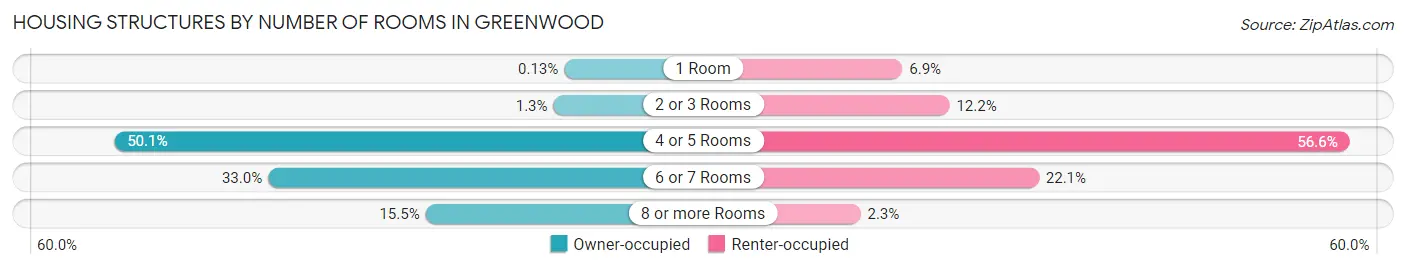
| Number of Rooms | Owner-occupied | Renter-occupied |
| 1 Room | 5 (0.1%) | 336 (6.9%) |
| 2 or 3 Rooms | 51 (1.3%) | 590 (12.2%) |
| 4 or 5 Rooms | 1,936 (50.0%) | 2,743 (56.6%) |
| 6 or 7 Rooms | 1,276 (33.0%) | 1,071 (22.1%) |
| 8 or more Rooms | 600 (15.5%) | 111 (2.3%) |
| Total | 3,868 (100.0%) | 4,851 (100.0%) |
Housing Structure by Heating Type in Greenwood
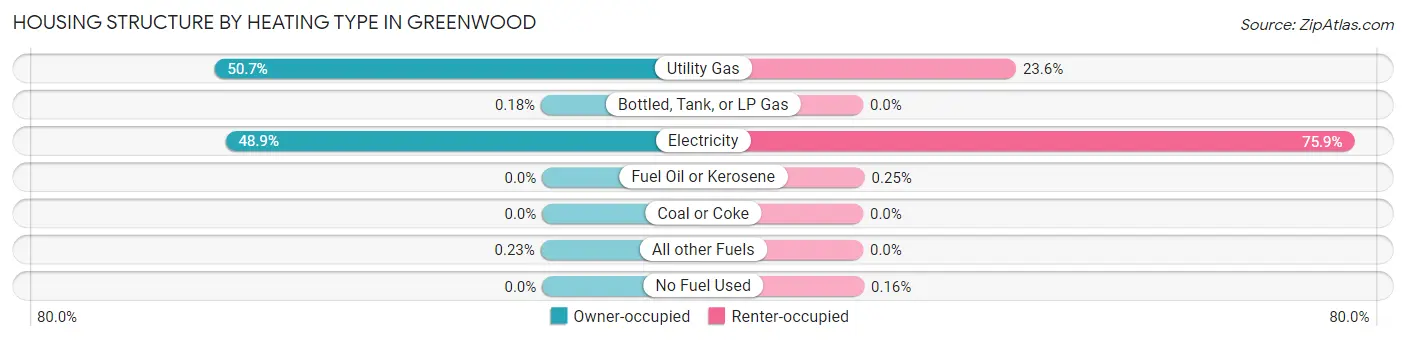
| Heating Type | Owner-occupied | Renter-occupied |
| Utility Gas | 1,959 (50.6%) | 1,147 (23.6%) |
| Bottled, Tank, or LP Gas | 7 (0.2%) | 0 (0.0%) |
| Electricity | 1,893 (48.9%) | 3,684 (75.9%) |
| Fuel Oil or Kerosene | 0 (0.0%) | 12 (0.3%) |
| Coal or Coke | 0 (0.0%) | 0 (0.0%) |
| All other Fuels | 9 (0.2%) | 0 (0.0%) |
| No Fuel Used | 0 (0.0%) | 8 (0.2%) |
| Total | 3,868 (100.0%) | 4,851 (100.0%) |
Household Vehicle Usage in Greenwood
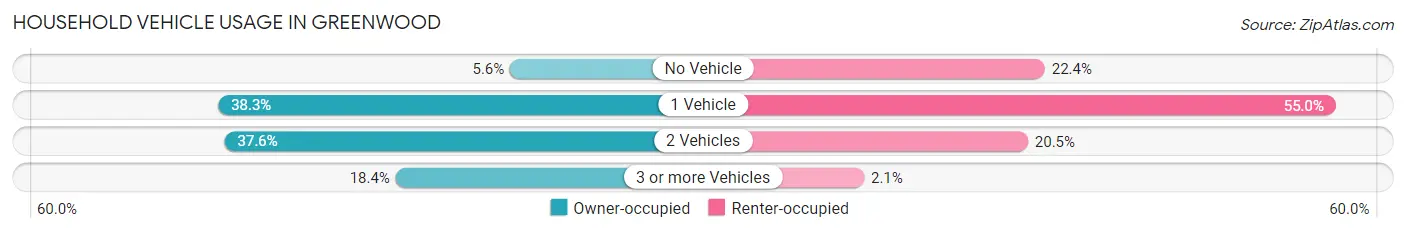
| Vehicles per Household | Owner-occupied | Renter-occupied |
| No Vehicle | 217 (5.6%) | 1,086 (22.4%) |
| 1 Vehicle | 1,483 (38.3%) | 2,667 (55.0%) |
| 2 Vehicles | 1,455 (37.6%) | 994 (20.5%) |
| 3 or more Vehicles | 713 (18.4%) | 104 (2.1%) |
| Total | 3,868 (100.0%) | 4,851 (100.0%) |
Real Estate & Mortgages in Greenwood
Real Estate and Mortgage Overview in Greenwood
| Characteristic | Without Mortgage | With Mortgage |
| Housing Units | 1,938 | 1,930 |
| Median Property Value | $95,100 | $130,400 |
| Median Household Income | $42,456 | $172 |
| Monthly Housing Costs | $366 | $39 |
| Real Estate Taxes | $821 | $15 |
Property Value by Mortgage Status in Greenwood
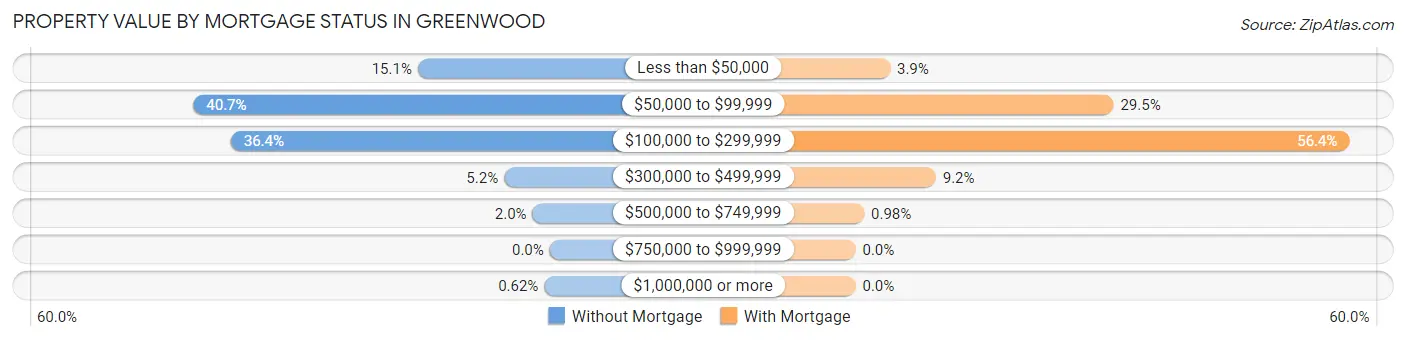
| Property Value | Without Mortgage | With Mortgage |
| Less than $50,000 | 292 (15.1%) | 76 (3.9%) |
| $50,000 to $99,999 | 789 (40.7%) | 569 (29.5%) |
| $100,000 to $299,999 | 706 (36.4%) | 1,089 (56.4%) |
| $300,000 to $499,999 | 101 (5.2%) | 177 (9.2%) |
| $500,000 to $749,999 | 38 (2.0%) | 19 (1.0%) |
| $750,000 to $999,999 | 0 (0.0%) | 0 (0.0%) |
| $1,000,000 or more | 12 (0.6%) | 0 (0.0%) |
| Total | 1,938 (100.0%) | 1,930 (100.0%) |
Household Income by Mortgage Status in Greenwood
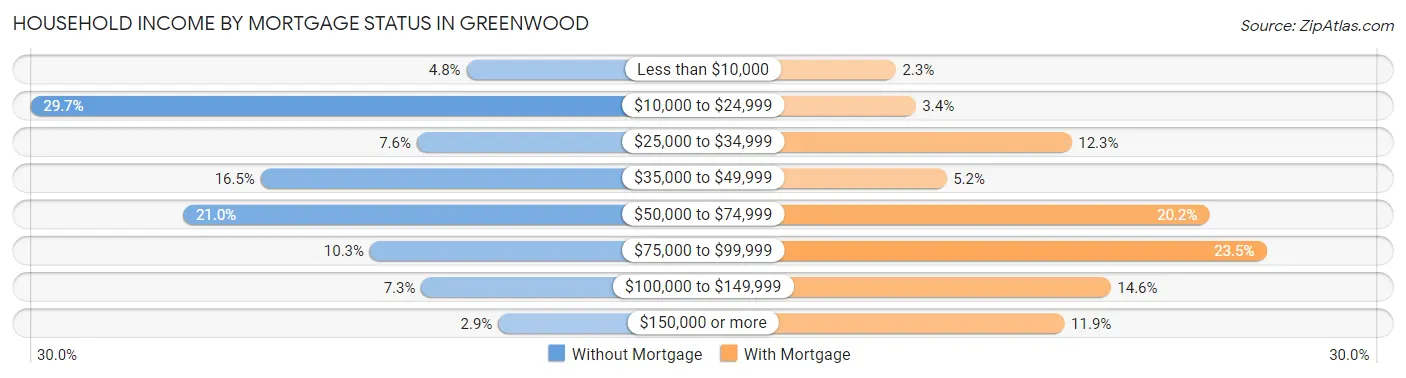
| Household Income | Without Mortgage | With Mortgage |
| Less than $10,000 | 92 (4.8%) | 44 (2.3%) |
| $10,000 to $24,999 | 575 (29.7%) | 66 (3.4%) |
| $25,000 to $34,999 | 147 (7.6%) | 238 (12.3%) |
| $35,000 to $49,999 | 320 (16.5%) | 100 (5.2%) |
| $50,000 to $74,999 | 406 (20.9%) | 390 (20.2%) |
| $75,000 to $99,999 | 199 (10.3%) | 453 (23.5%) |
| $100,000 to $149,999 | 142 (7.3%) | 281 (14.6%) |
| $150,000 or more | 57 (2.9%) | 230 (11.9%) |
| Total | 1,938 (100.0%) | 1,930 (100.0%) |
Property Value to Household Income Ratio in Greenwood
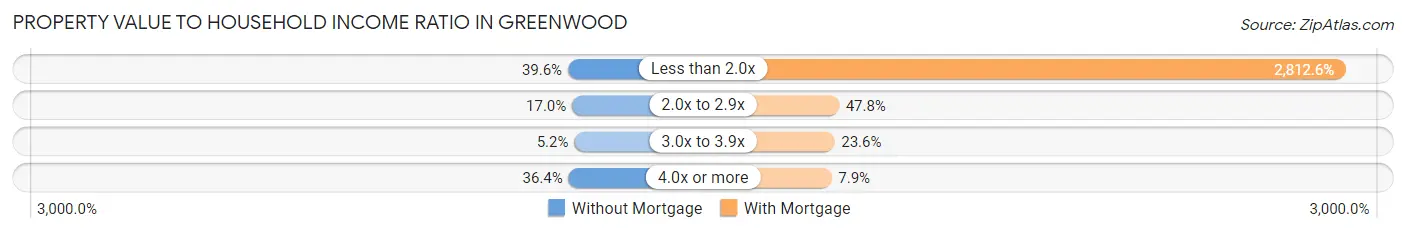
| Value-to-Income Ratio | Without Mortgage | With Mortgage |
| Less than 2.0x | 768 (39.6%) | 54,283 (2,812.6%) |
| 2.0x to 2.9x | 330 (17.0%) | 922 (47.8%) |
| 3.0x to 3.9x | 100 (5.2%) | 456 (23.6%) |
| 4.0x or more | 706 (36.4%) | 153 (7.9%) |
| Total | 1,938 (100.0%) | 1,930 (100.0%) |
Real Estate Taxes by Mortgage Status in Greenwood
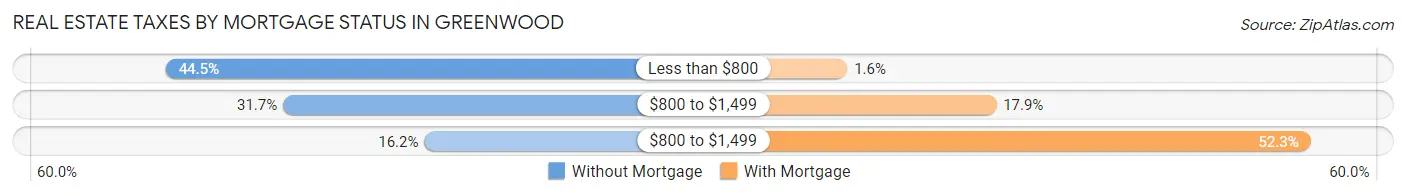
| Property Taxes | Without Mortgage | With Mortgage |
| Less than $800 | 863 (44.5%) | 30 (1.5%) |
| $800 to $1,499 | 614 (31.7%) | 345 (17.9%) |
| $800 to $1,499 | 314 (16.2%) | 1,010 (52.3%) |
| Total | 1,938 (100.0%) | 1,930 (100.0%) |
Health & Disability in Greenwood
Health Insurance Coverage by Age in Greenwood
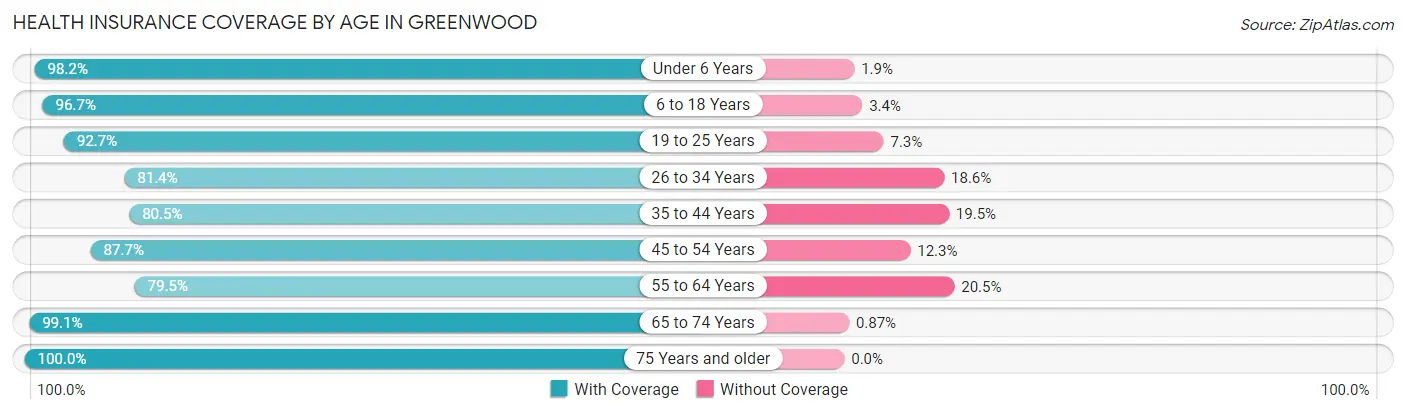
| Age Bracket | With Coverage | Without Coverage |
| Under 6 Years | 1,965 (98.2%) | 37 (1.8%) |
| 6 to 18 Years | 3,867 (96.7%) | 134 (3.4%) |
| 19 to 25 Years | 2,926 (92.7%) | 231 (7.3%) |
| 26 to 34 Years | 1,973 (81.4%) | 451 (18.6%) |
| 35 to 44 Years | 2,211 (80.5%) | 536 (19.5%) |
| 45 to 54 Years | 1,831 (87.7%) | 257 (12.3%) |
| 55 to 64 Years | 1,999 (79.5%) | 516 (20.5%) |
| 65 to 74 Years | 1,372 (99.1%) | 12 (0.9%) |
| 75 Years and older | 1,627 (100.0%) | 0 (0.0%) |
| Total | 19,771 (90.1%) | 2,174 (9.9%) |
Health Insurance Coverage by Citizenship Status in Greenwood
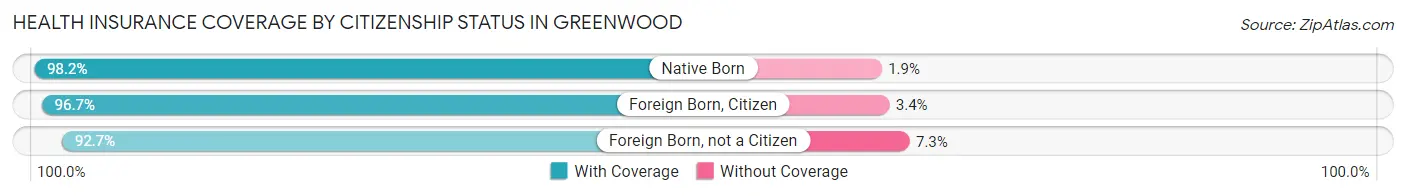
| Citizenship Status | With Coverage | Without Coverage |
| Native Born | 1,965 (98.2%) | 37 (1.8%) |
| Foreign Born, Citizen | 3,867 (96.7%) | 134 (3.4%) |
| Foreign Born, not a Citizen | 2,926 (92.7%) | 231 (7.3%) |
Health Insurance Coverage by Household Income in Greenwood
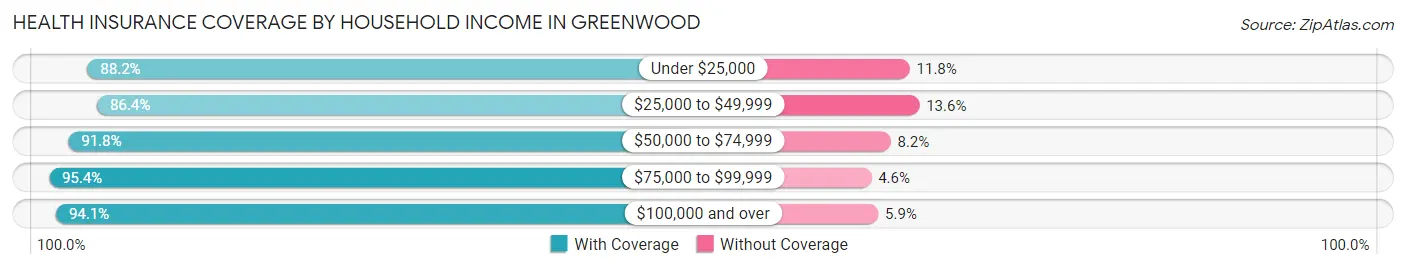
| Household Income | With Coverage | Without Coverage |
| Under $25,000 | 4,499 (88.2%) | 600 (11.8%) |
| $25,000 to $49,999 | 5,177 (86.4%) | 813 (13.6%) |
| $50,000 to $74,999 | 3,798 (91.8%) | 339 (8.2%) |
| $75,000 to $99,999 | 2,340 (95.4%) | 112 (4.6%) |
| $100,000 and over | 2,336 (94.1%) | 146 (5.9%) |
Public vs Private Health Insurance Coverage by Age in Greenwood
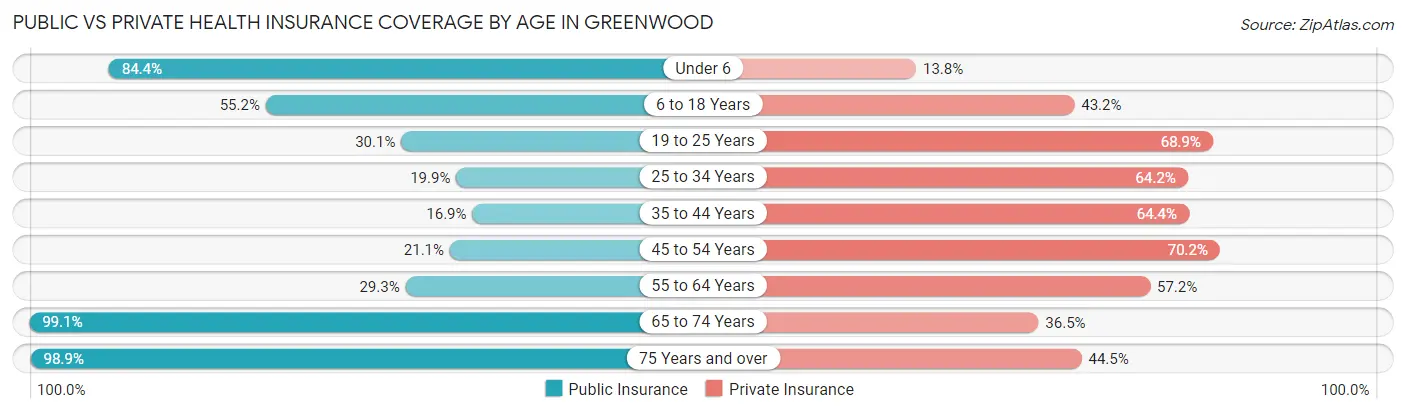
| Age Bracket | Public Insurance | Private Insurance |
| Under 6 | 1,689 (84.4%) | 276 (13.8%) |
| 6 to 18 Years | 2,210 (55.2%) | 1,727 (43.2%) |
| 19 to 25 Years | 950 (30.1%) | 2,174 (68.9%) |
| 25 to 34 Years | 482 (19.9%) | 1,556 (64.2%) |
| 35 to 44 Years | 464 (16.9%) | 1,769 (64.4%) |
| 45 to 54 Years | 440 (21.1%) | 1,465 (70.2%) |
| 55 to 64 Years | 737 (29.3%) | 1,439 (57.2%) |
| 65 to 74 Years | 1,372 (99.1%) | 505 (36.5%) |
| 75 Years and over | 1,609 (98.9%) | 724 (44.5%) |
| Total | 9,953 (45.4%) | 11,635 (53.0%) |
Disability Status by Sex by Age in Greenwood
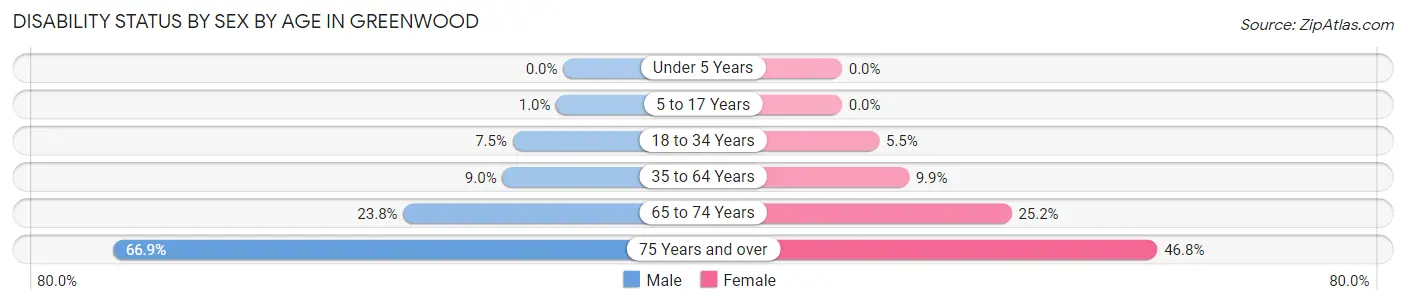
| Age Bracket | Male | Female |
| Under 5 Years | 0 (0.0%) | 0 (0.0%) |
| 5 to 17 Years | 20 (1.0%) | 0 (0.0%) |
| 18 to 34 Years | 199 (7.5%) | 203 (5.5%) |
| 35 to 64 Years | 319 (9.0%) | 380 (9.9%) |
| 65 to 74 Years | 142 (23.7%) | 198 (25.2%) |
| 75 Years and over | 380 (66.9%) | 496 (46.8%) |
Disability Class by Sex by Age in Greenwood
Disability Class: Hearing Difficulty
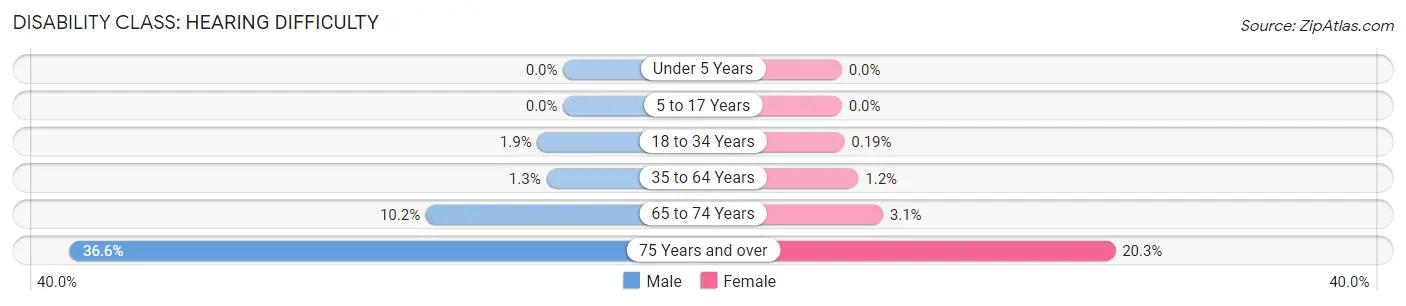
| Age Bracket | Male | Female |
| Under 5 Years | 0 (0.0%) | 0 (0.0%) |
| 5 to 17 Years | 0 (0.0%) | 0 (0.0%) |
| 18 to 34 Years | 51 (1.9%) | 7 (0.2%) |
| 35 to 64 Years | 44 (1.3%) | 47 (1.2%) |
| 65 to 74 Years | 61 (10.2%) | 24 (3.0%) |
| 75 Years and over | 208 (36.6%) | 215 (20.3%) |
Disability Class: Vision Difficulty
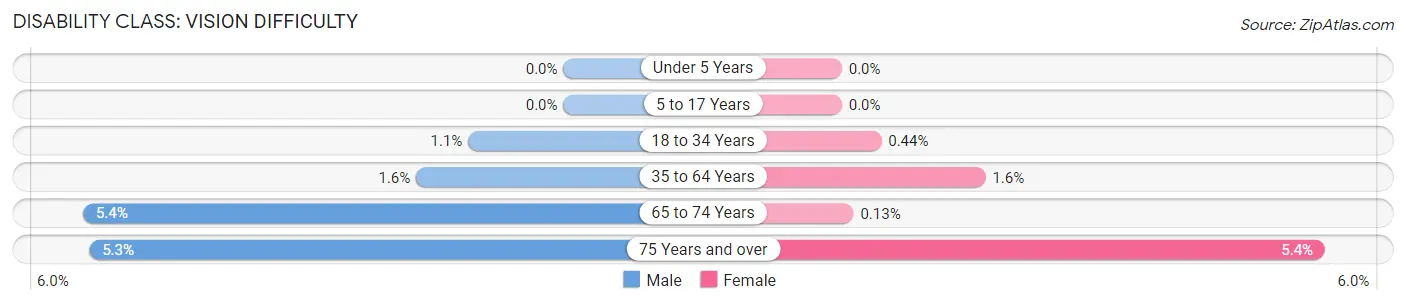
| Age Bracket | Male | Female |
| Under 5 Years | 0 (0.0%) | 0 (0.0%) |
| 5 to 17 Years | 0 (0.0%) | 0 (0.0%) |
| 18 to 34 Years | 28 (1.1%) | 16 (0.4%) |
| 35 to 64 Years | 58 (1.6%) | 61 (1.6%) |
| 65 to 74 Years | 32 (5.3%) | 1 (0.1%) |
| 75 Years and over | 30 (5.3%) | 57 (5.4%) |
Disability Class: Cognitive Difficulty
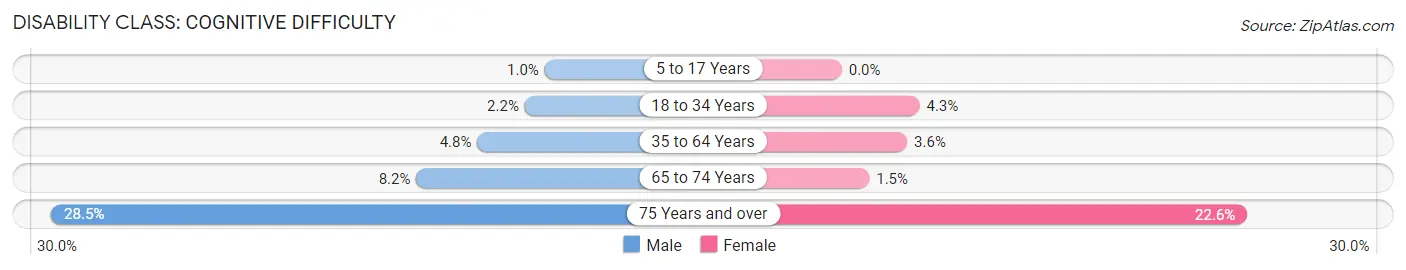
| Age Bracket | Male | Female |
| 5 to 17 Years | 20 (1.0%) | 0 (0.0%) |
| 18 to 34 Years | 57 (2.1%) | 159 (4.3%) |
| 35 to 64 Years | 169 (4.8%) | 139 (3.6%) |
| 65 to 74 Years | 49 (8.2%) | 12 (1.5%) |
| 75 Years and over | 162 (28.5%) | 239 (22.6%) |
Disability Class: Ambulatory Difficulty
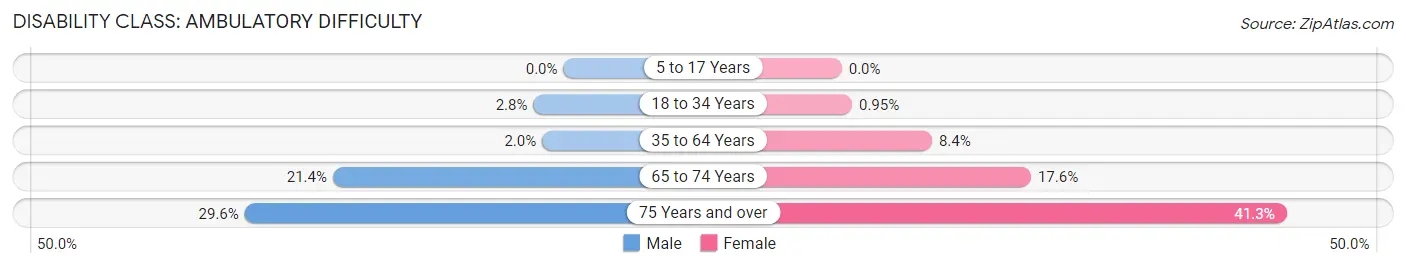
| Age Bracket | Male | Female |
| 5 to 17 Years | 0 (0.0%) | 0 (0.0%) |
| 18 to 34 Years | 74 (2.8%) | 35 (0.9%) |
| 35 to 64 Years | 70 (2.0%) | 320 (8.4%) |
| 65 to 74 Years | 128 (21.4%) | 138 (17.6%) |
| 75 Years and over | 168 (29.6%) | 437 (41.3%) |
Disability Class: Self-Care Difficulty
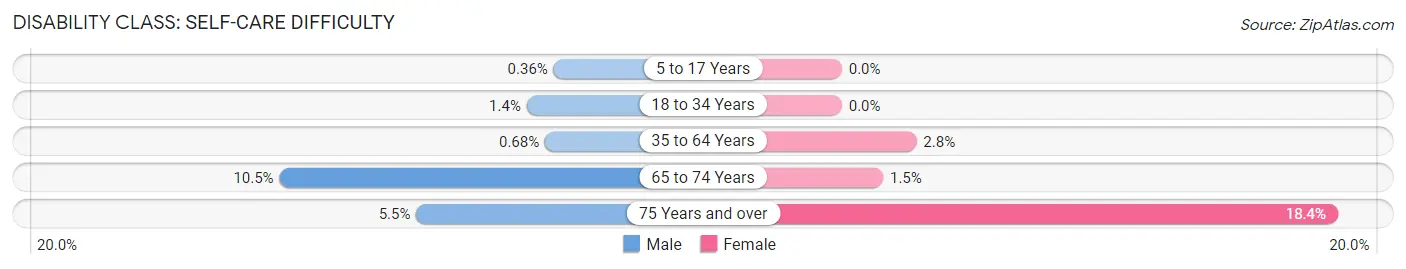
| Age Bracket | Male | Female |
| 5 to 17 Years | 7 (0.4%) | 0 (0.0%) |
| 18 to 34 Years | 36 (1.4%) | 0 (0.0%) |
| 35 to 64 Years | 24 (0.7%) | 106 (2.8%) |
| 65 to 74 Years | 63 (10.5%) | 12 (1.5%) |
| 75 Years and over | 31 (5.5%) | 195 (18.4%) |
Technology Access in Greenwood
Computing Device Access in Greenwood
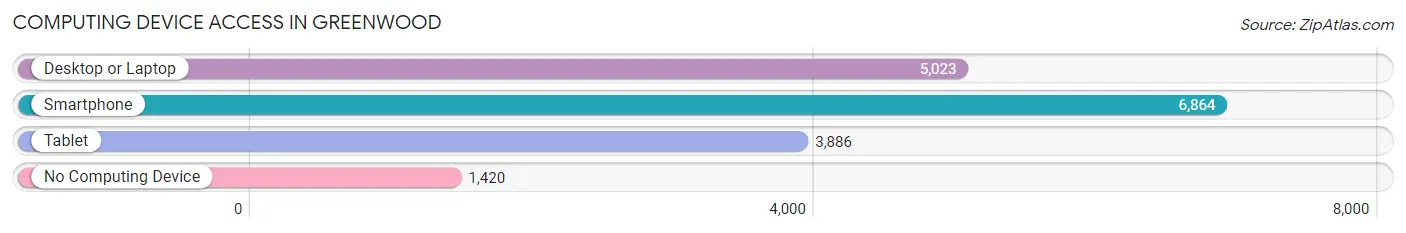
| Device Type | # Households | % Households |
| Desktop or Laptop | 5,023 | 57.6% |
| Smartphone | 6,864 | 78.7% |
| Tablet | 3,886 | 44.6% |
| No Computing Device | 1,420 | 16.3% |
| Total | 8,719 | 100.0% |
Internet Access in Greenwood
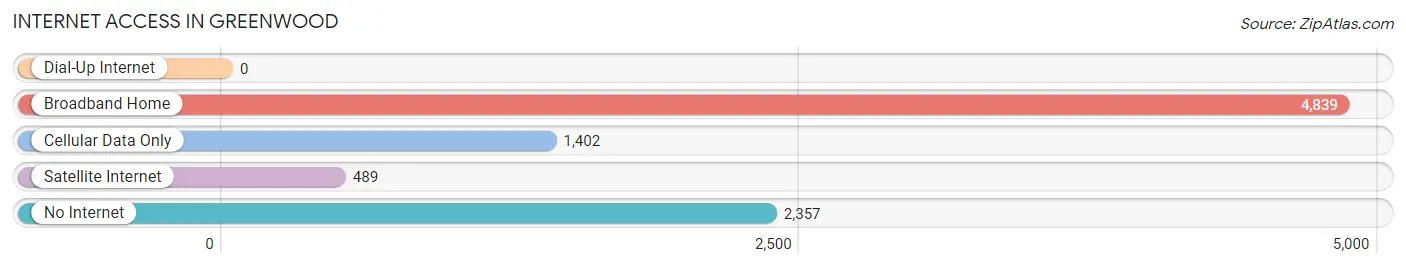
| Internet Type | # Households | % Households |
| Dial-Up Internet | 0 | 0.0% |
| Broadband Home | 4,839 | 55.5% |
| Cellular Data Only | 1,402 | 16.1% |
| Satellite Internet | 489 | 5.6% |
| No Internet | 2,357 | 27.0% |
| Total | 8,719 | 100.0% |
Greenwood Summary
Greenwood, South Carolina is a city located in the western part of the state, in the Piedmont region. It is the county seat of Greenwood County and is situated along the Saluda River. The city has a population of approximately 23,000 people and is part of the larger Greenwood-Greenville-Spartanburg metropolitan area.
History
Greenwood was founded in 1803 by a group of settlers from the nearby town of Ninety Six. The town was named after the Greenwood family, who owned much of the land in the area. The town was incorporated in 1868 and was the first town in the state to have a public library.
In the late 19th century, Greenwood became a major center for the textile industry. The city was home to several large mills, including the Greenwood Cotton Mill, which was the largest in the state. The city also became a major railroad hub, with several lines running through the city.
In the early 20th century, Greenwood experienced a period of growth and prosperity. The city was home to several large businesses, including the Greenwood Manufacturing Company, which produced furniture and other products. The city also had a thriving downtown area, with several stores and restaurants.
Geography
Greenwood is located in the western part of South Carolina, in the Piedmont region. The city is situated along the Saluda River, which flows through the city. The city is located about 50 miles from the state capital of Columbia and about 100 miles from the city of Charlotte, North Carolina.
The city has a total area of 16.2 square miles, of which 16.1 square miles is land and 0.1 square miles is water. The city is located at an elevation of 545 feet above sea level.
Economy
Greenwood has a diverse economy, with a variety of industries represented. The city is home to several large companies, including the Greenwood Manufacturing Company, which produces furniture and other products. The city is also home to several large textile mills, including the Greenwood Cotton Mill.
The city is also home to several large retail stores, including Walmart, Lowe’s, and Target. The city is also home to several restaurants, including several fast food chains.
Demographics
As of the 2010 census, the population of Greenwood was 23,222. The racial makeup of the city was 63.3% White, 30.2% African American, 0.3% Native American, 1.2% Asian, 0.1% Pacific Islander, 3.2% from other races, and 1.9% from two or more races. Hispanic or Latino of any race were 6.2% of the population.
The median household income in Greenwood was $35,945, and the median family income was $45,945. The per capita income in the city was $20,945. About 17.2% of the population was below the poverty line.
Common Questions
What is Per Capita Income in Greenwood?
Per Capita income in Greenwood is $21,399.
What is the Median Family Income in Greenwood?
Median Family Income in Greenwood is $47,910.
What is the Median Household income in Greenwood?
Median Household Income in Greenwood is $38,884.
What is Income or Wage Gap in Greenwood?
Income or Wage Gap in Greenwood is 20.7%.
Women in Greenwood earn 79.3 cents for every dollar earned by a man.
What is Inequality or Gini Index in Greenwood?
Inequality or Gini Index in Greenwood is 0.44.
What is the Total Population of Greenwood?
Total Population of Greenwood is 22,528.
What is the Total Male Population of Greenwood?
Total Male Population of Greenwood is 10,451.
What is the Total Female Population of Greenwood?
Total Female Population of Greenwood is 12,077.
What is the Ratio of Males per 100 Females in Greenwood?
There are 86.54 Males per 100 Females in Greenwood.
What is the Ratio of Females per 100 Males in Greenwood?
There are 115.56 Females per 100 Males in Greenwood.
What is the Median Population Age in Greenwood?
Median Population Age in Greenwood is 32.7 Years.
What is the Average Family Size in Greenwood
Average Family Size in Greenwood is 3.4 People.
What is the Average Household Size in Greenwood
Average Household Size in Greenwood is 2.3 People.
How Large is the Labor Force in Greenwood?
There are 9,650 People in the Labor Forcein in Greenwood.
What is the Percentage of People in the Labor Force in Greenwood?
55.0% of People are in the Labor Force in Greenwood.
What is the Unemployment Rate in Greenwood?
Unemployment Rate in Greenwood is 7.3%.