Cities with the Highest Percentage of Zimbabwean Population in the United States
RELATED REPORTS & OPTIONS
Zimbabwean
United States
Compare Cities
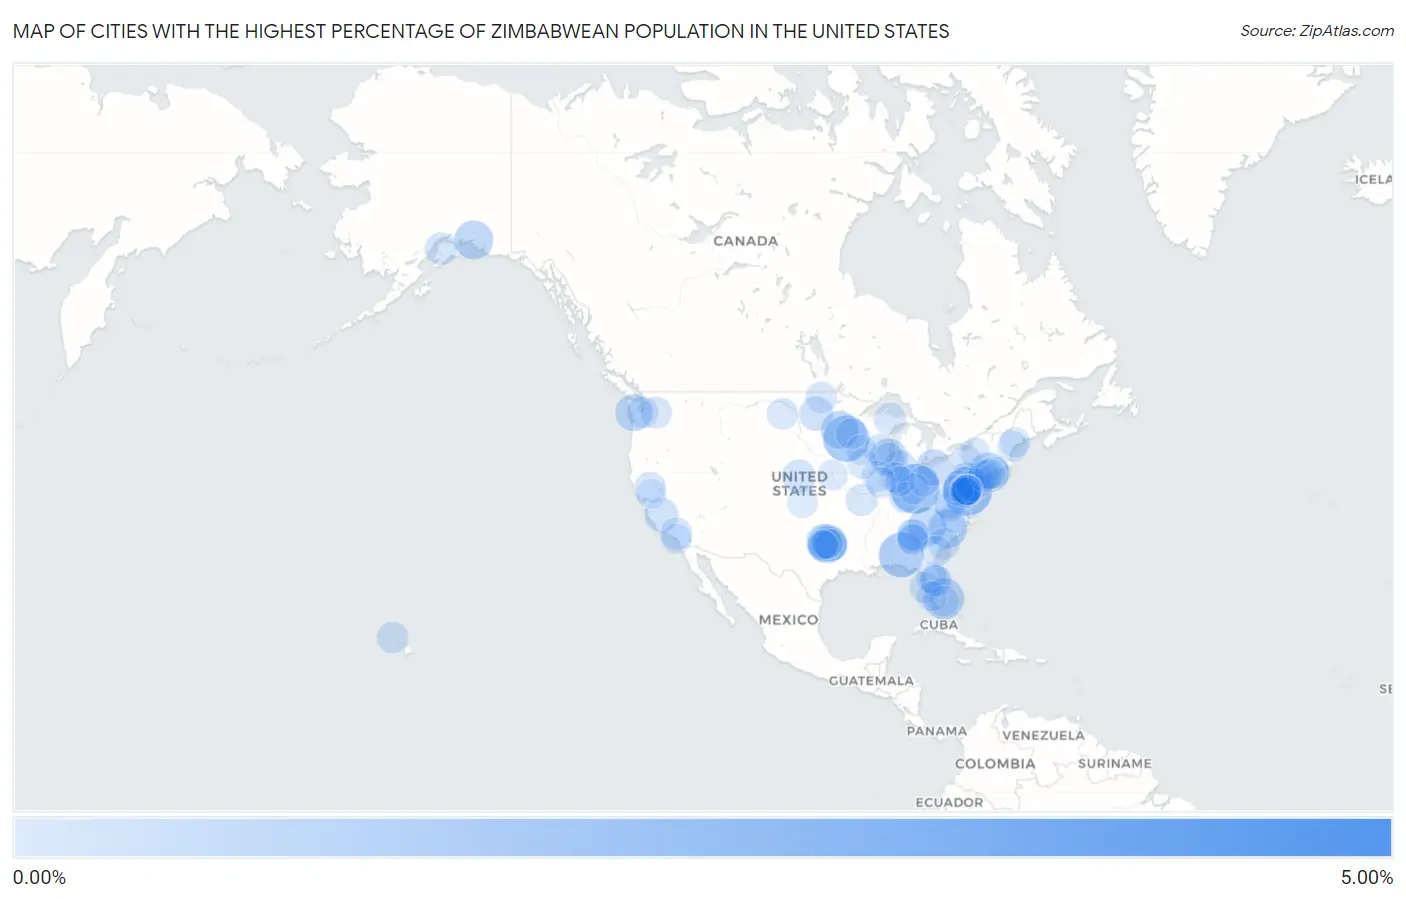
Map of Cities with the Highest Percentage of Zimbabwean Population in the United States
0.00%
5.00%
Cities with the Highest Percentage of Zimbabwean Population in the United States
| City | Zimbabwean | vs State | vs National | |
| 1. | Rio Rancho Estates | 4.62% | 0.0068%(+4.61)#1 | 0.0038%(+4.61)#1 |
| 2. | Ambler Borough | 3.04% | 0.0022%(+3.04)#1 | 0.0038%(+3.04)#2 |
| 3. | Loveland | 2.00% | 0.0047%(+2.00)#1 | 0.0038%(+2.00)#3 |
| 4. | Glenn Dale | 1.93% | 0.019%(+1.91)#1 | 0.0038%(+1.92)#4 |
| 5. | Henderson | 1.67% | 0.0019%(+1.67)#1 | 0.0038%(+1.67)#5 |
| 6. | Honeygo | 1.58% | 0.019%(+1.56)#2 | 0.0038%(+1.57)#6 |
| 7. | Glenwood | 1.52% | 0.00020%(+1.52)#1 | 0.0038%(+1.52)#7 |
| 8. | Lighthouse Point | 1.11% | 0.0044%(+1.11)#1 | 0.0038%(+1.11)#8 |
| 9. | Tuckahoe | 1.04% | 0.0026%(+1.04)#1 | 0.0038%(+1.04)#9 |
| 10. | Valdez | 0.94% | 0.015%(+0.925)#1 | 0.0038%(+0.936)#10 |
| 11. | Gibson | 0.94% | 0.0036%(+0.933)#1 | 0.0038%(+0.933)#11 |
| 12. | Sachse | 0.91% | 0.0076%(+0.902)#1 | 0.0038%(+0.905)#12 |
| 13. | Tigerville | 0.90% | 0.0014%(+0.894)#1 | 0.0038%(+0.892)#13 |
| 14. | Paynesville | 0.82% | 0.0019%(+0.820)#2 | 0.0038%(+0.819)#14 |
| 15. | Pleasant Prairie | 0.82% | 0.0031%(+0.816)#1 | 0.0038%(+0.815)#15 |
| 16. | Aberdeen Gardens | 0.73% | 0.0019%(+0.731)#1 | 0.0038%(+0.729)#16 |
| 17. | Richmond Heights | 0.66% | 0.0047%(+0.658)#2 | 0.0038%(+0.659)#17 |
| 18. | Nevada | 0.65% | 0.0076%(+0.643)#2 | 0.0038%(+0.646)#18 |
| 19. | Messiah College | 0.53% | 0.0022%(+0.532)#2 | 0.0038%(+0.530)#19 |
| 20. | Montclair State University | 0.53% | 0.0037%(+0.521)#1 | 0.0038%(+0.521)#20 |
| 21. | Cross Roads | 0.52% | 0.0076%(+0.517)#3 | 0.0038%(+0.521)#21 |
| 22. | Idylwood | 0.48% | 0.0052%(+0.473)#1 | 0.0038%(+0.474)#22 |
| 23. | Valley City | 0.47% | 0.015%(+0.458)#1 | 0.0038%(+0.469)#23 |
| 24. | Greenbelt | 0.46% | 0.019%(+0.440)#3 | 0.0038%(+0.455)#24 |
| 25. | Lemoore Station | 0.44% | 0.0020%(+0.435)#1 | 0.0038%(+0.433)#25 |
| 26. | Curtis | 0.38% | 0.0037%(+0.378)#1 | 0.0038%(+0.378)#26 |
| 27. | Sterling | 0.30% | 0.015%(+0.286)#2 | 0.0038%(+0.297)#27 |
| 28. | Aspen Hill | 0.29% | 0.019%(+0.269)#4 | 0.0038%(+0.284)#28 |
| 29. | Princeton | 0.28% | 0.0076%(+0.274)#4 | 0.0038%(+0.278)#29 |
| 30. | South Bend | 0.28% | 0.0081%(+0.267)#1 | 0.0038%(+0.272)#30 |
| 31. | West Tawakoni | 0.27% | 0.0076%(+0.264)#5 | 0.0038%(+0.268)#31 |
| 32. | Claremont | 0.25% | 0.0020%(+0.247)#2 | 0.0038%(+0.246)#32 |
| 33. | St. Davids | 0.25% | 0.0022%(+0.245)#3 | 0.0038%(+0.243)#33 |
| 34. | Ishpeming | 0.24% | 0.0029%(+0.239)#1 | 0.0038%(+0.238)#34 |
| 35. | Zion | 0.24% | 0.0034%(+0.233)#1 | 0.0038%(+0.232)#35 |
| 36. | Bryn Mawr | 0.24% | 0.0022%(+0.234)#4 | 0.0038%(+0.232)#36 |
| 37. | Fall River | 0.23% | 0.0031%(+0.231)#2 | 0.0038%(+0.230)#37 |
| 38. | East Honolulu | 0.23% | 0.0081%(+0.220)#1 | 0.0038%(+0.224)#38 |
| 39. | Lorton | 0.23% | 0.0052%(+0.222)#2 | 0.0038%(+0.223)#39 |
| 40. | Alafaya | 0.23% | 0.0044%(+0.221)#2 | 0.0038%(+0.221)#40 |
| 41. | Corning | 0.22% | 0.0026%(+0.222)#2 | 0.0038%(+0.221)#41 |
| 42. | Glenmont | 0.22% | 0.019%(+0.204)#5 | 0.0038%(+0.219)#42 |
| 43. | Grafton | 0.22% | 0.015%(+0.201)#2 | 0.0038%(+0.212)#43 |
| 44. | Ellensburg | 0.22% | 0.0019%(+0.214)#2 | 0.0038%(+0.212)#44 |
| 45. | Manassas Park | 0.21% | 0.0052%(+0.205)#3 | 0.0038%(+0.206)#45 |
| 46. | Lexington | 0.20% | 0.0052%(+0.199)#4 | 0.0038%(+0.200)#46 |
| 47. | Fort Lewis | 0.20% | 0.0019%(+0.199)#3 | 0.0038%(+0.197)#47 |
| 48. | Rolla | 0.20% | 0.0016%(+0.198)#1 | 0.0038%(+0.196)#48 |
| 49. | Rocky Point | 0.20% | 0.0026%(+0.194)#3 | 0.0038%(+0.193)#49 |
| 50. | Ladson | 0.20% | 0.0014%(+0.195)#2 | 0.0038%(+0.192)#50 |
| 51. | Kennesaw | 0.19% | 0.0070%(+0.185)#1 | 0.0038%(+0.188)#51 |
| 52. | Grand Prairie | 0.19% | 0.0076%(+0.184)#6 | 0.0038%(+0.187)#52 |
| 53. | St Pete Beach | 0.19% | 0.0044%(+0.187)#3 | 0.0038%(+0.187)#53 |
| 54. | Chillum | 0.19% | 0.019%(+0.171)#6 | 0.0038%(+0.186)#54 |
| 55. | Sandy Springs | 0.17% | 0.0070%(+0.166)#2 | 0.0038%(+0.170)#55 |
| 56. | Indian Hills | 0.17% | 0.00031%(+0.173)#1 | 0.0038%(+0.169)#56 |
| 57. | Dickinson | 0.17% | 0.015%(+0.156)#3 | 0.0038%(+0.167)#57 |
| 58. | Wake Forest | 0.17% | 0.0036%(+0.167)#2 | 0.0038%(+0.167)#58 |
| 59. | Morton | 0.16% | 0.0034%(+0.153)#2 | 0.0038%(+0.153)#59 |
| 60. | Forest | 0.16% | 0.0052%(+0.151)#5 | 0.0038%(+0.152)#60 |
| 61. | Peachtree City | 0.15% | 0.0070%(+0.144)#3 | 0.0038%(+0.147)#61 |
| 62. | Martinsburg | 0.15% | 0.0055%(+0.144)#1 | 0.0038%(+0.146)#62 |
| 63. | Haworth Borough | 0.15% | 0.0037%(+0.146)#2 | 0.0038%(+0.146)#63 |
| 64. | Lady Lake | 0.15% | 0.0044%(+0.145)#4 | 0.0038%(+0.146)#64 |
| 65. | Pepperdine University | 0.15% | 0.0020%(+0.144)#3 | 0.0038%(+0.142)#65 |
| 66. | Wheaton | 0.15% | 0.019%(+0.127)#7 | 0.0038%(+0.142)#66 |
| 67. | Fairburn | 0.15% | 0.0070%(+0.139)#4 | 0.0038%(+0.142)#67 |
| 68. | Palermo | 0.15% | 0.0020%(+0.143)#4 | 0.0038%(+0.141)#68 |
| 69. | Blue Ash | 0.14% | 0.0047%(+0.138)#3 | 0.0038%(+0.139)#69 |
| 70. | Stephens City | 0.14% | 0.0052%(+0.137)#6 | 0.0038%(+0.139)#70 |
| 71. | Tysons | 0.14% | 0.0052%(+0.136)#7 | 0.0038%(+0.137)#71 |
| 72. | Falcon Heights | 0.13% | 0.0019%(+0.132)#3 | 0.0038%(+0.130)#72 |
| 73. | West Lafayette | 0.13% | 0.0081%(+0.119)#2 | 0.0038%(+0.123)#73 |
| 74. | Pooler | 0.13% | 0.0070%(+0.119)#5 | 0.0038%(+0.122)#74 |
| 75. | Altamonte Springs | 0.12% | 0.0044%(+0.120)#5 | 0.0038%(+0.121)#75 |
| 76. | Bel Air North | 0.12% | 0.019%(+0.103)#8 | 0.0038%(+0.118)#76 |
| 77. | Martinsville | 0.12% | 0.0037%(+0.118)#3 | 0.0038%(+0.117)#77 |
| 78. | Decatur | 0.11% | 0.0034%(+0.109)#3 | 0.0038%(+0.109)#78 |
| 79. | Ives Estates | 0.11% | 0.0044%(+0.107)#6 | 0.0038%(+0.108)#79 |
| 80. | Minerva Park | 0.11% | 0.0047%(+0.101)#4 | 0.0038%(+0.102)#80 |
| 81. | Cedar Rapids | 0.10% | 0.0047%(+0.100)#1 | 0.0038%(+0.101)#81 |
| 82. | Hoboken | 0.10% | 0.0037%(+0.100)#4 | 0.0038%(+0.100)#82 |
| 83. | Great Neck | 0.099% | 0.0026%(+0.097)#4 | 0.0038%(+0.096)#83 |
| 84. | Gorham | 0.099% | 0.0029%(+0.096)#1 | 0.0038%(+0.095)#84 |
| 85. | Decorah | 0.092% | 0.0047%(+0.087)#2 | 0.0038%(+0.088)#85 |
| 86. | Wylie | 0.091% | 0.0076%(+0.084)#7 | 0.0038%(+0.087)#86 |
| 87. | North Richland Hills | 0.088% | 0.0076%(+0.081)#8 | 0.0038%(+0.085)#87 |
| 88. | Canastota | 0.088% | 0.0026%(+0.085)#5 | 0.0038%(+0.084)#88 |
| 89. | Dodge City | 0.083% | 0.0011%(+0.082)#1 | 0.0038%(+0.079)#89 |
| 90. | Nebraska City | 0.083% | 0.0037%(+0.079)#2 | 0.0038%(+0.079)#90 |
| 91. | South Laurel | 0.081% | 0.019%(+0.062)#9 | 0.0038%(+0.077)#91 |
| 92. | Cliffside Park Borough | 0.078% | 0.0037%(+0.075)#5 | 0.0038%(+0.074)#92 |
| 93. | Falls Church | 0.075% | 0.0052%(+0.070)#8 | 0.0038%(+0.072)#93 |
| 94. | Zionsville | 0.075% | 0.0081%(+0.067)#3 | 0.0038%(+0.071)#94 |
| 95. | Lewiston | 0.072% | 0.0029%(+0.069)#2 | 0.0038%(+0.068)#95 |
| 96. | Fairland | 0.069% | 0.019%(+0.050)#10 | 0.0038%(+0.065)#96 |
| 97. | Fort Myers | 0.069% | 0.0044%(+0.064)#7 | 0.0038%(+0.065)#97 |
| 98. | Athens-Clarke County Unified Government (Balance) | 0.068% | 0.0070%(+0.061)#6 | 0.0038%(+0.064)#98 |
| 99. | Laguna Hills | 0.067% | 0.0020%(+0.065)#5 | 0.0038%(+0.064)#99 |
| 100. | Antelope | 0.067% | 0.0020%(+0.065)#6 | 0.0038%(+0.063)#100 |
Common Questions
What are the Top 10 Cities with the Highest Percentage of Zimbabwean Population in the United States?
Top 10 Cities with the Highest Percentage of Zimbabwean Population in the United States are:
What city has the Highest Percentage of Zimbabwean Population in the United States?
Loveland has the Highest Percentage of Zimbabwean Population in the United States with 2.00%.
What is the Percentage of Zimbabwean Population in the United States?
Percentage of Zimbabwean Population in the United States is 0.0038%.