Taylors, SC Map & Demographics
Taylors Map
Taylors Overview
$33,981
PER CAPITA INCOME
$82,037
AVG FAMILY INCOME
$70,234
AVG HOUSEHOLD INCOME
22.4%
WAGE / INCOME GAP [ % ]
77.6¢/ $1
WAGE / INCOME GAP [ $ ]
0.37
INEQUALITY / GINI INDEX
23,005
TOTAL POPULATION
11,261
MALE POPULATION
11,744
FEMALE POPULATION
95.89
MALES / 100 FEMALES
104.29
FEMALES / 100 MALES
38.1
MEDIAN AGE
3.0
AVG FAMILY SIZE
2.5
AVG HOUSEHOLD SIZE
12,558
LABOR FORCE [ PEOPLE ]
68.4%
PERCENT IN LABOR FORCE
4.8%
UNEMPLOYMENT RATE
Taylors Zip Codes
Taylors Area Codes
Income in Taylors
Income Overview in Taylors
Per Capita Income in Taylors is $33,981, while median incomes of families and households are $82,037 and $70,234 respectively.
| Characteristic | Number | Measure |
| Per Capita Income | 23,005 | $33,981 |
| Median Family Income | 6,533 | $82,037 |
| Mean Family Income | 6,533 | $92,462 |
| Median Household Income | 9,087 | $70,234 |
| Mean Household Income | 9,087 | $84,383 |
| Income Deficit | 6,533 | $0 |
| Wage / Income Gap (%) | 23,005 | 22.37% |
| Wage / Income Gap ($) | 23,005 | 77.63¢ per $1 |
| Gini / Inequality Index | 23,005 | 0.37 |
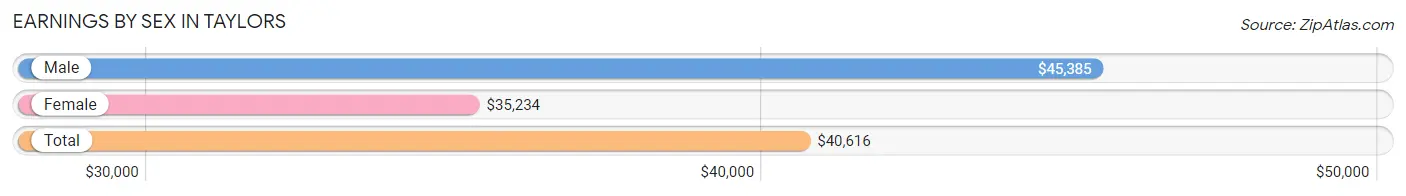
Earnings by Sex in Taylors
Average Earnings in Taylors are $40,616, $45,385 for men and $35,234 for women, a difference of 22.4%.
| Sex | Number | Average Earnings |
| Male | 7,246 (54.3%) | $45,385 |
| Female | 6,088 (45.7%) | $35,234 |
| Total | 13,334 (100.0%) | $40,616 |
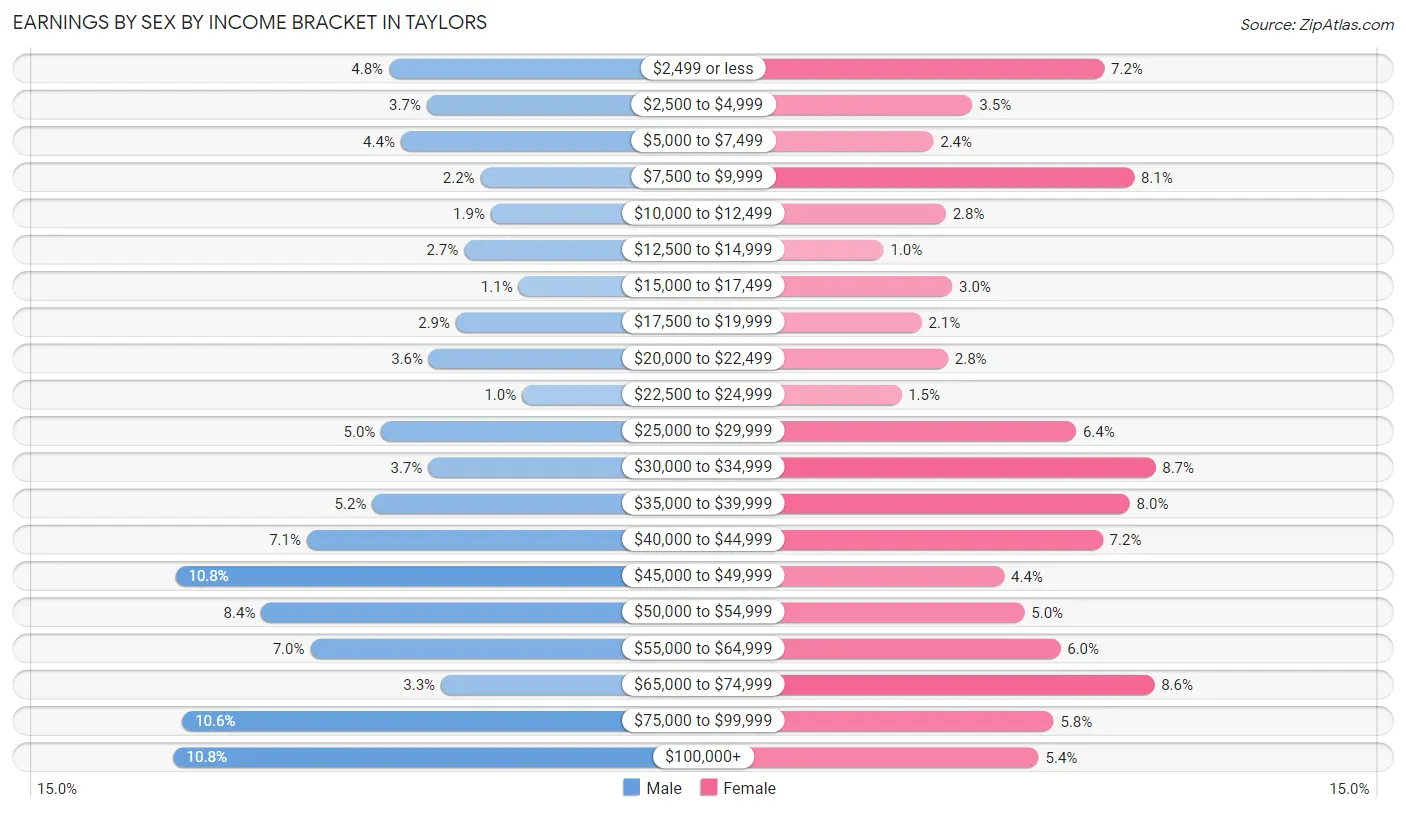
Earnings by Sex by Income Bracket in Taylors
The most common earnings brackets in Taylors are $100,000+ for men (783 | 10.8%) and $30,000 to $34,999 for women (528 | 8.7%).
| Income | Male | Female |
| $2,499 or less | 345 (4.8%) | 440 (7.2%) |
| $2,500 to $4,999 | 268 (3.7%) | 215 (3.5%) |
| $5,000 to $7,499 | 321 (4.4%) | 148 (2.4%) |
| $7,500 to $9,999 | 159 (2.2%) | 491 (8.1%) |
| $10,000 to $12,499 | 138 (1.9%) | 169 (2.8%) |
| $12,500 to $14,999 | 192 (2.6%) | 63 (1.0%) |
| $15,000 to $17,499 | 81 (1.1%) | 180 (3.0%) |
| $17,500 to $19,999 | 209 (2.9%) | 128 (2.1%) |
| $20,000 to $22,499 | 264 (3.6%) | 173 (2.8%) |
| $22,500 to $24,999 | 74 (1.0%) | 93 (1.5%) |
| $25,000 to $29,999 | 361 (5.0%) | 392 (6.4%) |
| $30,000 to $34,999 | 265 (3.7%) | 528 (8.7%) |
| $35,000 to $39,999 | 379 (5.2%) | 484 (8.0%) |
| $40,000 to $44,999 | 512 (7.1%) | 438 (7.2%) |
| $45,000 to $49,999 | 780 (10.8%) | 269 (4.4%) |
| $50,000 to $54,999 | 605 (8.4%) | 304 (5.0%) |
| $55,000 to $64,999 | 505 (7.0%) | 365 (6.0%) |
| $65,000 to $74,999 | 239 (3.3%) | 526 (8.6%) |
| $75,000 to $99,999 | 766 (10.6%) | 354 (5.8%) |
| $100,000+ | 783 (10.8%) | 328 (5.4%) |
| Total | 7,246 (100.0%) | 6,088 (100.0%) |
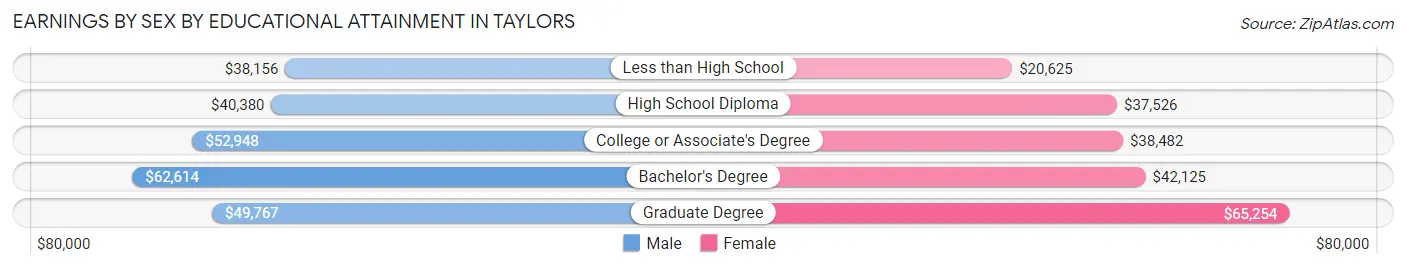
Earnings by Sex by Educational Attainment in Taylors
Average earnings in Taylors are $49,758 for men and $40,648 for women, a difference of 18.3%. Men with an educational attainment of bachelor's degree enjoy the highest average annual earnings of $62,614, while those with less than high school education earn the least with $38,156. Women with an educational attainment of graduate degree earn the most with the average annual earnings of $65,254, while those with less than high school education have the smallest earnings of $20,625.
| Educational Attainment | Male Income | Female Income |
| Less than High School | $38,156 | $20,625 |
| High School Diploma | $40,380 | $37,526 |
| College or Associate's Degree | $52,948 | $38,482 |
| Bachelor's Degree | $62,614 | $42,125 |
| Graduate Degree | $49,767 | $65,254 |
| Total | $49,758 | $40,648 |
Family Income in Taylors
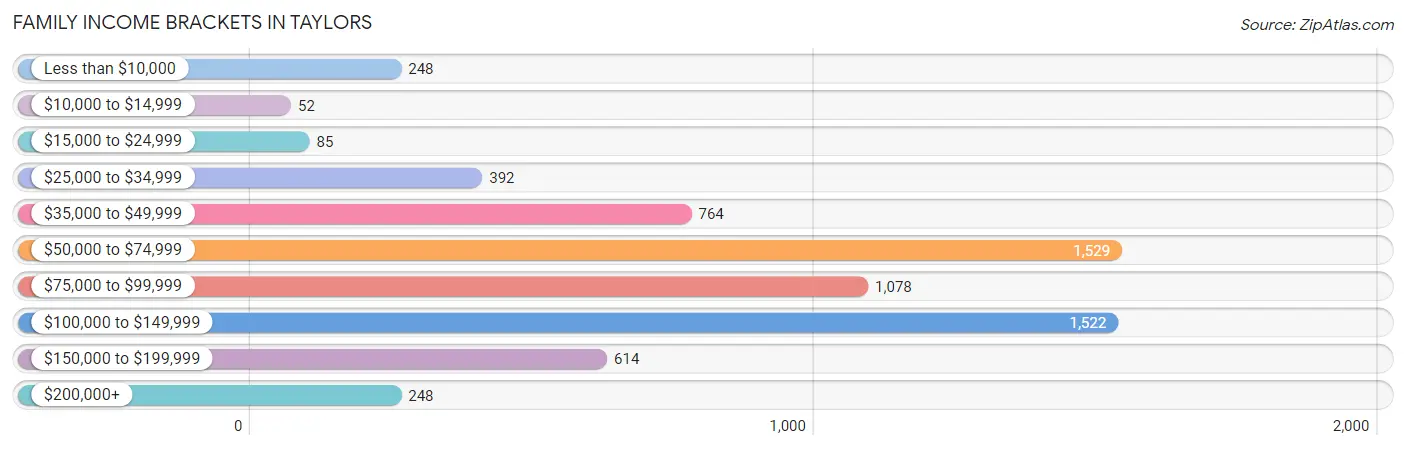
Family Income Brackets in Taylors
According to the Taylors family income data, there are 1,529 families falling into the $50,000 to $74,999 income range, which is the most common income bracket and makes up 23.4% of all families. Conversely, the $10,000 to $14,999 income bracket is the least frequent group with only 52 families (0.8%) belonging to this category.
| Income Bracket | # Families | % Families |
| Less than $10,000 | 248 | 3.8% |
| $10,000 to $14,999 | 52 | 0.8% |
| $15,000 to $24,999 | 85 | 1.3% |
| $25,000 to $34,999 | 392 | 6.0% |
| $35,000 to $49,999 | 764 | 11.7% |
| $50,000 to $74,999 | 1,529 | 23.4% |
| $75,000 to $99,999 | 1,078 | 16.5% |
| $100,000 to $149,999 | 1,522 | 23.3% |
| $150,000 to $199,999 | 614 | 9.4% |
| $200,000+ | 248 | 3.8% |
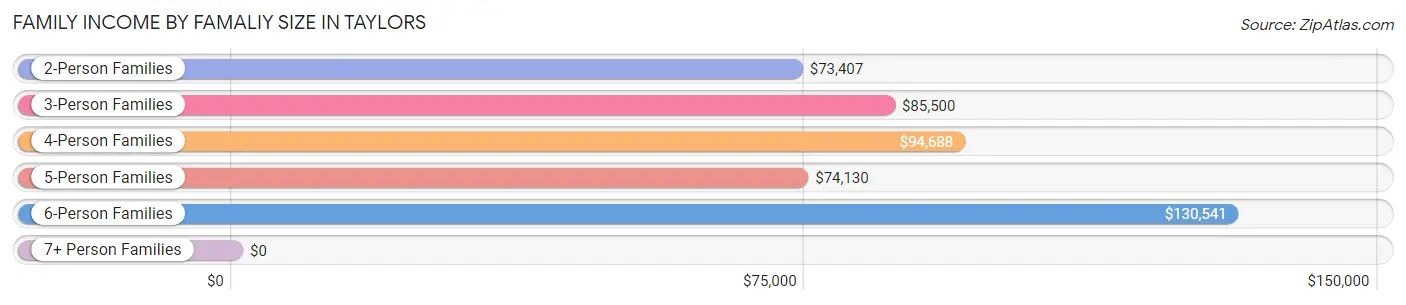
Family Income by Famaliy Size in Taylors
6-person families (162 | 2.5%) account for the highest median family income in Taylors with $130,541 per family, while 2-person families (3,029 | 46.4%) have the highest median income of $36,704 per family member.
| Income Bracket | # Families | Median Income |
| 2-Person Families | 3,029 (46.4%) | $73,407 |
| 3-Person Families | 1,602 (24.5%) | $85,500 |
| 4-Person Families | 1,322 (20.2%) | $94,688 |
| 5-Person Families | 402 (6.1%) | $74,130 |
| 6-Person Families | 162 (2.5%) | $130,541 |
| 7+ Person Families | 16 (0.2%) | $0 |
| Total | 6,533 (100.0%) | $82,037 |
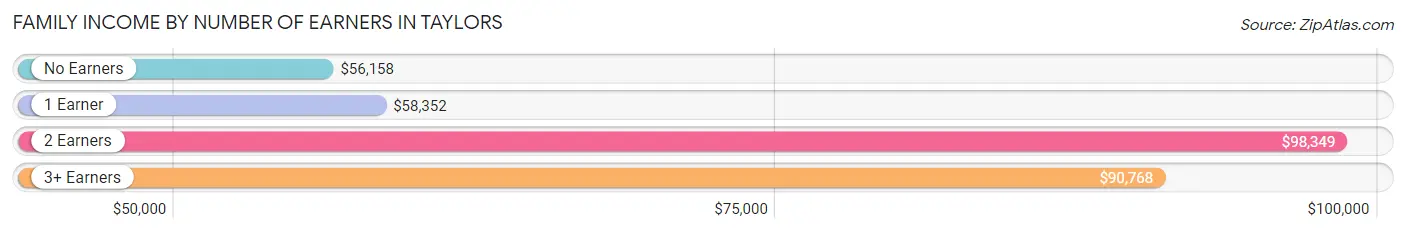
Family Income by Number of Earners in Taylors
The median family income in Taylors is $82,037, with families comprising 2 earners (2,760) having the highest median family income of $98,349, while families with no earners (755) have the lowest median family income of $56,158, accounting for 42.2% and 11.6% of families, respectively.
| Number of Earners | # Families | Median Income |
| No Earners | 755 (11.6%) | $56,158 |
| 1 Earner | 2,077 (31.8%) | $58,352 |
| 2 Earners | 2,760 (42.2%) | $98,349 |
| 3+ Earners | 941 (14.4%) | $90,768 |
| Total | 6,533 (100.0%) | $82,037 |
Household Income in Taylors
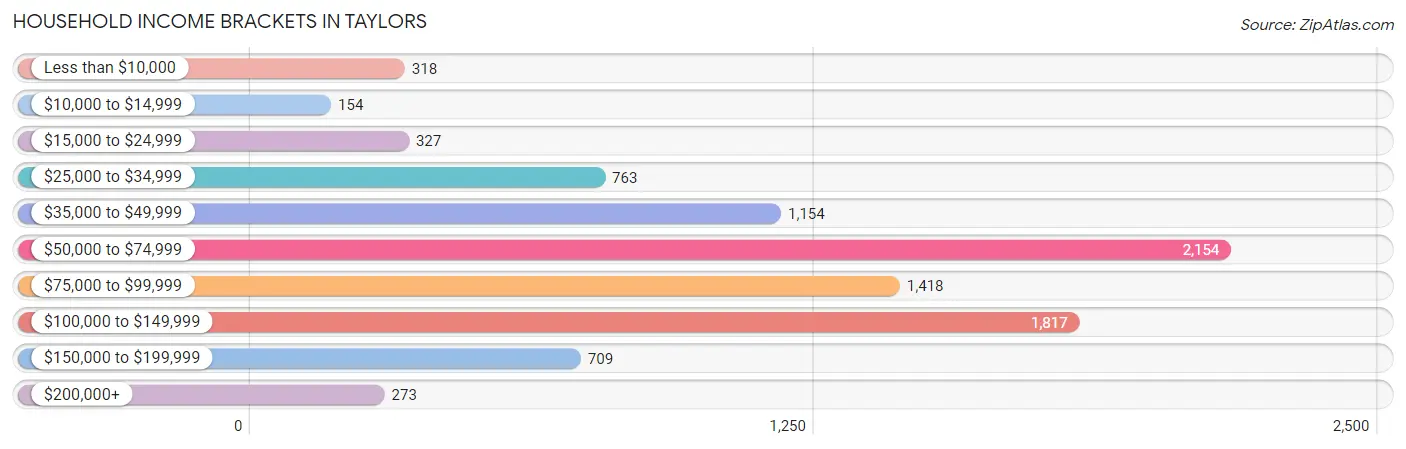
Household Income Brackets in Taylors
With 2,154 households falling in the category, the $50,000 to $74,999 income range is the most frequent in Taylors, accounting for 23.7% of all households. In contrast, only 154 households (1.7%) fall into the $10,000 to $14,999 income bracket, making it the least populous group.
| Income Bracket | # Households | % Households |
| Less than $10,000 | 318 | 3.5% |
| $10,000 to $14,999 | 154 | 1.7% |
| $15,000 to $24,999 | 327 | 3.6% |
| $25,000 to $34,999 | 763 | 8.4% |
| $35,000 to $49,999 | 1,154 | 12.7% |
| $50,000 to $74,999 | 2,154 | 23.7% |
| $75,000 to $99,999 | 1,418 | 15.6% |
| $100,000 to $149,999 | 1,817 | 20.0% |
| $150,000 to $199,999 | 709 | 7.8% |
| $200,000+ | 273 | 3.0% |
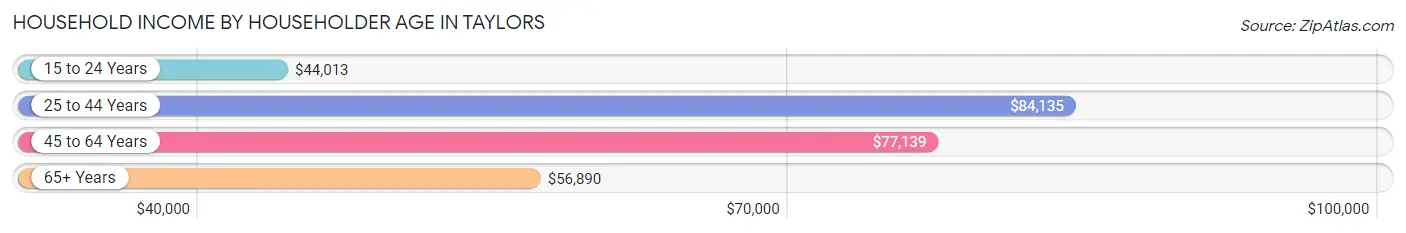
Household Income by Householder Age in Taylors
The median household income in Taylors is $70,234, with the highest median household income of $84,135 found in the 25 to 44 years age bracket for the primary householder. A total of 3,081 households (33.9%) fall into this category. Meanwhile, the 15 to 24 years age bracket for the primary householder has the lowest median household income of $44,013, with 337 households (3.7%) in this group.
| Income Bracket | # Households | Median Income |
| 15 to 24 Years | 337 (3.7%) | $44,013 |
| 25 to 44 Years | 3,081 (33.9%) | $84,135 |
| 45 to 64 Years | 3,315 (36.5%) | $77,139 |
| 65+ Years | 2,354 (25.9%) | $56,890 |
| Total | 9,087 (100.0%) | $70,234 |
Poverty in Taylors
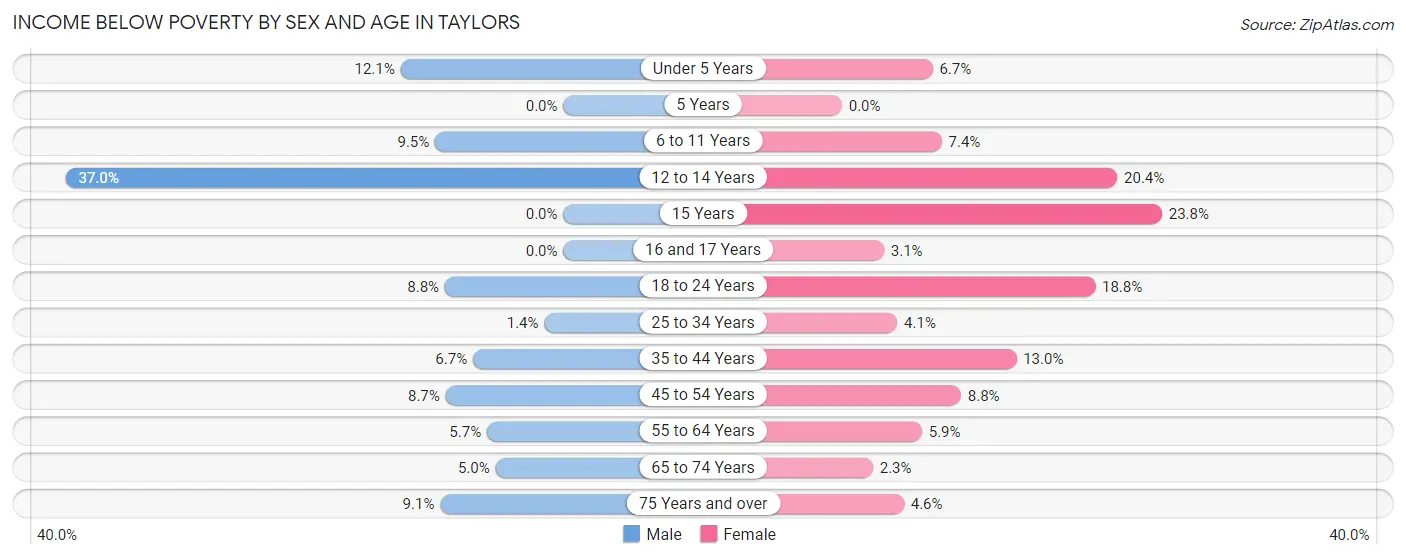
Income Below Poverty by Sex and Age in Taylors
With 7.9% poverty level for males and 8.4% for females among the residents of Taylors, 12 to 14 year old males and 15 year old females are the most vulnerable to poverty, with 129 males (37.0%) and 24 females (23.8%) in their respective age groups living below the poverty level.
| Age Bracket | Male | Female |
| Under 5 Years | 139 (12.1%) | 48 (6.7%) |
| 5 Years | 0 (0.0%) | 0 (0.0%) |
| 6 to 11 Years | 57 (9.5%) | 68 (7.4%) |
| 12 to 14 Years | 129 (37.0%) | 74 (20.4%) |
| 15 Years | 0 (0.0%) | 24 (23.8%) |
| 16 and 17 Years | 0 (0.0%) | 9 (3.1%) |
| 18 to 24 Years | 142 (8.8%) | 200 (18.8%) |
| 25 to 34 Years | 16 (1.4%) | 66 (4.1%) |
| 35 to 44 Years | 105 (6.7%) | 222 (13.0%) |
| 45 to 54 Years | 108 (8.7%) | 126 (8.8%) |
| 55 to 64 Years | 84 (5.7%) | 77 (5.9%) |
| 65 to 74 Years | 39 (5.0%) | 29 (2.3%) |
| 75 Years and over | 72 (9.1%) | 39 (4.6%) |
| Total | 891 (7.9%) | 982 (8.4%) |
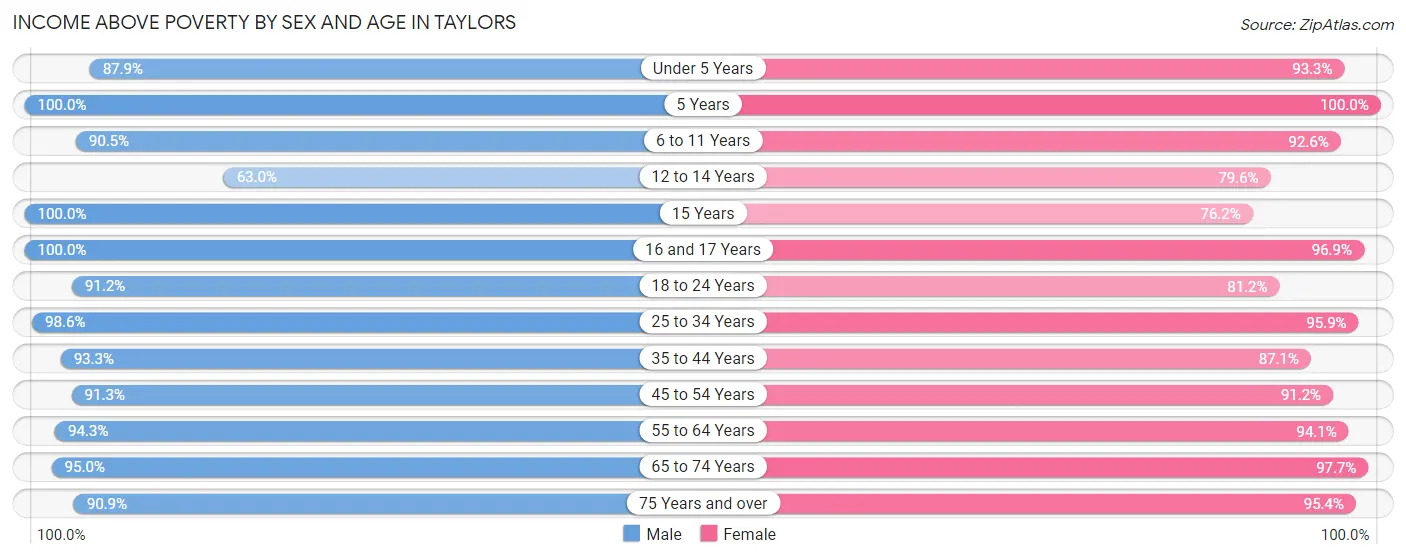
Income Above Poverty by Sex and Age in Taylors
According to the poverty statistics in Taylors, males aged 5 years and females aged 5 years are the age groups that are most secure financially, with 100.0% of males and 100.0% of females in these age groups living above the poverty line.
| Age Bracket | Male | Female |
| Under 5 Years | 1,011 (87.9%) | 665 (93.3%) |
| 5 Years | 159 (100.0%) | 123 (100.0%) |
| 6 to 11 Years | 542 (90.5%) | 850 (92.6%) |
| 12 to 14 Years | 220 (63.0%) | 288 (79.6%) |
| 15 Years | 156 (100.0%) | 77 (76.2%) |
| 16 and 17 Years | 247 (100.0%) | 279 (96.9%) |
| 18 to 24 Years | 1,473 (91.2%) | 864 (81.2%) |
| 25 to 34 Years | 1,119 (98.6%) | 1,538 (95.9%) |
| 35 to 44 Years | 1,459 (93.3%) | 1,492 (87.1%) |
| 45 to 54 Years | 1,127 (91.3%) | 1,300 (91.2%) |
| 55 to 64 Years | 1,398 (94.3%) | 1,219 (94.1%) |
| 65 to 74 Years | 737 (95.0%) | 1,234 (97.7%) |
| 75 Years and over | 716 (90.9%) | 808 (95.4%) |
| Total | 10,364 (92.1%) | 10,737 (91.6%) |
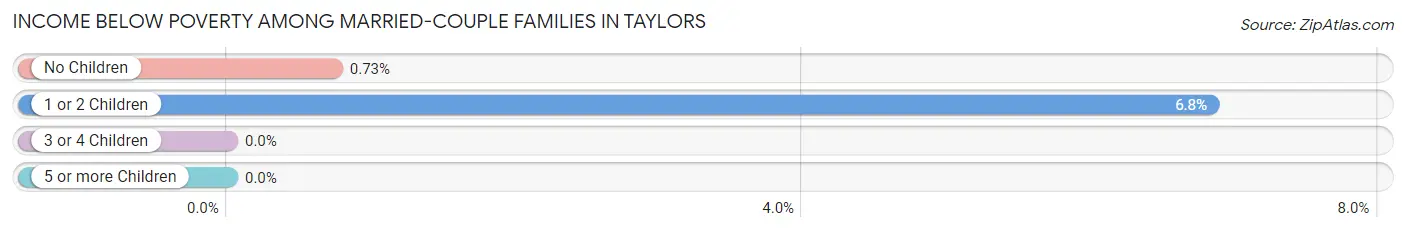
Income Below Poverty Among Married-Couple Families in Taylors
The poverty statistics for married-couple families in Taylors show that 3.1% or 141 of the total 4,499 families live below the poverty line. Families with 1 or 2 children have the highest poverty rate of 6.8%, comprising of 124 families. On the other hand, families with 3 or 4 children have the lowest poverty rate of 0.0%, which includes 0 families.
| Children | Above Poverty | Below Poverty |
| No Children | 2,297 (99.3%) | 17 (0.7%) |
| 1 or 2 Children | 1,691 (93.2%) | 124 (6.8%) |
| 3 or 4 Children | 354 (100.0%) | 0 (0.0%) |
| 5 or more Children | 16 (100.0%) | 0 (0.0%) |
| Total | 4,358 (96.9%) | 141 (3.1%) |
Income Below Poverty Among Single-Parent Households in Taylors
According to the poverty data in Taylors, 10.7% or 67 single-father households and 16.9% or 238 single-mother households are living below the poverty line. Among single-father households, those with 3 or 4 children have the highest poverty rate, with 59 households (100.0%) experiencing poverty. Likewise, among single-mother households, those with 3 or 4 children have the highest poverty rate, with 25 households (39.1%) falling below the poverty line.
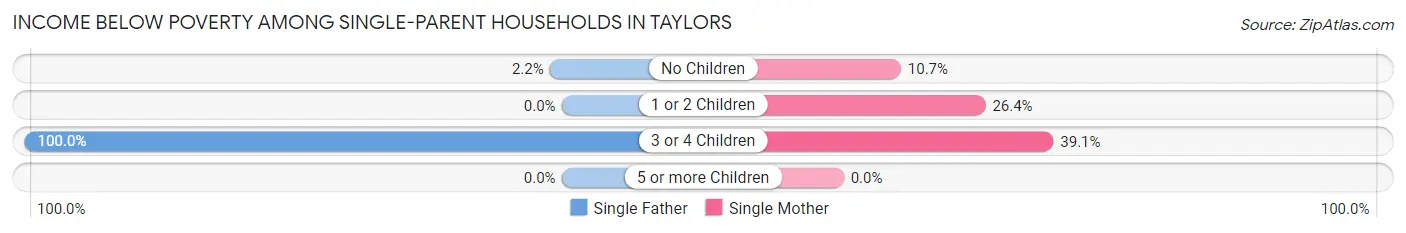
| Children | Single Father | Single Mother |
| No Children | 8 (2.2%) | 96 (10.6%) |
| 1 or 2 Children | 0 (0.0%) | 117 (26.4%) |
| 3 or 4 Children | 59 (100.0%) | 25 (39.1%) |
| 5 or more Children | 0 (0.0%) | 0 (0.0%) |
| Total | 67 (10.7%) | 238 (16.9%) |
Income Below Poverty Among Married-Couple vs Single-Parent Households in Taylors
The poverty data for Taylors shows that 141 of the married-couple family households (3.1%) and 305 of the single-parent households (15.0%) are living below the poverty level. Within the married-couple family households, those with 1 or 2 children have the highest poverty rate, with 124 households (6.8%) falling below the poverty line. Among the single-parent households, those with 3 or 4 children have the highest poverty rate, with 84 household (68.3%) living below poverty.
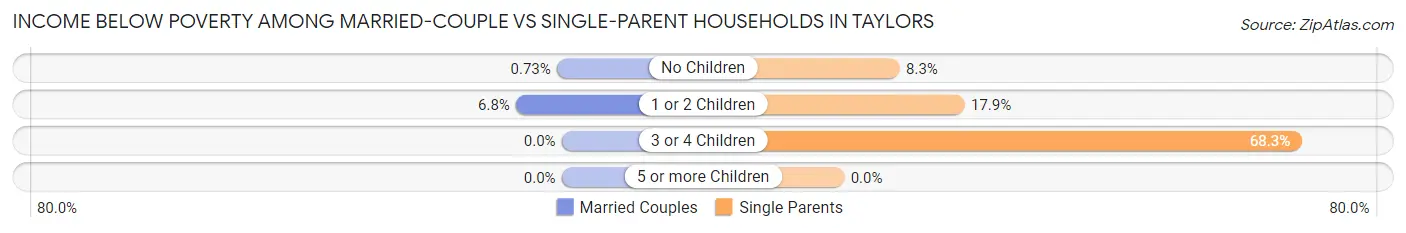
| Children | Married-Couple Families | Single-Parent Households |
| No Children | 17 (0.7%) | 104 (8.3%) |
| 1 or 2 Children | 124 (6.8%) | 117 (17.9%) |
| 3 or 4 Children | 0 (0.0%) | 84 (68.3%) |
| 5 or more Children | 0 (0.0%) | 0 (0.0%) |
| Total | 141 (3.1%) | 305 (15.0%) |
Race in Taylors
The most populous races in Taylors are White / Caucasian (17,088 | 74.3%), Hispanic or Latino (2,671 | 11.6%), and Black / African American (2,390 | 10.4%).
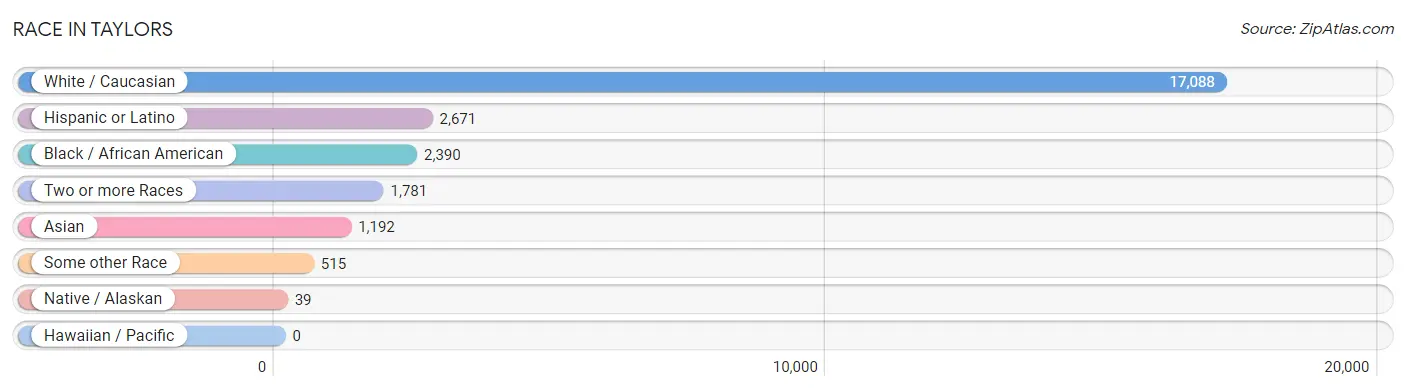
| Race | # Population | % Population |
| Asian | 1,192 | 5.2% |
| Black / African American | 2,390 | 10.4% |
| Hawaiian / Pacific | 0 | 0.0% |
| Hispanic or Latino | 2,671 | 11.6% |
| Native / Alaskan | 39 | 0.2% |
| White / Caucasian | 17,088 | 74.3% |
| Two or more Races | 1,781 | 7.7% |
| Some other Race | 515 | 2.2% |
| Total | 23,005 | 100.0% |
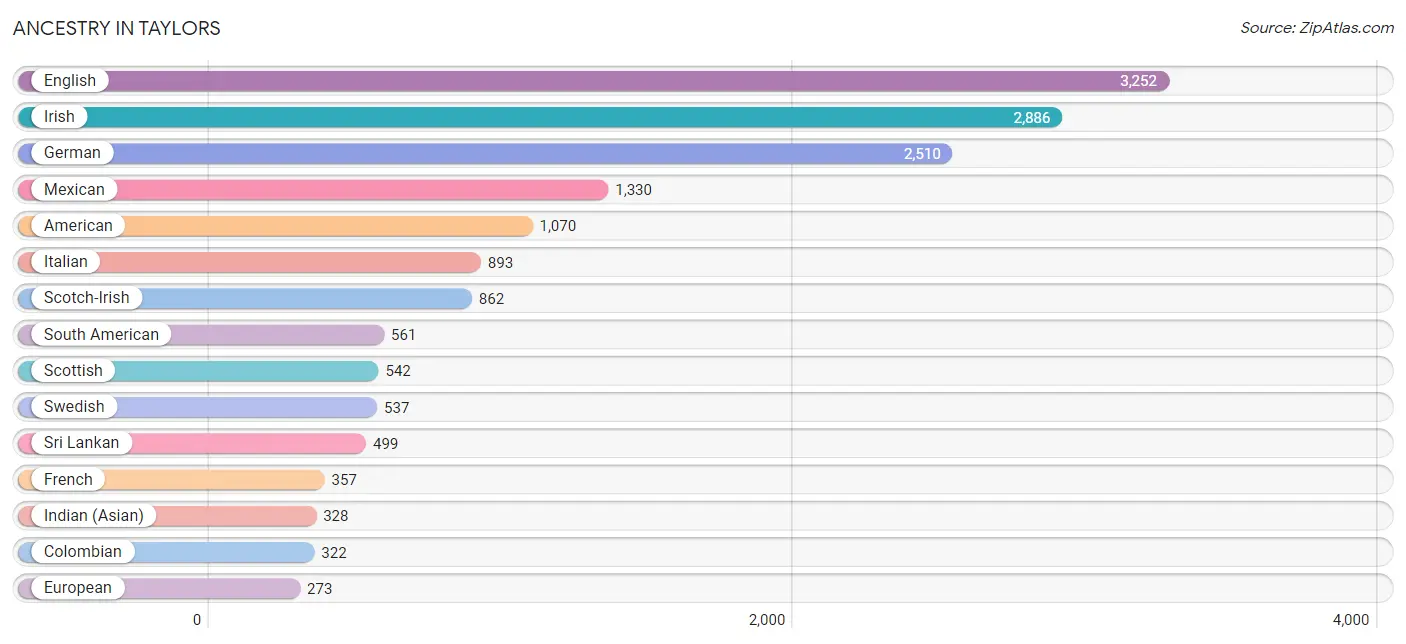
Ancestry in Taylors
The most populous ancestries reported in Taylors are English (3,252 | 14.1%), Irish (2,886 | 12.6%), German (2,510 | 10.9%), Mexican (1,330 | 5.8%), and American (1,070 | 4.6%), together accounting for 48.0% of all Taylors residents.
| Ancestry | # Population | % Population |
| African | 148 | 0.6% |
| American | 1,070 | 4.6% |
| Arab | 46 | 0.2% |
| Armenian | 30 | 0.1% |
| Austrian | 61 | 0.3% |
| Bhutanese | 172 | 0.7% |
| British | 194 | 0.8% |
| Burmese | 46 | 0.2% |
| Cajun | 19 | 0.1% |
| Canadian | 18 | 0.1% |
| Central American | 99 | 0.4% |
| Cherokee | 71 | 0.3% |
| Colombian | 322 | 1.4% |
| Costa Rican | 9 | 0.0% |
| Croatian | 229 | 1.0% |
| Cuban | 241 | 1.1% |
| Czech | 57 | 0.3% |
| Danish | 7 | 0.0% |
| Dominican | 174 | 0.8% |
| Dutch | 165 | 0.7% |
| Eastern European | 76 | 0.3% |
| Ecuadorian | 36 | 0.2% |
| English | 3,252 | 14.1% |
| European | 273 | 1.2% |
| Finnish | 49 | 0.2% |
| French | 357 | 1.5% |
| French Canadian | 255 | 1.1% |
| German | 2,510 | 10.9% |
| Greek | 74 | 0.3% |
| Guatemalan | 17 | 0.1% |
| Haitian | 167 | 0.7% |
| Honduran | 69 | 0.3% |
| Hungarian | 123 | 0.5% |
| Indian (Asian) | 328 | 1.4% |
| Indonesian | 61 | 0.3% |
| Irish | 2,886 | 12.6% |
| Italian | 893 | 3.9% |
| Jamaican | 197 | 0.9% |
| Korean | 177 | 0.8% |
| Latvian | 24 | 0.1% |
| Lebanese | 46 | 0.2% |
| Lithuanian | 10 | 0.0% |
| Lumbee | 11 | 0.1% |
| Mexican | 1,330 | 5.8% |
| Northern European | 271 | 1.2% |
| Norwegian | 56 | 0.2% |
| Peruvian | 136 | 0.6% |
| Polish | 202 | 0.9% |
| Portuguese | 238 | 1.0% |
| Pueblo | 1 | 0.0% |
| Puerto Rican | 171 | 0.7% |
| Russian | 232 | 1.0% |
| Salvadoran | 4 | 0.0% |
| Scandinavian | 18 | 0.1% |
| Scotch-Irish | 862 | 3.7% |
| Scottish | 542 | 2.4% |
| Slavic | 11 | 0.1% |
| Slovak | 117 | 0.5% |
| South American | 561 | 2.4% |
| Spanish | 11 | 0.1% |
| Sri Lankan | 499 | 2.2% |
| Subsaharan African | 148 | 0.6% |
| Swedish | 537 | 2.3% |
| Swiss | 14 | 0.1% |
| Thai | 9 | 0.0% |
| Ukrainian | 15 | 0.1% |
| Uruguayan | 46 | 0.2% |
| Venezuelan | 21 | 0.1% |
| Welsh | 185 | 0.8% | View All 69 Rows |
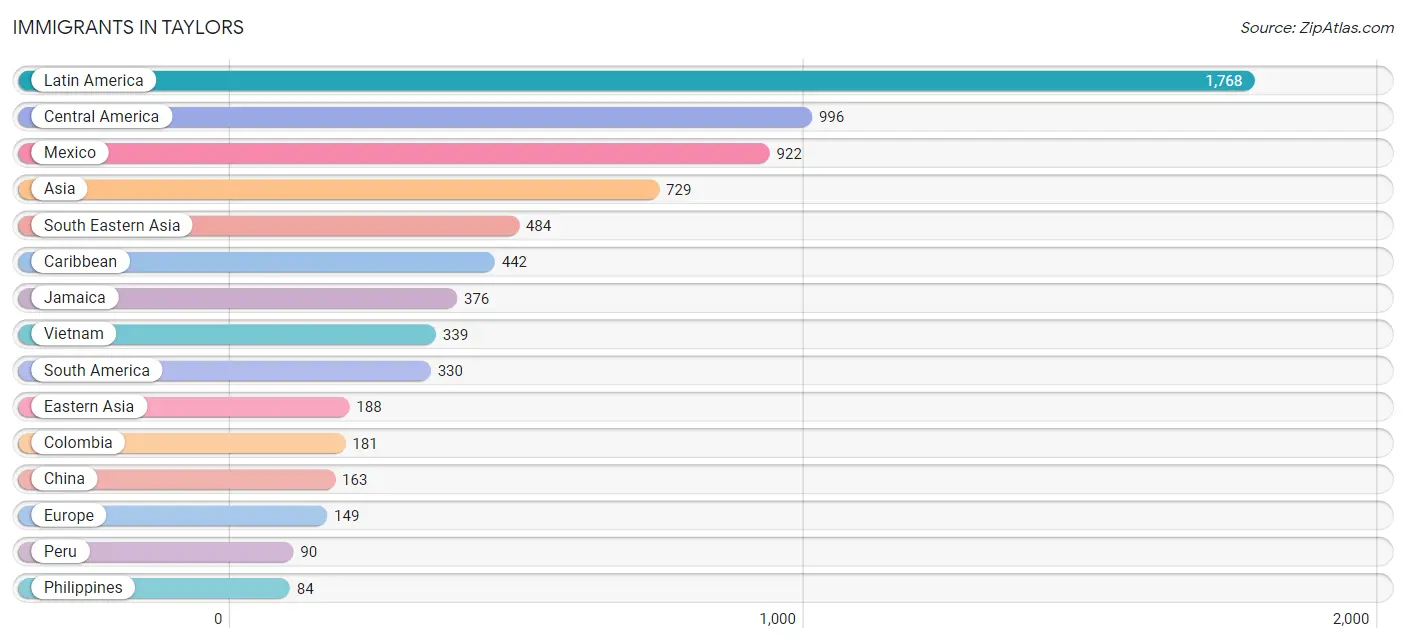
Immigrants in Taylors
The most numerous immigrant groups reported in Taylors came from Latin America (1,768 | 7.7%), Central America (996 | 4.3%), Mexico (922 | 4.0%), Asia (729 | 3.2%), and South Eastern Asia (484 | 2.1%), together accounting for 21.3% of all Taylors residents.
| Immigration Origin | # Population | % Population |
| Asia | 729 | 3.2% |
| Brazil | 13 | 0.1% |
| Canada | 32 | 0.1% |
| Caribbean | 442 | 1.9% |
| Central America | 996 | 4.3% |
| China | 163 | 0.7% |
| Colombia | 181 | 0.8% |
| Cuba | 59 | 0.3% |
| Dominican Republic | 7 | 0.0% |
| Eastern Asia | 188 | 0.8% |
| Eastern Europe | 57 | 0.3% |
| El Salvador | 4 | 0.0% |
| England | 50 | 0.2% |
| Europe | 149 | 0.6% |
| Germany | 2 | 0.0% |
| Guatemala | 28 | 0.1% |
| Honduras | 42 | 0.2% |
| Hong Kong | 6 | 0.0% |
| India | 17 | 0.1% |
| Jamaica | 376 | 1.6% |
| Japan | 25 | 0.1% |
| Latin America | 1,768 | 7.7% |
| Latvia | 35 | 0.2% |
| Malaysia | 9 | 0.0% |
| Mexico | 922 | 4.0% |
| Northern Europe | 76 | 0.3% |
| Norway | 8 | 0.0% |
| Pakistan | 25 | 0.1% |
| Peru | 90 | 0.4% |
| Philippines | 84 | 0.4% |
| South America | 330 | 1.4% |
| South Central Asia | 42 | 0.2% |
| South Eastern Asia | 484 | 2.1% |
| Switzerland | 14 | 0.1% |
| Ukraine | 22 | 0.1% |
| Uruguay | 46 | 0.2% |
| Vietnam | 339 | 1.5% |
| Western Asia | 15 | 0.1% |
| Western Europe | 16 | 0.1% | View All 39 Rows |
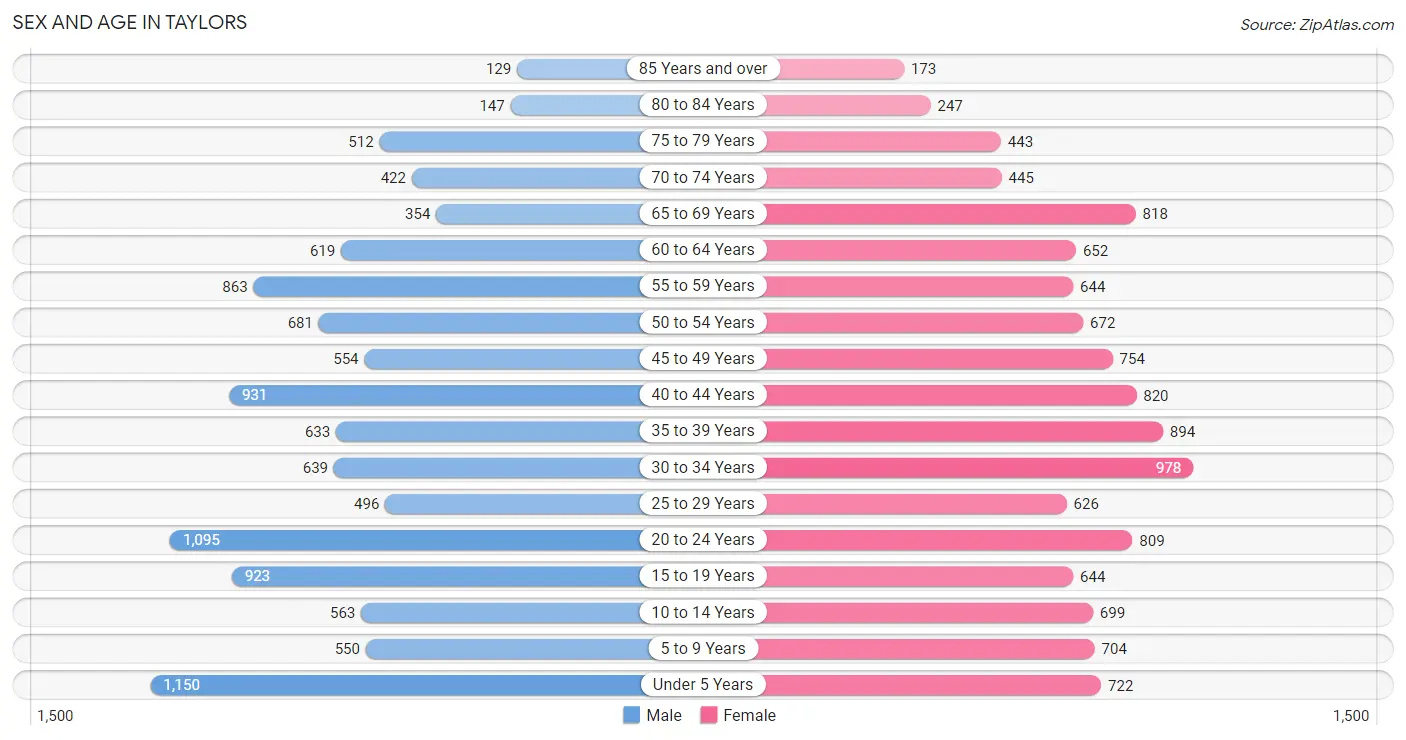
Sex and Age in Taylors
Sex and Age in Taylors
The most populous age groups in Taylors are Under 5 Years (1,150 | 10.2%) for men and 30 to 34 Years (978 | 8.3%) for women.
| Age Bracket | Male | Female |
| Under 5 Years | 1,150 (10.2%) | 722 (6.1%) |
| 5 to 9 Years | 550 (4.9%) | 704 (6.0%) |
| 10 to 14 Years | 563 (5.0%) | 699 (5.9%) |
| 15 to 19 Years | 923 (8.2%) | 644 (5.5%) |
| 20 to 24 Years | 1,095 (9.7%) | 809 (6.9%) |
| 25 to 29 Years | 496 (4.4%) | 626 (5.3%) |
| 30 to 34 Years | 639 (5.7%) | 978 (8.3%) |
| 35 to 39 Years | 633 (5.6%) | 894 (7.6%) |
| 40 to 44 Years | 931 (8.3%) | 820 (7.0%) |
| 45 to 49 Years | 554 (4.9%) | 754 (6.4%) |
| 50 to 54 Years | 681 (6.0%) | 672 (5.7%) |
| 55 to 59 Years | 863 (7.7%) | 644 (5.5%) |
| 60 to 64 Years | 619 (5.5%) | 652 (5.6%) |
| 65 to 69 Years | 354 (3.1%) | 818 (7.0%) |
| 70 to 74 Years | 422 (3.7%) | 445 (3.8%) |
| 75 to 79 Years | 512 (4.5%) | 443 (3.8%) |
| 80 to 84 Years | 147 (1.3%) | 247 (2.1%) |
| 85 Years and over | 129 (1.1%) | 173 (1.5%) |
| Total | 11,261 (100.0%) | 11,744 (100.0%) |
Families and Households in Taylors
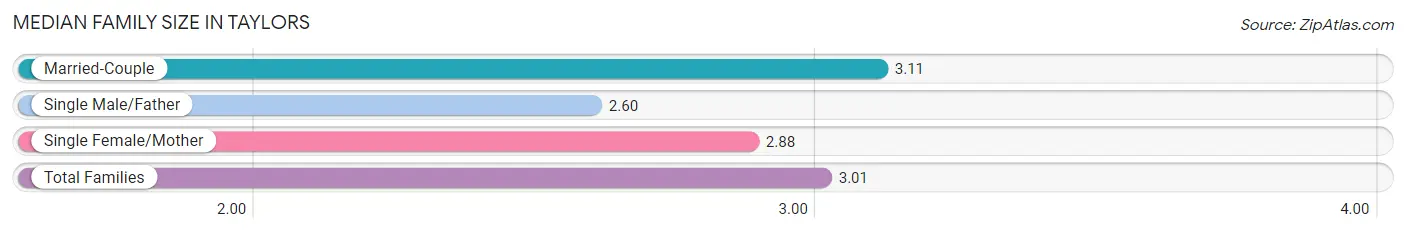
Median Family Size in Taylors
The median family size in Taylors is 3.01 persons per family, with married-couple families (4,499 | 68.9%) accounting for the largest median family size of 3.11 persons per family. On the other hand, single male/father families (626 | 9.6%) represent the smallest median family size with 2.60 persons per family.
| Family Type | # Families | Family Size |
| Married-Couple | 4,499 (68.9%) | 3.11 |
| Single Male/Father | 626 (9.6%) | 2.60 |
| Single Female/Mother | 1,408 (21.5%) | 2.88 |
| Total Families | 6,533 (100.0%) | 3.01 |
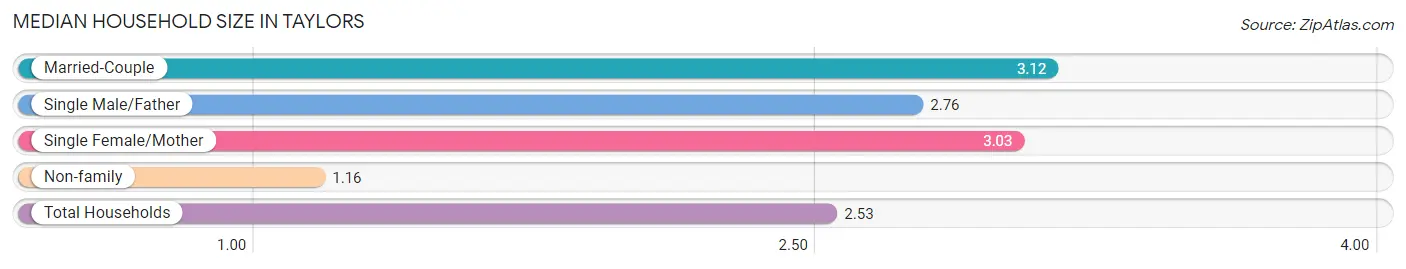
Median Household Size in Taylors
The median household size in Taylors is 2.53 persons per household, with married-couple households (4,499 | 49.5%) accounting for the largest median household size of 3.12 persons per household. non-family households (2,554 | 28.1%) represent the smallest median household size with 1.16 persons per household.
| Household Type | # Households | Household Size |
| Married-Couple | 4,499 (49.5%) | 3.12 |
| Single Male/Father | 626 (6.9%) | 2.76 |
| Single Female/Mother | 1,408 (15.5%) | 3.03 |
| Non-family | 2,554 (28.1%) | 1.16 |
| Total Households | 9,087 (100.0%) | 2.53 |
Household Size by Marriage Status in Taylors
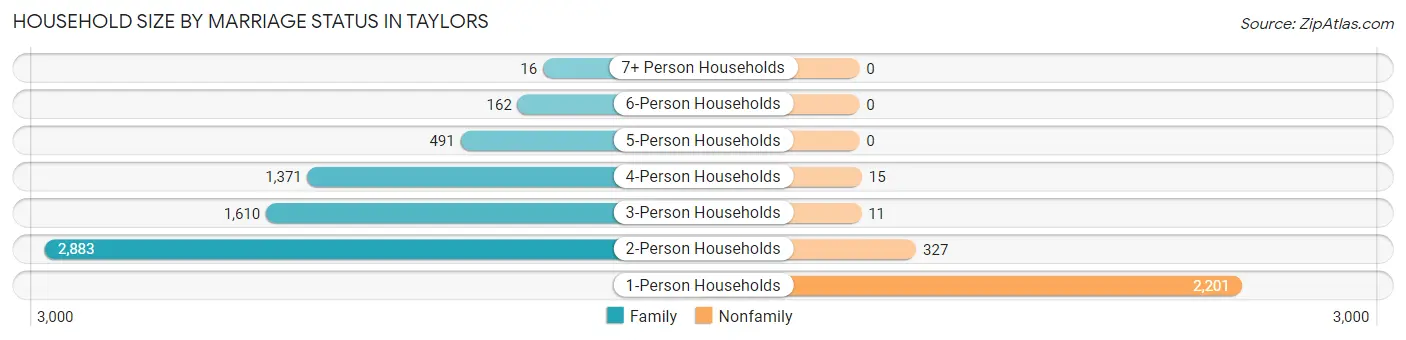
Out of a total of 9,087 households in Taylors, 6,533 (71.9%) are family households, while 2,554 (28.1%) are nonfamily households. The most numerous type of family households are 2-person households, comprising 2,883, and the most common type of nonfamily households are 1-person households, comprising 2,201.
| Household Size | Family Households | Nonfamily Households |
| 1-Person Households | - | 2,201 (24.2%) |
| 2-Person Households | 2,883 (31.7%) | 327 (3.6%) |
| 3-Person Households | 1,610 (17.7%) | 11 (0.1%) |
| 4-Person Households | 1,371 (15.1%) | 15 (0.2%) |
| 5-Person Households | 491 (5.4%) | 0 (0.0%) |
| 6-Person Households | 162 (1.8%) | 0 (0.0%) |
| 7+ Person Households | 16 (0.2%) | 0 (0.0%) |
| Total | 6,533 (71.9%) | 2,554 (28.1%) |
Female Fertility in Taylors
Fertility by Age in Taylors
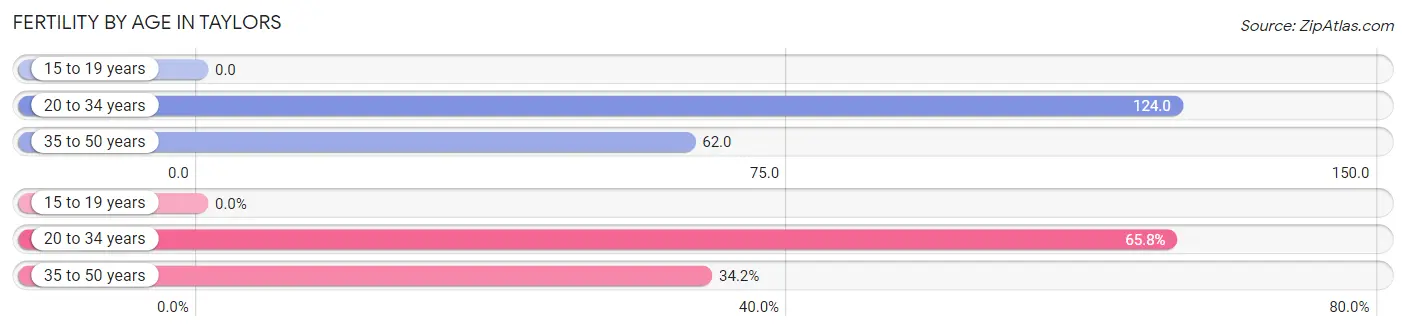
Average fertility rate in Taylors is 82.0 births per 1,000 women. Women in the age bracket of 20 to 34 years have the highest fertility rate with 124.0 births per 1,000 women. Women in the age bracket of 20 to 34 years acount for 65.8% of all women with births.
| Age Bracket | Women with Births | Births / 1,000 Women |
| 15 to 19 years | 0 (0.0%) | 0.0 |
| 20 to 34 years | 300 (65.8%) | 124.0 |
| 35 to 50 years | 156 (34.2%) | 62.0 |
| Total | 456 (100.0%) | 82.0 |
Fertility by Age by Marriage Status in Taylors
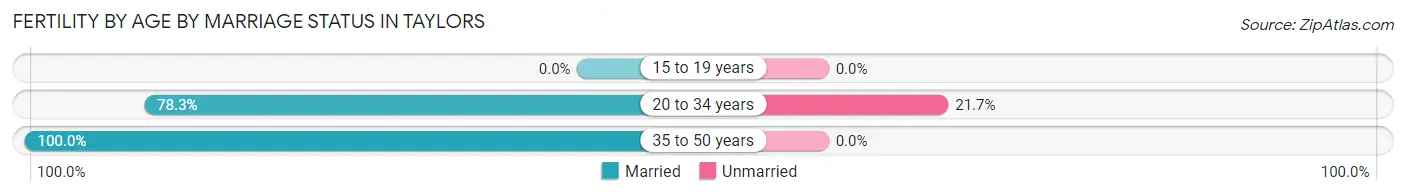
85.7% of women with births (456) in Taylors are married. The highest percentage of unmarried women with births falls into 20 to 34 years age bracket with 21.7% of them unmarried at the time of birth, while the lowest percentage of unmarried women with births belong to 35 to 50 years age bracket with 0.0% of them unmarried.
| Age Bracket | Married | Unmarried |
| 15 to 19 years | 0 (0.0%) | 0 (0.0%) |
| 20 to 34 years | 235 (78.3%) | 65 (21.7%) |
| 35 to 50 years | 156 (100.0%) | 0 (0.0%) |
| Total | 391 (85.8%) | 65 (14.2%) |
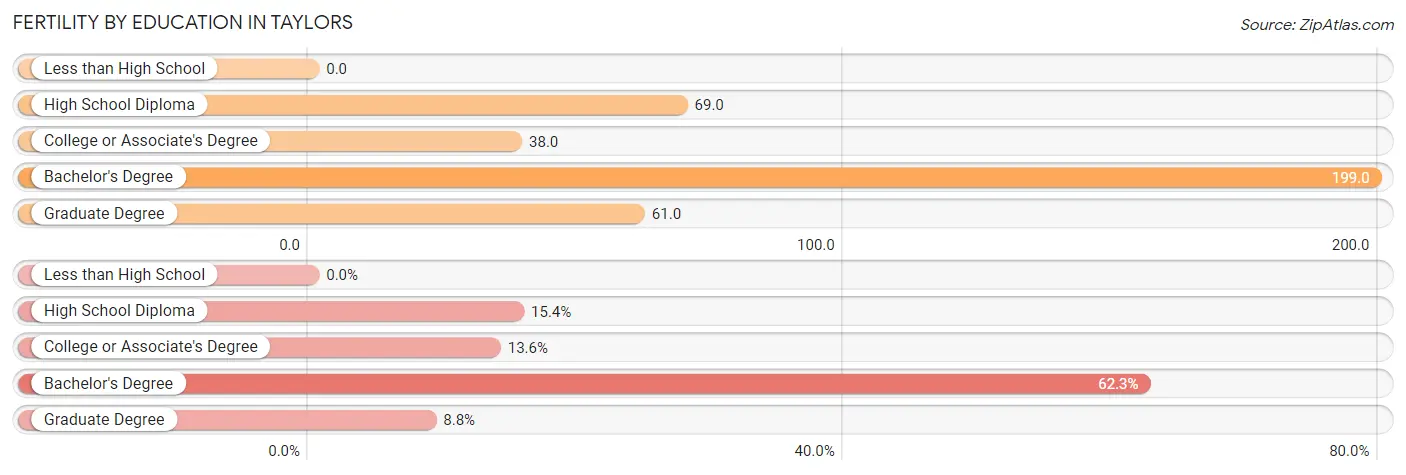
Fertility by Education in Taylors
| Educational Attainment | Women with Births | Births / 1,000 Women |
| Less than High School | 0 (0.0%) | 0.0 |
| High School Diploma | 70 (15.3%) | 69.0 |
| College or Associate's Degree | 62 (13.6%) | 38.0 |
| Bachelor's Degree | 284 (62.3%) | 199.0 |
| Graduate Degree | 40 (8.8%) | 61.0 |
| Total | 456 (100.0%) | 82.0 |
Fertility by Education by Marriage Status in Taylors
14.2% of women with births in Taylors are unmarried. Women with the educational attainment of graduate degree are most likely to be married with 100.0% of them married at childbirth, while women with the educational attainment of high school diploma are least likely to be married with 47.1% of them unmarried at childbirth.
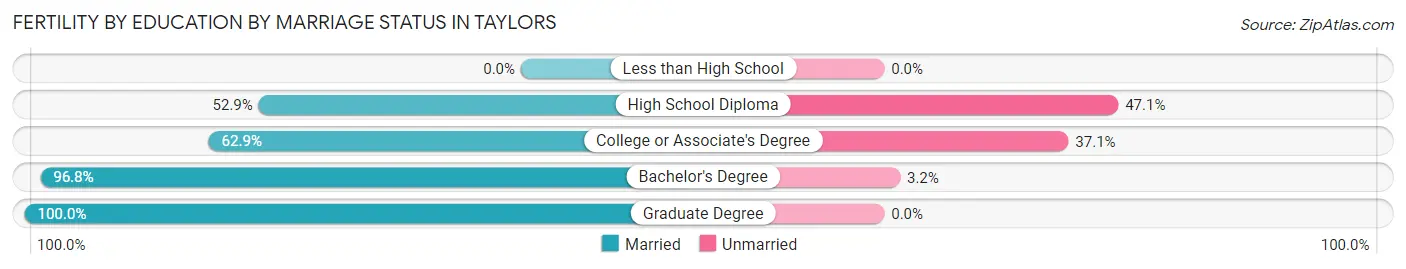
| Educational Attainment | Married | Unmarried |
| Less than High School | 0 (0.0%) | 0 (0.0%) |
| High School Diploma | 37 (52.9%) | 33 (47.1%) |
| College or Associate's Degree | 39 (62.9%) | 23 (37.1%) |
| Bachelor's Degree | 275 (96.8%) | 9 (3.2%) |
| Graduate Degree | 40 (100.0%) | 0 (0.0%) |
| Total | 391 (85.8%) | 65 (14.2%) |
Employment Characteristics in Taylors
Employment by Class of Employer in Taylors
Among the 11,834 employed individuals in Taylors, private company employees (8,700 | 73.5%), not-for-profit organizations (1,021 | 8.6%), and local government employees (822 | 7.0%) make up the most common classes of employment.
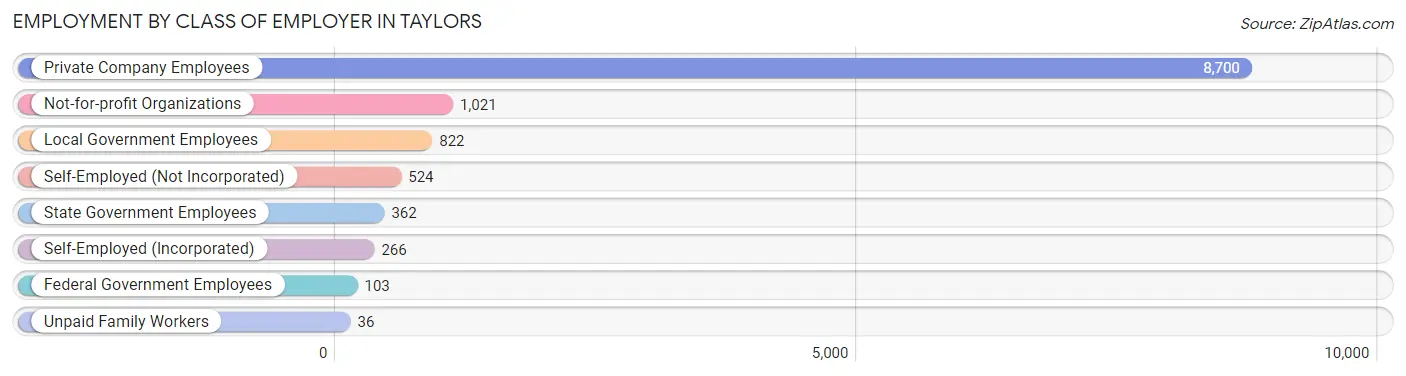
| Employer Class | # Employees | % Employees |
| Private Company Employees | 8,700 | 73.5% |
| Self-Employed (Incorporated) | 266 | 2.2% |
| Self-Employed (Not Incorporated) | 524 | 4.4% |
| Not-for-profit Organizations | 1,021 | 8.6% |
| Local Government Employees | 822 | 7.0% |
| State Government Employees | 362 | 3.1% |
| Federal Government Employees | 103 | 0.9% |
| Unpaid Family Workers | 36 | 0.3% |
| Total | 11,834 | 100.0% |
Employment Status by Age in Taylors
According to the labor force statistics for Taylors, out of the total population over 16 years of age (18,360), 68.4% or 12,558 individuals are in the labor force, with 4.8% or 603 of them unemployed. The age group with the highest labor force participation rate is 25 to 29 years, with 91.7% or 1,029 individuals in the labor force. Within the labor force, the 16 to 19 years age range has the highest percentage of unemployed individuals, with 16.4% or 102 of them being unemployed.
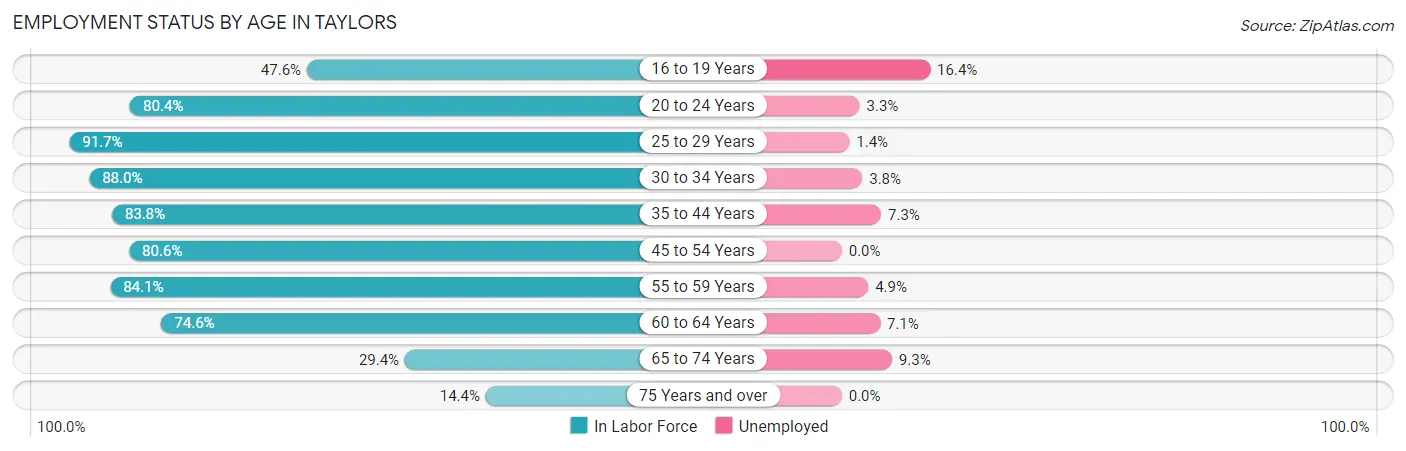
| Age Bracket | In Labor Force | Unemployed |
| 16 to 19 Years | 624 (47.6%) | 102 (16.4%) |
| 20 to 24 Years | 1,531 (80.4%) | 51 (3.3%) |
| 25 to 29 Years | 1,029 (91.7%) | 14 (1.4%) |
| 30 to 34 Years | 1,423 (88.0%) | 54 (3.8%) |
| 35 to 44 Years | 2,747 (83.8%) | 201 (7.3%) |
| 45 to 54 Years | 2,145 (80.6%) | 0 (0.0%) |
| 55 to 59 Years | 1,267 (84.1%) | 62 (4.9%) |
| 60 to 64 Years | 948 (74.6%) | 67 (7.1%) |
| 65 to 74 Years | 599 (29.4%) | 56 (9.3%) |
| 75 Years and over | 238 (14.4%) | 0 (0.0%) |
| Total | 12,558 (68.4%) | 603 (4.8%) |
Employment Status by Educational Attainment in Taylors
According to labor force statistics for Taylors, 83.5% of individuals (9,566) out of the total population between 25 and 64 years of age (11,456) are in the labor force, with 4.2% or 402 of them being unemployed. The group with the highest labor force participation rate are those with the educational attainment of bachelor's degree or higher, with 88.7% or 4,287 individuals in the labor force. Within the labor force, individuals with college / associate degree education have the highest percentage of unemployment, with 7.9% or 221 of them being unemployed.
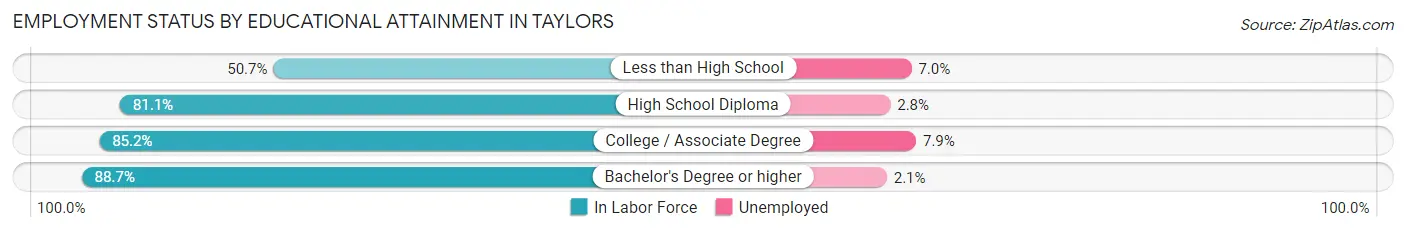
| Educational Attainment | In Labor Force | Unemployed |
| Less than High School | 384 (50.7%) | 53 (7.0%) |
| High School Diploma | 2,089 (81.1%) | 72 (2.8%) |
| College / Associate Degree | 2,802 (85.2%) | 260 (7.9%) |
| Bachelor's Degree or higher | 4,287 (88.7%) | 101 (2.1%) |
| Total | 9,566 (83.5%) | 481 (4.2%) |
Employment Occupations by Sex in Taylors
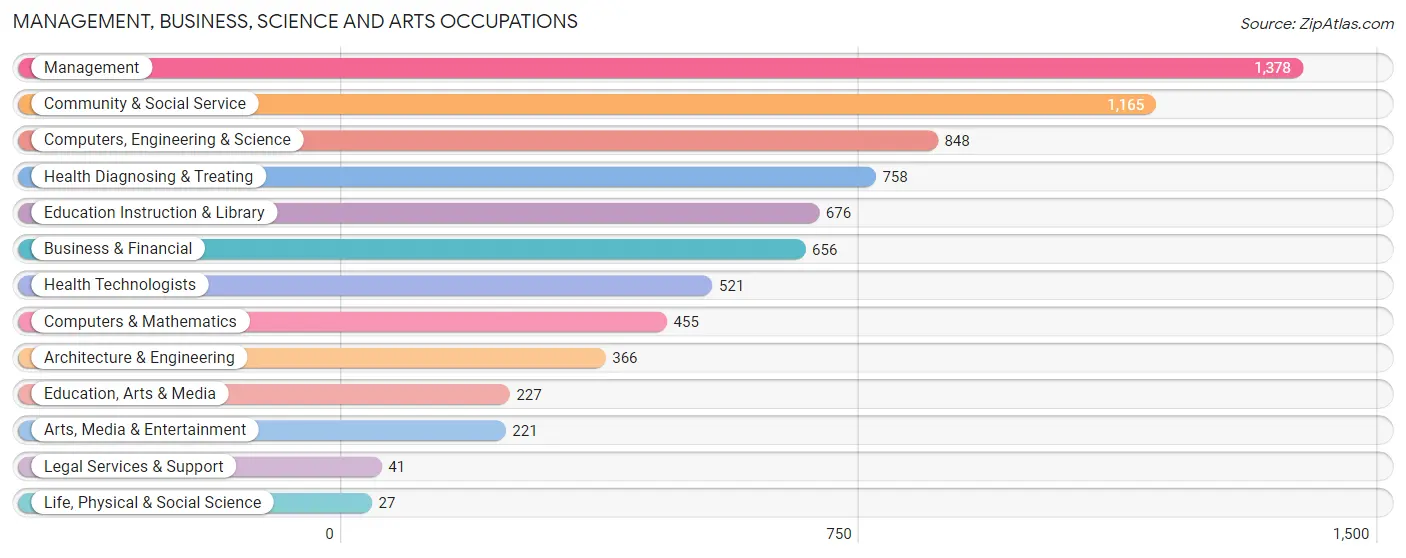
Management, Business, Science and Arts Occupations
The most common Management, Business, Science and Arts occupations in Taylors are Management (1,378 | 11.5%), Community & Social Service (1,165 | 9.8%), Computers, Engineering & Science (848 | 7.1%), Health Diagnosing & Treating (758 | 6.4%), and Education Instruction & Library (676 | 5.7%).
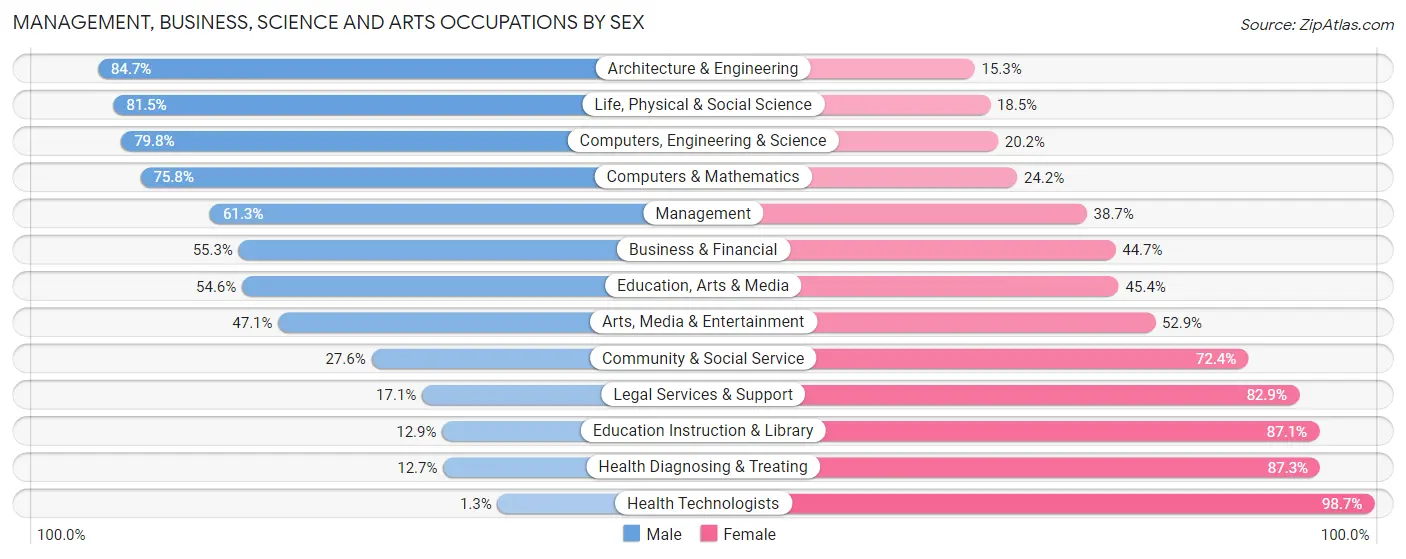
Management, Business, Science and Arts Occupations by Sex
Within the Management, Business, Science and Arts occupations in Taylors, the most male-oriented occupations are Architecture & Engineering (84.7%), Life, Physical & Social Science (81.5%), and Computers, Engineering & Science (79.8%), while the most female-oriented occupations are Health Technologists (98.7%), Health Diagnosing & Treating (87.3%), and Education Instruction & Library (87.1%).
| Occupation | Male | Female |
| Management | 845 (61.3%) | 533 (38.7%) |
| Business & Financial | 363 (55.3%) | 293 (44.7%) |
| Computers, Engineering & Science | 677 (79.8%) | 171 (20.2%) |
| Computers & Mathematics | 345 (75.8%) | 110 (24.2%) |
| Architecture & Engineering | 310 (84.7%) | 56 (15.3%) |
| Life, Physical & Social Science | 22 (81.5%) | 5 (18.5%) |
| Community & Social Service | 322 (27.6%) | 843 (72.4%) |
| Education, Arts & Media | 124 (54.6%) | 103 (45.4%) |
| Legal Services & Support | 7 (17.1%) | 34 (82.9%) |
| Education Instruction & Library | 87 (12.9%) | 589 (87.1%) |
| Arts, Media & Entertainment | 104 (47.1%) | 117 (52.9%) |
| Health Diagnosing & Treating | 96 (12.7%) | 662 (87.3%) |
| Health Technologists | 7 (1.3%) | 514 (98.7%) |
| Total (Category) | 2,303 (47.9%) | 2,502 (52.1%) |
| Total (Overall) | 6,581 (55.1%) | 5,364 (44.9%) |
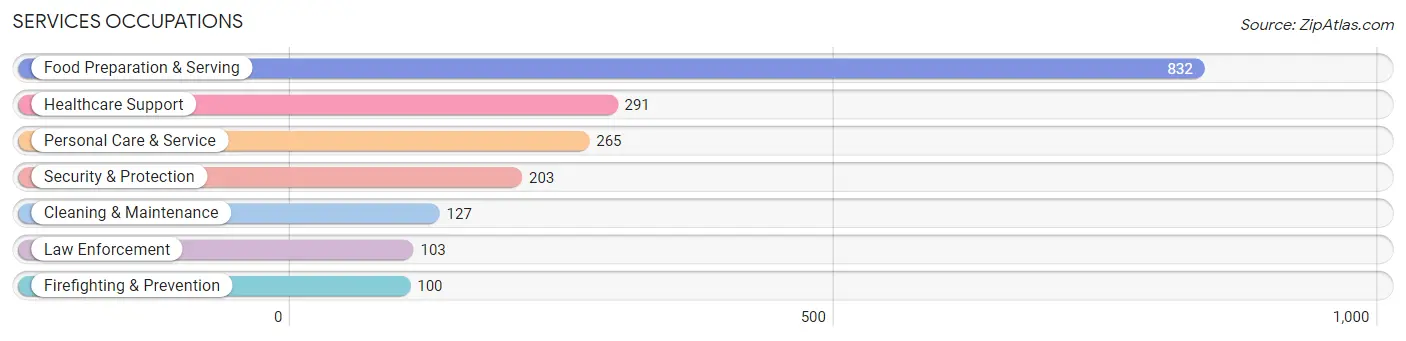
Services Occupations
The most common Services occupations in Taylors are Food Preparation & Serving (832 | 7.0%), Healthcare Support (291 | 2.4%), Personal Care & Service (265 | 2.2%), Security & Protection (203 | 1.7%), and Cleaning & Maintenance (127 | 1.1%).
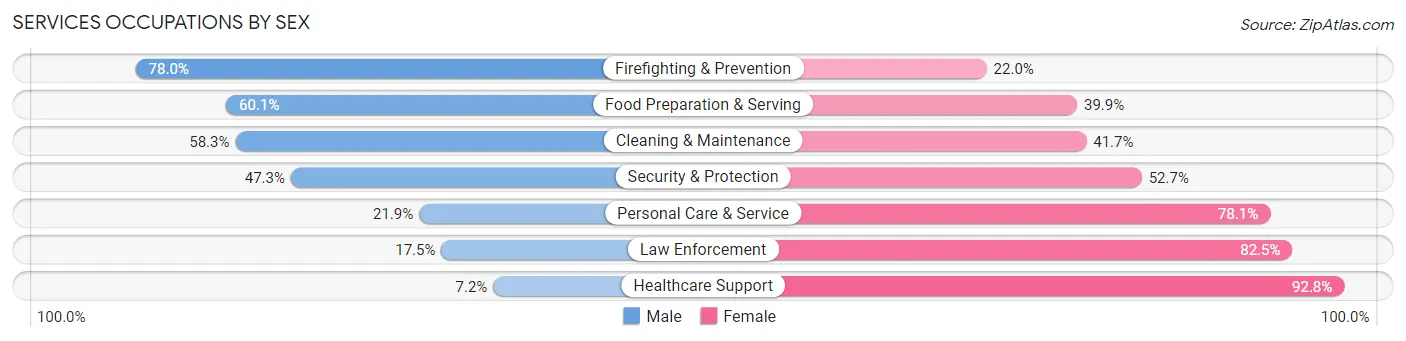
Services Occupations by Sex
Within the Services occupations in Taylors, the most male-oriented occupations are Firefighting & Prevention (78.0%), Food Preparation & Serving (60.1%), and Cleaning & Maintenance (58.3%), while the most female-oriented occupations are Healthcare Support (92.8%), Law Enforcement (82.5%), and Personal Care & Service (78.1%).
| Occupation | Male | Female |
| Healthcare Support | 21 (7.2%) | 270 (92.8%) |
| Security & Protection | 96 (47.3%) | 107 (52.7%) |
| Firefighting & Prevention | 78 (78.0%) | 22 (22.0%) |
| Law Enforcement | 18 (17.5%) | 85 (82.5%) |
| Food Preparation & Serving | 500 (60.1%) | 332 (39.9%) |
| Cleaning & Maintenance | 74 (58.3%) | 53 (41.7%) |
| Personal Care & Service | 58 (21.9%) | 207 (78.1%) |
| Total (Category) | 749 (43.6%) | 969 (56.4%) |
| Total (Overall) | 6,581 (55.1%) | 5,364 (44.9%) |
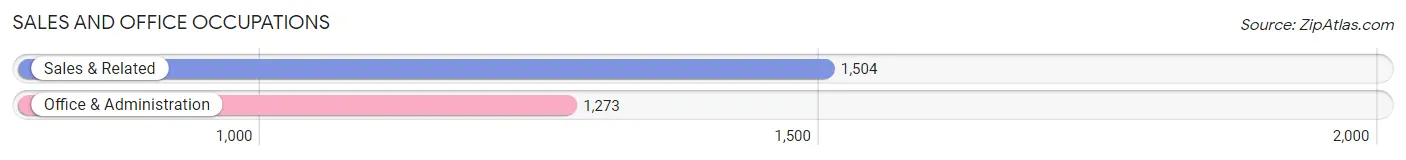
Sales and Office Occupations
The most common Sales and Office occupations in Taylors are Sales & Related (1,504 | 12.6%), and Office & Administration (1,273 | 10.7%).
Sales and Office Occupations by Sex
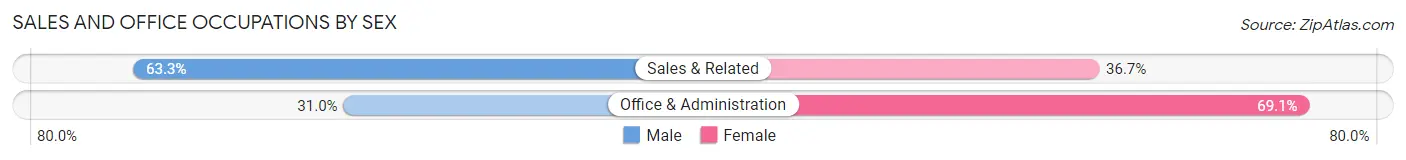
| Occupation | Male | Female |
| Sales & Related | 952 (63.3%) | 552 (36.7%) |
| Office & Administration | 394 (30.9%) | 879 (69.1%) |
| Total (Category) | 1,346 (48.5%) | 1,431 (51.5%) |
| Total (Overall) | 6,581 (55.1%) | 5,364 (44.9%) |
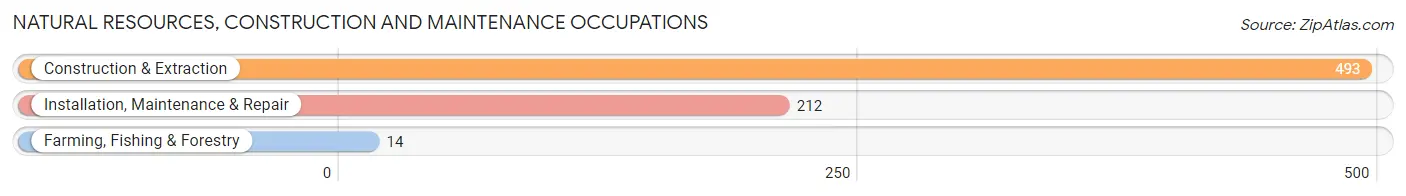
Natural Resources, Construction and Maintenance Occupations
The most common Natural Resources, Construction and Maintenance occupations in Taylors are Construction & Extraction (493 | 4.1%), Installation, Maintenance & Repair (212 | 1.8%), and Farming, Fishing & Forestry (14 | 0.1%).
Natural Resources, Construction and Maintenance Occupations by Sex
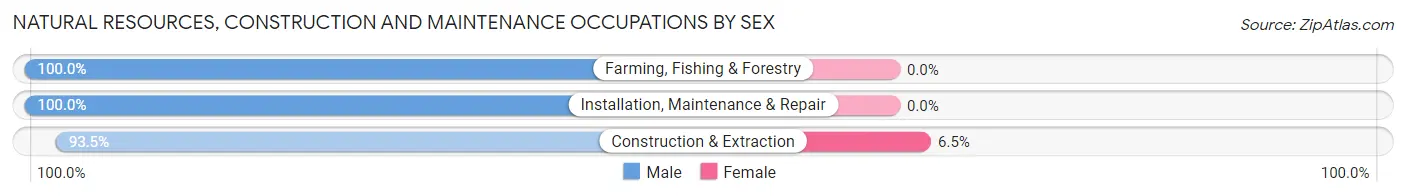
| Occupation | Male | Female |
| Farming, Fishing & Forestry | 14 (100.0%) | 0 (0.0%) |
| Construction & Extraction | 461 (93.5%) | 32 (6.5%) |
| Installation, Maintenance & Repair | 212 (100.0%) | 0 (0.0%) |
| Total (Category) | 687 (95.6%) | 32 (4.4%) |
| Total (Overall) | 6,581 (55.1%) | 5,364 (44.9%) |
Production, Transportation and Moving Occupations
The most common Production, Transportation and Moving occupations in Taylors are Production (911 | 7.6%), Transportation (566 | 4.7%), and Material Moving (449 | 3.8%).
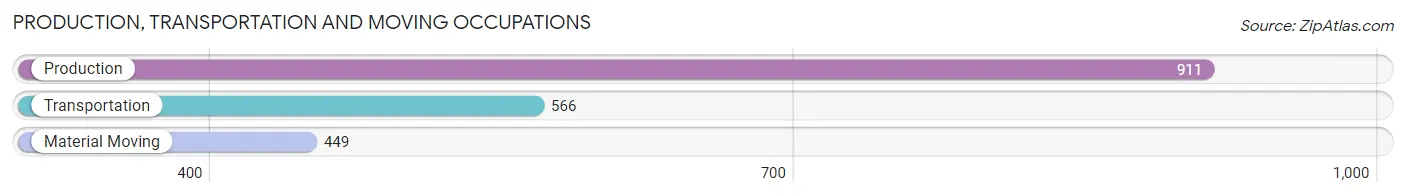
Production, Transportation and Moving Occupations by Sex
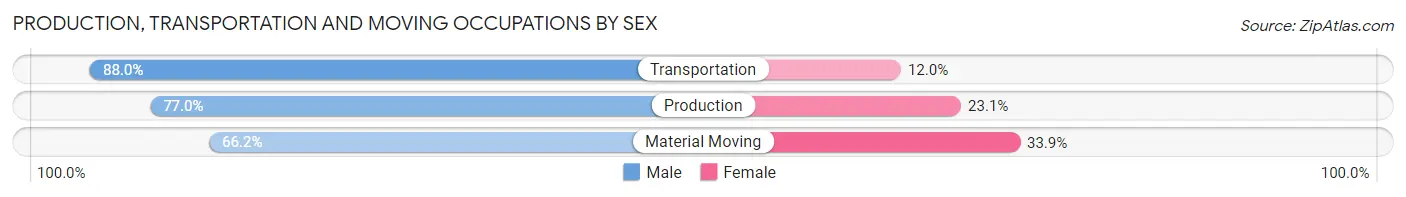
| Occupation | Male | Female |
| Production | 701 (76.9%) | 210 (23.1%) |
| Transportation | 498 (88.0%) | 68 (12.0%) |
| Material Moving | 297 (66.1%) | 152 (33.9%) |
| Total (Category) | 1,496 (77.7%) | 430 (22.3%) |
| Total (Overall) | 6,581 (55.1%) | 5,364 (44.9%) |
Employment Industries by Sex in Taylors
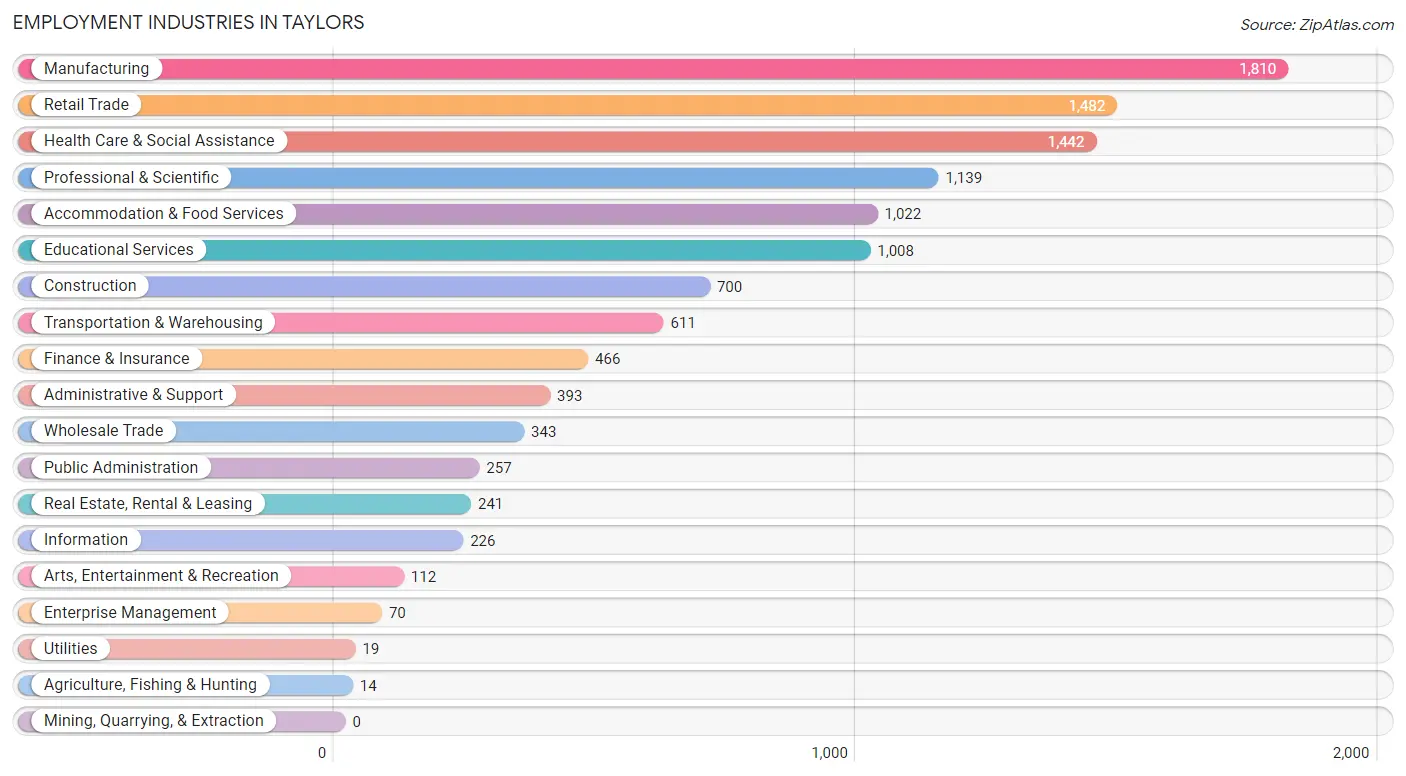
Employment Industries in Taylors
The major employment industries in Taylors include Manufacturing (1,810 | 15.1%), Retail Trade (1,482 | 12.4%), Health Care & Social Assistance (1,442 | 12.1%), Professional & Scientific (1,139 | 9.5%), and Accommodation & Food Services (1,022 | 8.6%).
Employment Industries by Sex in Taylors
The Taylors industries that see more men than women are Agriculture, Fishing & Hunting (100.0%), Utilities (100.0%), and Construction (91.6%), whereas the industries that tend to have a higher number of women are Health Care & Social Assistance (80.0%), Educational Services (76.1%), and Finance & Insurance (63.7%).
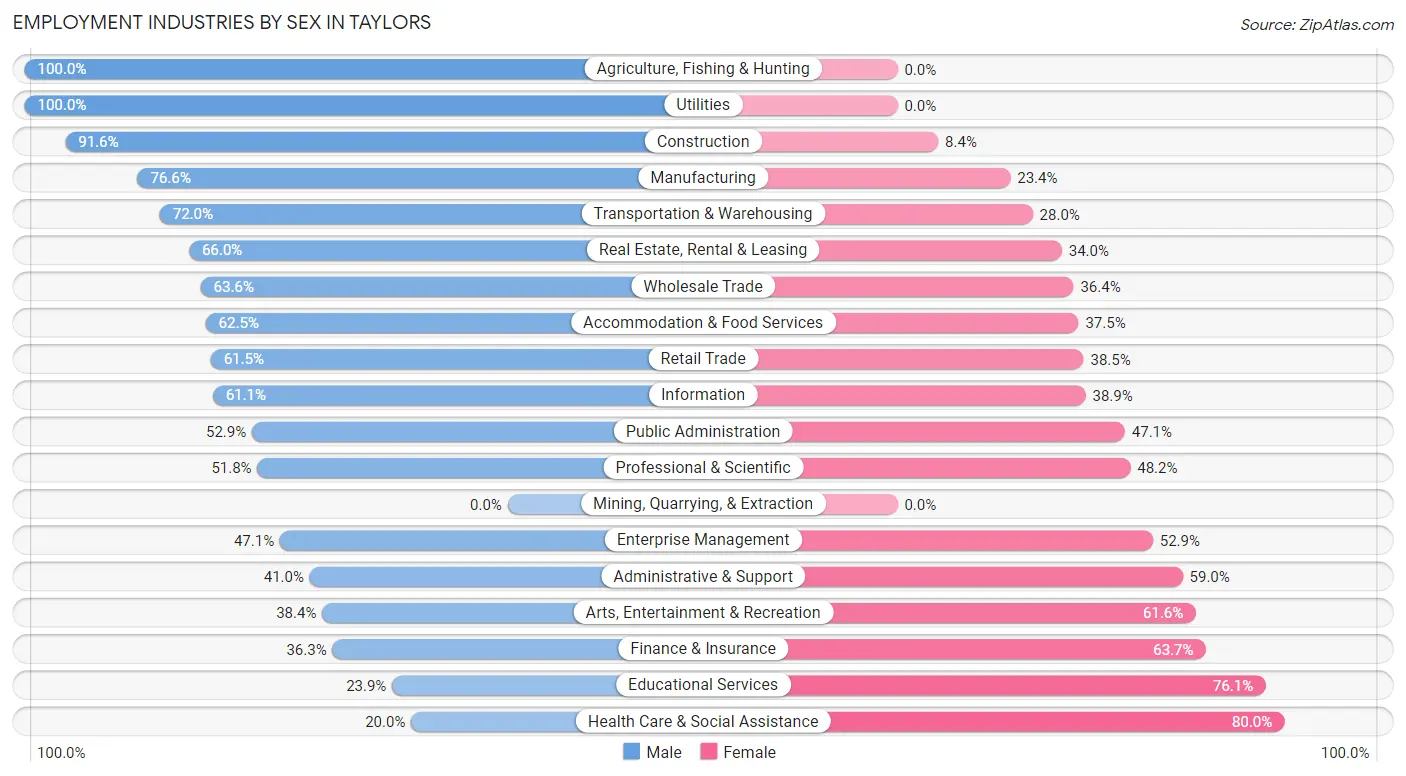
| Industry | Male | Female |
| Agriculture, Fishing & Hunting | 14 (100.0%) | 0 (0.0%) |
| Mining, Quarrying, & Extraction | 0 (0.0%) | 0 (0.0%) |
| Construction | 641 (91.6%) | 59 (8.4%) |
| Manufacturing | 1,387 (76.6%) | 423 (23.4%) |
| Wholesale Trade | 218 (63.6%) | 125 (36.4%) |
| Retail Trade | 911 (61.5%) | 571 (38.5%) |
| Transportation & Warehousing | 440 (72.0%) | 171 (28.0%) |
| Utilities | 19 (100.0%) | 0 (0.0%) |
| Information | 138 (61.1%) | 88 (38.9%) |
| Finance & Insurance | 169 (36.3%) | 297 (63.7%) |
| Real Estate, Rental & Leasing | 159 (66.0%) | 82 (34.0%) |
| Professional & Scientific | 590 (51.8%) | 549 (48.2%) |
| Enterprise Management | 33 (47.1%) | 37 (52.9%) |
| Administrative & Support | 161 (41.0%) | 232 (59.0%) |
| Educational Services | 241 (23.9%) | 767 (76.1%) |
| Health Care & Social Assistance | 288 (20.0%) | 1,154 (80.0%) |
| Arts, Entertainment & Recreation | 43 (38.4%) | 69 (61.6%) |
| Accommodation & Food Services | 639 (62.5%) | 383 (37.5%) |
| Public Administration | 136 (52.9%) | 121 (47.1%) |
| Total | 6,581 (55.1%) | 5,364 (44.9%) |
Education in Taylors
School Enrollment in Taylors
The most common levels of schooling among the 5,330 students in Taylors are college / undergraduate (1,163 | 21.8%), elementary school (1,104 | 20.7%), and high school (1,056 | 19.8%).
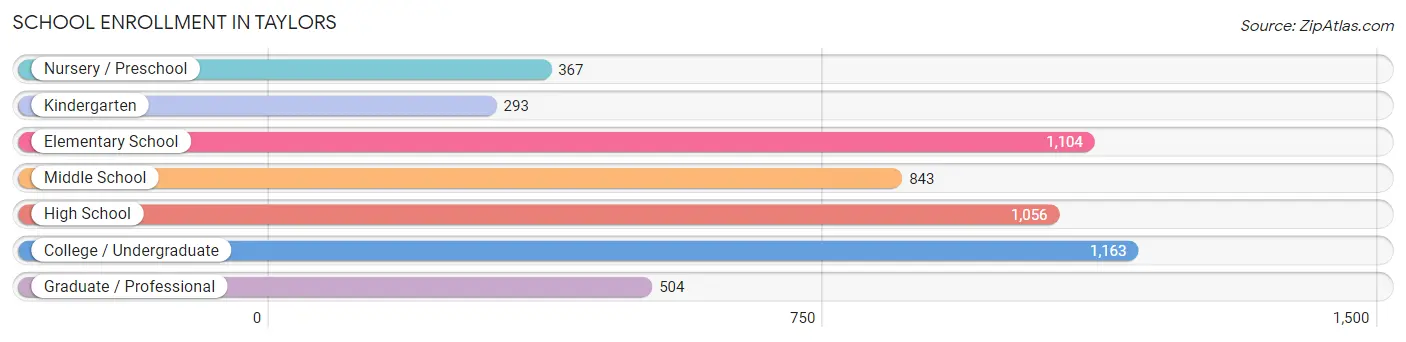
| School Level | # Students | % Students |
| Nursery / Preschool | 367 | 6.9% |
| Kindergarten | 293 | 5.5% |
| Elementary School | 1,104 | 20.7% |
| Middle School | 843 | 15.8% |
| High School | 1,056 | 19.8% |
| College / Undergraduate | 1,163 | 21.8% |
| Graduate / Professional | 504 | 9.5% |
| Total | 5,330 | 100.0% |
School Enrollment by Age by Funding Source in Taylors
Out of a total of 5,330 students who are enrolled in schools in Taylors, 1,237 (23.2%) attend a private institution, while the remaining 4,093 (76.8%) are enrolled in public schools. The age group of 35 years and over has the highest likelihood of being enrolled in private schools, with 293 (57.7% in the age bracket) enrolled. Conversely, the age group of 15 to 17 year olds has the lowest likelihood of being enrolled in a private school, with 679 (90.6% in the age bracket) attending a public institution.
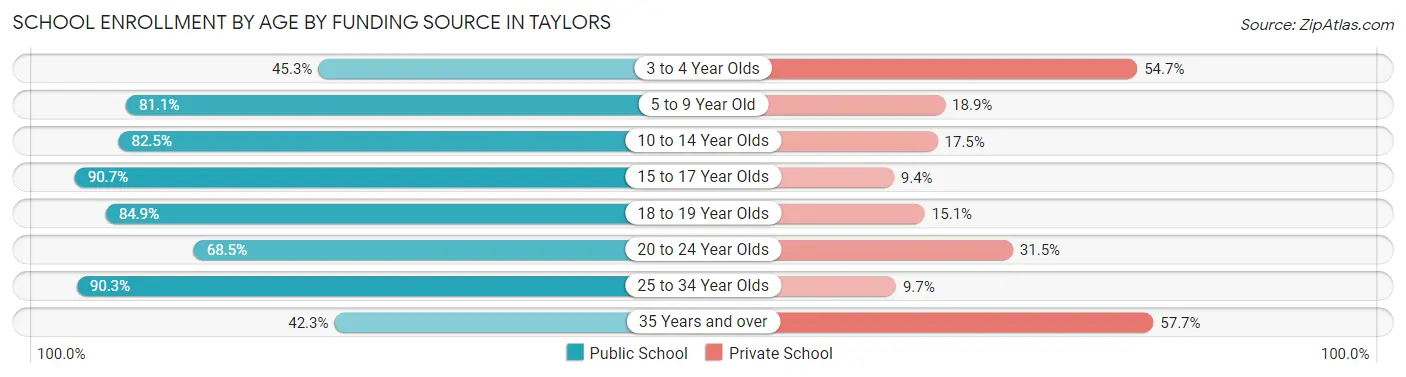
| Age Bracket | Public School | Private School |
| 3 to 4 Year Olds | 126 (45.3%) | 152 (54.7%) |
| 5 to 9 Year Old | 991 (81.1%) | 231 (18.9%) |
| 10 to 14 Year Olds | 1,004 (82.5%) | 213 (17.5%) |
| 15 to 17 Year Olds | 679 (90.6%) | 70 (9.3%) |
| 18 to 19 Year Olds | 488 (84.9%) | 87 (15.1%) |
| 20 to 24 Year Olds | 352 (68.5%) | 162 (31.5%) |
| 25 to 34 Year Olds | 241 (90.3%) | 26 (9.7%) |
| 35 Years and over | 215 (42.3%) | 293 (57.7%) |
| Total | 4,093 (76.8%) | 1,237 (23.2%) |
Educational Attainment by Field of Study in Taylors
Business (1,453 | 21.7%), education (954 | 14.2%), science & technology (618 | 9.2%), engineering (526 | 7.9%), and liberal arts & history (498 | 7.4%) are the most common fields of study among 6,700 individuals in Taylors who have obtained a bachelor's degree or higher.
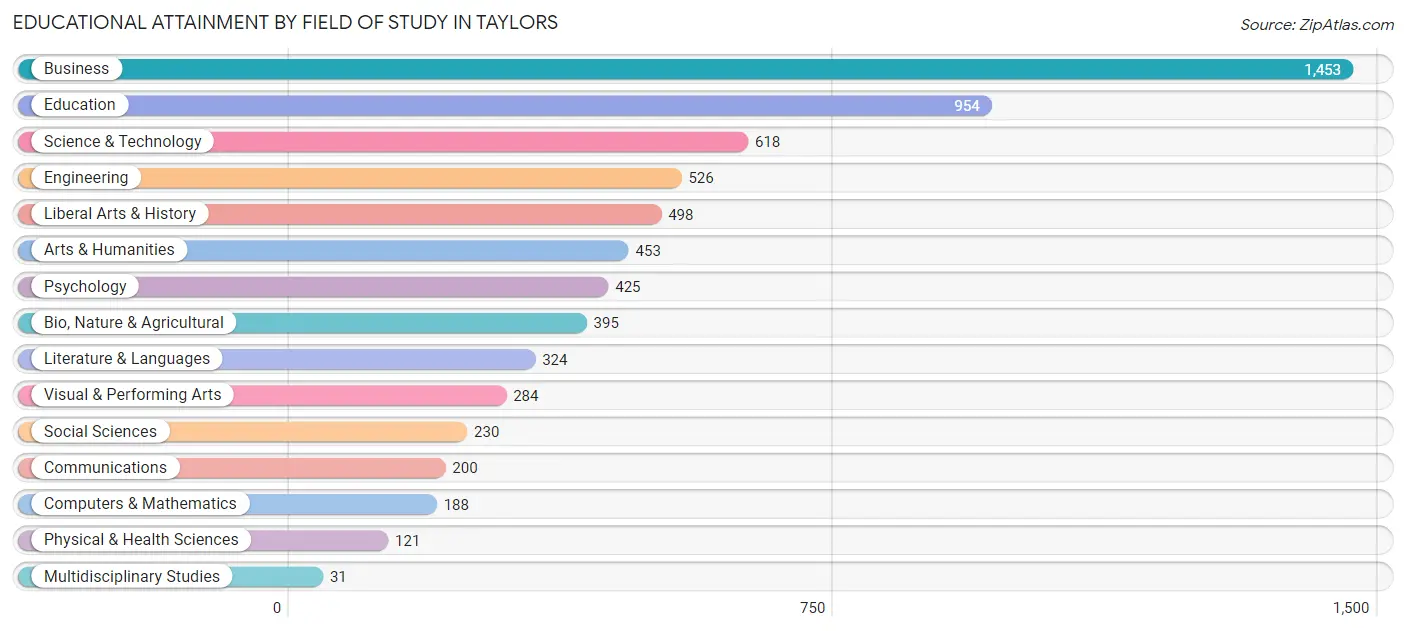
| Field of Study | # Graduates | % Graduates |
| Computers & Mathematics | 188 | 2.8% |
| Bio, Nature & Agricultural | 395 | 5.9% |
| Physical & Health Sciences | 121 | 1.8% |
| Psychology | 425 | 6.3% |
| Social Sciences | 230 | 3.4% |
| Engineering | 526 | 7.9% |
| Multidisciplinary Studies | 31 | 0.5% |
| Science & Technology | 618 | 9.2% |
| Business | 1,453 | 21.7% |
| Education | 954 | 14.2% |
| Literature & Languages | 324 | 4.8% |
| Liberal Arts & History | 498 | 7.4% |
| Visual & Performing Arts | 284 | 4.2% |
| Communications | 200 | 3.0% |
| Arts & Humanities | 453 | 6.8% |
| Total | 6,700 | 100.0% |
Transportation & Commute in Taylors
Vehicle Availability by Sex in Taylors
The most prevalent vehicle ownership categories in Taylors are males with 2 vehicles (3,320, accounting for 50.9%) and females with 2 vehicles (2,430, making up 62.5%).
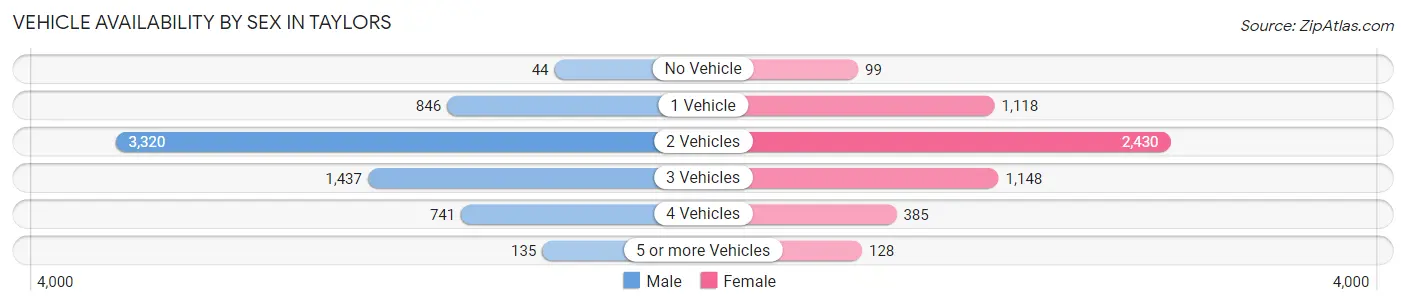
| Vehicles Available | Male | Female |
| No Vehicle | 44 (0.7%) | 99 (1.9%) |
| 1 Vehicle | 846 (13.0%) | 1,118 (21.1%) |
| 2 Vehicles | 3,320 (50.9%) | 2,430 (45.8%) |
| 3 Vehicles | 1,437 (22.0%) | 1,148 (21.6%) |
| 4 Vehicles | 741 (11.4%) | 385 (7.2%) |
| 5 or more Vehicles | 135 (2.1%) | 128 (2.4%) |
| Total | 6,523 (100.0%) | 5,308 (100.0%) |
Commute Time in Taylors
The most frequently occuring commute durations in Taylors are 20 to 24 minutes (2,897 commuters, 28.2%), 15 to 19 minutes (2,155 commuters, 21.0%), and 10 to 14 minutes (1,373 commuters, 13.4%).
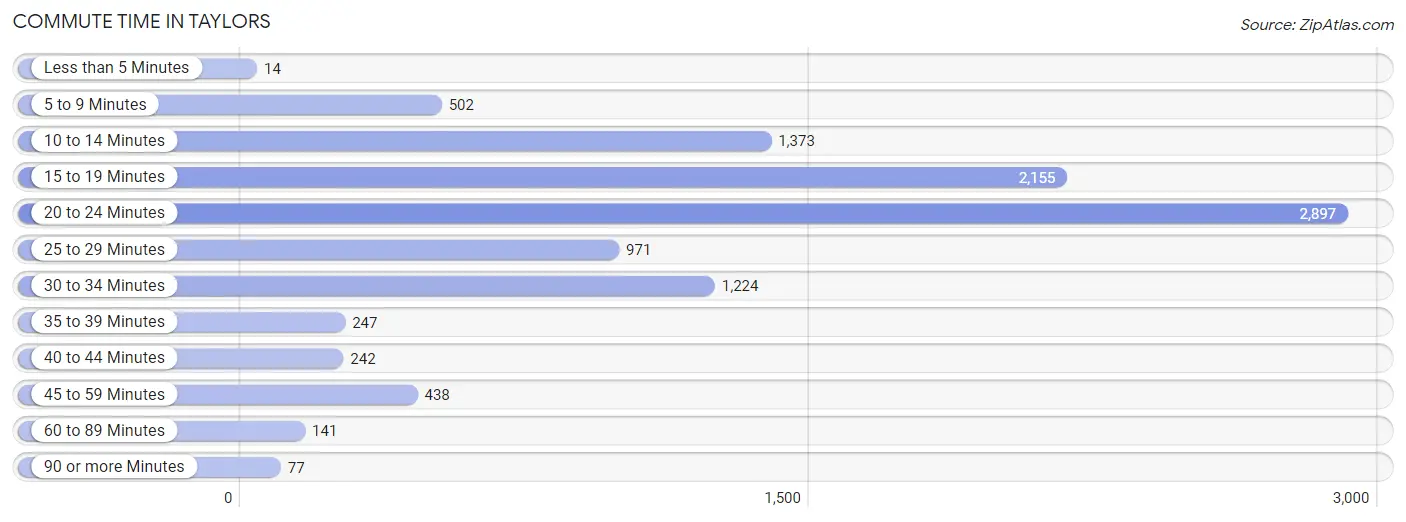
| Commute Time | # Commuters | % Commuters |
| Less than 5 Minutes | 14 | 0.1% |
| 5 to 9 Minutes | 502 | 4.9% |
| 10 to 14 Minutes | 1,373 | 13.4% |
| 15 to 19 Minutes | 2,155 | 21.0% |
| 20 to 24 Minutes | 2,897 | 28.2% |
| 25 to 29 Minutes | 971 | 9.4% |
| 30 to 34 Minutes | 1,224 | 11.9% |
| 35 to 39 Minutes | 247 | 2.4% |
| 40 to 44 Minutes | 242 | 2.4% |
| 45 to 59 Minutes | 438 | 4.3% |
| 60 to 89 Minutes | 141 | 1.4% |
| 90 or more Minutes | 77 | 0.7% |
Commute Time by Sex in Taylors
The most common commute times in Taylors are 20 to 24 minutes (1,485 commuters, 25.2%) for males and 20 to 24 minutes (1,412 commuters, 32.3%) for females.
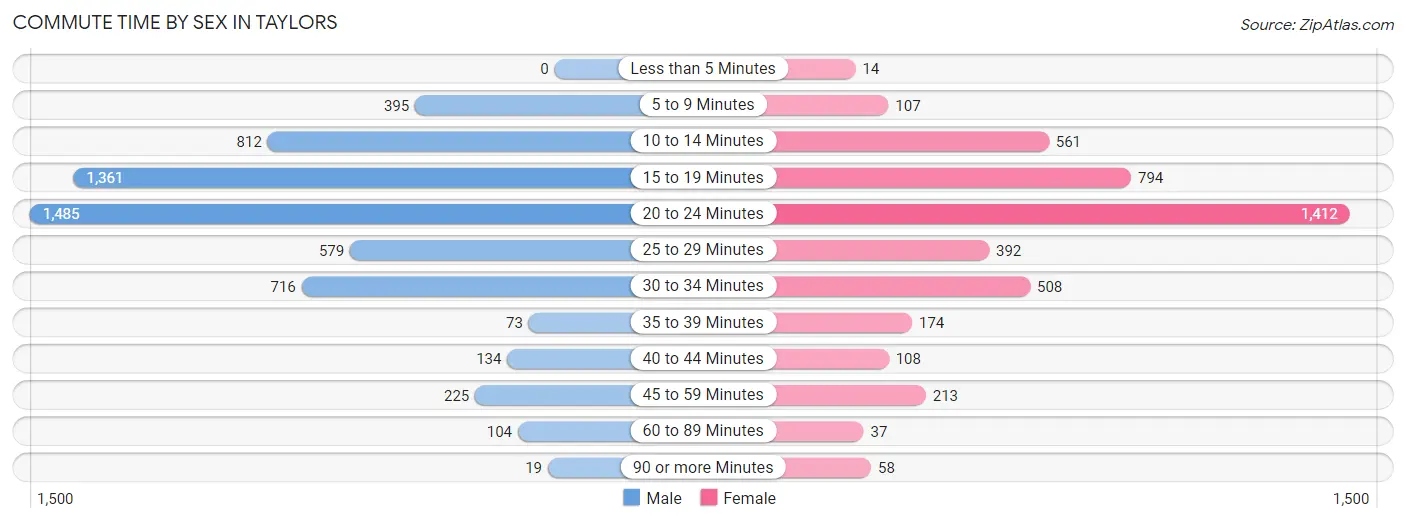
| Commute Time | Male | Female |
| Less than 5 Minutes | 0 (0.0%) | 14 (0.3%) |
| 5 to 9 Minutes | 395 (6.7%) | 107 (2.4%) |
| 10 to 14 Minutes | 812 (13.8%) | 561 (12.8%) |
| 15 to 19 Minutes | 1,361 (23.1%) | 794 (18.1%) |
| 20 to 24 Minutes | 1,485 (25.2%) | 1,412 (32.3%) |
| 25 to 29 Minutes | 579 (9.8%) | 392 (8.9%) |
| 30 to 34 Minutes | 716 (12.1%) | 508 (11.6%) |
| 35 to 39 Minutes | 73 (1.2%) | 174 (4.0%) |
| 40 to 44 Minutes | 134 (2.3%) | 108 (2.5%) |
| 45 to 59 Minutes | 225 (3.8%) | 213 (4.9%) |
| 60 to 89 Minutes | 104 (1.8%) | 37 (0.9%) |
| 90 or more Minutes | 19 (0.3%) | 58 (1.3%) |
Time of Departure to Work by Sex in Taylors
The most frequent times of departure to work in Taylors are 7:00 AM to 7:29 AM (1,055, 17.9%) for males and 7:30 AM to 7:59 AM (966, 22.1%) for females.
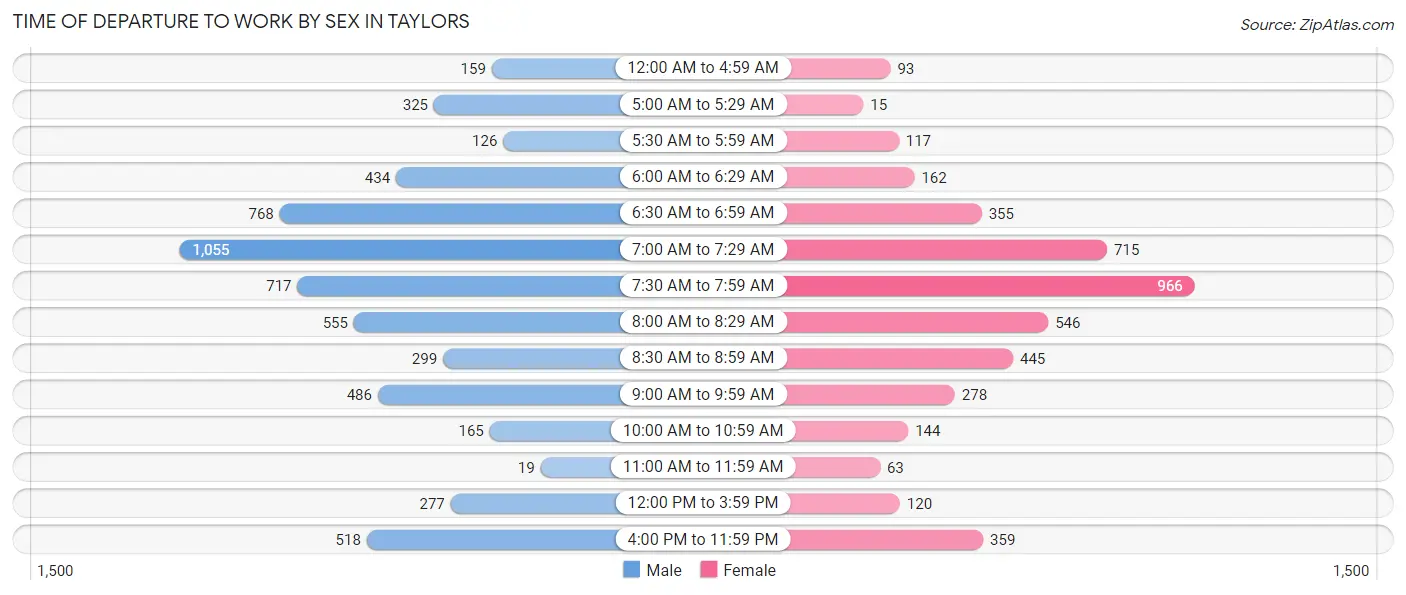
| Time of Departure | Male | Female |
| 12:00 AM to 4:59 AM | 159 (2.7%) | 93 (2.1%) |
| 5:00 AM to 5:29 AM | 325 (5.5%) | 15 (0.3%) |
| 5:30 AM to 5:59 AM | 126 (2.1%) | 117 (2.7%) |
| 6:00 AM to 6:29 AM | 434 (7.3%) | 162 (3.7%) |
| 6:30 AM to 6:59 AM | 768 (13.0%) | 355 (8.1%) |
| 7:00 AM to 7:29 AM | 1,055 (17.9%) | 715 (16.3%) |
| 7:30 AM to 7:59 AM | 717 (12.1%) | 966 (22.1%) |
| 8:00 AM to 8:29 AM | 555 (9.4%) | 546 (12.5%) |
| 8:30 AM to 8:59 AM | 299 (5.1%) | 445 (10.2%) |
| 9:00 AM to 9:59 AM | 486 (8.2%) | 278 (6.4%) |
| 10:00 AM to 10:59 AM | 165 (2.8%) | 144 (3.3%) |
| 11:00 AM to 11:59 AM | 19 (0.3%) | 63 (1.4%) |
| 12:00 PM to 3:59 PM | 277 (4.7%) | 120 (2.7%) |
| 4:00 PM to 11:59 PM | 518 (8.8%) | 359 (8.2%) |
| Total | 5,903 (100.0%) | 4,378 (100.0%) |
Housing Occupancy in Taylors
Occupancy by Ownership in Taylors
Of the total 9,087 dwellings in Taylors, owner-occupied units account for 7,093 (78.1%), while renter-occupied units make up 1,994 (21.9%).
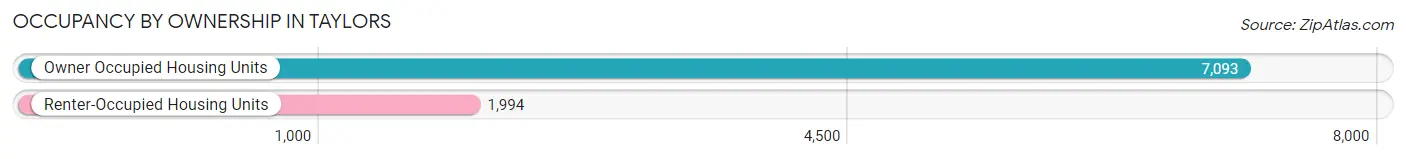
| Occupancy | # Housing Units | % Housing Units |
| Owner Occupied Housing Units | 7,093 | 78.1% |
| Renter-Occupied Housing Units | 1,994 | 21.9% |
| Total Occupied Housing Units | 9,087 | 100.0% |
Occupancy by Household Size in Taylors
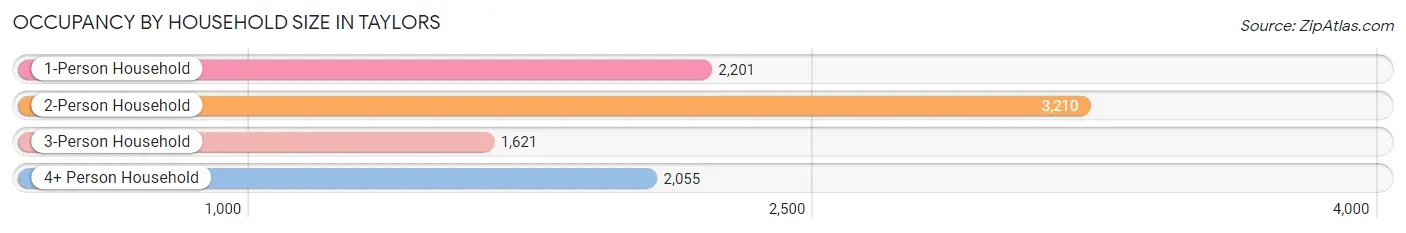
| Household Size | # Housing Units | % Housing Units |
| 1-Person Household | 2,201 | 24.2% |
| 2-Person Household | 3,210 | 35.3% |
| 3-Person Household | 1,621 | 17.8% |
| 4+ Person Household | 2,055 | 22.6% |
| Total Housing Units | 9,087 | 100.0% |
Occupancy by Ownership by Household Size in Taylors
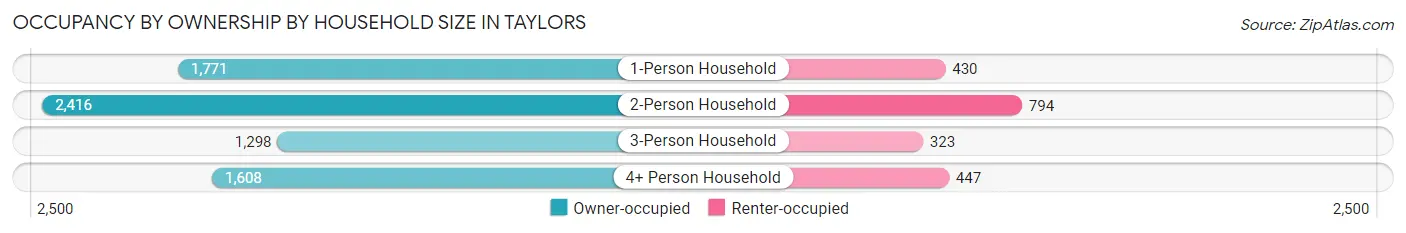
| Household Size | Owner-occupied | Renter-occupied |
| 1-Person Household | 1,771 (80.5%) | 430 (19.5%) |
| 2-Person Household | 2,416 (75.3%) | 794 (24.7%) |
| 3-Person Household | 1,298 (80.1%) | 323 (19.9%) |
| 4+ Person Household | 1,608 (78.2%) | 447 (21.7%) |
| Total Housing Units | 7,093 (78.1%) | 1,994 (21.9%) |
Occupancy by Educational Attainment in Taylors
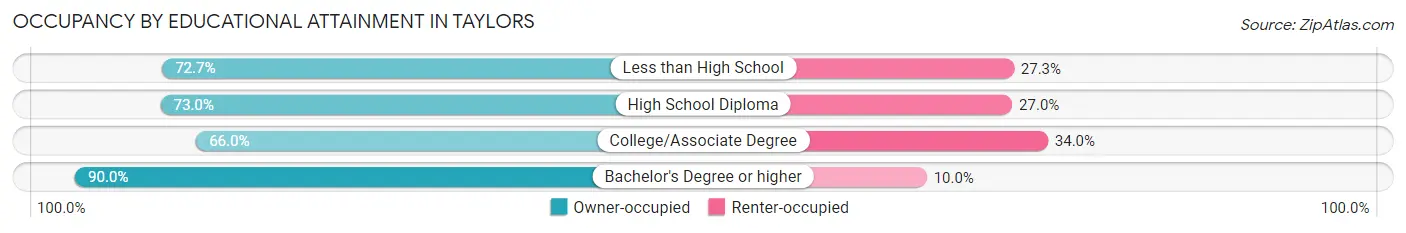
| Household Size | Owner-occupied | Renter-occupied |
| Less than High School | 269 (72.7%) | 101 (27.3%) |
| High School Diploma | 1,219 (73.0%) | 450 (27.0%) |
| College/Associate Degree | 2,023 (66.0%) | 1,044 (34.0%) |
| Bachelor's Degree or higher | 3,582 (90.0%) | 399 (10.0%) |
Occupancy by Age of Householder in Taylors
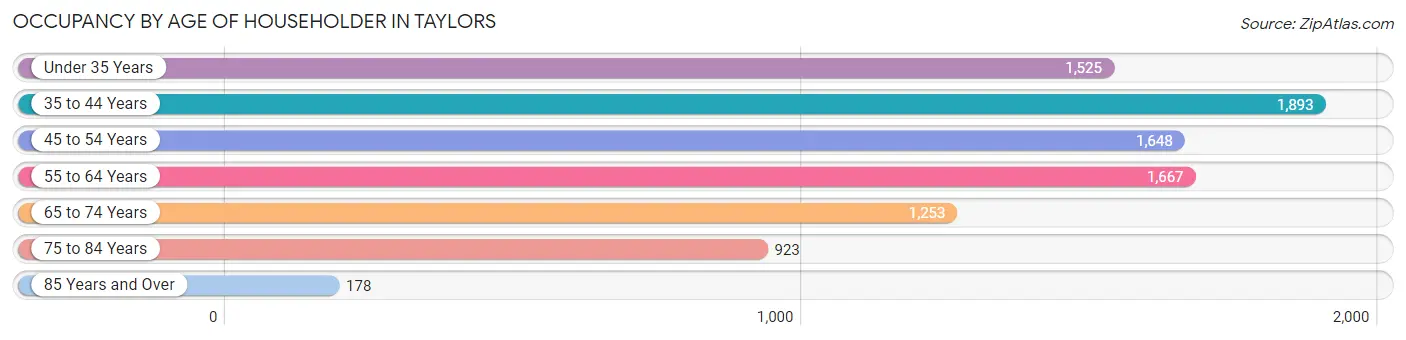
| Age Bracket | # Households | % Households |
| Under 35 Years | 1,525 | 16.8% |
| 35 to 44 Years | 1,893 | 20.8% |
| 45 to 54 Years | 1,648 | 18.1% |
| 55 to 64 Years | 1,667 | 18.3% |
| 65 to 74 Years | 1,253 | 13.8% |
| 75 to 84 Years | 923 | 10.2% |
| 85 Years and Over | 178 | 2.0% |
| Total | 9,087 | 100.0% |
Housing Finances in Taylors
Median Income by Occupancy in Taylors
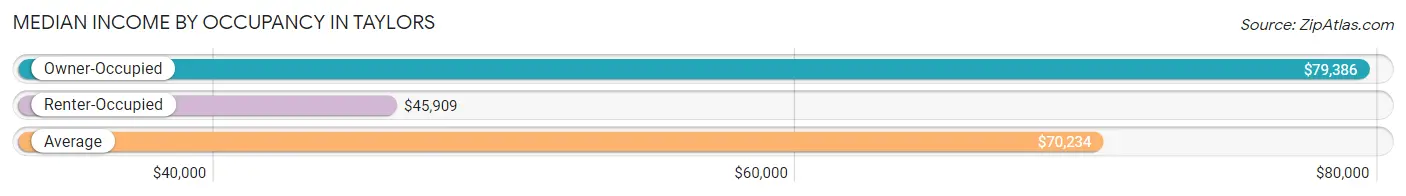
| Occupancy Type | # Households | Median Income |
| Owner-Occupied | 7,093 (78.1%) | $79,386 |
| Renter-Occupied | 1,994 (21.9%) | $45,909 |
| Average | 9,087 (100.0%) | $70,234 |
Occupancy by Householder Income Bracket in Taylors
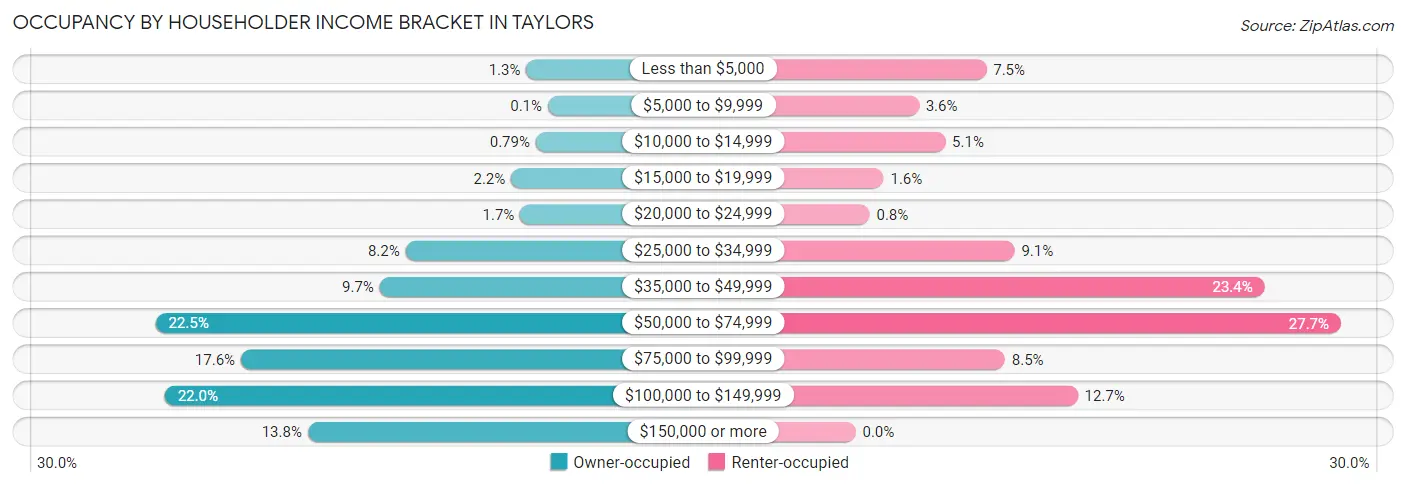
| Income Bracket | Owner-occupied | Renter-occupied |
| Less than $5,000 | 94 (1.3%) | 149 (7.5%) |
| $5,000 to $9,999 | 7 (0.1%) | 72 (3.6%) |
| $10,000 to $14,999 | 56 (0.8%) | 102 (5.1%) |
| $15,000 to $19,999 | 156 (2.2%) | 32 (1.6%) |
| $20,000 to $24,999 | 119 (1.7%) | 16 (0.8%) |
| $25,000 to $34,999 | 584 (8.2%) | 181 (9.1%) |
| $35,000 to $49,999 | 689 (9.7%) | 466 (23.4%) |
| $50,000 to $74,999 | 1,597 (22.5%) | 553 (27.7%) |
| $75,000 to $99,999 | 1,251 (17.6%) | 170 (8.5%) |
| $100,000 to $149,999 | 1,560 (22.0%) | 253 (12.7%) |
| $150,000 or more | 980 (13.8%) | 0 (0.0%) |
| Total | 7,093 (100.0%) | 1,994 (100.0%) |
Monthly Housing Cost Tiers in Taylors
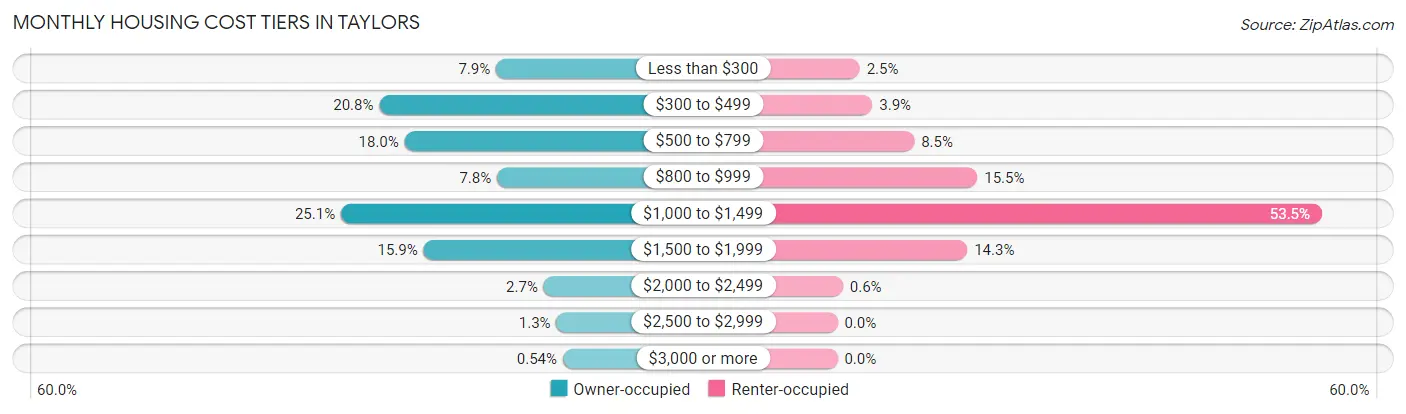
| Monthly Cost | Owner-occupied | Renter-occupied |
| Less than $300 | 562 (7.9%) | 49 (2.5%) |
| $300 to $499 | 1,477 (20.8%) | 77 (3.9%) |
| $500 to $799 | 1,278 (18.0%) | 169 (8.5%) |
| $800 to $999 | 554 (7.8%) | 308 (15.4%) |
| $1,000 to $1,499 | 1,777 (25.1%) | 1,067 (53.5%) |
| $1,500 to $1,999 | 1,130 (15.9%) | 286 (14.3%) |
| $2,000 to $2,499 | 188 (2.6%) | 12 (0.6%) |
| $2,500 to $2,999 | 89 (1.3%) | 0 (0.0%) |
| $3,000 or more | 38 (0.5%) | 0 (0.0%) |
| Total | 7,093 (100.0%) | 1,994 (100.0%) |
Physical Housing Characteristics in Taylors
Housing Structures in Taylors
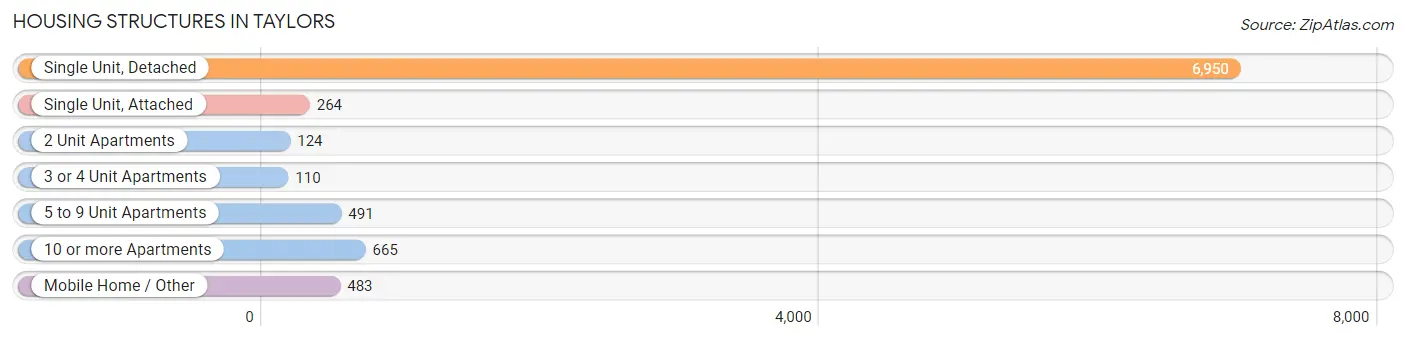
| Structure Type | # Housing Units | % Housing Units |
| Single Unit, Detached | 6,950 | 76.5% |
| Single Unit, Attached | 264 | 2.9% |
| 2 Unit Apartments | 124 | 1.4% |
| 3 or 4 Unit Apartments | 110 | 1.2% |
| 5 to 9 Unit Apartments | 491 | 5.4% |
| 10 or more Apartments | 665 | 7.3% |
| Mobile Home / Other | 483 | 5.3% |
| Total | 9,087 | 100.0% |
Housing Structures by Occupancy in Taylors
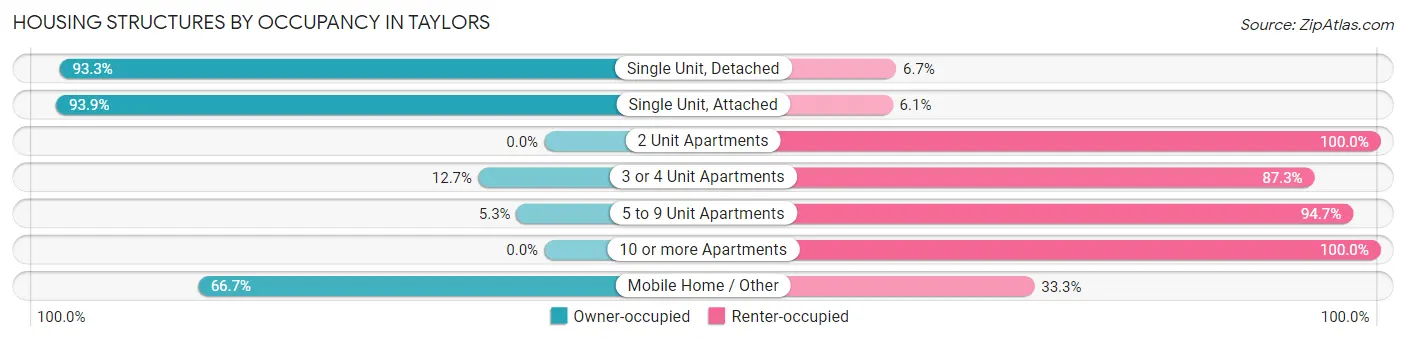
| Structure Type | Owner-occupied | Renter-occupied |
| Single Unit, Detached | 6,483 (93.3%) | 467 (6.7%) |
| Single Unit, Attached | 248 (93.9%) | 16 (6.1%) |
| 2 Unit Apartments | 0 (0.0%) | 124 (100.0%) |
| 3 or 4 Unit Apartments | 14 (12.7%) | 96 (87.3%) |
| 5 to 9 Unit Apartments | 26 (5.3%) | 465 (94.7%) |
| 10 or more Apartments | 0 (0.0%) | 665 (100.0%) |
| Mobile Home / Other | 322 (66.7%) | 161 (33.3%) |
| Total | 7,093 (78.1%) | 1,994 (21.9%) |
Housing Structures by Number of Rooms in Taylors
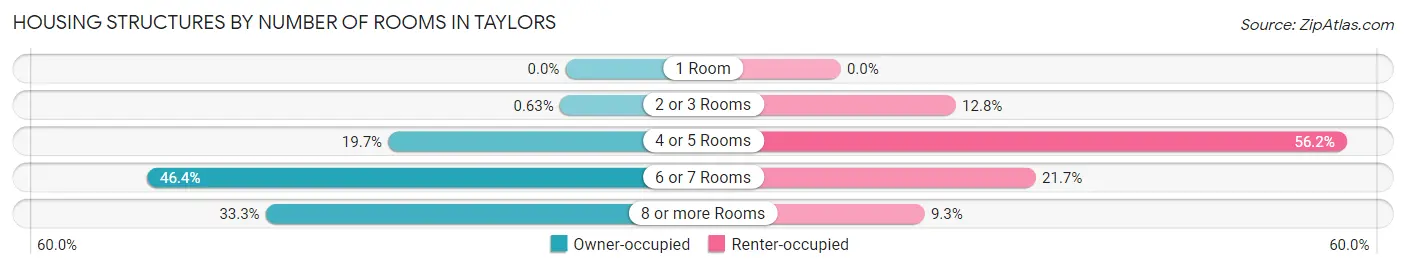
| Number of Rooms | Owner-occupied | Renter-occupied |
| 1 Room | 0 (0.0%) | 0 (0.0%) |
| 2 or 3 Rooms | 45 (0.6%) | 255 (12.8%) |
| 4 or 5 Rooms | 1,396 (19.7%) | 1,121 (56.2%) |
| 6 or 7 Rooms | 3,292 (46.4%) | 432 (21.7%) |
| 8 or more Rooms | 2,360 (33.3%) | 186 (9.3%) |
| Total | 7,093 (100.0%) | 1,994 (100.0%) |
Housing Structure by Heating Type in Taylors
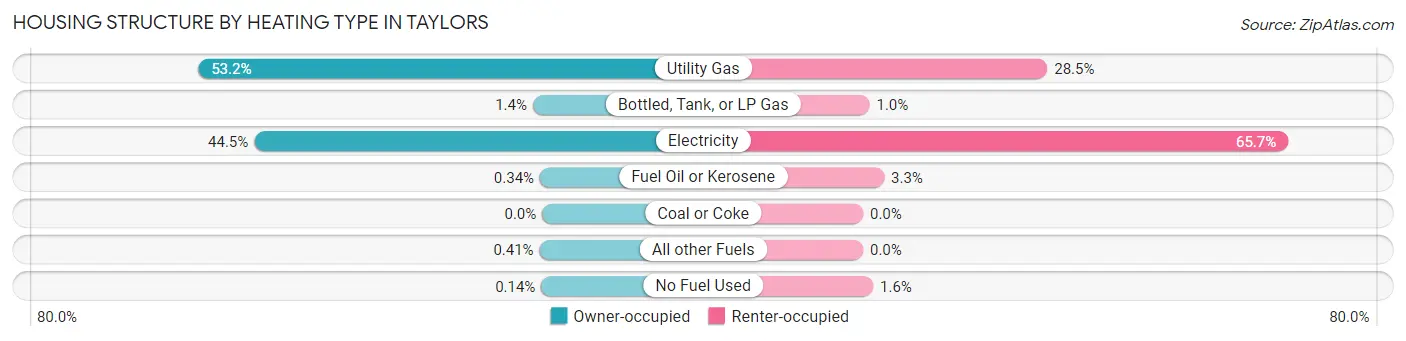
| Heating Type | Owner-occupied | Renter-occupied |
| Utility Gas | 3,770 (53.1%) | 568 (28.5%) |
| Bottled, Tank, or LP Gas | 102 (1.4%) | 20 (1.0%) |
| Electricity | 3,158 (44.5%) | 1,310 (65.7%) |
| Fuel Oil or Kerosene | 24 (0.3%) | 65 (3.3%) |
| Coal or Coke | 0 (0.0%) | 0 (0.0%) |
| All other Fuels | 29 (0.4%) | 0 (0.0%) |
| No Fuel Used | 10 (0.1%) | 31 (1.5%) |
| Total | 7,093 (100.0%) | 1,994 (100.0%) |
Household Vehicle Usage in Taylors
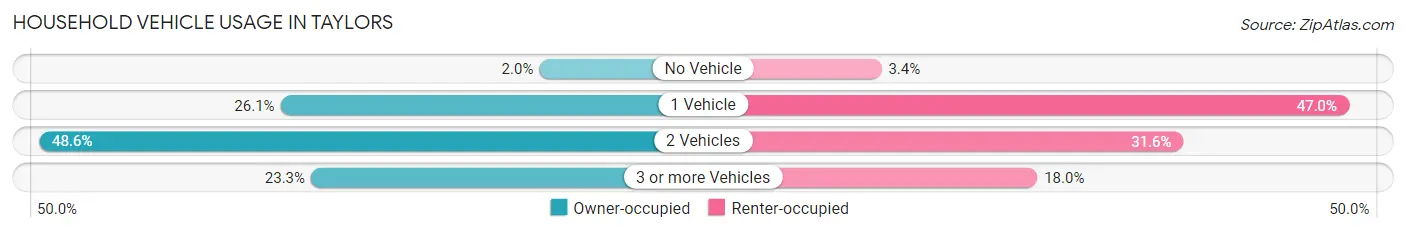
| Vehicles per Household | Owner-occupied | Renter-occupied |
| No Vehicle | 139 (2.0%) | 68 (3.4%) |
| 1 Vehicle | 1,853 (26.1%) | 938 (47.0%) |
| 2 Vehicles | 3,450 (48.6%) | 630 (31.6%) |
| 3 or more Vehicles | 1,651 (23.3%) | 358 (17.9%) |
| Total | 7,093 (100.0%) | 1,994 (100.0%) |
Real Estate & Mortgages in Taylors
Real Estate and Mortgage Overview in Taylors
| Characteristic | Without Mortgage | With Mortgage |
| Housing Units | 2,665 | 4,428 |
| Median Property Value | $210,100 | $229,200 |
| Median Household Income | $60,583 | $670 |
| Monthly Housing Costs | $393 | $38 |
| Real Estate Taxes | $1,265 | $106 |
Property Value by Mortgage Status in Taylors
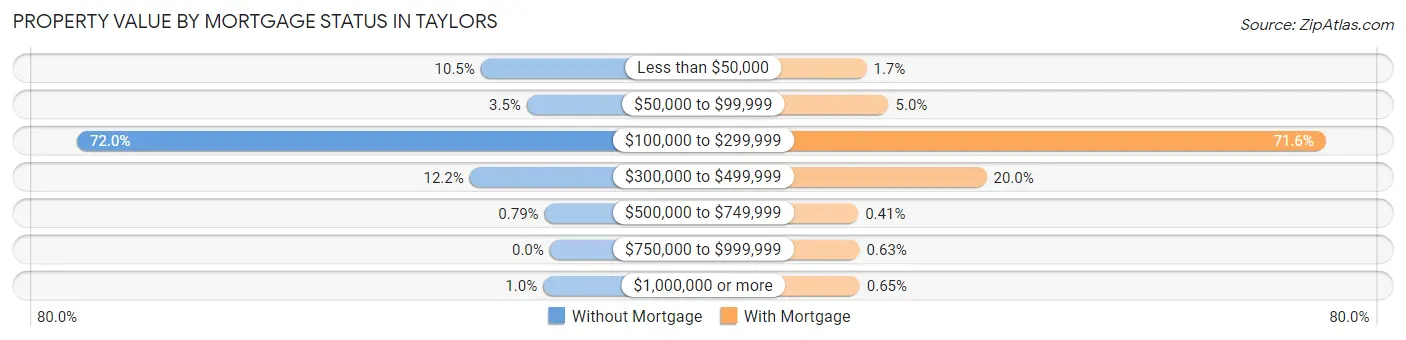
| Property Value | Without Mortgage | With Mortgage |
| Less than $50,000 | 280 (10.5%) | 74 (1.7%) |
| $50,000 to $99,999 | 93 (3.5%) | 223 (5.0%) |
| $100,000 to $299,999 | 1,919 (72.0%) | 3,172 (71.6%) |
| $300,000 to $499,999 | 325 (12.2%) | 884 (20.0%) |
| $500,000 to $749,999 | 21 (0.8%) | 18 (0.4%) |
| $750,000 to $999,999 | 0 (0.0%) | 28 (0.6%) |
| $1,000,000 or more | 27 (1.0%) | 29 (0.6%) |
| Total | 2,665 (100.0%) | 4,428 (100.0%) |
Household Income by Mortgage Status in Taylors
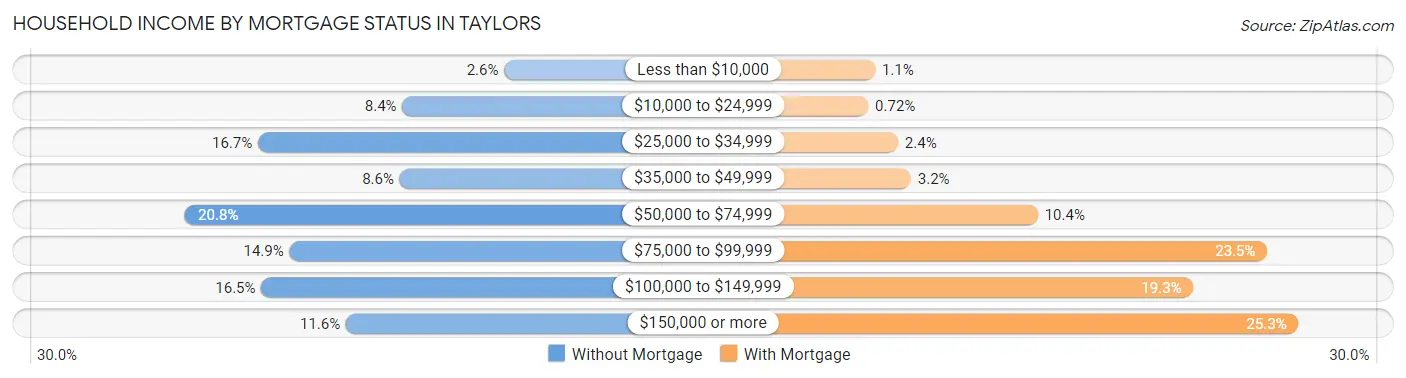
| Household Income | Without Mortgage | With Mortgage |
| Less than $10,000 | 69 (2.6%) | 49 (1.1%) |
| $10,000 to $24,999 | 224 (8.4%) | 32 (0.7%) |
| $25,000 to $34,999 | 444 (16.7%) | 107 (2.4%) |
| $35,000 to $49,999 | 228 (8.6%) | 140 (3.2%) |
| $50,000 to $74,999 | 555 (20.8%) | 461 (10.4%) |
| $75,000 to $99,999 | 396 (14.9%) | 1,042 (23.5%) |
| $100,000 to $149,999 | 439 (16.5%) | 855 (19.3%) |
| $150,000 or more | 310 (11.6%) | 1,121 (25.3%) |
| Total | 2,665 (100.0%) | 4,428 (100.0%) |
Property Value to Household Income Ratio in Taylors
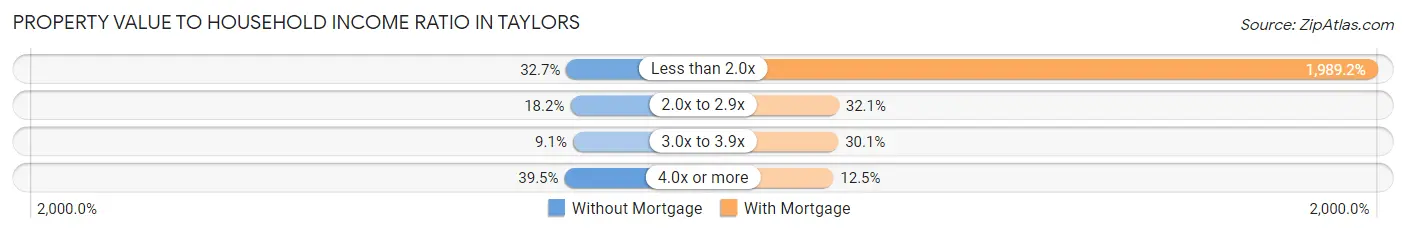
| Value-to-Income Ratio | Without Mortgage | With Mortgage |
| Less than 2.0x | 871 (32.7%) | 88,082 (1,989.2%) |
| 2.0x to 2.9x | 485 (18.2%) | 1,422 (32.1%) |
| 3.0x to 3.9x | 242 (9.1%) | 1,331 (30.1%) |
| 4.0x or more | 1,052 (39.5%) | 553 (12.5%) |
| Total | 2,665 (100.0%) | 4,428 (100.0%) |
Real Estate Taxes by Mortgage Status in Taylors
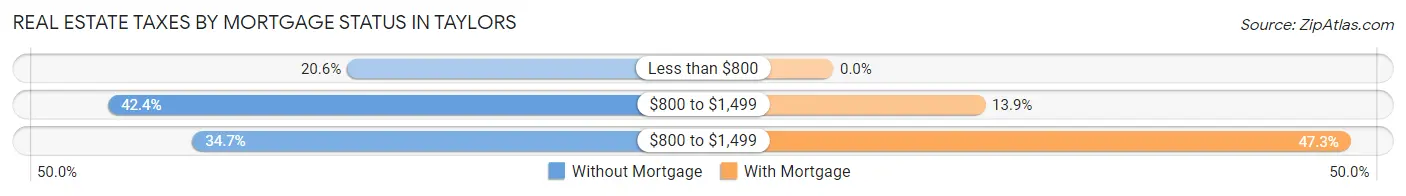
| Property Taxes | Without Mortgage | With Mortgage |
| Less than $800 | 548 (20.6%) | 0 (0.0%) |
| $800 to $1,499 | 1,129 (42.4%) | 615 (13.9%) |
| $800 to $1,499 | 924 (34.7%) | 2,093 (47.3%) |
| Total | 2,665 (100.0%) | 4,428 (100.0%) |
Health & Disability in Taylors
Health Insurance Coverage by Age in Taylors
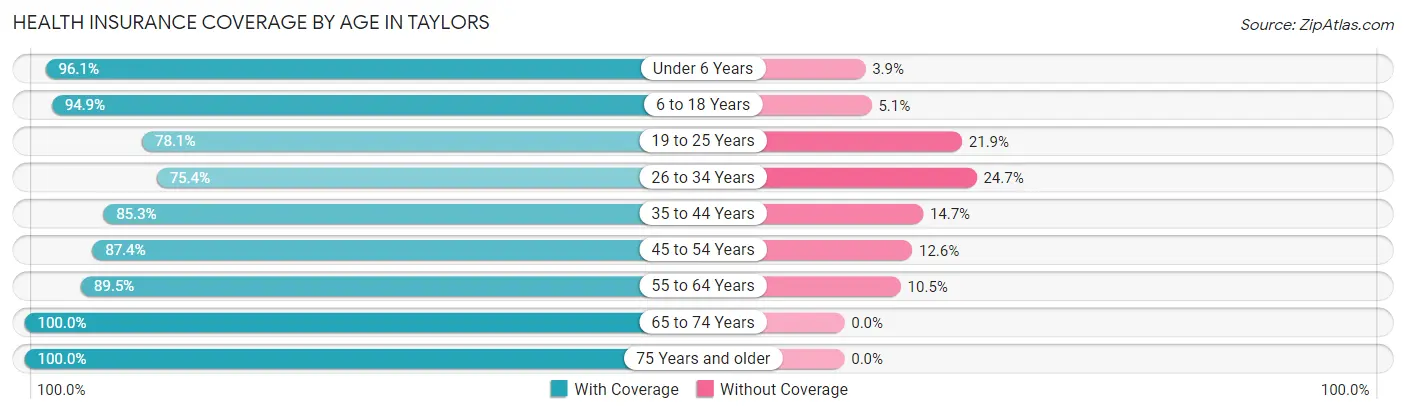
| Age Bracket | With Coverage | Without Coverage |
| Under 6 Years | 2,070 (96.1%) | 84 (3.9%) |
| 6 to 18 Years | 3,336 (94.9%) | 178 (5.1%) |
| 19 to 25 Years | 1,977 (78.1%) | 555 (21.9%) |
| 26 to 34 Years | 1,807 (75.3%) | 591 (24.6%) |
| 35 to 44 Years | 2,797 (85.3%) | 481 (14.7%) |
| 45 to 54 Years | 2,325 (87.4%) | 336 (12.6%) |
| 55 to 64 Years | 2,486 (89.5%) | 292 (10.5%) |
| 65 to 74 Years | 2,039 (100.0%) | 0 (0.0%) |
| 75 Years and older | 1,635 (100.0%) | 0 (0.0%) |
| Total | 20,472 (89.0%) | 2,517 (11.0%) |
Health Insurance Coverage by Citizenship Status in Taylors
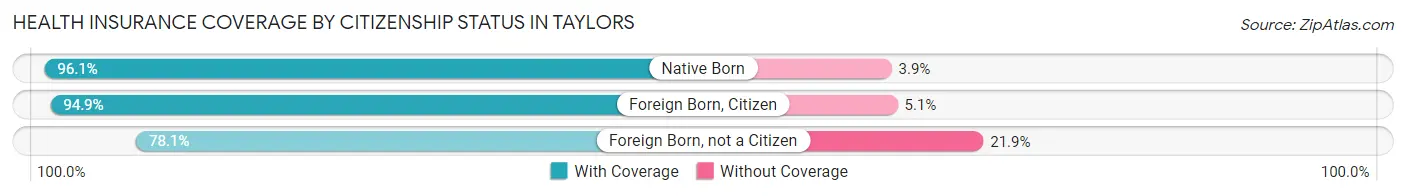
| Citizenship Status | With Coverage | Without Coverage |
| Native Born | 2,070 (96.1%) | 84 (3.9%) |
| Foreign Born, Citizen | 3,336 (94.9%) | 178 (5.1%) |
| Foreign Born, not a Citizen | 1,977 (78.1%) | 555 (21.9%) |
Health Insurance Coverage by Household Income in Taylors
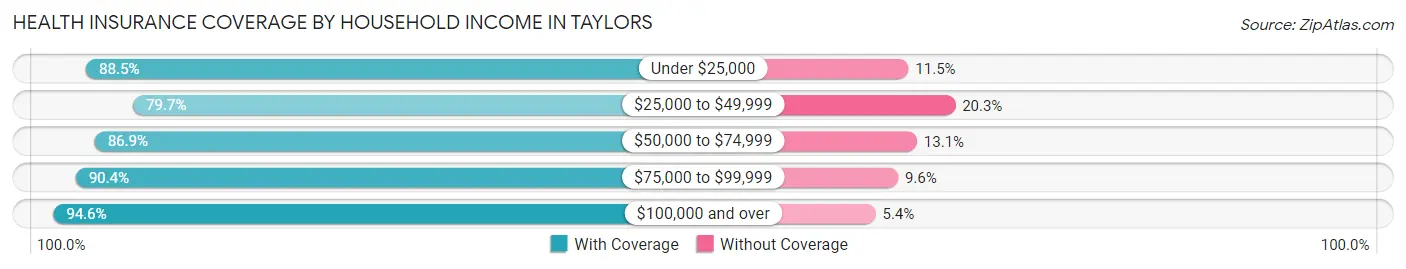
| Household Income | With Coverage | Without Coverage |
| Under $25,000 | 1,180 (88.5%) | 154 (11.5%) |
| $25,000 to $49,999 | 3,366 (79.7%) | 858 (20.3%) |
| $50,000 to $74,999 | 4,674 (86.9%) | 707 (13.1%) |
| $75,000 to $99,999 | 3,215 (90.4%) | 341 (9.6%) |
| $100,000 and over | 8,024 (94.6%) | 457 (5.4%) |
Public vs Private Health Insurance Coverage by Age in Taylors
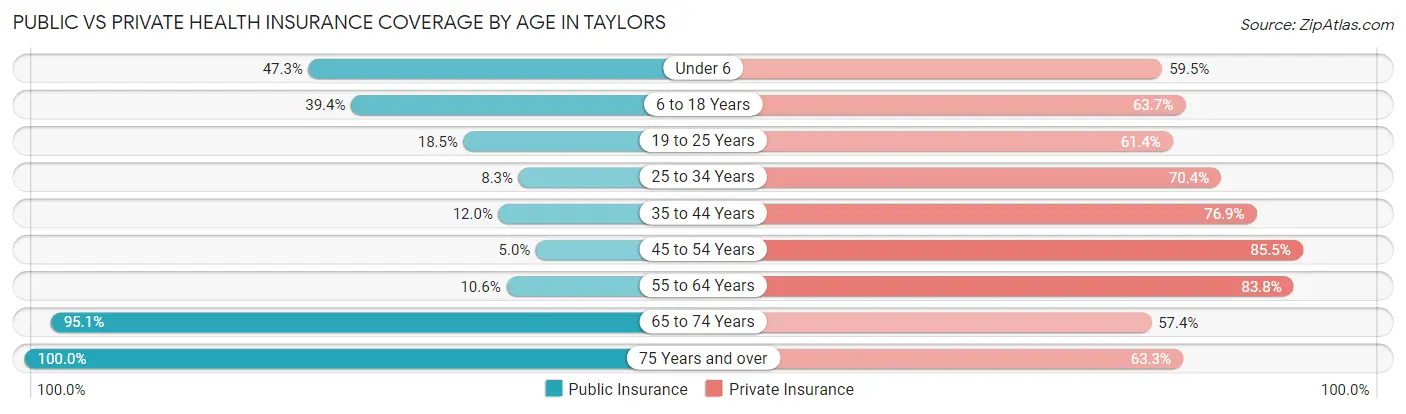
| Age Bracket | Public Insurance | Private Insurance |
| Under 6 | 1,018 (47.3%) | 1,281 (59.5%) |
| 6 to 18 Years | 1,383 (39.4%) | 2,238 (63.7%) |
| 19 to 25 Years | 468 (18.5%) | 1,555 (61.4%) |
| 25 to 34 Years | 198 (8.3%) | 1,688 (70.4%) |
| 35 to 44 Years | 393 (12.0%) | 2,522 (76.9%) |
| 45 to 54 Years | 134 (5.0%) | 2,276 (85.5%) |
| 55 to 64 Years | 293 (10.5%) | 2,329 (83.8%) |
| 65 to 74 Years | 1,940 (95.1%) | 1,171 (57.4%) |
| 75 Years and over | 1,635 (100.0%) | 1,035 (63.3%) |
| Total | 7,462 (32.5%) | 16,095 (70.0%) |
Disability Status by Sex by Age in Taylors
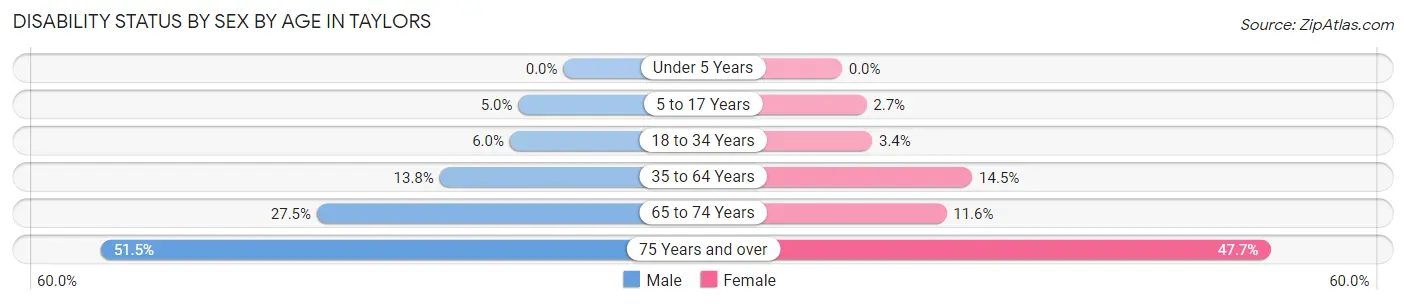
| Age Bracket | Male | Female |
| Under 5 Years | 0 (0.0%) | 0 (0.0%) |
| 5 to 17 Years | 76 (5.0%) | 49 (2.7%) |
| 18 to 34 Years | 164 (6.0%) | 90 (3.4%) |
| 35 to 64 Years | 590 (13.8%) | 644 (14.5%) |
| 65 to 74 Years | 213 (27.5%) | 147 (11.6%) |
| 75 Years and over | 406 (51.5%) | 404 (47.7%) |
Disability Class by Sex by Age in Taylors
Disability Class: Hearing Difficulty
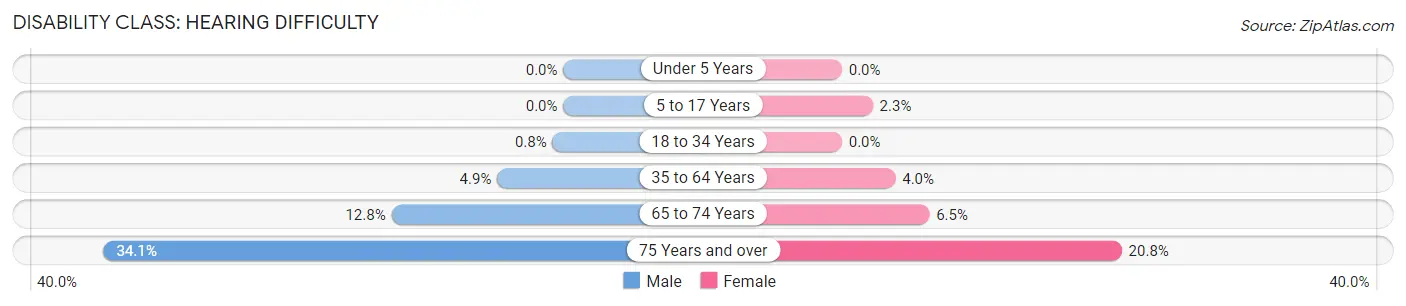
| Age Bracket | Male | Female |
| Under 5 Years | 0 (0.0%) | 0 (0.0%) |
| 5 to 17 Years | 0 (0.0%) | 41 (2.3%) |
| 18 to 34 Years | 22 (0.8%) | 0 (0.0%) |
| 35 to 64 Years | 210 (4.9%) | 176 (4.0%) |
| 65 to 74 Years | 99 (12.8%) | 82 (6.5%) |
| 75 Years and over | 269 (34.1%) | 176 (20.8%) |
Disability Class: Vision Difficulty
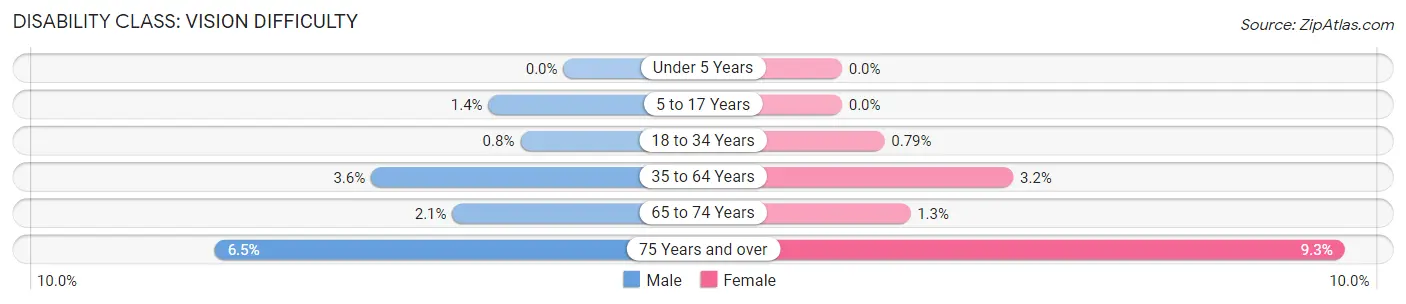
| Age Bracket | Male | Female |
| Under 5 Years | 0 (0.0%) | 0 (0.0%) |
| 5 to 17 Years | 21 (1.4%) | 0 (0.0%) |
| 18 to 34 Years | 22 (0.8%) | 21 (0.8%) |
| 35 to 64 Years | 153 (3.6%) | 141 (3.2%) |
| 65 to 74 Years | 16 (2.1%) | 16 (1.3%) |
| 75 Years and over | 51 (6.5%) | 79 (9.3%) |
Disability Class: Cognitive Difficulty
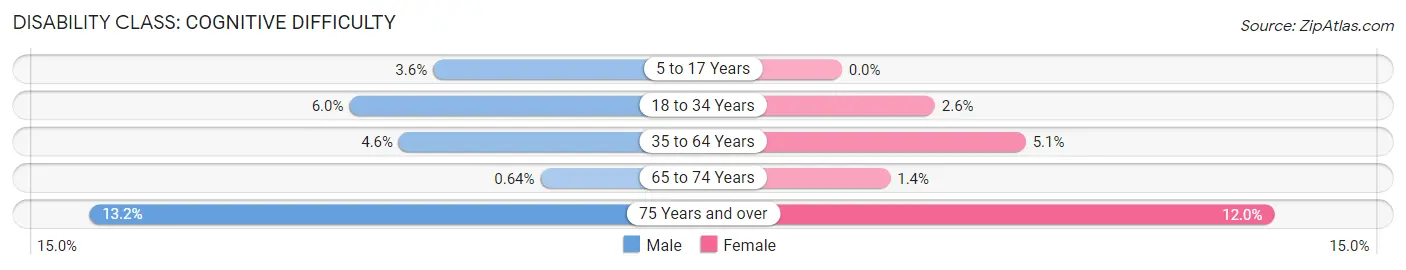
| Age Bracket | Male | Female |
| 5 to 17 Years | 55 (3.6%) | 0 (0.0%) |
| 18 to 34 Years | 164 (6.0%) | 69 (2.6%) |
| 35 to 64 Years | 196 (4.6%) | 227 (5.1%) |
| 65 to 74 Years | 5 (0.6%) | 17 (1.3%) |
| 75 Years and over | 104 (13.2%) | 102 (12.0%) |
Disability Class: Ambulatory Difficulty
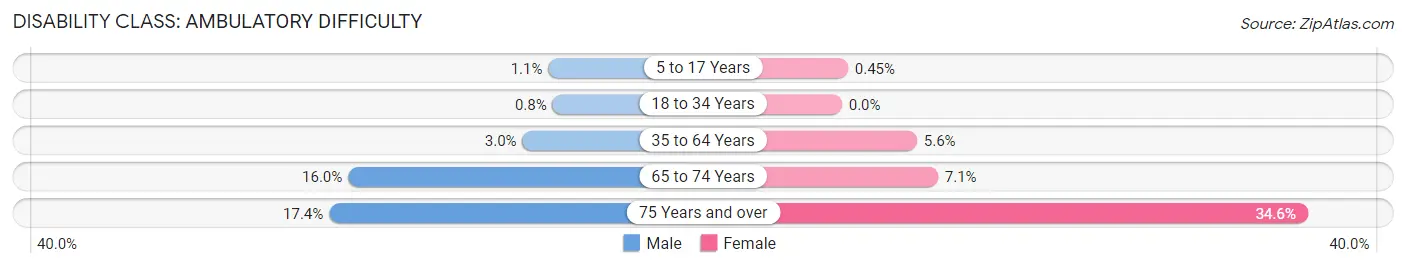
| Age Bracket | Male | Female |
| 5 to 17 Years | 17 (1.1%) | 8 (0.4%) |
| 18 to 34 Years | 22 (0.8%) | 0 (0.0%) |
| 35 to 64 Years | 130 (3.0%) | 247 (5.6%) |
| 65 to 74 Years | 124 (16.0%) | 90 (7.1%) |
| 75 Years and over | 137 (17.4%) | 293 (34.6%) |
Disability Class: Self-Care Difficulty
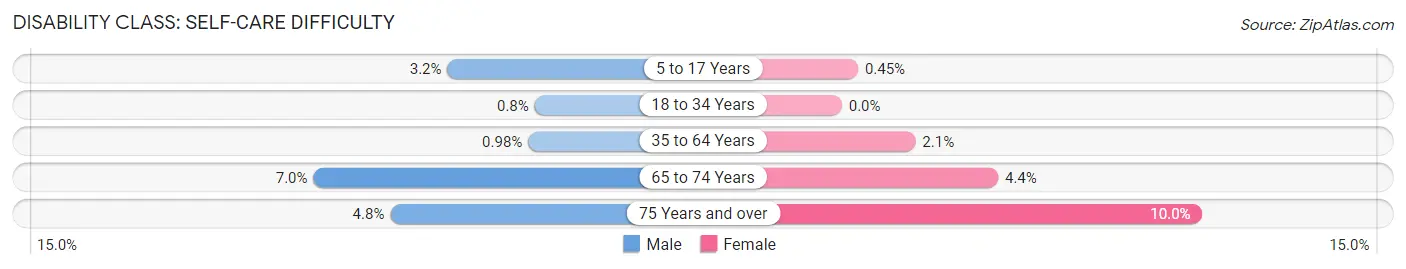
| Age Bracket | Male | Female |
| 5 to 17 Years | 49 (3.2%) | 8 (0.4%) |
| 18 to 34 Years | 22 (0.8%) | 0 (0.0%) |
| 35 to 64 Years | 42 (1.0%) | 91 (2.1%) |
| 65 to 74 Years | 54 (7.0%) | 55 (4.3%) |
| 75 Years and over | 38 (4.8%) | 85 (10.0%) |
Technology Access in Taylors
Computing Device Access in Taylors
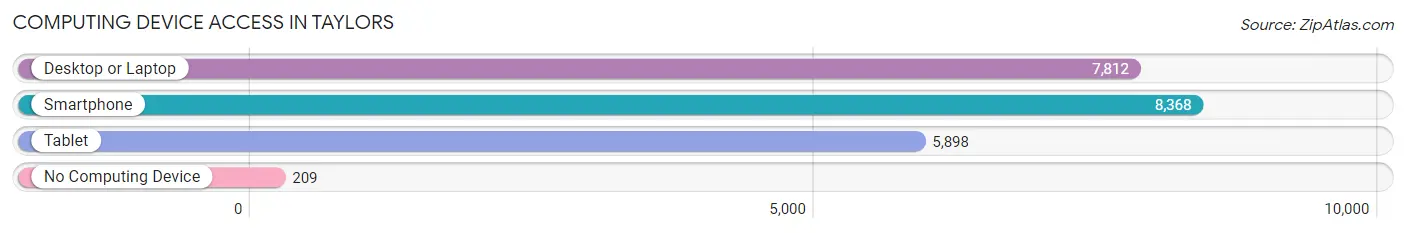
| Device Type | # Households | % Households |
| Desktop or Laptop | 7,812 | 86.0% |
| Smartphone | 8,368 | 92.1% |
| Tablet | 5,898 | 64.9% |
| No Computing Device | 209 | 2.3% |
| Total | 9,087 | 100.0% |
Internet Access in Taylors
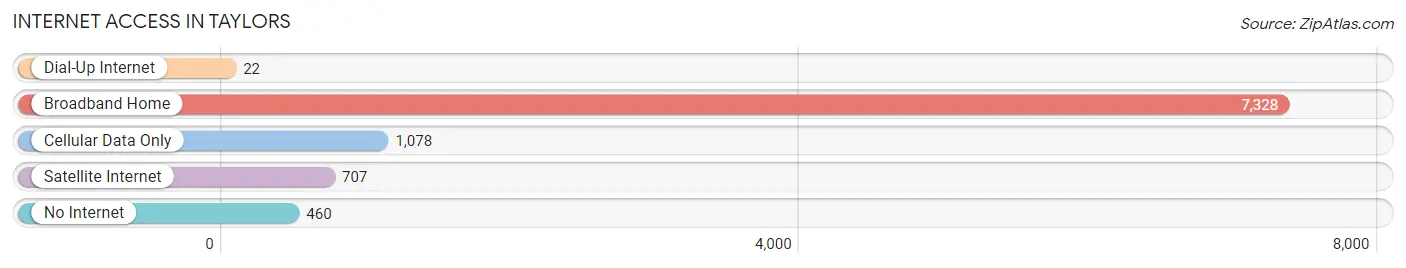
| Internet Type | # Households | % Households |
| Dial-Up Internet | 22 | 0.2% |
| Broadband Home | 7,328 | 80.6% |
| Cellular Data Only | 1,078 | 11.9% |
| Satellite Internet | 707 | 7.8% |
| No Internet | 460 | 5.1% |
| Total | 9,087 | 100.0% |
Taylors Summary
Taylors is a small town located in Greenville County, South Carolina. It is situated in the foothills of the Blue Ridge Mountains, approximately 15 miles east of downtown Greenville. The town was founded in 1872 and has a population of approximately 21,000 people.
Geography
Taylors is located in the foothills of the Blue Ridge Mountains, approximately 15 miles east of downtown Greenville. The town is situated in a valley between two mountain ridges, the Blue Ridge Mountains to the west and the Appalachian Mountains to the east. The town is located at an elevation of 890 feet above sea level. The town is surrounded by several small towns and villages, including Greer, Travelers Rest, and Slater-Marietta.
The town is located in a temperate climate zone, with hot summers and mild winters. The average annual temperature is around 60 degrees Fahrenheit. The average annual precipitation is around 45 inches.
Economy
Taylors is home to several large employers, including Michelin North America, which has a large tire manufacturing plant in the town. Other major employers include the Greenville County School District, the Greenville County Sheriff's Office, and the Greenville County Library System.
The town is also home to several small businesses, including restaurants, retail stores, and professional services. The town is also home to several churches and other religious organizations.
Demographics
As of the 2010 census, the population of Taylors was 21,617. The racial makeup of the town was 79.3% White, 14.2% African American, 0.4% Native American, 1.7% Asian, 0.1% Pacific Islander, and 4.3% from other races. Hispanic or Latino of any race were 6.2% of the population.
The median household income in Taylors was $50,945, and the median family income was $60,945. The per capita income for the town was $25,945. About 8.3% of families and 10.7% of the population were below the poverty line, including 14.2% of those under age 18 and 8.2% of those age 65 or over.
Education
Taylors is served by the Greenville County School District. The town is home to several elementary schools, a middle school, and a high school. The town is also home to several private schools, including the Taylors Christian Academy and the Taylors First Baptist Academy.
Conclusion
Taylors is a small town located in Greenville County, South Carolina. It is situated in the foothills of the Blue Ridge Mountains, approximately 15 miles east of downtown Greenville. The town was founded in 1872 and has a population of approximately 21,000 people. The town is home to several large employers, including Michelin North America, and several small businesses. The town is also home to several churches and other religious organizations. The town is served by the Greenville County School District, and is home to several elementary schools, a middle school, and a high school.
Common Questions
What is Per Capita Income in Taylors?
Per Capita income in Taylors is $33,981.
What is the Median Family Income in Taylors?
Median Family Income in Taylors is $82,037.
What is the Median Household income in Taylors?
Median Household Income in Taylors is $70,234.
What is Income or Wage Gap in Taylors?
Income or Wage Gap in Taylors is 22.4%.
Women in Taylors earn 77.6 cents for every dollar earned by a man.
What is Inequality or Gini Index in Taylors?
Inequality or Gini Index in Taylors is 0.37.
What is the Total Population of Taylors?
Total Population of Taylors is 23,005.
What is the Total Male Population of Taylors?
Total Male Population of Taylors is 11,261.
What is the Total Female Population of Taylors?
Total Female Population of Taylors is 11,744.
What is the Ratio of Males per 100 Females in Taylors?
There are 95.89 Males per 100 Females in Taylors.
What is the Ratio of Females per 100 Males in Taylors?
There are 104.29 Females per 100 Males in Taylors.
What is the Median Population Age in Taylors?
Median Population Age in Taylors is 38.1 Years.
What is the Average Family Size in Taylors
Average Family Size in Taylors is 3.0 People.
What is the Average Household Size in Taylors
Average Household Size in Taylors is 2.5 People.
How Large is the Labor Force in Taylors?
There are 12,558 People in the Labor Forcein in Taylors.
What is the Percentage of People in the Labor Force in Taylors?
68.4% of People are in the Labor Force in Taylors.
What is the Unemployment Rate in Taylors?
Unemployment Rate in Taylors is 4.8%.