Cities with the Highest Percentage of Immigrants from Jamaica in the United States
RELATED REPORTS & OPTIONS
Jamaica
United States
Compare Cities
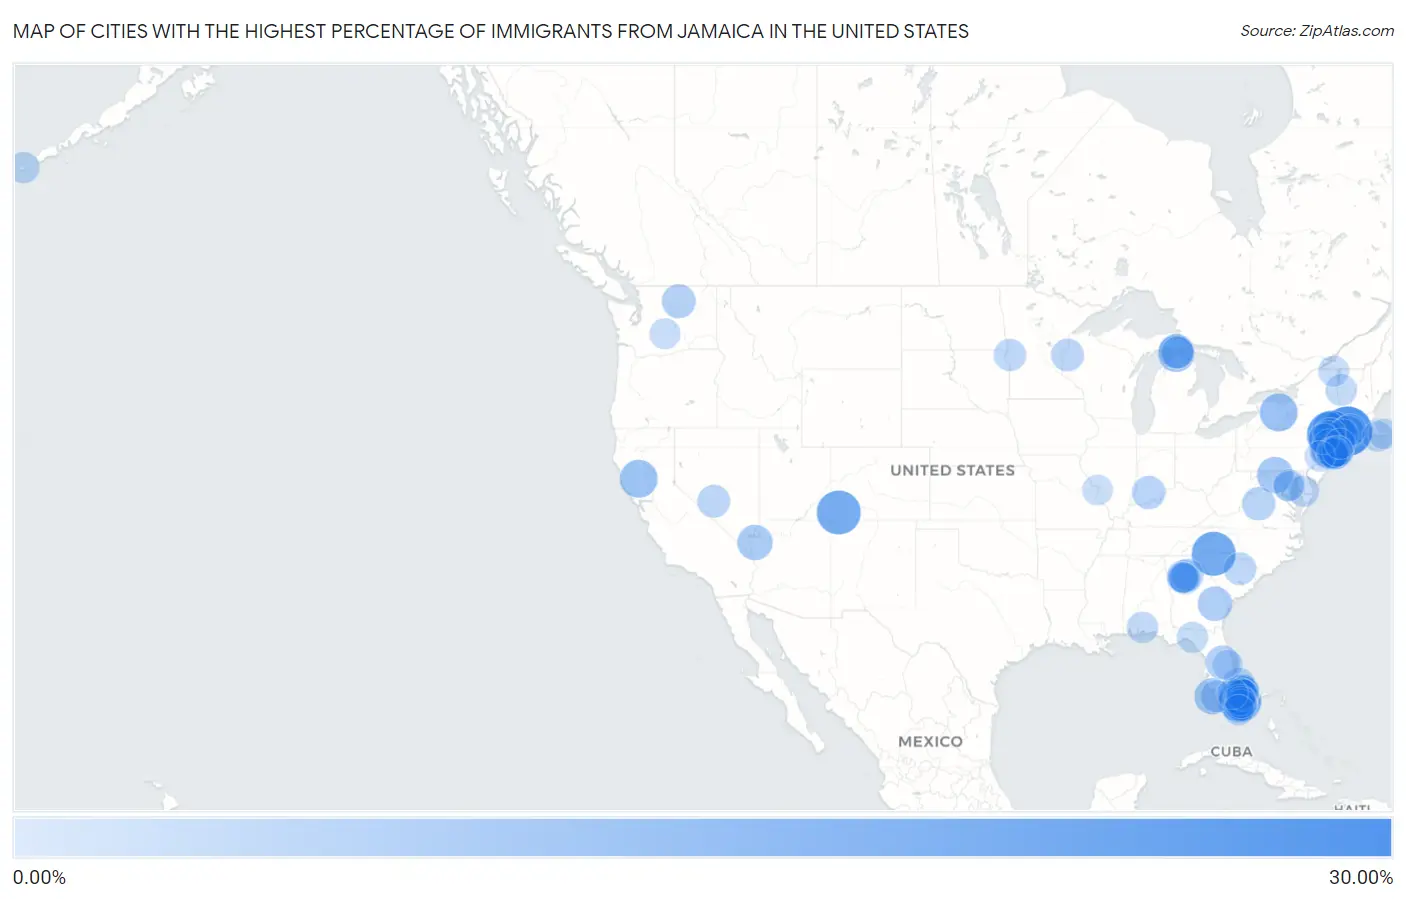
Map of Cities with the Highest Percentage of Immigrants from Jamaica in the United States
0.00%
30.00%
Cities with the Highest Percentage of Immigrants from Jamaica in the United States
| City | Jamaica | vs State | vs National | |
| 1. | Blue Hills | 27.29% | 1.12%(+26.2)#1 | 0.24%(+27.1)#476 |
| 2. | Freedom Plains | 25.74% | 1.14%(+24.6)#27 | 0.24%(+25.5)#757 |
| 3. | Gramling | 20.25% | 0.14%(+20.1)#6 | 0.24%(+20.0)#1,164 |
| 4. | Dolores | 20.19% | 0.034%(+20.2)#16 | 0.24%(+20.0)#1,171 |
| 5. | Lauderdale Lakes | 18.73% | 1.05%(+17.7)#54 | 0.24%(+18.5)#1,172 |
| 6. | Lauderhill | 16.98% | 1.05%(+15.9)#89 | 0.24%(+16.7)#1,173 |
| 7. | Mount Vernon | 14.81% | 1.14%(+13.7)#28 | 0.24%(+14.6)#1,174 |
| 8. | North Lauderdale | 14.80% | 1.05%(+13.7)#90 | 0.24%(+14.6)#1,175 |
| 9. | Honeoye | 12.63% | 1.14%(+11.5)#86 | 0.24%(+12.4)#2,098 |
| 10. | Lodoga | 12.44% | 0.040%(+12.4)#468 | 0.24%(+12.2)#2,141 |
| 11. | Vails Gate | 11.04% | 1.14%(+9.90)#87 | 0.24%(+10.8)#2,142 |
| 12. | Mackinaw City | 10.84% | 0.046%(+10.8)#6 | 0.24%(+10.6)#2,478 |
| 13. | Captiva | 10.60% | 1.05%(+9.55)#165 | 0.24%(+10.4)#2,479 |
| 14. | Fairplay | 10.50% | 0.45%(+10.1)#65 | 0.24%(+10.3)#2,557 |
| 15. | Stacey Street | 9.79% | 1.05%(+8.74)#166 | 0.24%(+9.56)#2,558 |
| 16. | White Hills | 9.43% | 0.038%(+9.40)#62 | 0.24%(+9.20)#2,871 |
| 17. | St Ignace | 8.78% | 0.046%(+8.73)#10 | 0.24%(+8.54)#3,000 |
| 18. | Margate | 8.71% | 1.05%(+7.66)#167 | 0.24%(+8.47)#3,001 |
| 19. | Lake Belvedere Estates | 8.58% | 1.05%(+7.53)#168 | 0.24%(+8.34)#3,002 |
| 20. | Manassas | 8.54% | 0.48%(+8.06)#71 | 0.24%(+8.30)#3,155 |
| 21. | Tamarac | 8.42% | 1.05%(+7.37)#169 | 0.24%(+8.18)#3,156 |
| 22. | South Wilton | 8.40% | 1.12%(+7.28)#21 | 0.24%(+8.17)#3,157 |
| 23. | Clear Lake Cdp Pierce County | 7.95% | 0.045%(+7.91)#83 | 0.24%(+7.71)#3,366 |
| 24. | Miramar | 7.94% | 1.05%(+6.89)#170 | 0.24%(+7.71)#3,367 |
| 25. | Pine Hills | 7.84% | 1.05%(+6.79)#171 | 0.24%(+7.61)#3,368 |
| 26. | Malott | 7.77% | 0.045%(+7.72)#86 | 0.24%(+7.53)#3,444 |
| 27. | East Kingston | 7.36% | 1.14%(+6.22)#164 | 0.24%(+7.12)#3,627 |
| 28. | Hartford | 7.33% | 1.12%(+6.21)#22 | 0.24%(+7.09)#3,628 |
| 29. | Ives Estates | 7.23% | 1.05%(+6.18)#172 | 0.24%(+6.99)#3,629 |
| 30. | Wintergreen | 7.02% | 0.12%(+6.90)#102 | 0.24%(+6.78)#3,787 |
| 31. | French Lick | 6.96% | 0.027%(+6.94)#38 | 0.24%(+6.73)#3,815 |
| 32. | West Park | 6.92% | 1.05%(+5.87)#173 | 0.24%(+6.68)#3,816 |
| 33. | Riviera Beach | 6.88% | 1.05%(+5.83)#188 | 0.24%(+6.64)#3,817 |
| 34. | Lake Park | 6.83% | 1.05%(+5.77)#189 | 0.24%(+6.59)#3,818 |
| 35. | South Valley Stream | 6.71% | 1.14%(+5.57)#165 | 0.24%(+6.47)#3,819 |
| 36. | Stone Mountain | 6.60% | 0.48%(+6.12)#91 | 0.24%(+6.36)#3,820 |
| 37. | Sunrise | 6.59% | 1.05%(+5.54)#190 | 0.24%(+6.35)#3,821 |
| 38. | North Valley Stream | 6.55% | 1.14%(+5.41)#166 | 0.24%(+6.31)#3,822 |
| 39. | Lewis | 6.37% | 0.028%(+6.34)#31 | 0.24%(+6.13)#4,104 |
| 40. | Tonopah | 6.30% | 0.059%(+6.24)#30 | 0.24%(+6.07)#4,105 |
| 41. | Mangonia Park | 6.15% | 1.05%(+5.10)#204 | 0.24%(+5.92)#4,106 |
| 42. | Bishopville | 6.13% | 0.14%(+5.99)#44 | 0.24%(+5.89)#4,107 |
| 43. | Balmville | 6.11% | 1.14%(+4.97)#167 | 0.24%(+5.87)#4,108 |
| 44. | Royal Palm Beach | 5.91% | 1.05%(+4.86)#205 | 0.24%(+5.67)#4,109 |
| 45. | East Orange | 5.89% | 0.51%(+5.38)#34 | 0.24%(+5.65)#4,110 |
| 46. | Dumont | 5.76% | 0.016%(+5.74)#54 | 0.24%(+5.52)#4,466 |
| 47. | Loganville | 5.73% | 0.48%(+5.25)#92 | 0.24%(+5.50)#4,467 |
| 48. | River Park | 5.72% | 1.05%(+4.67)#206 | 0.24%(+5.49)#4,468 |
| 49. | Mackinac Island | 5.62% | 0.046%(+5.58)#11 | 0.24%(+5.38)#4,469 |
| 50. | Harlem Heights | 5.55% | 1.05%(+4.50)#207 | 0.24%(+5.31)#4,470 |
| 51. | Miami Gardens | 5.53% | 1.05%(+4.48)#208 | 0.24%(+5.29)#4,471 |
| 52. | North Amityville | 5.51% | 1.14%(+4.37)#168 | 0.24%(+5.27)#4,472 |
| 53. | Broad Brook | 5.39% | 1.12%(+4.27)#23 | 0.24%(+5.15)#4,473 |
| 54. | Uniondale | 5.32% | 1.14%(+4.18)#169 | 0.24%(+5.08)#4,474 |
| 55. | Franklin Park | 5.28% | 1.05%(+4.23)#248 | 0.24%(+5.04)#4,475 |
| 56. | Silver Lake Cdp Essex County | 5.22% | 0.51%(+4.71)#35 | 0.24%(+4.98)#4,476 |
| 57. | Gough | 5.22% | 0.48%(+4.74)#136 | 0.24%(+4.98)#4,821 |
| 58. | Seminole Manor | 5.20% | 1.05%(+4.15)#249 | 0.24%(+4.96)#4,822 |
| 59. | Thomaston | 5.13% | 1.12%(+4.00)#48 | 0.24%(+4.89)#4,823 |
| 60. | Poughkeepsie | 5.08% | 1.14%(+3.94)#170 | 0.24%(+4.84)#4,824 |
| 61. | Elmont | 5.05% | 1.14%(+3.92)#171 | 0.24%(+4.82)#4,825 |
| 62. | South Floral Park | 4.98% | 1.14%(+3.84)#172 | 0.24%(+4.74)#4,826 |
| 63. | Baldwin | 4.94% | 1.14%(+3.81)#173 | 0.24%(+4.71)#4,827 |
| 64. | West Nyack | 4.91% | 1.14%(+3.77)#174 | 0.24%(+4.67)#4,828 |
| 65. | Allentown | 4.85% | 1.05%(+3.80)#458 | 0.24%(+4.62)#5,109 |
| 66. | Akutan | 4.83% | 0.028%(+4.80)#1 | 0.24%(+4.59)#5,110 |
| 67. | Roosevelt | 4.78% | 1.14%(+3.64)#175 | 0.24%(+4.54)#5,111 |
| 68. | East Middlebury | 4.76% | 0.081%(+4.68)#4 | 0.24%(+4.52)#5,193 |
| 69. | San Castle | 4.73% | 1.05%(+3.68)#459 | 0.24%(+4.49)#5,194 |
| 70. | Glenarden | 4.72% | 0.45%(+4.27)#66 | 0.24%(+4.48)#5,195 |
| 71. | Haverhill | 4.62% | 1.05%(+3.57)#460 | 0.24%(+4.38)#5,196 |
| 72. | Roosevelt Gardens | 4.57% | 1.05%(+3.51)#461 | 0.24%(+4.33)#5,197 |
| 73. | Wyandanch | 4.56% | 1.14%(+3.42)#176 | 0.24%(+4.32)#5,198 |
| 74. | Perry | 4.45% | 1.05%(+3.40)#462 | 0.24%(+4.21)#5,199 |
| 75. | Swan Lake | 4.42% | 1.14%(+3.28)#177 | 0.24%(+4.18)#5,200 |
| 76. | Stonecrest | 4.38% | 0.48%(+3.90)#137 | 0.24%(+4.14)#5,201 |
| 77. | Hempstead | 4.32% | 1.14%(+3.18)#178 | 0.24%(+4.08)#5,202 |
| 78. | Pembroke Park | 4.25% | 1.05%(+3.19)#463 | 0.24%(+4.01)#5,203 |
| 79. | Coral Springs | 4.17% | 1.05%(+3.12)#464 | 0.24%(+3.94)#5,204 |
| 80. | New Hackensack | 4.14% | 1.14%(+3.00)#231 | 0.24%(+3.90)#5,205 |
| 81. | Altona | 4.11% | 1.14%(+2.97)#232 | 0.24%(+3.87)#5,206 |
| 82. | Teaticket | 4.10% | 0.31%(+3.79)#54 | 0.24%(+3.86)#5,426 |
| 83. | Panthersville | 4.08% | 0.48%(+3.60)#138 | 0.24%(+3.84)#5,427 |
| 84. | Naches | 4.05% | 0.045%(+4.01)#87 | 0.24%(+3.82)#5,428 |
| 85. | The Ponds | 4.03% | 0.51%(+3.52)#256 | 0.24%(+3.80)#5,875 |
| 86. | Eldorado | 4.00% | 0.45%(+3.55)#161 | 0.24%(+3.76)#5,926 |
| 87. | Redan | 4.00% | 0.48%(+3.52)#139 | 0.24%(+3.76)#5,927 |
| 88. | South Bay | 4.00% | 1.05%(+2.95)#465 | 0.24%(+3.76)#5,928 |
| 89. | East Lansdowne Borough | 4.00% | 0.17%(+3.82)#64 | 0.24%(+3.76)#5,929 |
| 90. | Palmetto Estates | 3.92% | 1.05%(+2.87)#466 | 0.24%(+3.68)#5,930 |
| 91. | Valley Stream | 3.92% | 1.14%(+2.78)#233 | 0.24%(+3.68)#5,931 |
| 92. | Wheatley Heights | 3.88% | 1.14%(+2.74)#234 | 0.24%(+3.64)#5,932 |
| 93. | Fairview Cdp Westchester County | 3.86% | 1.14%(+2.72)#235 | 0.24%(+3.62)#5,933 |
| 94. | Mechanicstown | 3.84% | 1.14%(+2.70)#236 | 0.24%(+3.60)#5,934 |
| 95. | Weston | 3.82% | 0.51%(+3.31)#267 | 0.24%(+3.59)#6,091 |
| 96. | Bridgeport | 3.74% | 1.12%(+2.62)#49 | 0.24%(+3.50)#6,092 |
| 97. | South Dennis | 3.71% | 0.31%(+3.40)#56 | 0.24%(+3.47)#6,093 |
| 98. | Wedgefield | 3.59% | 1.05%(+2.54)#467 | 0.24%(+3.35)#6,094 |
| 99. | Largo | 3.57% | 0.45%(+3.13)#162 | 0.24%(+3.33)#6,095 |
| 100. | Northwoods | 3.57% | 0.038%(+3.53)#56 | 0.24%(+3.33)#6,373 |
Common Questions
What are the Top 10 Cities with the Highest Percentage of Immigrants from Jamaica in the United States?
Top 10 Cities with the Highest Percentage of Immigrants from Jamaica in the United States are:
#1
27.29%
#2
25.74%
#3
20.25%
#4
20.19%
#5
18.73%
#6
16.98%
#7
14.81%
#8
14.80%
#9
12.63%
#10
12.44%
What city has the Highest Percentage of Immigrants from Jamaica in the United States?
Blue Hills has the Highest Percentage of Immigrants from Jamaica in the United States with 27.29%.
What is the Percentage of Immigrants from Jamaica in the United States?
Percentage of Immigrants from Jamaica in the United States is 0.24%.