Rock Hill, SC Map & Demographics
Rock Hill Map
Rock Hill Overview
$34,480
PER CAPITA INCOME
$79,736
AVG FAMILY INCOME
$60,807
AVG HOUSEHOLD INCOME
24.1%
WAGE / INCOME GAP [ % ]
75.9¢/ $1
WAGE / INCOME GAP [ $ ]
$9,525
FAMILY INCOME DEFICIT
0.44
INEQUALITY / GINI INDEX
74,170
TOTAL POPULATION
34,343
MALE POPULATION
39,827
FEMALE POPULATION
86.23
MALES / 100 FEMALES
115.97
FEMALES / 100 MALES
34.5
MEDIAN AGE
3.0
AVG FAMILY SIZE
2.3
AVG HOUSEHOLD SIZE
40,076
LABOR FORCE [ PEOPLE ]
67.6%
PERCENT IN LABOR FORCE
5.3%
UNEMPLOYMENT RATE
Rock Hill Area Codes
Income in Rock Hill
Income Overview in Rock Hill
Per Capita Income in Rock Hill is $34,480, while median incomes of families and households are $79,736 and $60,807 respectively.
| Characteristic | Number | Measure |
| Per Capita Income | 74,170 | $34,480 |
| Median Family Income | 17,436 | $79,736 |
| Mean Family Income | 17,436 | $100,340 |
| Median Household Income | 30,457 | $60,807 |
| Mean Household Income | 30,457 | $80,609 |
| Income Deficit | 17,436 | $9,525 |
| Wage / Income Gap (%) | 74,170 | 24.08% |
| Wage / Income Gap ($) | 74,170 | 75.92¢ per $1 |
| Gini / Inequality Index | 74,170 | 0.44 |
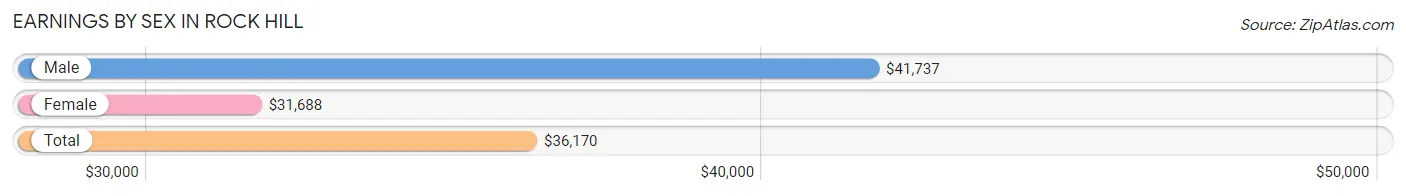
Earnings by Sex in Rock Hill
Average Earnings in Rock Hill are $36,170, $41,737 for men and $31,688 for women, a difference of 24.1%.
| Sex | Number | Average Earnings |
| Male | 20,174 (48.3%) | $41,737 |
| Female | 21,616 (51.7%) | $31,688 |
| Total | 41,790 (100.0%) | $36,170 |
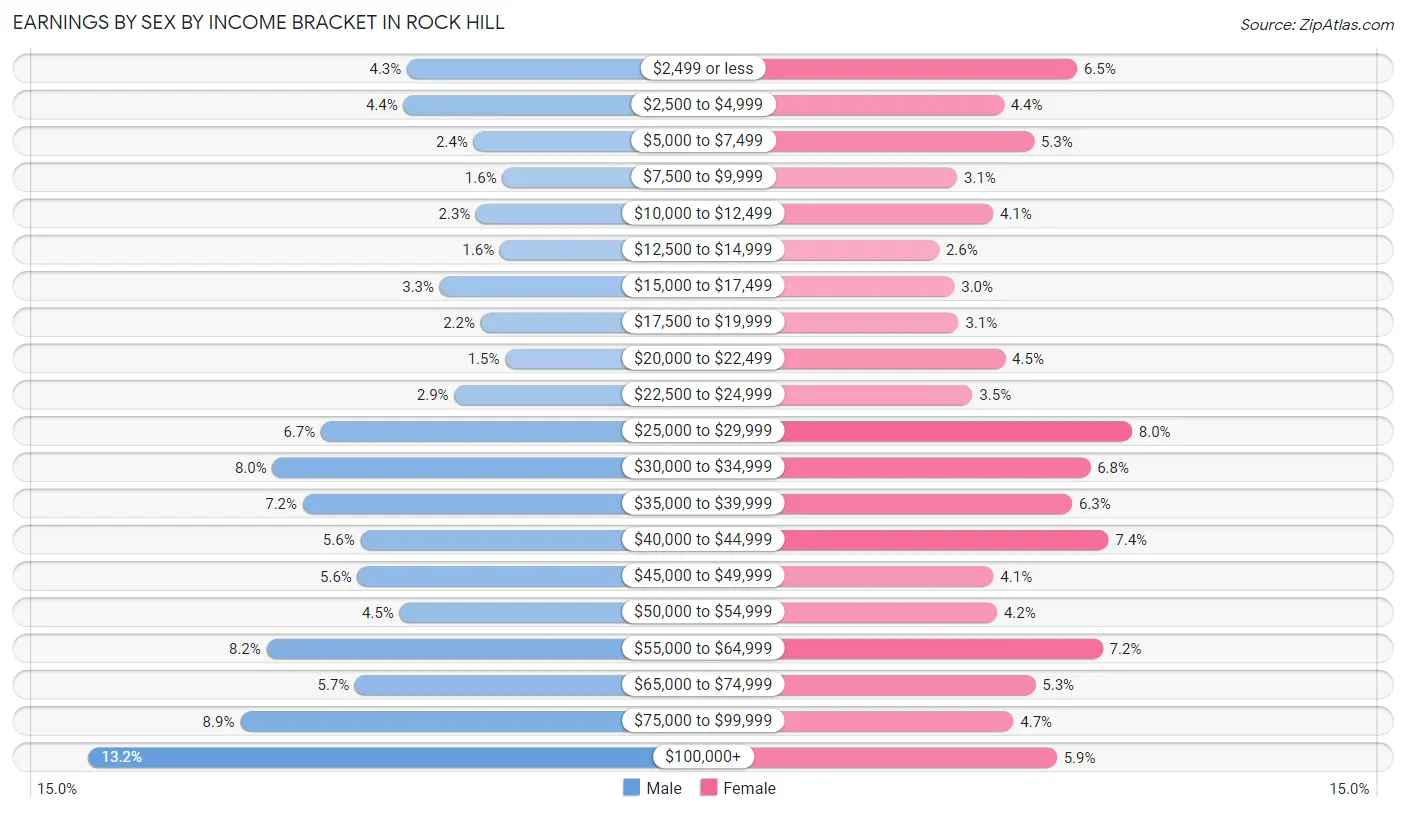
Earnings by Sex by Income Bracket in Rock Hill
The most common earnings brackets in Rock Hill are $100,000+ for men (2,662 | 13.2%) and $25,000 to $29,999 for women (1,732 | 8.0%).
| Income | Male | Female |
| $2,499 or less | 857 (4.3%) | 1,399 (6.5%) |
| $2,500 to $4,999 | 877 (4.3%) | 953 (4.4%) |
| $5,000 to $7,499 | 481 (2.4%) | 1,137 (5.3%) |
| $7,500 to $9,999 | 316 (1.6%) | 670 (3.1%) |
| $10,000 to $12,499 | 467 (2.3%) | 888 (4.1%) |
| $12,500 to $14,999 | 331 (1.6%) | 559 (2.6%) |
| $15,000 to $17,499 | 672 (3.3%) | 652 (3.0%) |
| $17,500 to $19,999 | 440 (2.2%) | 678 (3.1%) |
| $20,000 to $22,499 | 300 (1.5%) | 961 (4.4%) |
| $22,500 to $24,999 | 589 (2.9%) | 763 (3.5%) |
| $25,000 to $29,999 | 1,345 (6.7%) | 1,732 (8.0%) |
| $30,000 to $34,999 | 1,619 (8.0%) | 1,478 (6.8%) |
| $35,000 to $39,999 | 1,449 (7.2%) | 1,369 (6.3%) |
| $40,000 to $44,999 | 1,122 (5.6%) | 1,588 (7.3%) |
| $45,000 to $49,999 | 1,137 (5.6%) | 890 (4.1%) |
| $50,000 to $54,999 | 900 (4.5%) | 913 (4.2%) |
| $55,000 to $64,999 | 1,655 (8.2%) | 1,554 (7.2%) |
| $65,000 to $74,999 | 1,151 (5.7%) | 1,146 (5.3%) |
| $75,000 to $99,999 | 1,804 (8.9%) | 1,011 (4.7%) |
| $100,000+ | 2,662 (13.2%) | 1,275 (5.9%) |
| Total | 20,174 (100.0%) | 21,616 (100.0%) |
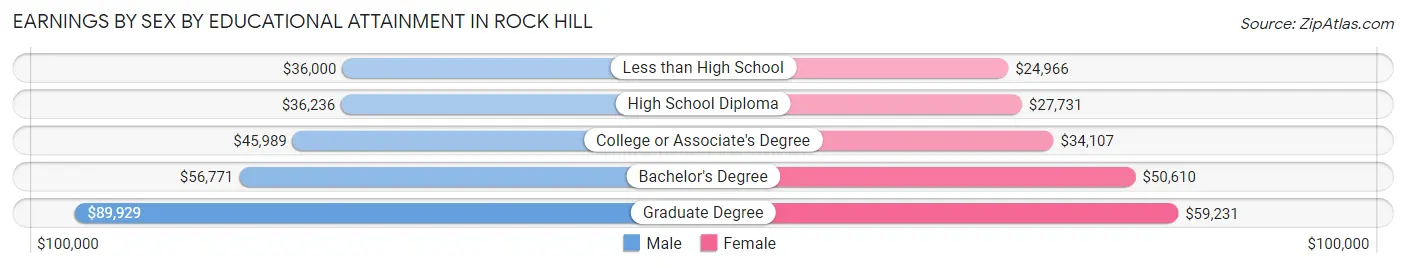
Earnings by Sex by Educational Attainment in Rock Hill
Average earnings in Rock Hill are $47,485 for men and $37,663 for women, a difference of 20.7%. Men with an educational attainment of graduate degree enjoy the highest average annual earnings of $89,929, while those with less than high school education earn the least with $36,000. Women with an educational attainment of graduate degree earn the most with the average annual earnings of $59,231, while those with less than high school education have the smallest earnings of $24,966.
| Educational Attainment | Male Income | Female Income |
| Less than High School | $36,000 | $24,966 |
| High School Diploma | $36,236 | $27,731 |
| College or Associate's Degree | $45,989 | $34,107 |
| Bachelor's Degree | $56,771 | $50,610 |
| Graduate Degree | $89,929 | $59,231 |
| Total | $47,485 | $37,663 |
Family Income in Rock Hill
Family Income Brackets in Rock Hill
According to the Rock Hill family income data, there are 4,115 families falling into the $100,000 to $149,999 income range, which is the most common income bracket and makes up 23.6% of all families. Conversely, the $10,000 to $14,999 income bracket is the least frequent group with only 192 families (1.1%) belonging to this category.
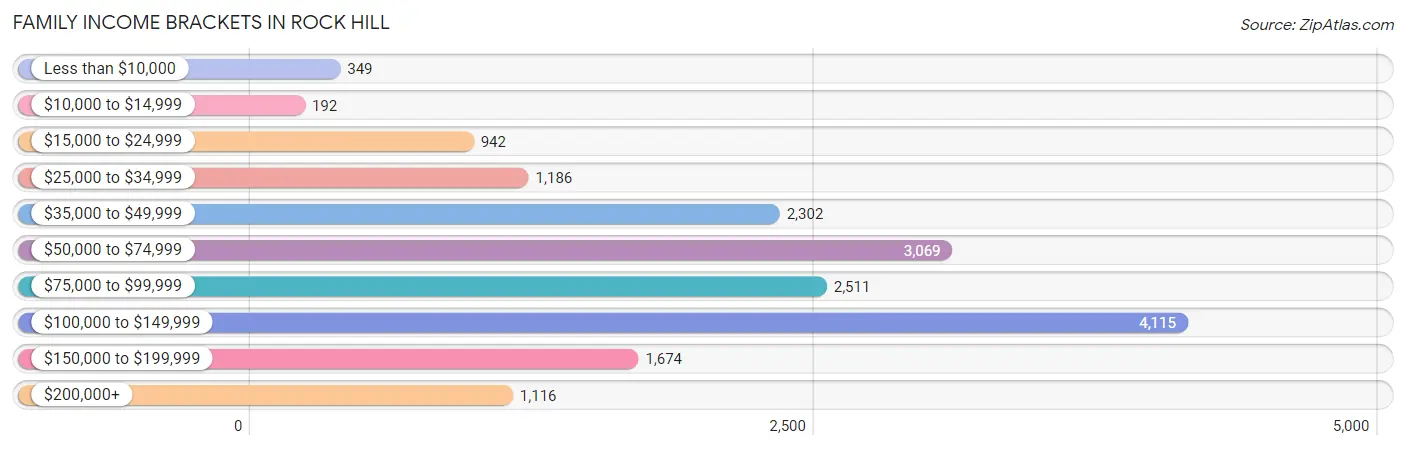
| Income Bracket | # Families | % Families |
| Less than $10,000 | 349 | 2.0% |
| $10,000 to $14,999 | 192 | 1.1% |
| $15,000 to $24,999 | 942 | 5.4% |
| $25,000 to $34,999 | 1,186 | 6.8% |
| $35,000 to $49,999 | 2,302 | 13.2% |
| $50,000 to $74,999 | 3,069 | 17.6% |
| $75,000 to $99,999 | 2,511 | 14.4% |
| $100,000 to $149,999 | 4,115 | 23.6% |
| $150,000 to $199,999 | 1,674 | 9.6% |
| $200,000+ | 1,116 | 6.4% |
Family Income by Famaliy Size in Rock Hill
4-person families (3,100 | 17.8%) account for the highest median family income in Rock Hill with $101,693 per family, while 2-person families (8,871 | 50.9%) have the highest median income of $37,732 per family member.
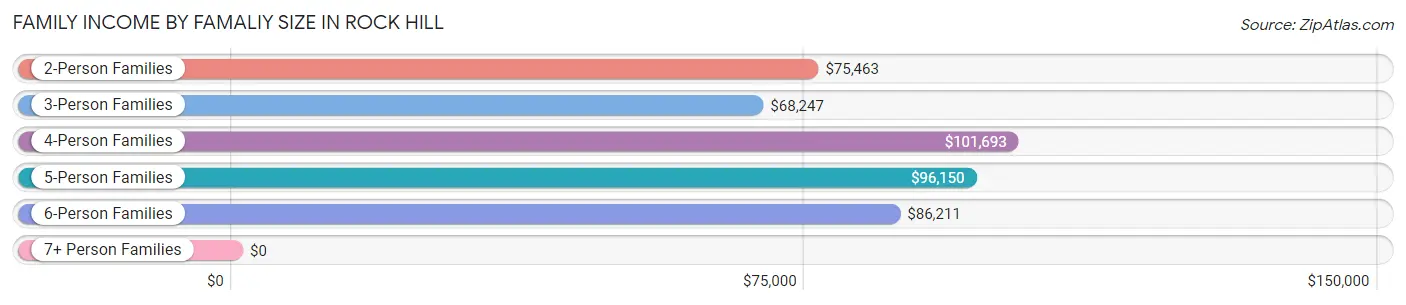
| Income Bracket | # Families | Median Income |
| 2-Person Families | 8,871 (50.9%) | $75,463 |
| 3-Person Families | 3,574 (20.5%) | $68,247 |
| 4-Person Families | 3,100 (17.8%) | $101,693 |
| 5-Person Families | 1,246 (7.1%) | $96,150 |
| 6-Person Families | 503 (2.9%) | $86,211 |
| 7+ Person Families | 142 (0.8%) | $0 |
| Total | 17,436 (100.0%) | $79,736 |
Family Income by Number of Earners in Rock Hill
The median family income in Rock Hill is $79,736, with families comprising 3+ earners (1,454) having the highest median family income of $135,714, while families with 1 earner (6,059) have the lowest median family income of $51,390, accounting for 8.3% and 34.7% of families, respectively.
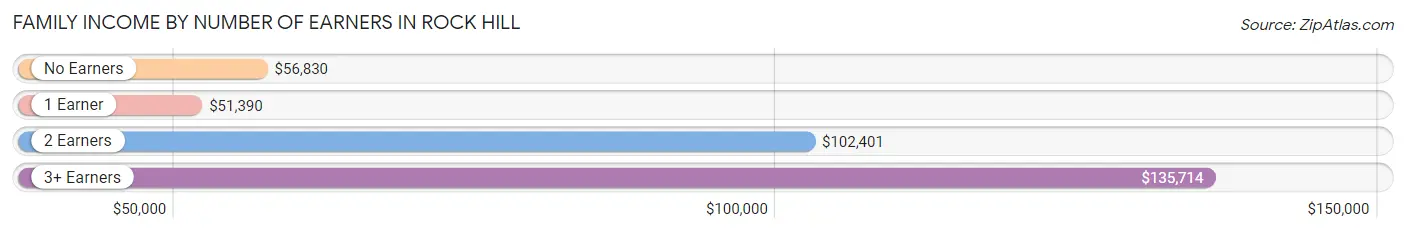
| Number of Earners | # Families | Median Income |
| No Earners | 2,201 (12.6%) | $56,830 |
| 1 Earner | 6,059 (34.7%) | $51,390 |
| 2 Earners | 7,722 (44.3%) | $102,401 |
| 3+ Earners | 1,454 (8.3%) | $135,714 |
| Total | 17,436 (100.0%) | $79,736 |
Household Income in Rock Hill
Household Income Brackets in Rock Hill
With 6,000 households falling in the category, the $50,000 to $74,999 income range is the most frequent in Rock Hill, accounting for 19.7% of all households. In contrast, only 1,157 households (3.8%) fall into the $10,000 to $14,999 income bracket, making it the least populous group.
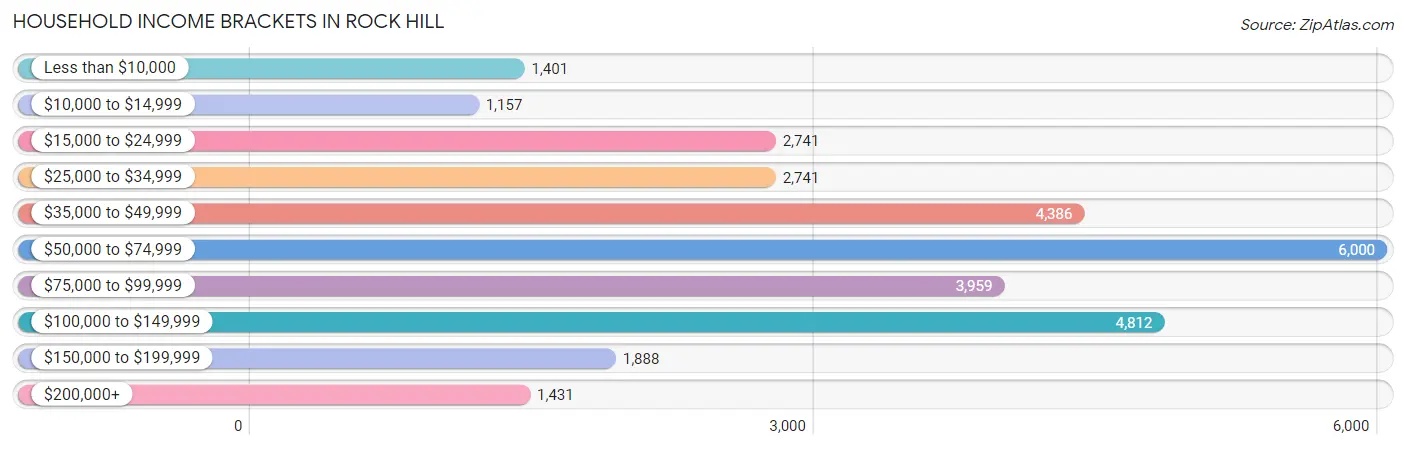
| Income Bracket | # Households | % Households |
| Less than $10,000 | 1,401 | 4.6% |
| $10,000 to $14,999 | 1,157 | 3.8% |
| $15,000 to $24,999 | 2,741 | 9.0% |
| $25,000 to $34,999 | 2,741 | 9.0% |
| $35,000 to $49,999 | 4,386 | 14.4% |
| $50,000 to $74,999 | 6,000 | 19.7% |
| $75,000 to $99,999 | 3,959 | 13.0% |
| $100,000 to $149,999 | 4,812 | 15.8% |
| $150,000 to $199,999 | 1,888 | 6.2% |
| $200,000+ | 1,431 | 4.7% |
Household Income by Householder Age in Rock Hill
The median household income in Rock Hill is $60,807, with the highest median household income of $70,799 found in the 45 to 64 years age bracket for the primary householder. A total of 10,752 households (35.3%) fall into this category. Meanwhile, the 15 to 24 years age bracket for the primary householder has the lowest median household income of $41,542, with 1,910 households (6.3%) in this group.
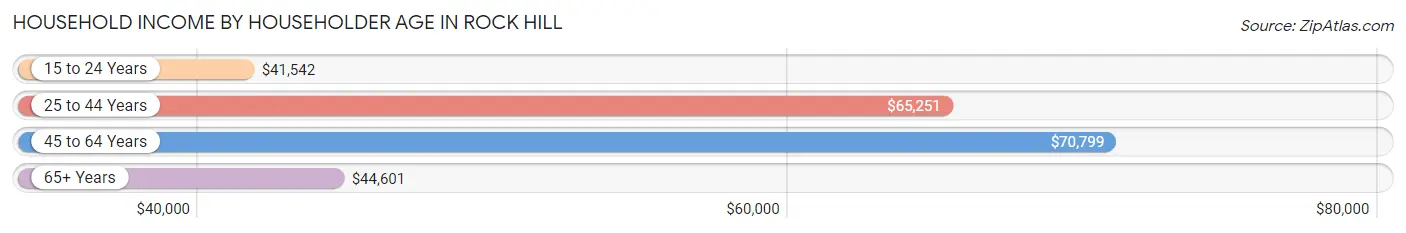
| Income Bracket | # Households | Median Income |
| 15 to 24 Years | 1,910 (6.3%) | $41,542 |
| 25 to 44 Years | 10,956 (36.0%) | $65,251 |
| 45 to 64 Years | 10,752 (35.3%) | $70,799 |
| 65+ Years | 6,839 (22.5%) | $44,601 |
| Total | 30,457 (100.0%) | $60,807 |
Poverty in Rock Hill
Income Below Poverty by Sex and Age in Rock Hill
With 10.1% poverty level for males and 15.5% for females among the residents of Rock Hill, 5 year old males and 18 to 24 year old females are the most vulnerable to poverty, with 188 males (40.2%) and 1,072 females (31.9%) in their respective age groups living below the poverty level.
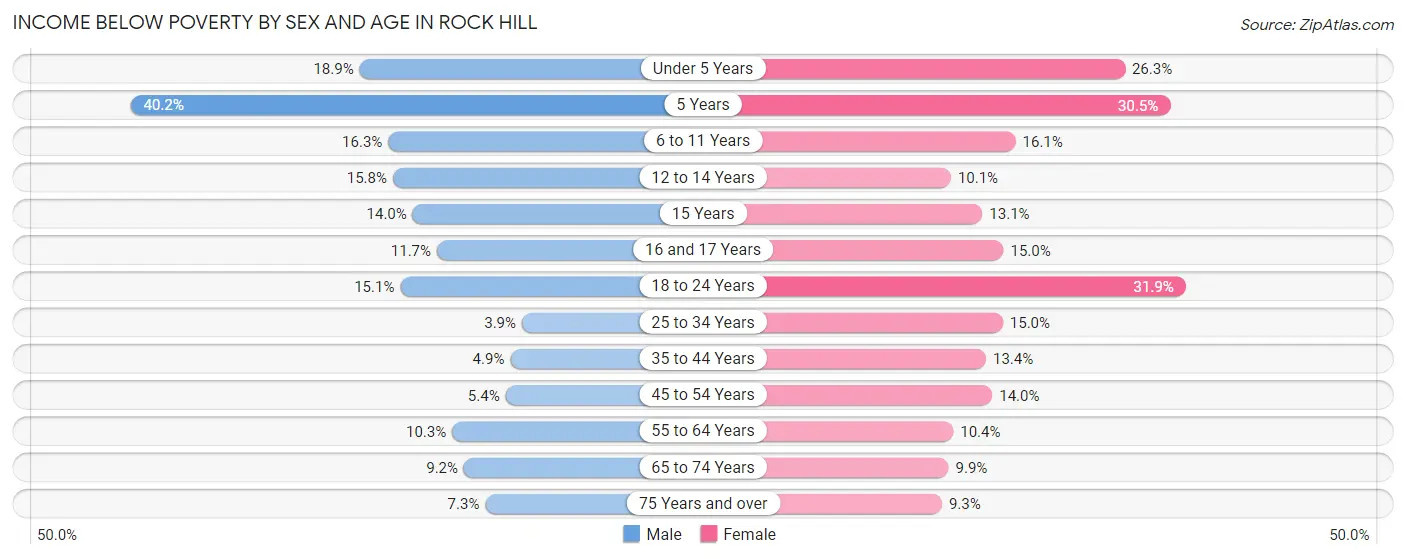
| Age Bracket | Male | Female |
| Under 5 Years | 415 (18.9%) | 556 (26.3%) |
| 5 Years | 188 (40.2%) | 124 (30.5%) |
| 6 to 11 Years | 465 (16.3%) | 537 (16.1%) |
| 12 to 14 Years | 179 (15.8%) | 113 (10.1%) |
| 15 Years | 55 (14.0%) | 59 (13.1%) |
| 16 and 17 Years | 122 (11.7%) | 131 (15.0%) |
| 18 to 24 Years | 549 (15.1%) | 1,072 (31.9%) |
| 25 to 34 Years | 209 (3.8%) | 912 (14.9%) |
| 35 to 44 Years | 201 (4.9%) | 593 (13.4%) |
| 45 to 54 Years | 217 (5.4%) | 677 (14.0%) |
| 55 to 64 Years | 403 (10.3%) | 466 (10.3%) |
| 65 to 74 Years | 256 (9.2%) | 364 (9.9%) |
| 75 Years and over | 96 (7.2%) | 230 (9.3%) |
| Total | 3,355 (10.1%) | 5,834 (15.5%) |
Income Above Poverty by Sex and Age in Rock Hill
According to the poverty statistics in Rock Hill, males aged 25 to 34 years and females aged 75 years and over are the age groups that are most secure financially, with 96.2% of males and 90.7% of females in these age groups living above the poverty line.
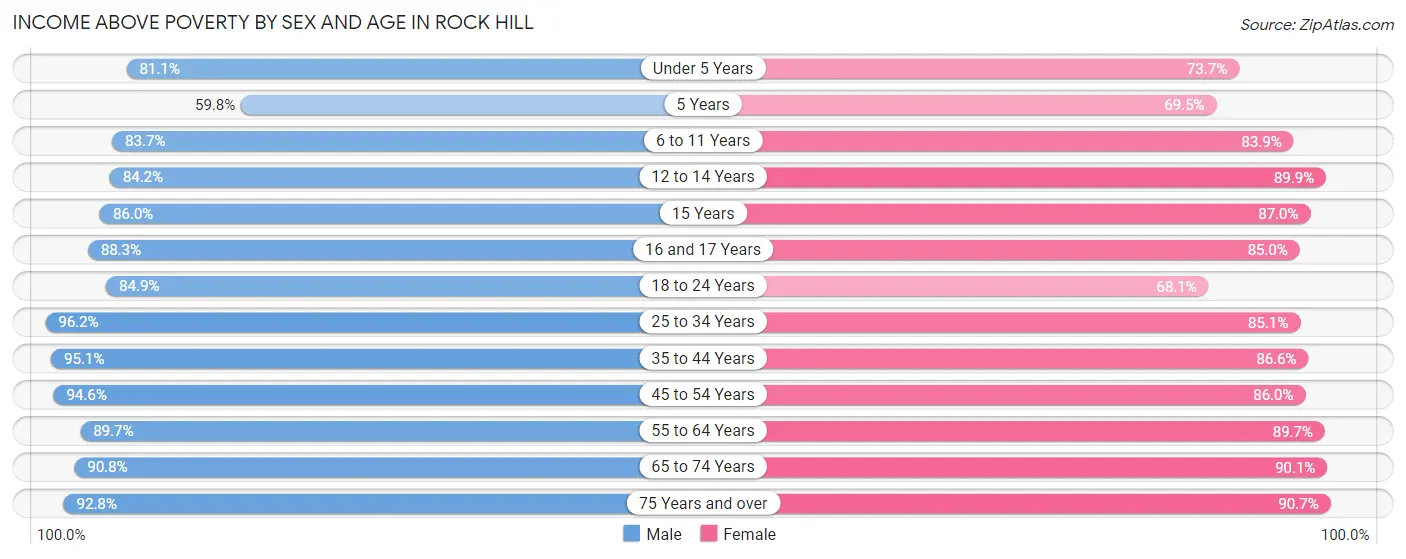
| Age Bracket | Male | Female |
| Under 5 Years | 1,779 (81.1%) | 1,560 (73.7%) |
| 5 Years | 280 (59.8%) | 283 (69.5%) |
| 6 to 11 Years | 2,394 (83.7%) | 2,793 (83.9%) |
| 12 to 14 Years | 952 (84.2%) | 1,003 (89.9%) |
| 15 Years | 338 (86.0%) | 393 (87.0%) |
| 16 and 17 Years | 917 (88.3%) | 742 (85.0%) |
| 18 to 24 Years | 3,076 (84.9%) | 2,287 (68.1%) |
| 25 to 34 Years | 5,213 (96.2%) | 5,188 (85.1%) |
| 35 to 44 Years | 3,873 (95.1%) | 3,837 (86.6%) |
| 45 to 54 Years | 3,825 (94.6%) | 4,169 (86.0%) |
| 55 to 64 Years | 3,498 (89.7%) | 4,035 (89.6%) |
| 65 to 74 Years | 2,518 (90.8%) | 3,310 (90.1%) |
| 75 Years and over | 1,229 (92.7%) | 2,243 (90.7%) |
| Total | 29,892 (89.9%) | 31,843 (84.5%) |
Income Below Poverty Among Married-Couple Families in Rock Hill
The poverty statistics for married-couple families in Rock Hill show that 2.3% or 256 of the total 11,318 families live below the poverty line. Families with 3 or 4 children have the highest poverty rate of 4.0%, comprising of 40 families. On the other hand, families with 5 or more children have the lowest poverty rate of 0.0%, which includes 0 families.
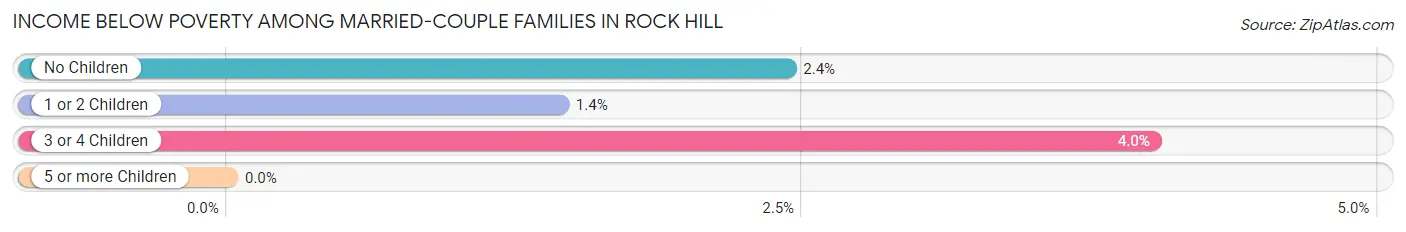
| Children | Above Poverty | Below Poverty |
| No Children | 6,703 (97.6%) | 167 (2.4%) |
| 1 or 2 Children | 3,363 (98.6%) | 49 (1.4%) |
| 3 or 4 Children | 956 (96.0%) | 40 (4.0%) |
| 5 or more Children | 40 (100.0%) | 0 (0.0%) |
| Total | 11,062 (97.7%) | 256 (2.3%) |
Income Below Poverty Among Single-Parent Households in Rock Hill
According to the poverty data in Rock Hill, 13.5% or 140 single-father households and 18.5% or 942 single-mother households are living below the poverty line. Among single-father households, those with 5 or more children have the highest poverty rate, with 4 households (44.4%) experiencing poverty. Likewise, among single-mother households, those with 5 or more children have the highest poverty rate, with 56 households (69.1%) falling below the poverty line.
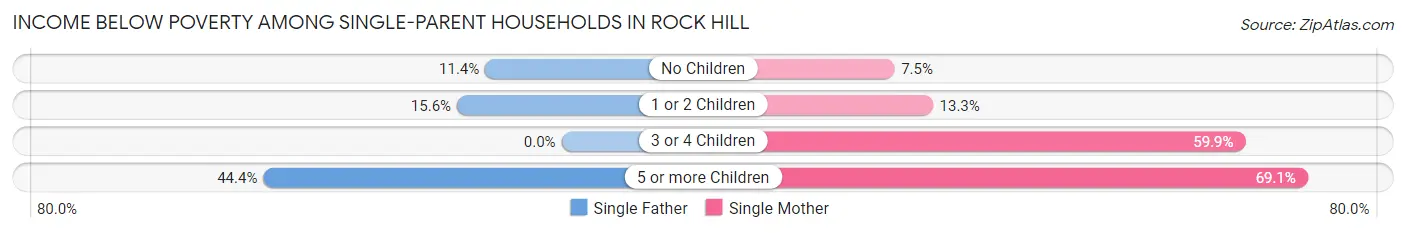
| Children | Single Father | Single Mother |
| No Children | 67 (11.4%) | 113 (7.5%) |
| 1 or 2 Children | 69 (15.6%) | 375 (13.3%) |
| 3 or 4 Children | 0 (0.0%) | 398 (59.9%) |
| 5 or more Children | 4 (44.4%) | 56 (69.1%) |
| Total | 140 (13.5%) | 942 (18.5%) |
Income Below Poverty Among Married-Couple vs Single-Parent Households in Rock Hill
The poverty data for Rock Hill shows that 256 of the married-couple family households (2.3%) and 1,082 of the single-parent households (17.7%) are living below the poverty level. Within the married-couple family households, those with 3 or 4 children have the highest poverty rate, with 40 households (4.0%) falling below the poverty line. Among the single-parent households, those with 5 or more children have the highest poverty rate, with 60 household (66.7%) living below poverty.
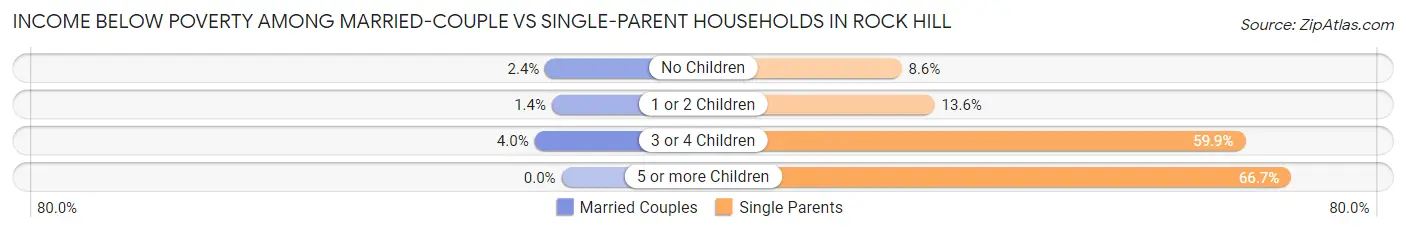
| Children | Married-Couple Families | Single-Parent Households |
| No Children | 167 (2.4%) | 180 (8.6%) |
| 1 or 2 Children | 49 (1.4%) | 444 (13.6%) |
| 3 or 4 Children | 40 (4.0%) | 398 (59.9%) |
| 5 or more Children | 0 (0.0%) | 60 (66.7%) |
| Total | 256 (2.3%) | 1,082 (17.7%) |
Race in Rock Hill
The most populous races in Rock Hill are White / Caucasian (40,583 | 54.7%), Black / African American (28,349 | 38.2%), and Hispanic or Latino (4,454 | 6.0%).
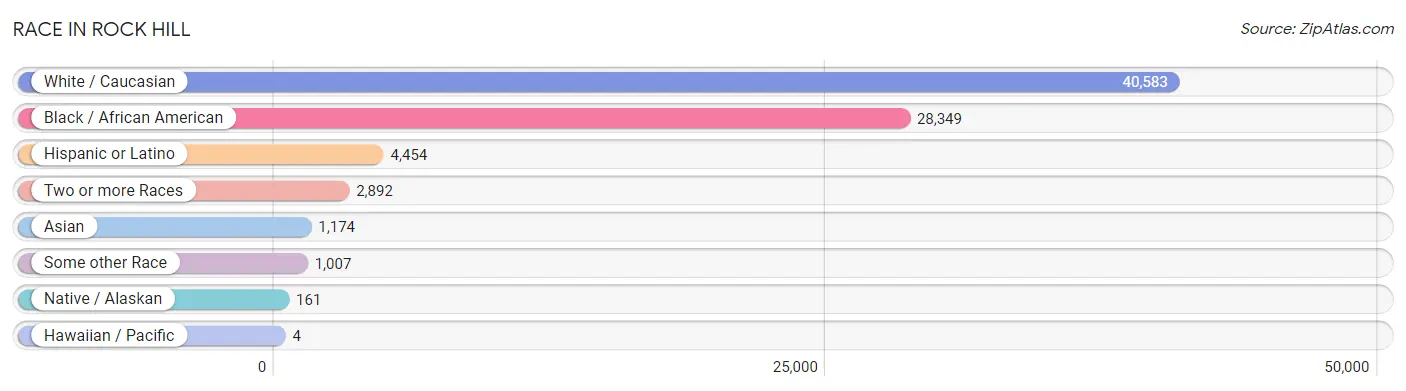
| Race | # Population | % Population |
| Asian | 1,174 | 1.6% |
| Black / African American | 28,349 | 38.2% |
| Hawaiian / Pacific | 4 | 0.0% |
| Hispanic or Latino | 4,454 | 6.0% |
| Native / Alaskan | 161 | 0.2% |
| White / Caucasian | 40,583 | 54.7% |
| Two or more Races | 2,892 | 3.9% |
| Some other Race | 1,007 | 1.4% |
| Total | 74,170 | 100.0% |
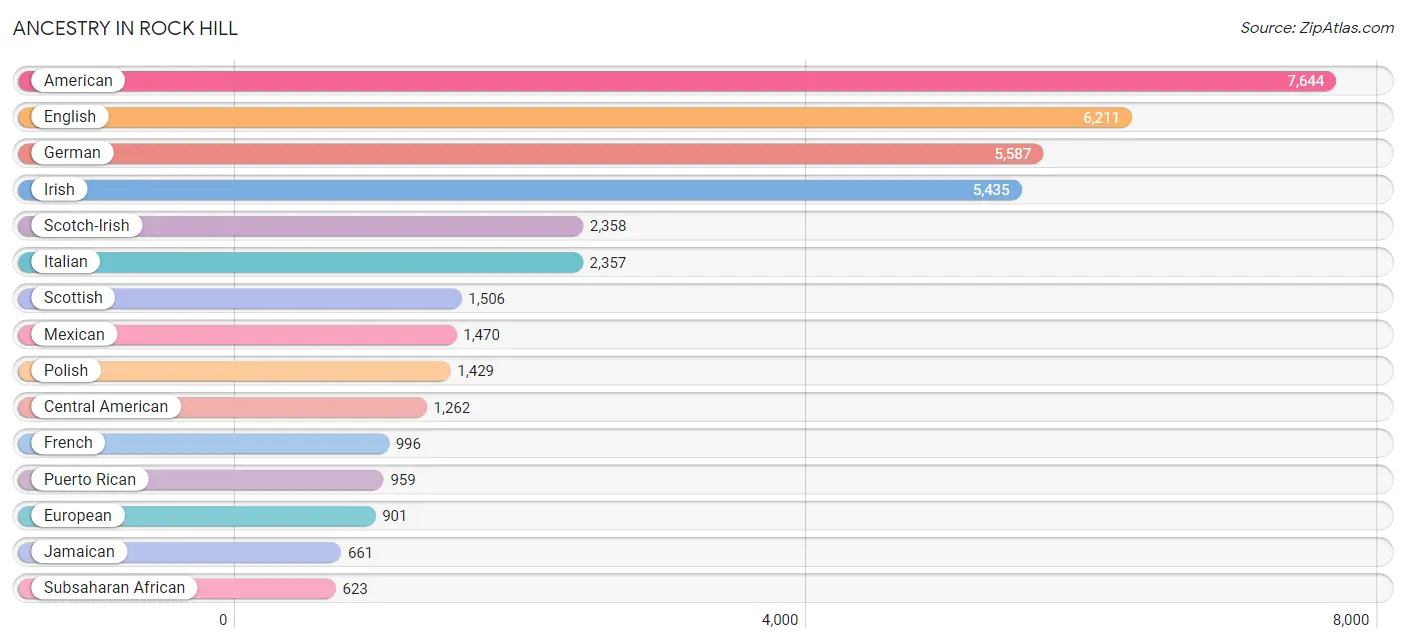
Ancestry in Rock Hill
The most populous ancestries reported in Rock Hill are American (7,644 | 10.3%), English (6,211 | 8.4%), German (5,587 | 7.5%), Irish (5,435 | 7.3%), and Scotch-Irish (2,358 | 3.2%), together accounting for 36.7% of all Rock Hill residents.
| Ancestry | # Population | % Population |
| African | 462 | 0.6% |
| Albanian | 12 | 0.0% |
| American | 7,644 | 10.3% |
| Apache | 12 | 0.0% |
| Arab | 173 | 0.2% |
| Argentinean | 21 | 0.0% |
| Armenian | 21 | 0.0% |
| Assyrian / Chaldean / Syriac | 12 | 0.0% |
| Austrian | 25 | 0.0% |
| Bangladeshi | 8 | 0.0% |
| Belgian | 37 | 0.1% |
| Bhutanese | 106 | 0.1% |
| Blackfeet | 54 | 0.1% |
| Bolivian | 29 | 0.0% |
| Brazilian | 15 | 0.0% |
| British | 314 | 0.4% |
| Burmese | 72 | 0.1% |
| Canadian | 43 | 0.1% |
| Central American | 1,262 | 1.7% |
| Cherokee | 369 | 0.5% |
| Colombian | 69 | 0.1% |
| Costa Rican | 70 | 0.1% |
| Croatian | 29 | 0.0% |
| Cuban | 98 | 0.1% |
| Czech | 96 | 0.1% |
| Czechoslovakian | 21 | 0.0% |
| Danish | 281 | 0.4% |
| Dominican | 63 | 0.1% |
| Dutch | 431 | 0.6% |
| Dutch West Indian | 10 | 0.0% |
| Eastern European | 87 | 0.1% |
| Ecuadorian | 215 | 0.3% |
| Egyptian | 29 | 0.0% |
| English | 6,211 | 8.4% |
| European | 901 | 1.2% |
| Finnish | 162 | 0.2% |
| French | 996 | 1.3% |
| French Canadian | 328 | 0.4% |
| German | 5,587 | 7.5% |
| Greek | 598 | 0.8% |
| Guamanian / Chamorro | 4 | 0.0% |
| Guatemalan | 58 | 0.1% |
| Haitian | 34 | 0.1% |
| Honduran | 423 | 0.6% |
| Hopi | 12 | 0.0% |
| Hungarian | 37 | 0.1% |
| Indian (Asian) | 222 | 0.3% |
| Iranian | 8 | 0.0% |
| Irish | 5,435 | 7.3% |
| Iroquois | 30 | 0.0% |
| Israeli | 13 | 0.0% |
| Italian | 2,357 | 3.2% |
| Jamaican | 661 | 0.9% |
| Japanese | 122 | 0.2% |
| Jordanian | 25 | 0.0% |
| Korean | 386 | 0.5% |
| Latvian | 9 | 0.0% |
| Lebanese | 70 | 0.1% |
| Liberian | 14 | 0.0% |
| Lithuanian | 76 | 0.1% |
| Lumbee | 17 | 0.0% |
| Malaysian | 38 | 0.1% |
| Mexican | 1,470 | 2.0% |
| Mexican American Indian | 32 | 0.0% |
| Native Hawaiian | 11 | 0.0% |
| Nicaraguan | 145 | 0.2% |
| Nigerian | 147 | 0.2% |
| Norwegian | 257 | 0.4% |
| Pakistani | 84 | 0.1% |
| Panamanian | 37 | 0.1% |
| Peruvian | 32 | 0.0% |
| Polish | 1,429 | 1.9% |
| Portuguese | 7 | 0.0% |
| Puerto Rican | 959 | 1.3% |
| Romanian | 24 | 0.0% |
| Russian | 517 | 0.7% |
| Salvadoran | 529 | 0.7% |
| Samoan | 16 | 0.0% |
| Scandinavian | 75 | 0.1% |
| Scotch-Irish | 2,358 | 3.2% |
| Scottish | 1,506 | 2.0% |
| Seminole | 8 | 0.0% |
| Slavic | 7 | 0.0% |
| Slovak | 21 | 0.0% |
| Slovene | 11 | 0.0% |
| South American | 487 | 0.7% |
| South American Indian | 11 | 0.0% |
| Spanish | 37 | 0.1% |
| Sri Lankan | 371 | 0.5% |
| Subsaharan African | 623 | 0.8% |
| Swedish | 307 | 0.4% |
| Swiss | 178 | 0.2% |
| Syrian | 40 | 0.1% |
| Thai | 136 | 0.2% |
| Tohono O'Odham | 15 | 0.0% |
| Turkish | 70 | 0.1% |
| Ukrainian | 150 | 0.2% |
| Uruguayan | 52 | 0.1% |
| Venezuelan | 69 | 0.1% |
| Welsh | 222 | 0.3% |
| West Indian | 25 | 0.0% |
| Yugoslavian | 52 | 0.1% | View All 102 Rows |
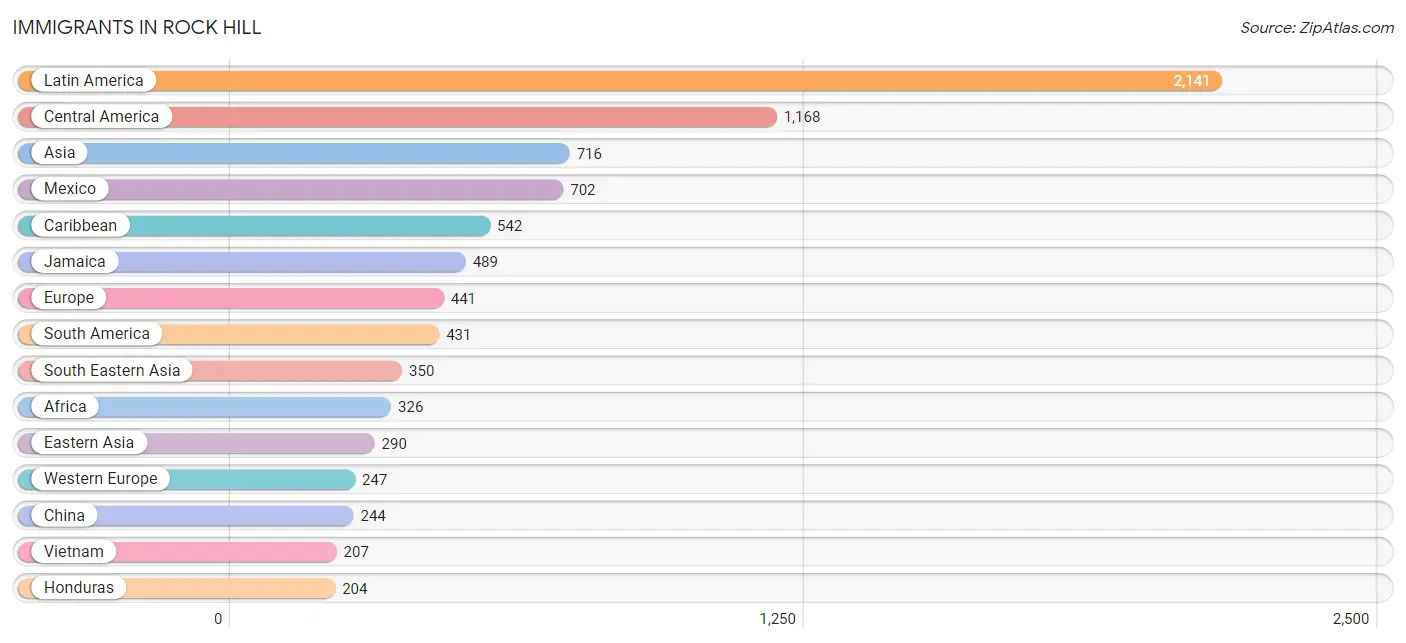
Immigrants in Rock Hill
The most numerous immigrant groups reported in Rock Hill came from Latin America (2,141 | 2.9%), Central America (1,168 | 1.6%), Asia (716 | 1.0%), Mexico (702 | 0.9%), and Caribbean (542 | 0.7%), together accounting for 7.1% of all Rock Hill residents.
| Immigration Origin | # Population | % Population |
| Africa | 326 | 0.4% |
| Argentina | 21 | 0.0% |
| Asia | 716 | 1.0% |
| Bosnia and Herzegovina | 7 | 0.0% |
| Brazil | 23 | 0.0% |
| Cambodia | 59 | 0.1% |
| Canada | 80 | 0.1% |
| Caribbean | 542 | 0.7% |
| Central America | 1,168 | 1.6% |
| China | 244 | 0.3% |
| Colombia | 46 | 0.1% |
| Costa Rica | 41 | 0.1% |
| Cuba | 5 | 0.0% |
| Czechoslovakia | 7 | 0.0% |
| Dominican Republic | 48 | 0.1% |
| Eastern Africa | 175 | 0.2% |
| Eastern Asia | 290 | 0.4% |
| Eastern Europe | 67 | 0.1% |
| Ecuador | 158 | 0.2% |
| Egypt | 7 | 0.0% |
| El Salvador | 139 | 0.2% |
| England | 34 | 0.1% |
| Ethiopia | 22 | 0.0% |
| Europe | 441 | 0.6% |
| France | 93 | 0.1% |
| Germany | 144 | 0.2% |
| Greece | 6 | 0.0% |
| Guatemala | 16 | 0.0% |
| Guyana | 118 | 0.2% |
| Honduras | 204 | 0.3% |
| Hong Kong | 49 | 0.1% |
| India | 43 | 0.1% |
| Iran | 8 | 0.0% |
| Italy | 26 | 0.0% |
| Jamaica | 489 | 0.7% |
| Japan | 35 | 0.1% |
| Jordan | 25 | 0.0% |
| Kenya | 16 | 0.0% |
| Korea | 11 | 0.0% |
| Latin America | 2,141 | 2.9% |
| Mexico | 702 | 0.9% |
| Netherlands | 10 | 0.0% |
| Nicaragua | 66 | 0.1% |
| Nigeria | 144 | 0.2% |
| Northern Africa | 7 | 0.0% |
| Northern Europe | 95 | 0.1% |
| Peru | 21 | 0.0% |
| Philippines | 84 | 0.1% |
| Russia | 53 | 0.1% |
| Scotland | 2 | 0.0% |
| South America | 431 | 0.6% |
| South Central Asia | 51 | 0.1% |
| South Eastern Asia | 350 | 0.5% |
| Southern Europe | 32 | 0.0% |
| Taiwan | 50 | 0.1% |
| Uganda | 137 | 0.2% |
| Venezuela | 44 | 0.1% |
| Vietnam | 207 | 0.3% |
| Western Africa | 144 | 0.2% |
| Western Asia | 25 | 0.0% |
| Western Europe | 247 | 0.3% | View All 61 Rows |
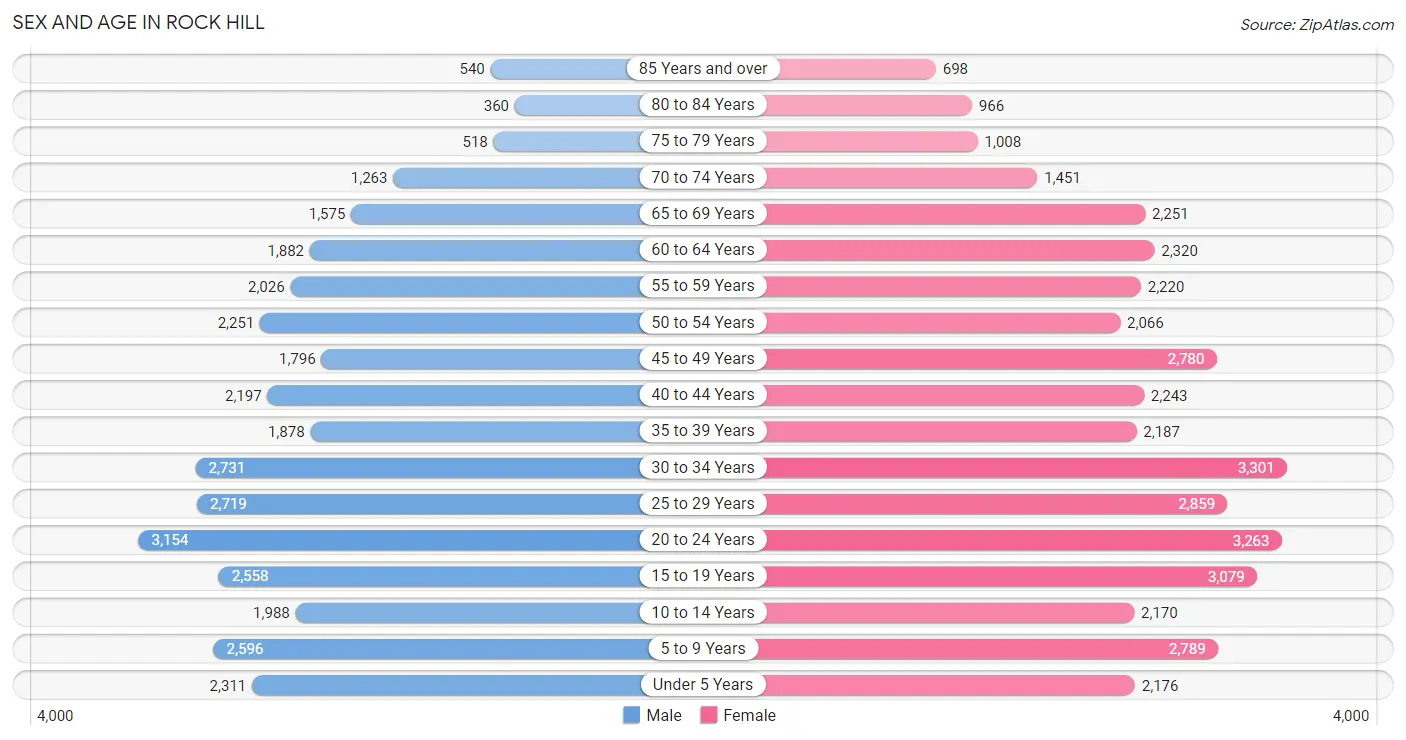
Sex and Age in Rock Hill
Sex and Age in Rock Hill
The most populous age groups in Rock Hill are 20 to 24 Years (3,154 | 9.2%) for men and 30 to 34 Years (3,301 | 8.3%) for women.
| Age Bracket | Male | Female |
| Under 5 Years | 2,311 (6.7%) | 2,176 (5.5%) |
| 5 to 9 Years | 2,596 (7.6%) | 2,789 (7.0%) |
| 10 to 14 Years | 1,988 (5.8%) | 2,170 (5.4%) |
| 15 to 19 Years | 2,558 (7.4%) | 3,079 (7.7%) |
| 20 to 24 Years | 3,154 (9.2%) | 3,263 (8.2%) |
| 25 to 29 Years | 2,719 (7.9%) | 2,859 (7.2%) |
| 30 to 34 Years | 2,731 (8.0%) | 3,301 (8.3%) |
| 35 to 39 Years | 1,878 (5.5%) | 2,187 (5.5%) |
| 40 to 44 Years | 2,197 (6.4%) | 2,243 (5.6%) |
| 45 to 49 Years | 1,796 (5.2%) | 2,780 (7.0%) |
| 50 to 54 Years | 2,251 (6.6%) | 2,066 (5.2%) |
| 55 to 59 Years | 2,026 (5.9%) | 2,220 (5.6%) |
| 60 to 64 Years | 1,882 (5.5%) | 2,320 (5.8%) |
| 65 to 69 Years | 1,575 (4.6%) | 2,251 (5.7%) |
| 70 to 74 Years | 1,263 (3.7%) | 1,451 (3.6%) |
| 75 to 79 Years | 518 (1.5%) | 1,008 (2.5%) |
| 80 to 84 Years | 360 (1.1%) | 966 (2.4%) |
| 85 Years and over | 540 (1.6%) | 698 (1.8%) |
| Total | 34,343 (100.0%) | 39,827 (100.0%) |
Families and Households in Rock Hill
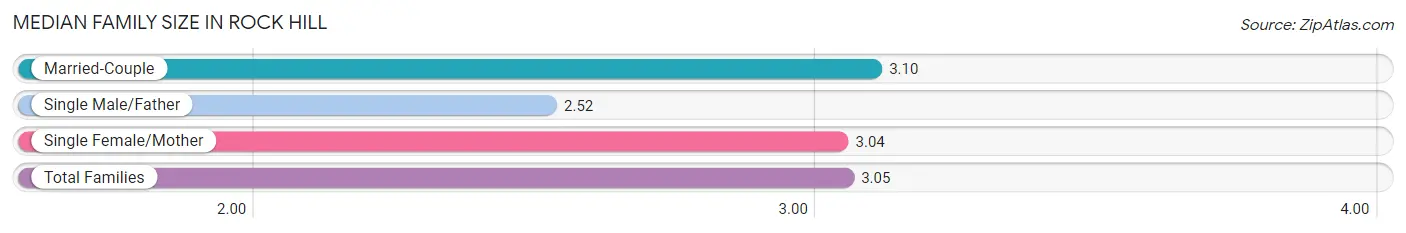
Median Family Size in Rock Hill
The median family size in Rock Hill is 3.05 persons per family, with married-couple families (11,318 | 64.9%) accounting for the largest median family size of 3.1 persons per family. On the other hand, single male/father families (1,041 | 6.0%) represent the smallest median family size with 2.52 persons per family.
| Family Type | # Families | Family Size |
| Married-Couple | 11,318 (64.9%) | 3.10 |
| Single Male/Father | 1,041 (6.0%) | 2.52 |
| Single Female/Mother | 5,077 (29.1%) | 3.04 |
| Total Families | 17,436 (100.0%) | 3.05 |
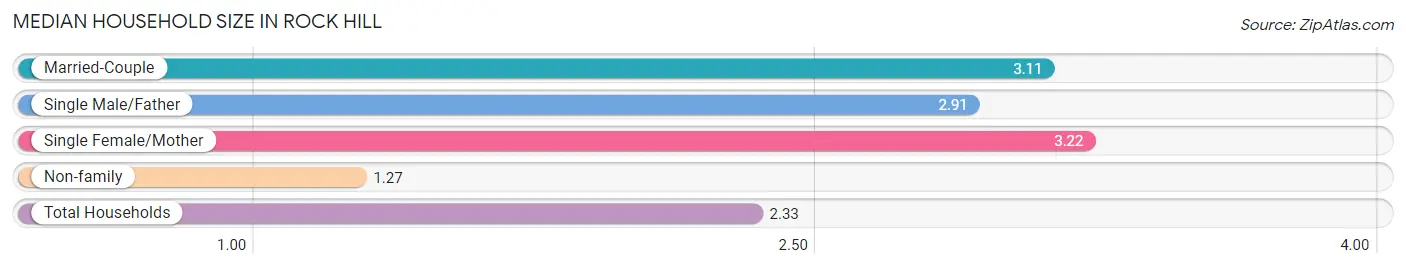
Median Household Size in Rock Hill
The median household size in Rock Hill is 2.33 persons per household, with single female/mother households (5,077 | 16.7%) accounting for the largest median household size of 3.22 persons per household. non-family households (13,021 | 42.7%) represent the smallest median household size with 1.27 persons per household.
| Household Type | # Households | Household Size |
| Married-Couple | 11,318 (37.2%) | 3.11 |
| Single Male/Father | 1,041 (3.4%) | 2.91 |
| Single Female/Mother | 5,077 (16.7%) | 3.22 |
| Non-family | 13,021 (42.7%) | 1.27 |
| Total Households | 30,457 (100.0%) | 2.33 |
Household Size by Marriage Status in Rock Hill
Out of a total of 30,457 households in Rock Hill, 17,436 (57.3%) are family households, while 13,021 (42.7%) are nonfamily households. The most numerous type of family households are 2-person households, comprising 8,268, and the most common type of nonfamily households are 1-person households, comprising 10,373.
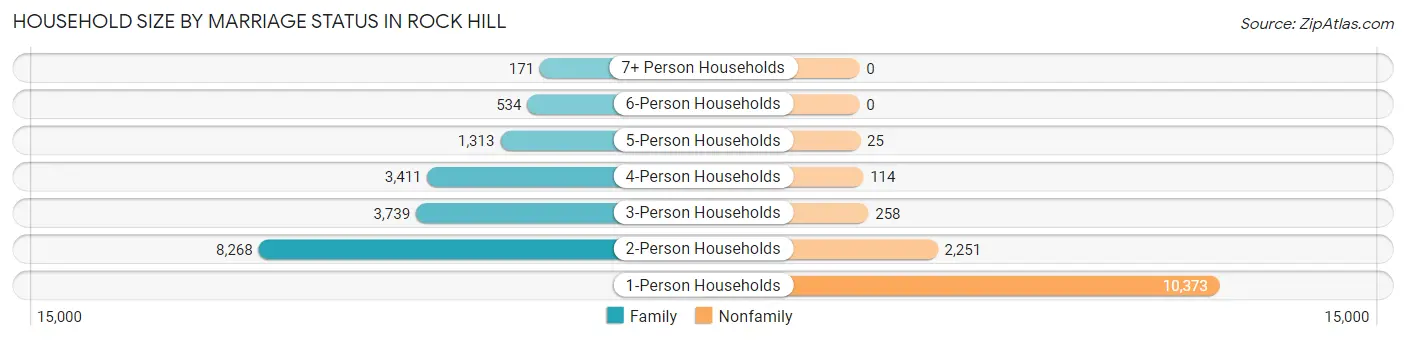
| Household Size | Family Households | Nonfamily Households |
| 1-Person Households | - | 10,373 (34.1%) |
| 2-Person Households | 8,268 (27.2%) | 2,251 (7.4%) |
| 3-Person Households | 3,739 (12.3%) | 258 (0.9%) |
| 4-Person Households | 3,411 (11.2%) | 114 (0.4%) |
| 5-Person Households | 1,313 (4.3%) | 25 (0.1%) |
| 6-Person Households | 534 (1.8%) | 0 (0.0%) |
| 7+ Person Households | 171 (0.6%) | 0 (0.0%) |
| Total | 17,436 (57.3%) | 13,021 (42.7%) |
Female Fertility in Rock Hill
Fertility by Age in Rock Hill
Average fertility rate in Rock Hill is 41.0 births per 1,000 women. Women in the age bracket of 20 to 34 years have the highest fertility rate with 76.0 births per 1,000 women. Women in the age bracket of 20 to 34 years acount for 87.5% of all women with births.
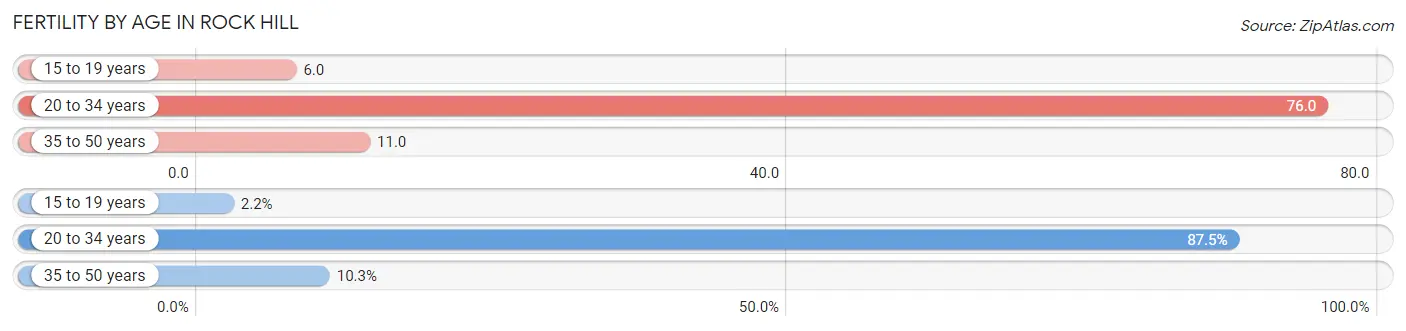
| Age Bracket | Women with Births | Births / 1,000 Women |
| 15 to 19 years | 18 (2.2%) | 6.0 |
| 20 to 34 years | 720 (87.5%) | 76.0 |
| 35 to 50 years | 85 (10.3%) | 11.0 |
| Total | 823 (100.0%) | 41.0 |
Fertility by Age by Marriage Status in Rock Hill
75.3% of women with births (823) in Rock Hill are married. The highest percentage of unmarried women with births falls into 15 to 19 years age bracket with 100.0% of them unmarried at the time of birth, while the lowest percentage of unmarried women with births belong to 35 to 50 years age bracket with 0.0% of them unmarried.
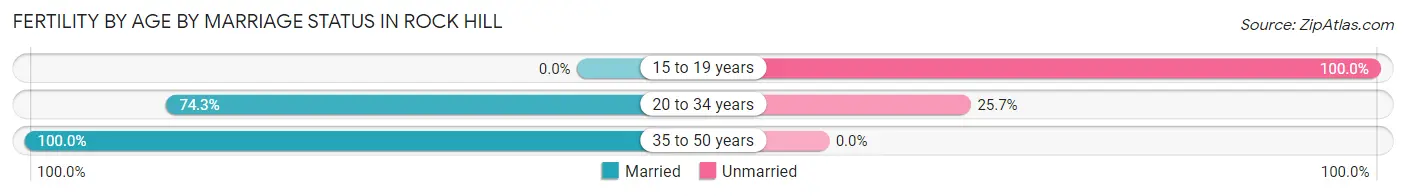
| Age Bracket | Married | Unmarried |
| 15 to 19 years | 0 (0.0%) | 18 (100.0%) |
| 20 to 34 years | 535 (74.3%) | 185 (25.7%) |
| 35 to 50 years | 85 (100.0%) | 0 (0.0%) |
| Total | 620 (75.3%) | 203 (24.7%) |
Fertility by Education in Rock Hill
Average fertility rate in Rock Hill is 41.0 births per 1,000 women. Women with the education attainment of bachelor's degree have the highest fertility rate of 79.0 births per 1,000 women, while women with the education attainment of less than high school have the lowest fertility at 17.0 births per 1,000 women. Women with the education attainment of bachelor's degree represent 36.2% of all women with births.
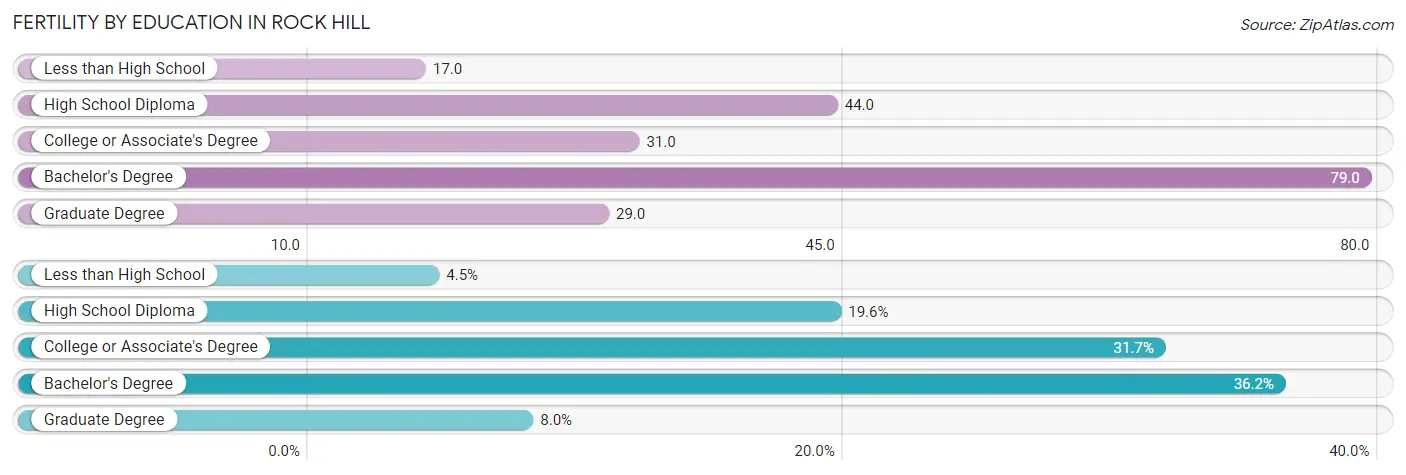
| Educational Attainment | Women with Births | Births / 1,000 Women |
| Less than High School | 37 (4.5%) | 17.0 |
| High School Diploma | 161 (19.6%) | 44.0 |
| College or Associate's Degree | 261 (31.7%) | 31.0 |
| Bachelor's Degree | 298 (36.2%) | 79.0 |
| Graduate Degree | 66 (8.0%) | 29.0 |
| Total | 823 (100.0%) | 41.0 |
Fertility by Education by Marriage Status in Rock Hill
24.7% of women with births in Rock Hill are unmarried. Women with the educational attainment of bachelor's degree are most likely to be married with 95.0% of them married at childbirth, while women with the educational attainment of less than high school are least likely to be married with 100.0% of them unmarried at childbirth.
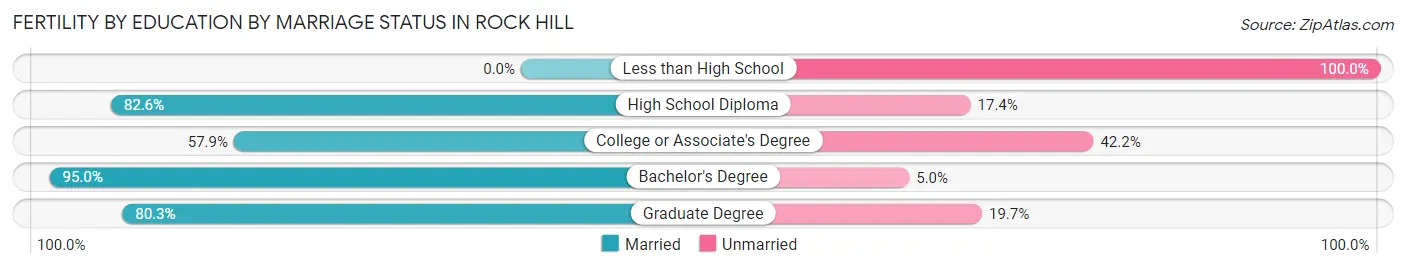
| Educational Attainment | Married | Unmarried |
| Less than High School | 0 (0.0%) | 37 (100.0%) |
| High School Diploma | 133 (82.6%) | 28 (17.4%) |
| College or Associate's Degree | 151 (57.9%) | 110 (42.1%) |
| Bachelor's Degree | 283 (95.0%) | 15 (5.0%) |
| Graduate Degree | 53 (80.3%) | 13 (19.7%) |
| Total | 620 (75.3%) | 203 (24.7%) |
Employment Characteristics in Rock Hill
Employment by Class of Employer in Rock Hill
Among the 37,102 employed individuals in Rock Hill, private company employees (26,966 | 72.7%), state government employees (2,288 | 6.2%), and local government employees (2,195 | 5.9%) make up the most common classes of employment.
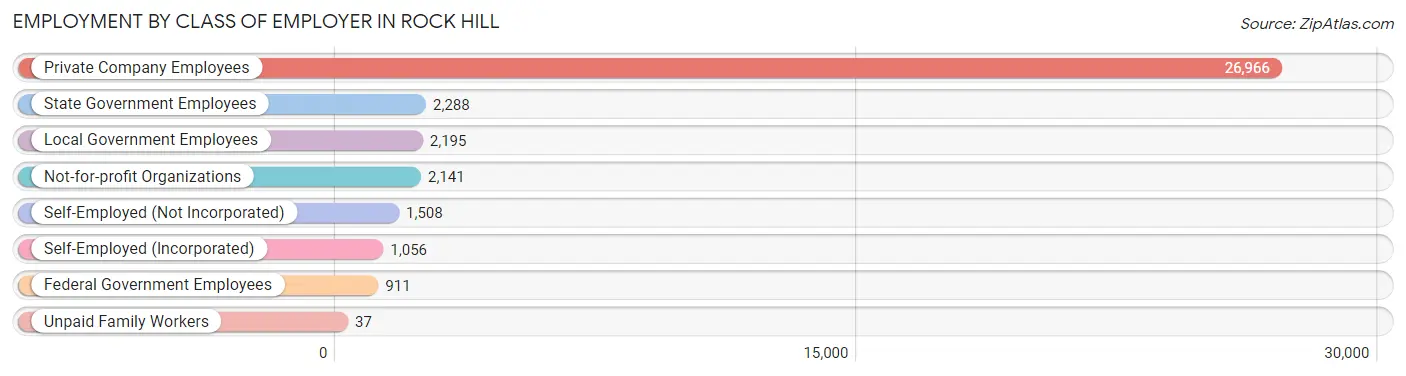
| Employer Class | # Employees | % Employees |
| Private Company Employees | 26,966 | 72.7% |
| Self-Employed (Incorporated) | 1,056 | 2.9% |
| Self-Employed (Not Incorporated) | 1,508 | 4.1% |
| Not-for-profit Organizations | 2,141 | 5.8% |
| Local Government Employees | 2,195 | 5.9% |
| State Government Employees | 2,288 | 6.2% |
| Federal Government Employees | 911 | 2.5% |
| Unpaid Family Workers | 37 | 0.1% |
| Total | 37,102 | 100.0% |
Employment Status by Age in Rock Hill
According to the labor force statistics for Rock Hill, out of the total population over 16 years of age (59,284), 67.6% or 40,076 individuals are in the labor force, with 5.3% or 2,124 of them unemployed. The age group with the highest labor force participation rate is 25 to 29 years, with 91.8% or 5,121 individuals in the labor force. Within the labor force, the 16 to 19 years age range has the highest percentage of unemployed individuals, with 17.3% or 342 of them being unemployed.
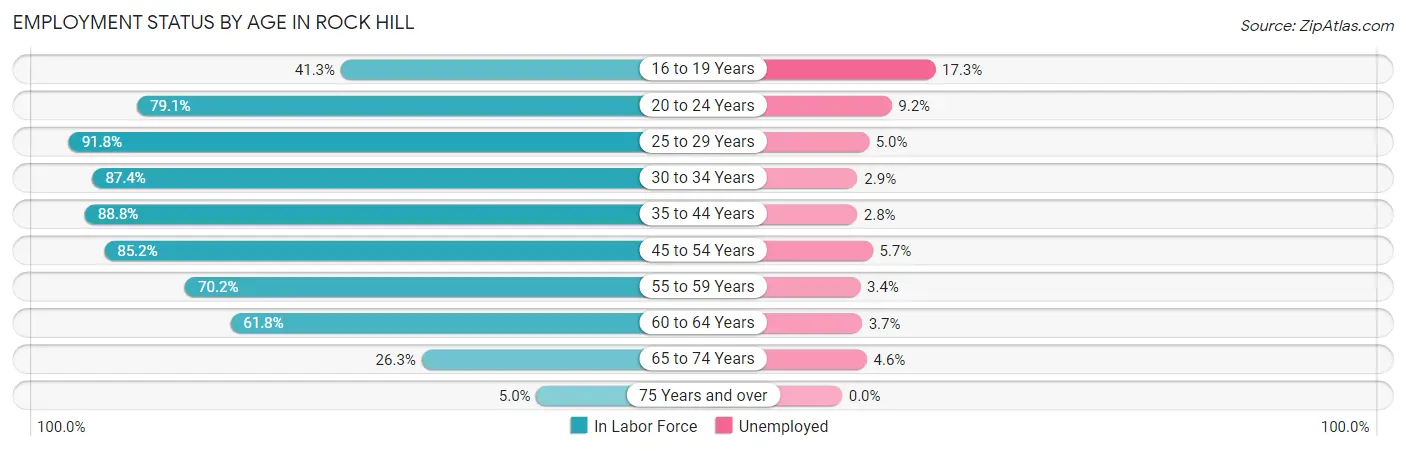
| Age Bracket | In Labor Force | Unemployed |
| 16 to 19 Years | 1,975 (41.3%) | 342 (17.3%) |
| 20 to 24 Years | 5,076 (79.1%) | 467 (9.2%) |
| 25 to 29 Years | 5,121 (91.8%) | 256 (5.0%) |
| 30 to 34 Years | 5,272 (87.4%) | 153 (2.9%) |
| 35 to 44 Years | 7,552 (88.8%) | 211 (2.8%) |
| 45 to 54 Years | 7,577 (85.2%) | 432 (5.7%) |
| 55 to 59 Years | 2,981 (70.2%) | 101 (3.4%) |
| 60 to 64 Years | 2,597 (61.8%) | 96 (3.7%) |
| 65 to 74 Years | 1,720 (26.3%) | 79 (4.6%) |
| 75 Years and over | 204 (5.0%) | 0 (0.0%) |
| Total | 40,076 (67.6%) | 2,124 (5.3%) |
Employment Status by Educational Attainment in Rock Hill
According to labor force statistics for Rock Hill, 83.0% of individuals (31,088) out of the total population between 25 and 64 years of age (37,456) are in the labor force, with 4.0% or 1,244 of them being unemployed. The group with the highest labor force participation rate are those with the educational attainment of bachelor's degree or higher, with 88.6% or 11,265 individuals in the labor force. Within the labor force, individuals with high school diploma education have the highest percentage of unemployment, with 6.7% or 440 of them being unemployed.
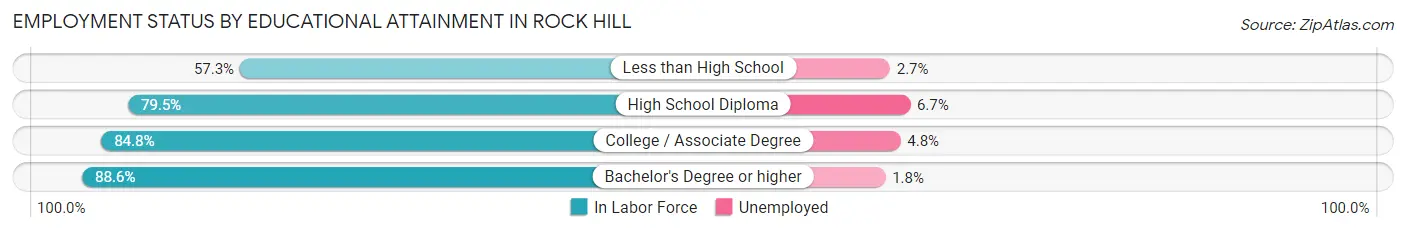
| Educational Attainment | In Labor Force | Unemployed |
| Less than High School | 1,501 (57.3%) | 71 (2.7%) |
| High School Diploma | 6,564 (79.5%) | 553 (6.7%) |
| College / Associate Degree | 11,758 (84.8%) | 666 (4.8%) |
| Bachelor's Degree or higher | 11,265 (88.6%) | 229 (1.8%) |
| Total | 31,088 (83.0%) | 1,498 (4.0%) |
Employment Occupations by Sex in Rock Hill
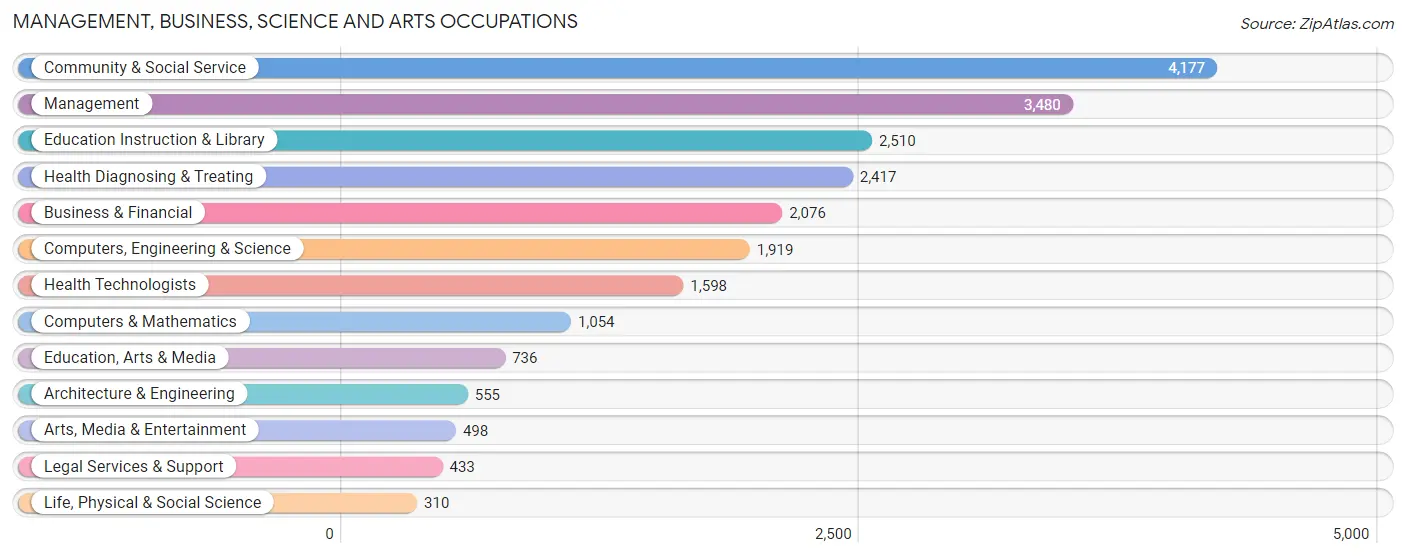
Management, Business, Science and Arts Occupations
The most common Management, Business, Science and Arts occupations in Rock Hill are Community & Social Service (4,177 | 11.1%), Management (3,480 | 9.2%), Education Instruction & Library (2,510 | 6.7%), Health Diagnosing & Treating (2,417 | 6.4%), and Business & Financial (2,076 | 5.5%).
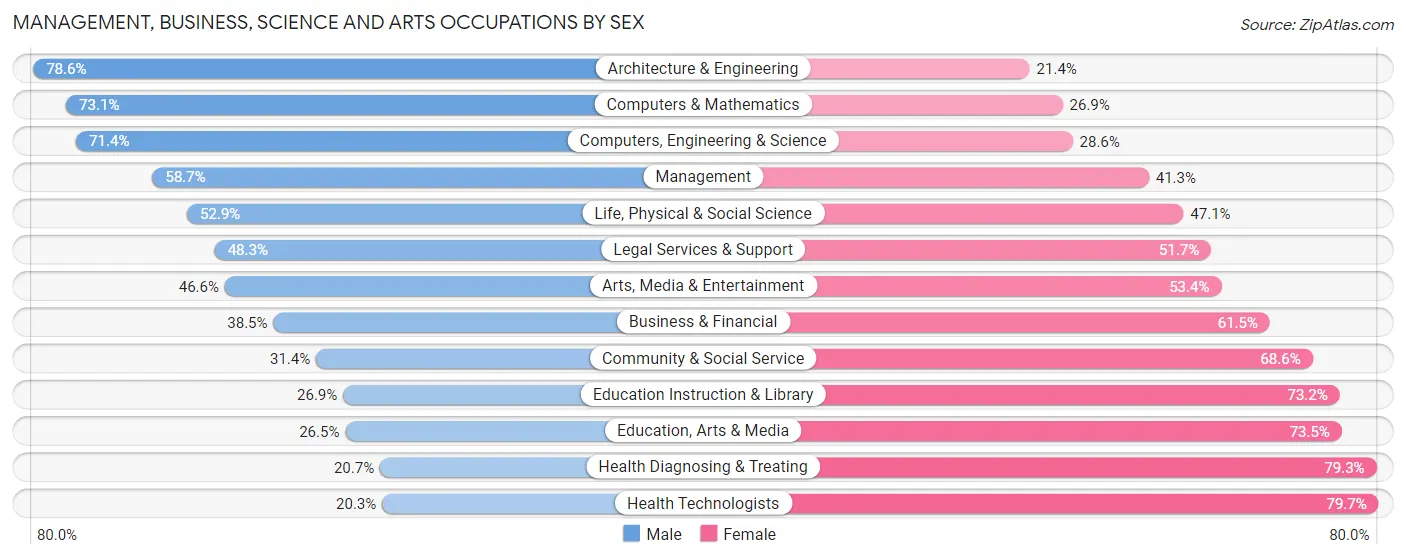
Management, Business, Science and Arts Occupations by Sex
Within the Management, Business, Science and Arts occupations in Rock Hill, the most male-oriented occupations are Architecture & Engineering (78.6%), Computers & Mathematics (73.1%), and Computers, Engineering & Science (71.4%), while the most female-oriented occupations are Health Technologists (79.7%), Health Diagnosing & Treating (79.3%), and Education, Arts & Media (73.5%).
| Occupation | Male | Female |
| Management | 2,042 (58.7%) | 1,438 (41.3%) |
| Business & Financial | 799 (38.5%) | 1,277 (61.5%) |
| Computers, Engineering & Science | 1,370 (71.4%) | 549 (28.6%) |
| Computers & Mathematics | 770 (73.1%) | 284 (26.9%) |
| Architecture & Engineering | 436 (78.6%) | 119 (21.4%) |
| Life, Physical & Social Science | 164 (52.9%) | 146 (47.1%) |
| Community & Social Service | 1,310 (31.4%) | 2,867 (68.6%) |
| Education, Arts & Media | 195 (26.5%) | 541 (73.5%) |
| Legal Services & Support | 209 (48.3%) | 224 (51.7%) |
| Education Instruction & Library | 674 (26.9%) | 1,836 (73.2%) |
| Arts, Media & Entertainment | 232 (46.6%) | 266 (53.4%) |
| Health Diagnosing & Treating | 500 (20.7%) | 1,917 (79.3%) |
| Health Technologists | 325 (20.3%) | 1,273 (79.7%) |
| Total (Category) | 6,021 (42.8%) | 8,048 (57.2%) |
| Total (Overall) | 18,297 (48.6%) | 19,339 (51.4%) |
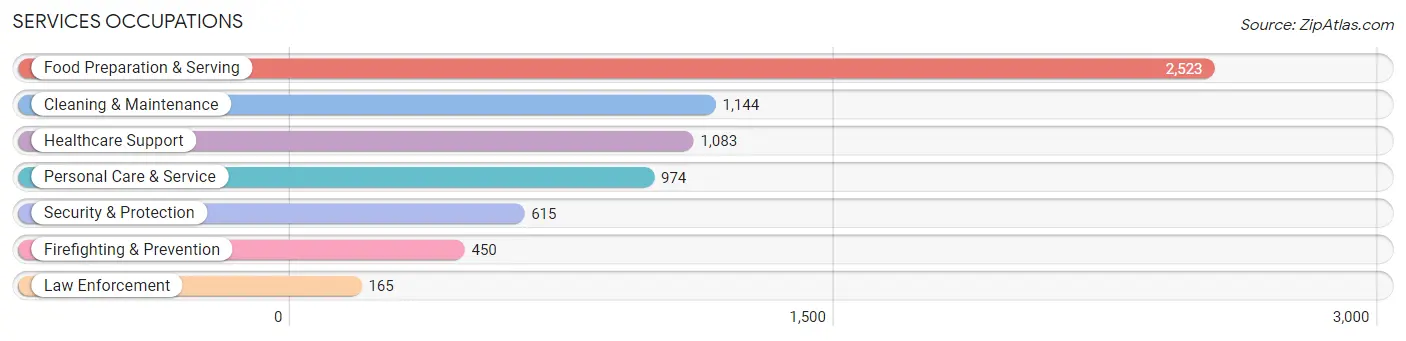
Services Occupations
The most common Services occupations in Rock Hill are Food Preparation & Serving (2,523 | 6.7%), Cleaning & Maintenance (1,144 | 3.0%), Healthcare Support (1,083 | 2.9%), Personal Care & Service (974 | 2.6%), and Security & Protection (615 | 1.6%).
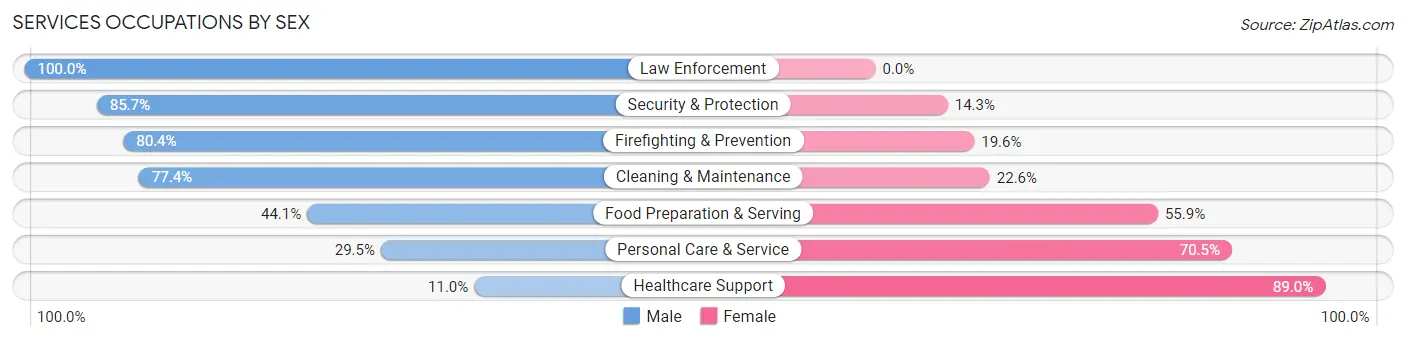
Services Occupations by Sex
Within the Services occupations in Rock Hill, the most male-oriented occupations are Law Enforcement (100.0%), Security & Protection (85.7%), and Firefighting & Prevention (80.4%), while the most female-oriented occupations are Healthcare Support (89.0%), Personal Care & Service (70.5%), and Food Preparation & Serving (55.9%).
| Occupation | Male | Female |
| Healthcare Support | 119 (11.0%) | 964 (89.0%) |
| Security & Protection | 527 (85.7%) | 88 (14.3%) |
| Firefighting & Prevention | 362 (80.4%) | 88 (19.6%) |
| Law Enforcement | 165 (100.0%) | 0 (0.0%) |
| Food Preparation & Serving | 1,112 (44.1%) | 1,411 (55.9%) |
| Cleaning & Maintenance | 885 (77.4%) | 259 (22.6%) |
| Personal Care & Service | 287 (29.5%) | 687 (70.5%) |
| Total (Category) | 2,930 (46.2%) | 3,409 (53.8%) |
| Total (Overall) | 18,297 (48.6%) | 19,339 (51.4%) |
Sales and Office Occupations
The most common Sales and Office occupations in Rock Hill are Office & Administration (4,880 | 13.0%), and Sales & Related (3,875 | 10.3%).

Sales and Office Occupations by Sex
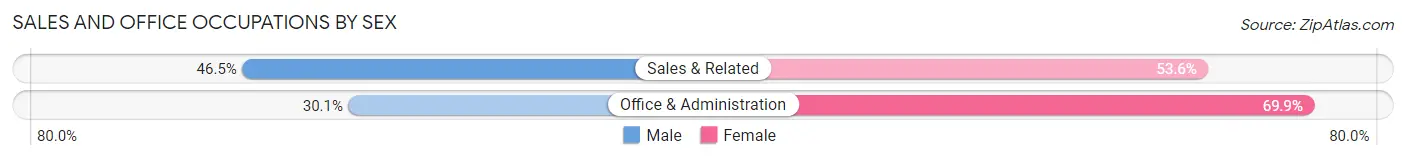
| Occupation | Male | Female |
| Sales & Related | 1,800 (46.5%) | 2,075 (53.5%) |
| Office & Administration | 1,470 (30.1%) | 3,410 (69.9%) |
| Total (Category) | 3,270 (37.3%) | 5,485 (62.6%) |
| Total (Overall) | 18,297 (48.6%) | 19,339 (51.4%) |
Natural Resources, Construction and Maintenance Occupations
The most common Natural Resources, Construction and Maintenance occupations in Rock Hill are Construction & Extraction (1,215 | 3.2%), Installation, Maintenance & Repair (1,072 | 2.9%), and Farming, Fishing & Forestry (32 | 0.1%).

Natural Resources, Construction and Maintenance Occupations by Sex
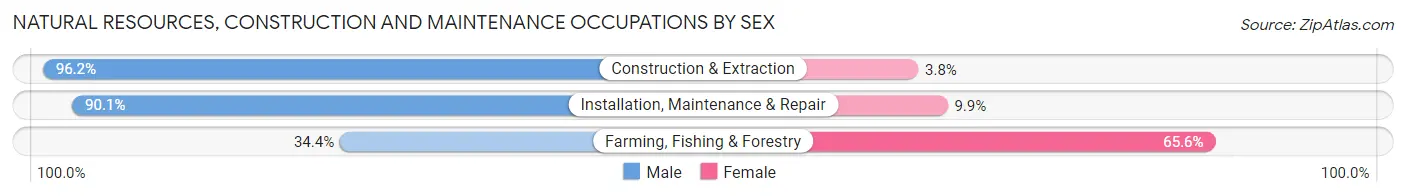
| Occupation | Male | Female |
| Farming, Fishing & Forestry | 11 (34.4%) | 21 (65.6%) |
| Construction & Extraction | 1,169 (96.2%) | 46 (3.8%) |
| Installation, Maintenance & Repair | 966 (90.1%) | 106 (9.9%) |
| Total (Category) | 2,146 (92.5%) | 173 (7.5%) |
| Total (Overall) | 18,297 (48.6%) | 19,339 (51.4%) |
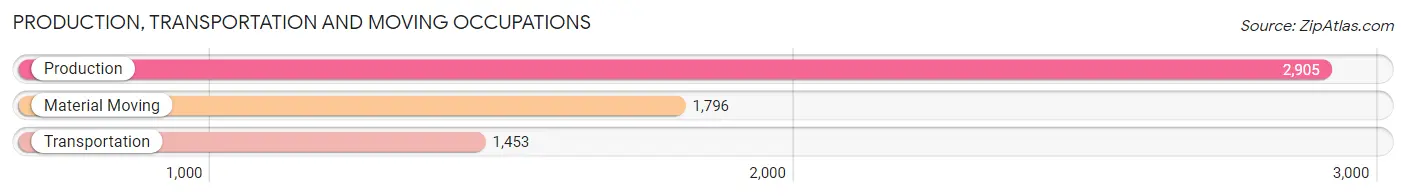
Production, Transportation and Moving Occupations
The most common Production, Transportation and Moving occupations in Rock Hill are Production (2,905 | 7.7%), Material Moving (1,796 | 4.8%), and Transportation (1,453 | 3.9%).
Production, Transportation and Moving Occupations by Sex
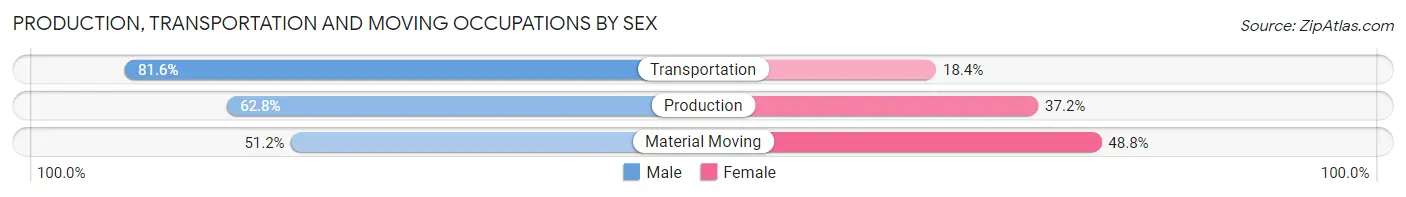
| Occupation | Male | Female |
| Production | 1,825 (62.8%) | 1,080 (37.2%) |
| Transportation | 1,185 (81.6%) | 268 (18.4%) |
| Material Moving | 920 (51.2%) | 876 (48.8%) |
| Total (Category) | 3,930 (63.9%) | 2,224 (36.1%) |
| Total (Overall) | 18,297 (48.6%) | 19,339 (51.4%) |
Employment Industries by Sex in Rock Hill
Employment Industries in Rock Hill
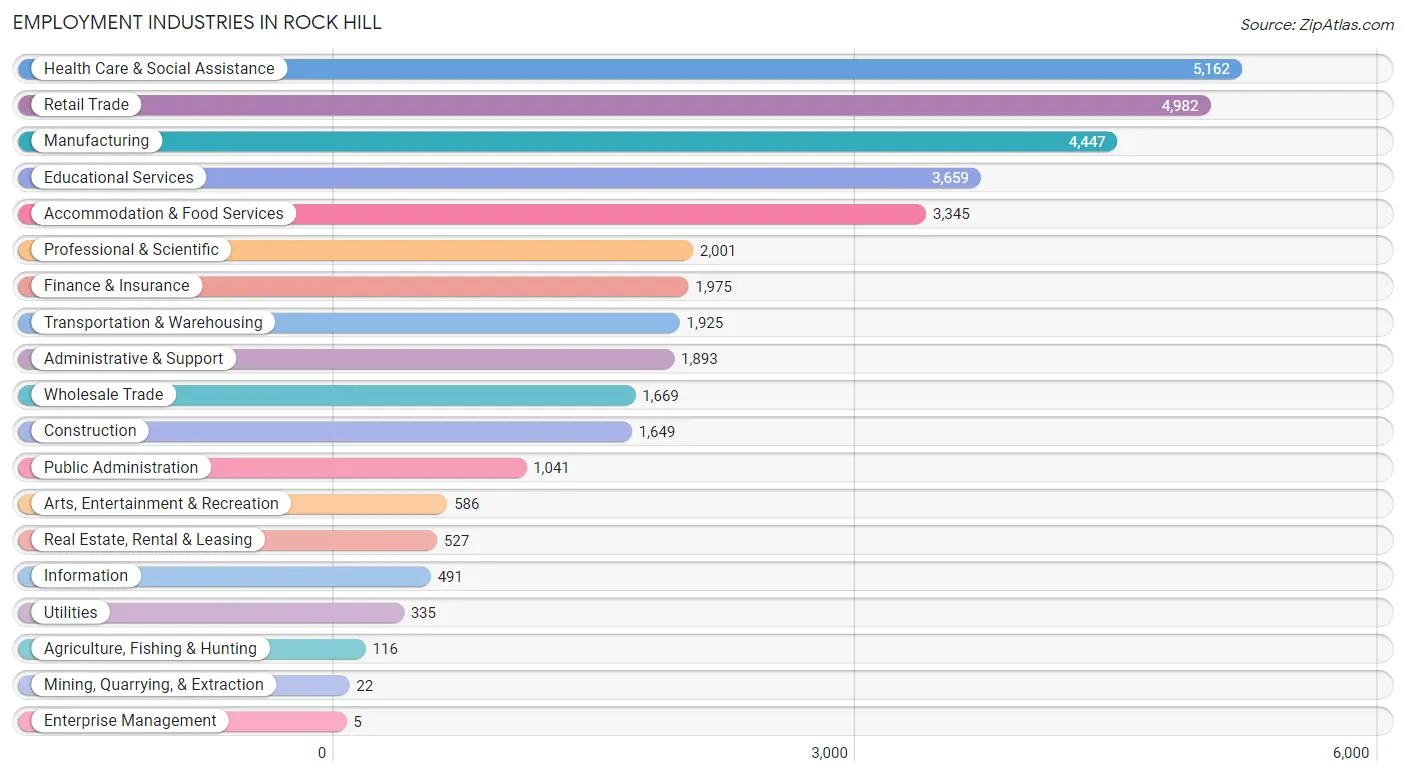
The major employment industries in Rock Hill include Health Care & Social Assistance (5,162 | 13.7%), Retail Trade (4,982 | 13.2%), Manufacturing (4,447 | 11.8%), Educational Services (3,659 | 9.7%), and Accommodation & Food Services (3,345 | 8.9%).
Employment Industries by Sex in Rock Hill
The Rock Hill industries that see more men than women are Mining, Quarrying, & Extraction (100.0%), Enterprise Management (100.0%), and Construction (91.0%), whereas the industries that tend to have a higher number of women are Health Care & Social Assistance (82.3%), Educational Services (68.6%), and Arts, Entertainment & Recreation (67.9%).
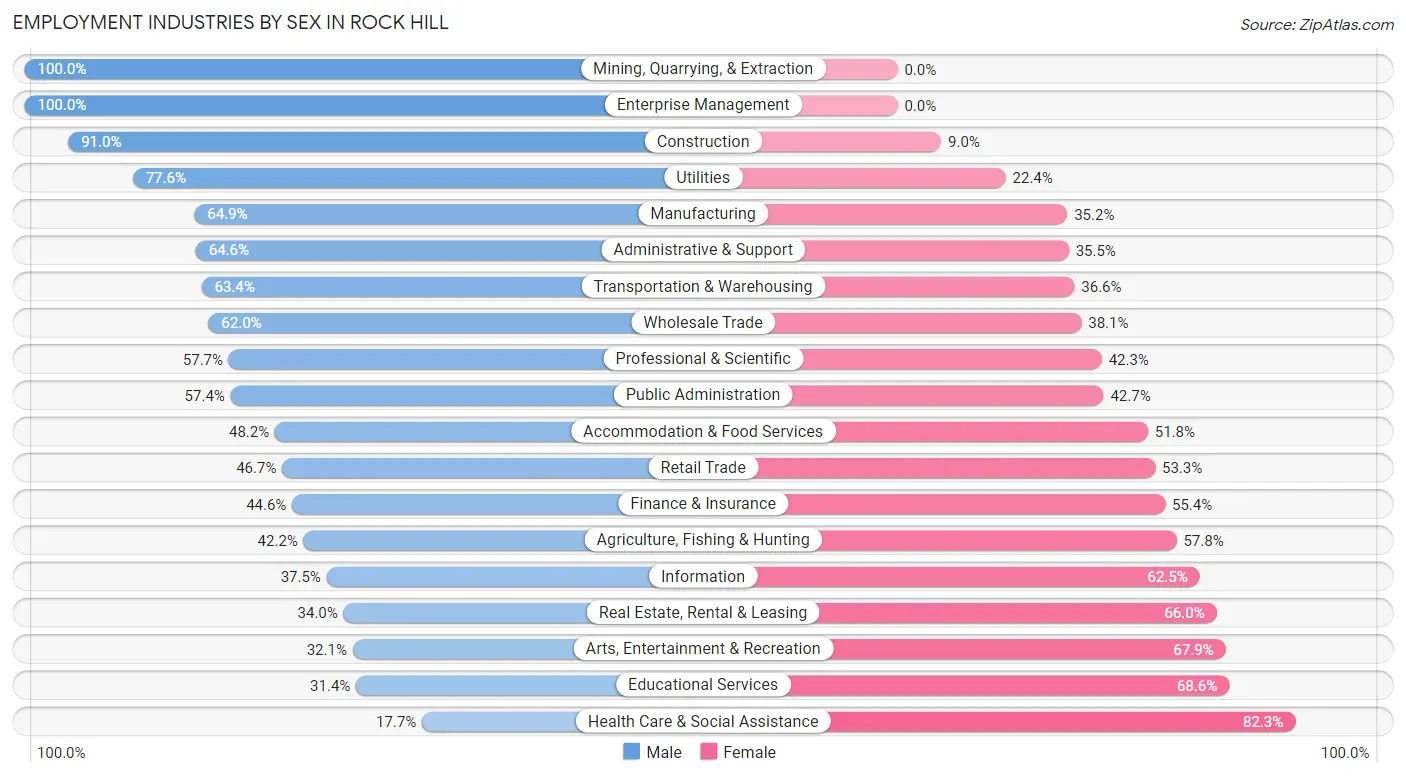
| Industry | Male | Female |
| Agriculture, Fishing & Hunting | 49 (42.2%) | 67 (57.8%) |
| Mining, Quarrying, & Extraction | 22 (100.0%) | 0 (0.0%) |
| Construction | 1,500 (91.0%) | 149 (9.0%) |
| Manufacturing | 2,884 (64.8%) | 1,563 (35.1%) |
| Wholesale Trade | 1,034 (62.0%) | 635 (38.1%) |
| Retail Trade | 2,325 (46.7%) | 2,657 (53.3%) |
| Transportation & Warehousing | 1,220 (63.4%) | 705 (36.6%) |
| Utilities | 260 (77.6%) | 75 (22.4%) |
| Information | 184 (37.5%) | 307 (62.5%) |
| Finance & Insurance | 881 (44.6%) | 1,094 (55.4%) |
| Real Estate, Rental & Leasing | 179 (34.0%) | 348 (66.0%) |
| Professional & Scientific | 1,155 (57.7%) | 846 (42.3%) |
| Enterprise Management | 5 (100.0%) | 0 (0.0%) |
| Administrative & Support | 1,222 (64.5%) | 671 (35.4%) |
| Educational Services | 1,148 (31.4%) | 2,511 (68.6%) |
| Health Care & Social Assistance | 914 (17.7%) | 4,248 (82.3%) |
| Arts, Entertainment & Recreation | 188 (32.1%) | 398 (67.9%) |
| Accommodation & Food Services | 1,611 (48.2%) | 1,734 (51.8%) |
| Public Administration | 597 (57.4%) | 444 (42.6%) |
| Total | 18,297 (48.6%) | 19,339 (51.4%) |
Education in Rock Hill
School Enrollment in Rock Hill
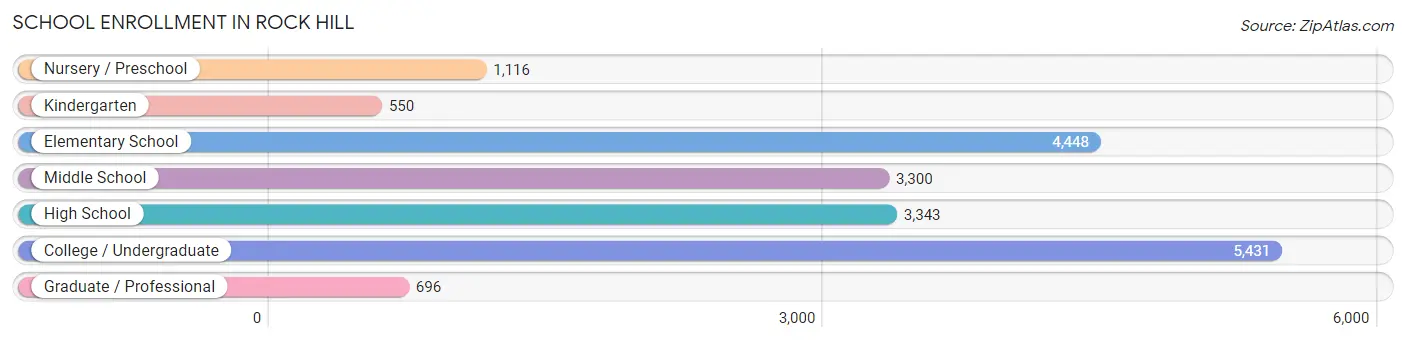
The most common levels of schooling among the 18,884 students in Rock Hill are college / undergraduate (5,431 | 28.8%), elementary school (4,448 | 23.5%), and high school (3,343 | 17.7%).
| School Level | # Students | % Students |
| Nursery / Preschool | 1,116 | 5.9% |
| Kindergarten | 550 | 2.9% |
| Elementary School | 4,448 | 23.5% |
| Middle School | 3,300 | 17.5% |
| High School | 3,343 | 17.7% |
| College / Undergraduate | 5,431 | 28.8% |
| Graduate / Professional | 696 | 3.7% |
| Total | 18,884 | 100.0% |
School Enrollment by Age by Funding Source in Rock Hill
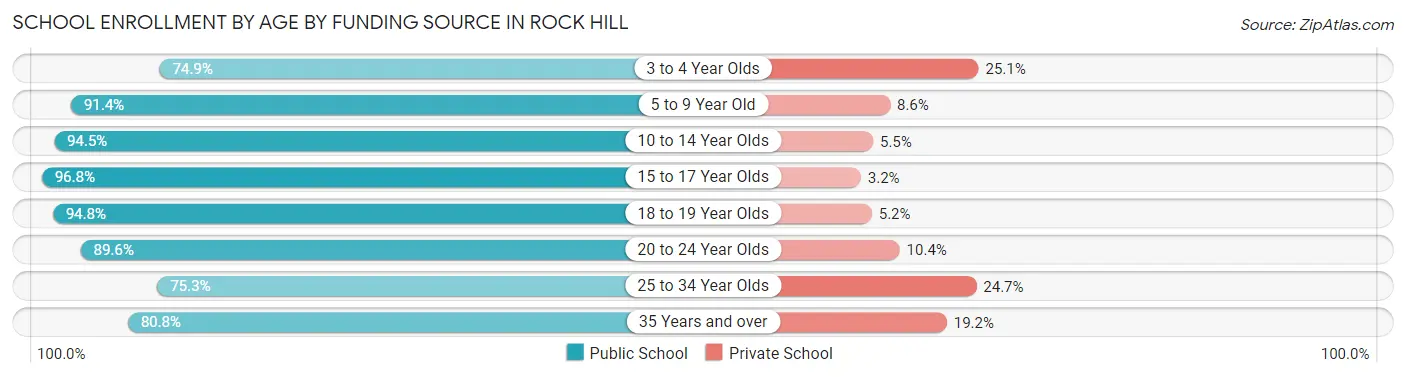
Out of a total of 18,884 students who are enrolled in schools in Rock Hill, 1,681 (8.9%) attend a private institution, while the remaining 17,203 (91.1%) are enrolled in public schools. The age group of 3 to 4 year olds has the highest likelihood of being enrolled in private schools, with 194 (25.1% in the age bracket) enrolled. Conversely, the age group of 15 to 17 year olds has the lowest likelihood of being enrolled in a private school, with 2,635 (96.8% in the age bracket) attending a public institution.
| Age Bracket | Public School | Private School |
| 3 to 4 Year Olds | 578 (74.9%) | 194 (25.1%) |
| 5 to 9 Year Old | 4,650 (91.4%) | 439 (8.6%) |
| 10 to 14 Year Olds | 3,766 (94.5%) | 218 (5.5%) |
| 15 to 17 Year Olds | 2,635 (96.8%) | 87 (3.2%) |
| 18 to 19 Year Olds | 2,096 (94.8%) | 116 (5.2%) |
| 20 to 24 Year Olds | 2,181 (89.6%) | 254 (10.4%) |
| 25 to 34 Year Olds | 838 (75.3%) | 275 (24.7%) |
| 35 Years and over | 450 (80.8%) | 107 (19.2%) |
| Total | 17,203 (91.1%) | 1,681 (8.9%) |
Educational Attainment by Field of Study in Rock Hill
Business (3,848 | 22.5%), education (2,286 | 13.4%), science & technology (1,505 | 8.8%), social sciences (1,282 | 7.5%), and bio, nature & agricultural (1,236 | 7.2%) are the most common fields of study among 17,115 individuals in Rock Hill who have obtained a bachelor's degree or higher.
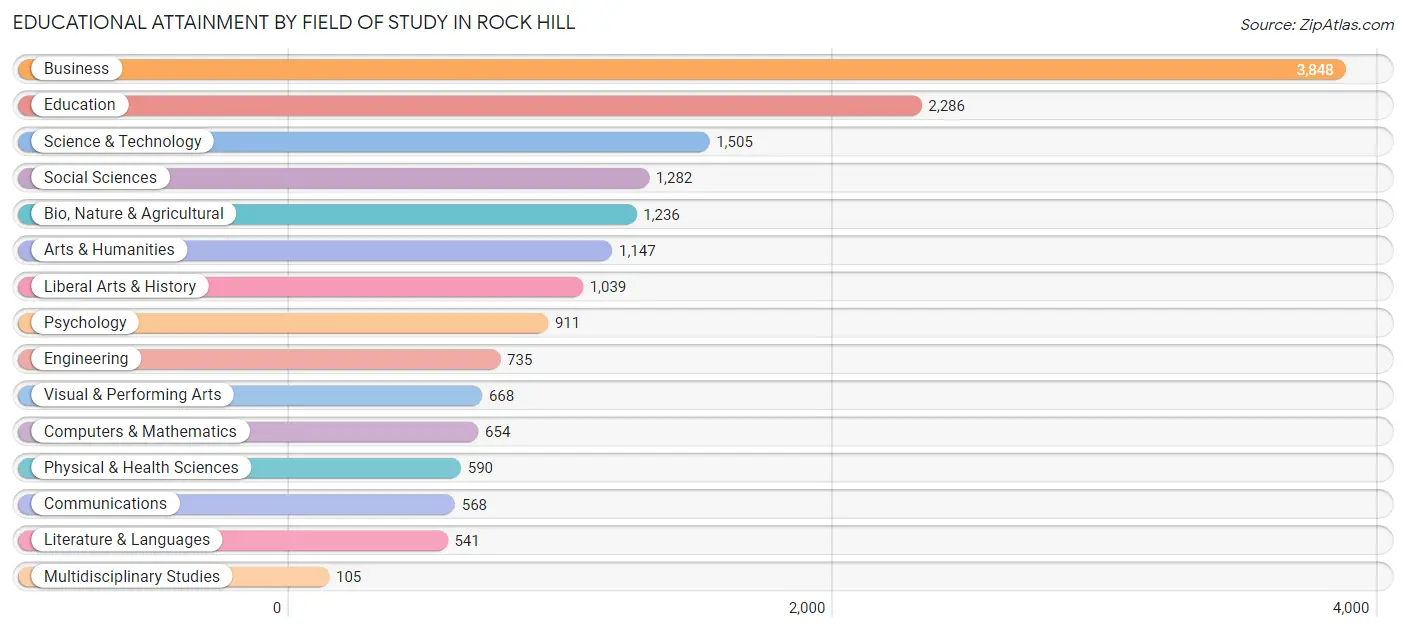
| Field of Study | # Graduates | % Graduates |
| Computers & Mathematics | 654 | 3.8% |
| Bio, Nature & Agricultural | 1,236 | 7.2% |
| Physical & Health Sciences | 590 | 3.5% |
| Psychology | 911 | 5.3% |
| Social Sciences | 1,282 | 7.5% |
| Engineering | 735 | 4.3% |
| Multidisciplinary Studies | 105 | 0.6% |
| Science & Technology | 1,505 | 8.8% |
| Business | 3,848 | 22.5% |
| Education | 2,286 | 13.4% |
| Literature & Languages | 541 | 3.2% |
| Liberal Arts & History | 1,039 | 6.1% |
| Visual & Performing Arts | 668 | 3.9% |
| Communications | 568 | 3.3% |
| Arts & Humanities | 1,147 | 6.7% |
| Total | 17,115 | 100.0% |
Transportation & Commute in Rock Hill
Vehicle Availability by Sex in Rock Hill
The most prevalent vehicle ownership categories in Rock Hill are males with 2 vehicles (8,238, accounting for 45.5%) and females with 2 vehicles (7,134, making up 45.6%).
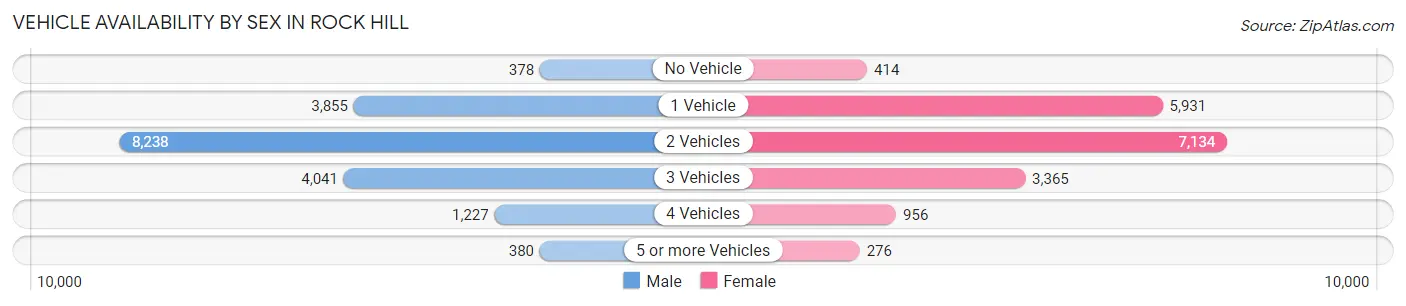
| Vehicles Available | Male | Female |
| No Vehicle | 378 (2.1%) | 414 (2.3%) |
| 1 Vehicle | 3,855 (21.3%) | 5,931 (32.8%) |
| 2 Vehicles | 8,238 (45.5%) | 7,134 (39.5%) |
| 3 Vehicles | 4,041 (22.3%) | 3,365 (18.6%) |
| 4 Vehicles | 1,227 (6.8%) | 956 (5.3%) |
| 5 or more Vehicles | 380 (2.1%) | 276 (1.5%) |
| Total | 18,119 (100.0%) | 18,076 (100.0%) |
Commute Time in Rock Hill
The most frequently occuring commute durations in Rock Hill are 10 to 14 minutes (5,446 commuters, 16.0%), 15 to 19 minutes (5,365 commuters, 15.7%), and 30 to 34 minutes (4,490 commuters, 13.2%).
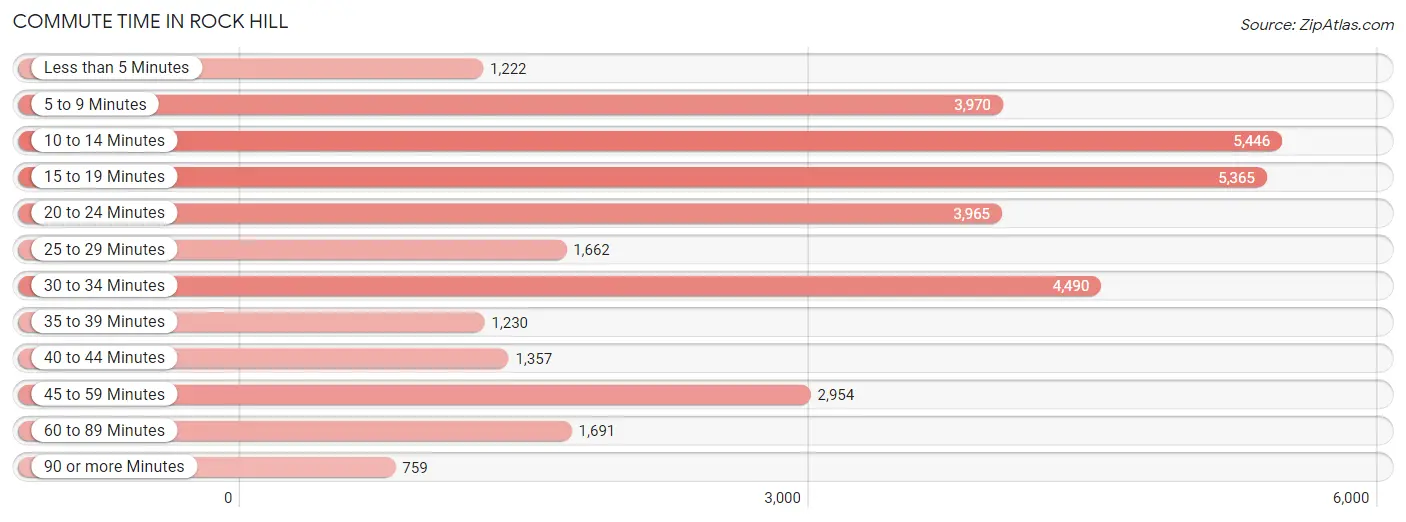
| Commute Time | # Commuters | % Commuters |
| Less than 5 Minutes | 1,222 | 3.6% |
| 5 to 9 Minutes | 3,970 | 11.6% |
| 10 to 14 Minutes | 5,446 | 16.0% |
| 15 to 19 Minutes | 5,365 | 15.7% |
| 20 to 24 Minutes | 3,965 | 11.6% |
| 25 to 29 Minutes | 1,662 | 4.9% |
| 30 to 34 Minutes | 4,490 | 13.2% |
| 35 to 39 Minutes | 1,230 | 3.6% |
| 40 to 44 Minutes | 1,357 | 4.0% |
| 45 to 59 Minutes | 2,954 | 8.7% |
| 60 to 89 Minutes | 1,691 | 5.0% |
| 90 or more Minutes | 759 | 2.2% |
Commute Time by Sex in Rock Hill
The most common commute times in Rock Hill are 10 to 14 minutes (2,628 commuters, 15.6%) for males and 15 to 19 minutes (2,913 commuters, 16.9%) for females.
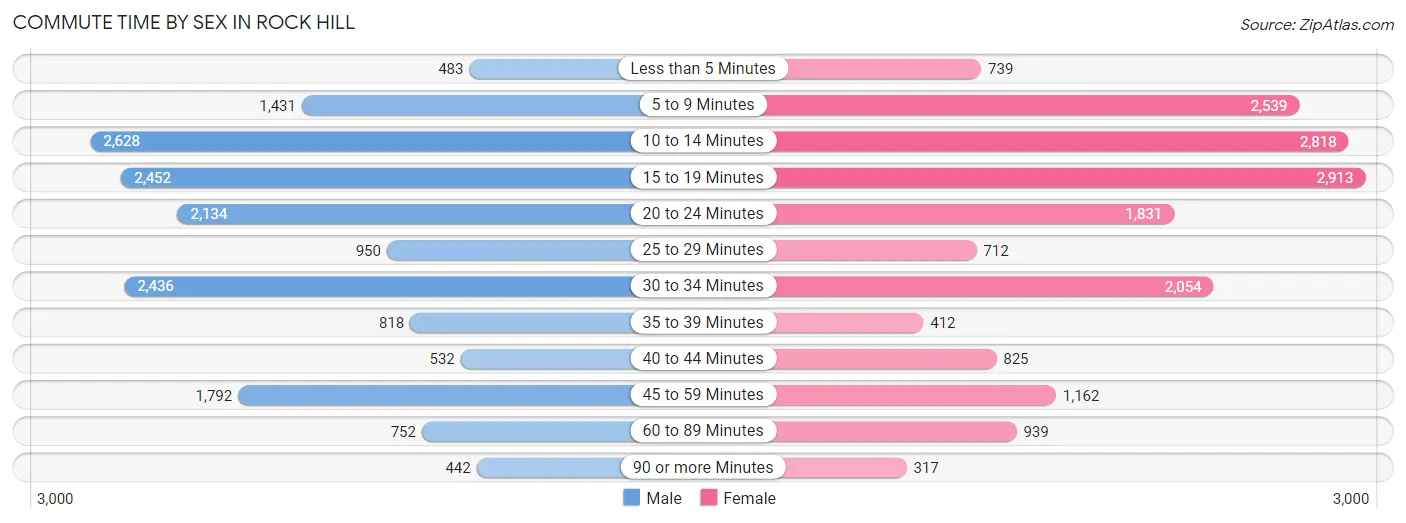
| Commute Time | Male | Female |
| Less than 5 Minutes | 483 (2.9%) | 739 (4.3%) |
| 5 to 9 Minutes | 1,431 (8.5%) | 2,539 (14.7%) |
| 10 to 14 Minutes | 2,628 (15.6%) | 2,818 (16.3%) |
| 15 to 19 Minutes | 2,452 (14.5%) | 2,913 (16.9%) |
| 20 to 24 Minutes | 2,134 (12.7%) | 1,831 (10.6%) |
| 25 to 29 Minutes | 950 (5.6%) | 712 (4.1%) |
| 30 to 34 Minutes | 2,436 (14.5%) | 2,054 (11.9%) |
| 35 to 39 Minutes | 818 (4.9%) | 412 (2.4%) |
| 40 to 44 Minutes | 532 (3.2%) | 825 (4.8%) |
| 45 to 59 Minutes | 1,792 (10.6%) | 1,162 (6.7%) |
| 60 to 89 Minutes | 752 (4.5%) | 939 (5.4%) |
| 90 or more Minutes | 442 (2.6%) | 317 (1.8%) |
Time of Departure to Work by Sex in Rock Hill
The most frequent times of departure to work in Rock Hill are 7:00 AM to 7:29 AM (2,356, 14.0%) for males and 6:30 AM to 6:59 AM (2,299, 13.3%) for females.
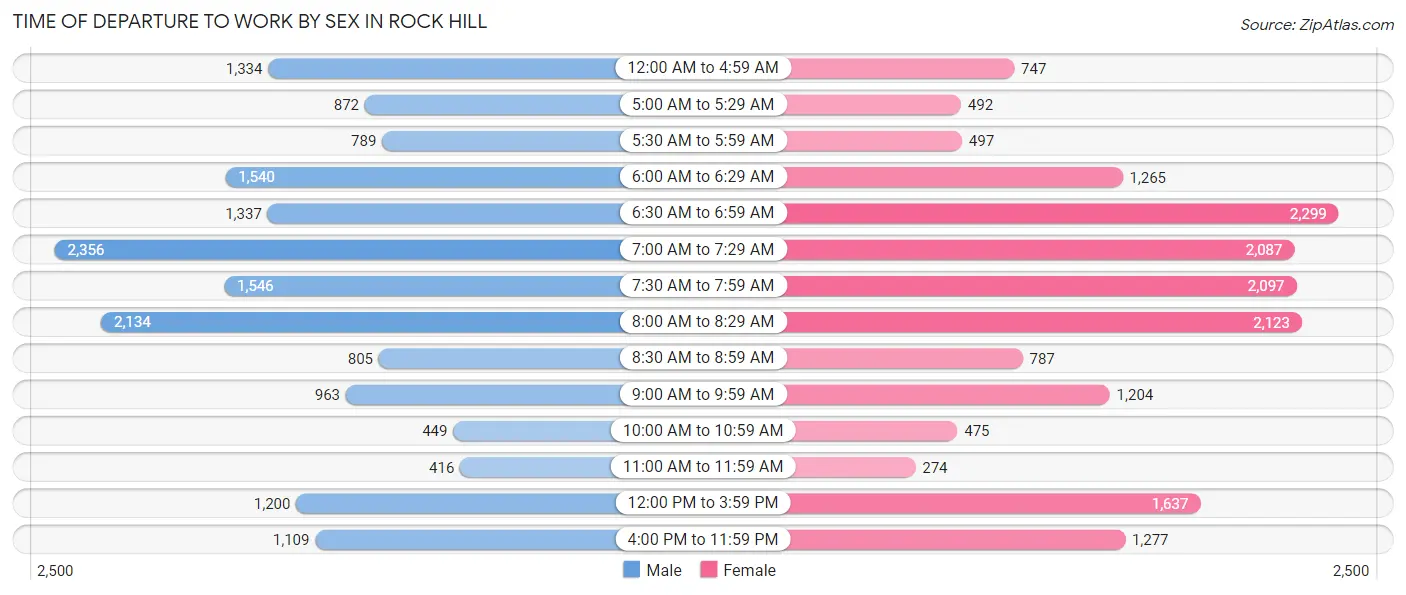
| Time of Departure | Male | Female |
| 12:00 AM to 4:59 AM | 1,334 (7.9%) | 747 (4.3%) |
| 5:00 AM to 5:29 AM | 872 (5.2%) | 492 (2.9%) |
| 5:30 AM to 5:59 AM | 789 (4.7%) | 497 (2.9%) |
| 6:00 AM to 6:29 AM | 1,540 (9.1%) | 1,265 (7.3%) |
| 6:30 AM to 6:59 AM | 1,337 (7.9%) | 2,299 (13.3%) |
| 7:00 AM to 7:29 AM | 2,356 (14.0%) | 2,087 (12.1%) |
| 7:30 AM to 7:59 AM | 1,546 (9.2%) | 2,097 (12.1%) |
| 8:00 AM to 8:29 AM | 2,134 (12.7%) | 2,123 (12.3%) |
| 8:30 AM to 8:59 AM | 805 (4.8%) | 787 (4.6%) |
| 9:00 AM to 9:59 AM | 963 (5.7%) | 1,204 (7.0%) |
| 10:00 AM to 10:59 AM | 449 (2.7%) | 475 (2.8%) |
| 11:00 AM to 11:59 AM | 416 (2.5%) | 274 (1.6%) |
| 12:00 PM to 3:59 PM | 1,200 (7.1%) | 1,637 (9.5%) |
| 4:00 PM to 11:59 PM | 1,109 (6.6%) | 1,277 (7.4%) |
| Total | 16,850 (100.0%) | 17,261 (100.0%) |
Housing Occupancy in Rock Hill
Occupancy by Ownership in Rock Hill
Of the total 30,457 dwellings in Rock Hill, owner-occupied units account for 15,775 (51.8%), while renter-occupied units make up 14,682 (48.2%).
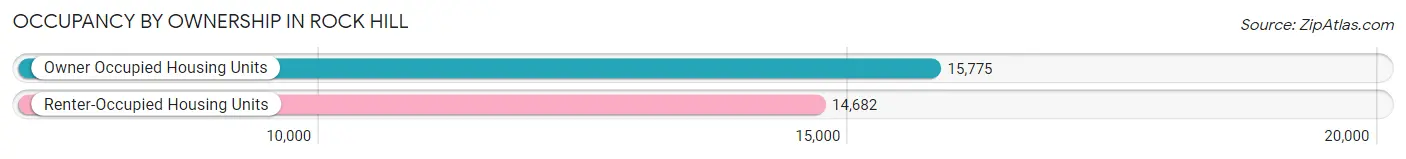
| Occupancy | # Housing Units | % Housing Units |
| Owner Occupied Housing Units | 15,775 | 51.8% |
| Renter-Occupied Housing Units | 14,682 | 48.2% |
| Total Occupied Housing Units | 30,457 | 100.0% |
Occupancy by Household Size in Rock Hill
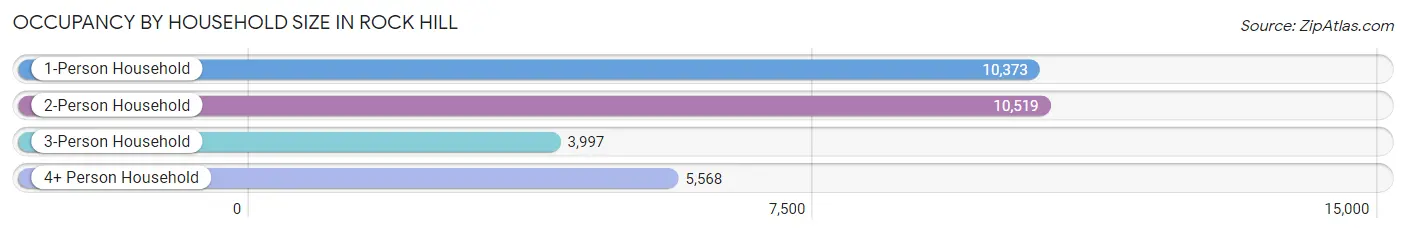
| Household Size | # Housing Units | % Housing Units |
| 1-Person Household | 10,373 | 34.1% |
| 2-Person Household | 10,519 | 34.5% |
| 3-Person Household | 3,997 | 13.1% |
| 4+ Person Household | 5,568 | 18.3% |
| Total Housing Units | 30,457 | 100.0% |
Occupancy by Ownership by Household Size in Rock Hill
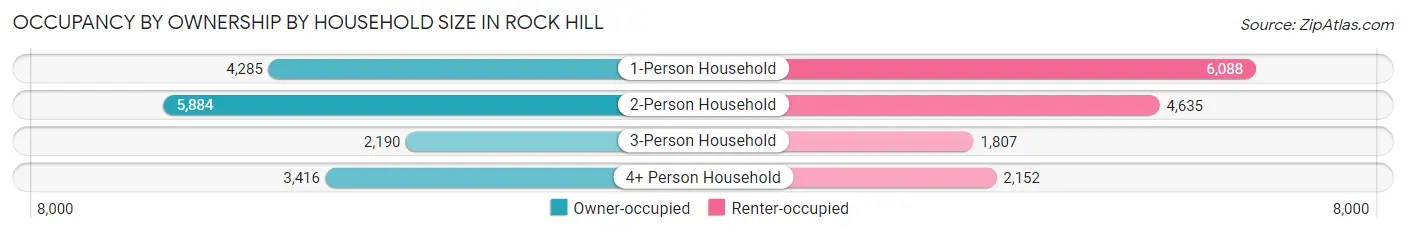
| Household Size | Owner-occupied | Renter-occupied |
| 1-Person Household | 4,285 (41.3%) | 6,088 (58.7%) |
| 2-Person Household | 5,884 (55.9%) | 4,635 (44.1%) |
| 3-Person Household | 2,190 (54.8%) | 1,807 (45.2%) |
| 4+ Person Household | 3,416 (61.4%) | 2,152 (38.7%) |
| Total Housing Units | 15,775 (51.8%) | 14,682 (48.2%) |
Occupancy by Educational Attainment in Rock Hill
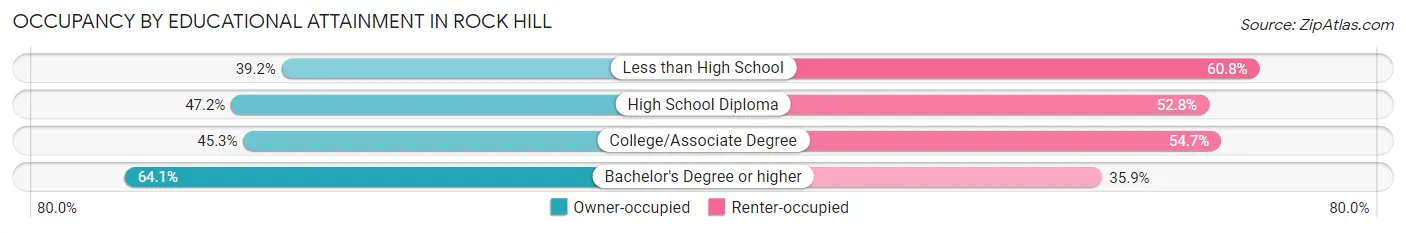
| Household Size | Owner-occupied | Renter-occupied |
| Less than High School | 993 (39.2%) | 1,539 (60.8%) |
| High School Diploma | 2,945 (47.2%) | 3,290 (52.8%) |
| College/Associate Degree | 4,983 (45.3%) | 6,017 (54.7%) |
| Bachelor's Degree or higher | 6,854 (64.1%) | 3,836 (35.9%) |
Occupancy by Age of Householder in Rock Hill
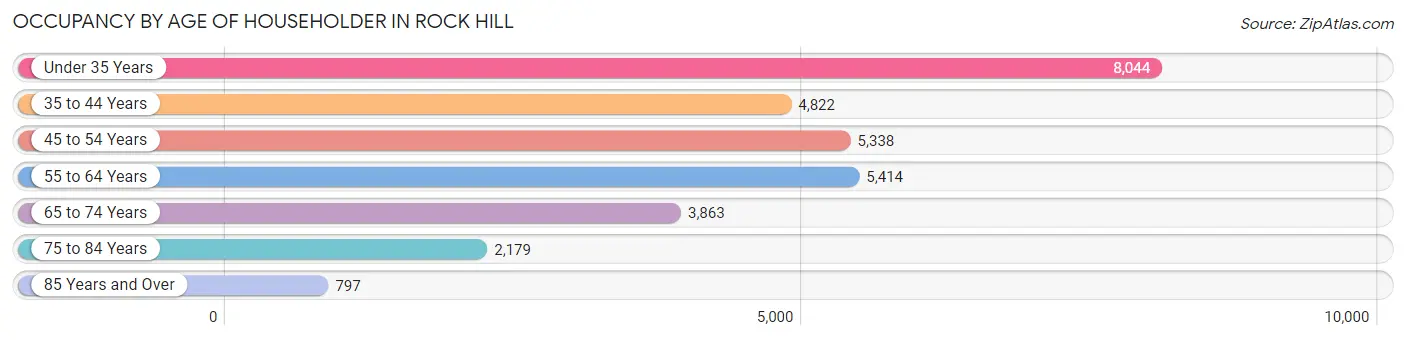
| Age Bracket | # Households | % Households |
| Under 35 Years | 8,044 | 26.4% |
| 35 to 44 Years | 4,822 | 15.8% |
| 45 to 54 Years | 5,338 | 17.5% |
| 55 to 64 Years | 5,414 | 17.8% |
| 65 to 74 Years | 3,863 | 12.7% |
| 75 to 84 Years | 2,179 | 7.1% |
| 85 Years and Over | 797 | 2.6% |
| Total | 30,457 | 100.0% |
Housing Finances in Rock Hill
Median Income by Occupancy in Rock Hill
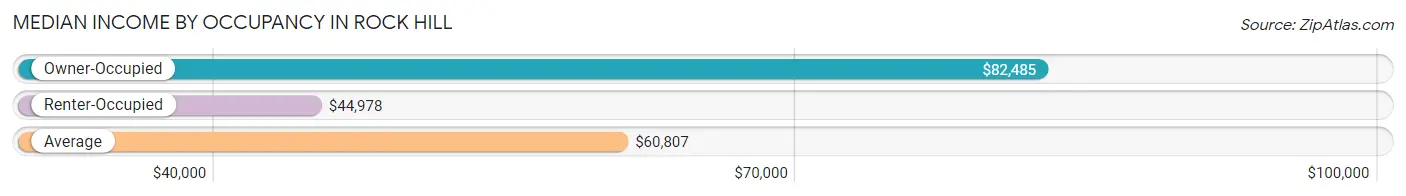
| Occupancy Type | # Households | Median Income |
| Owner-Occupied | 15,775 (51.8%) | $82,485 |
| Renter-Occupied | 14,682 (48.2%) | $44,978 |
| Average | 30,457 (100.0%) | $60,807 |
Occupancy by Householder Income Bracket in Rock Hill
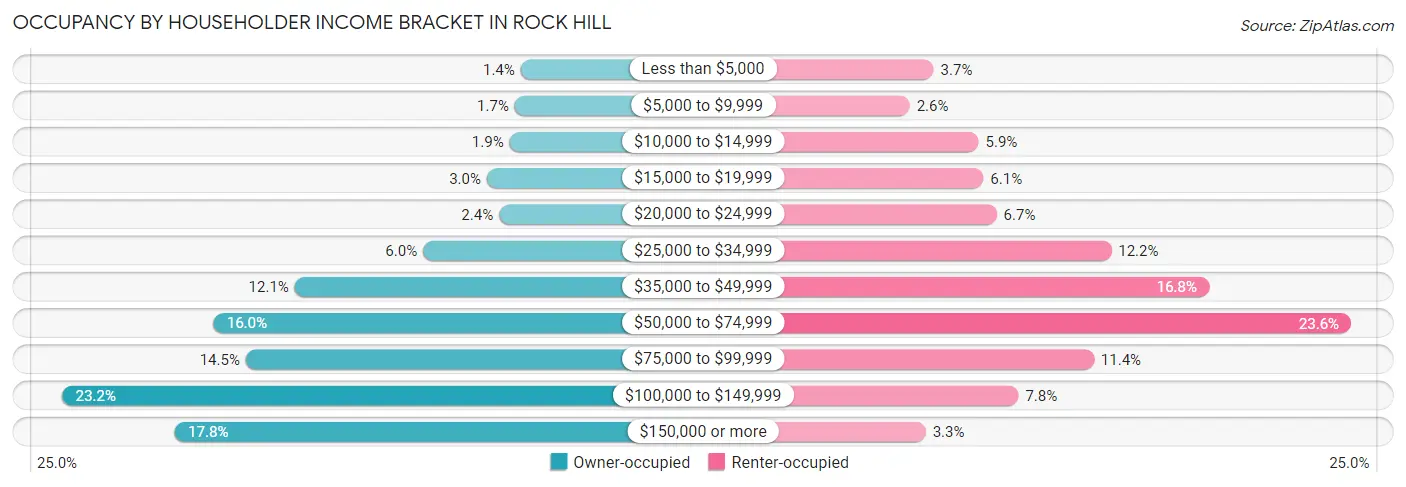
| Income Bracket | Owner-occupied | Renter-occupied |
| Less than $5,000 | 217 (1.4%) | 546 (3.7%) |
| $5,000 to $9,999 | 262 (1.7%) | 379 (2.6%) |
| $10,000 to $14,999 | 302 (1.9%) | 860 (5.9%) |
| $15,000 to $19,999 | 471 (3.0%) | 894 (6.1%) |
| $20,000 to $24,999 | 380 (2.4%) | 986 (6.7%) |
| $25,000 to $34,999 | 951 (6.0%) | 1,789 (12.2%) |
| $35,000 to $49,999 | 1,915 (12.1%) | 2,469 (16.8%) |
| $50,000 to $74,999 | 2,522 (16.0%) | 3,463 (23.6%) |
| $75,000 to $99,999 | 2,283 (14.5%) | 1,666 (11.4%) |
| $100,000 to $149,999 | 3,659 (23.2%) | 1,139 (7.8%) |
| $150,000 or more | 2,813 (17.8%) | 491 (3.3%) |
| Total | 15,775 (100.0%) | 14,682 (100.0%) |
Monthly Housing Cost Tiers in Rock Hill
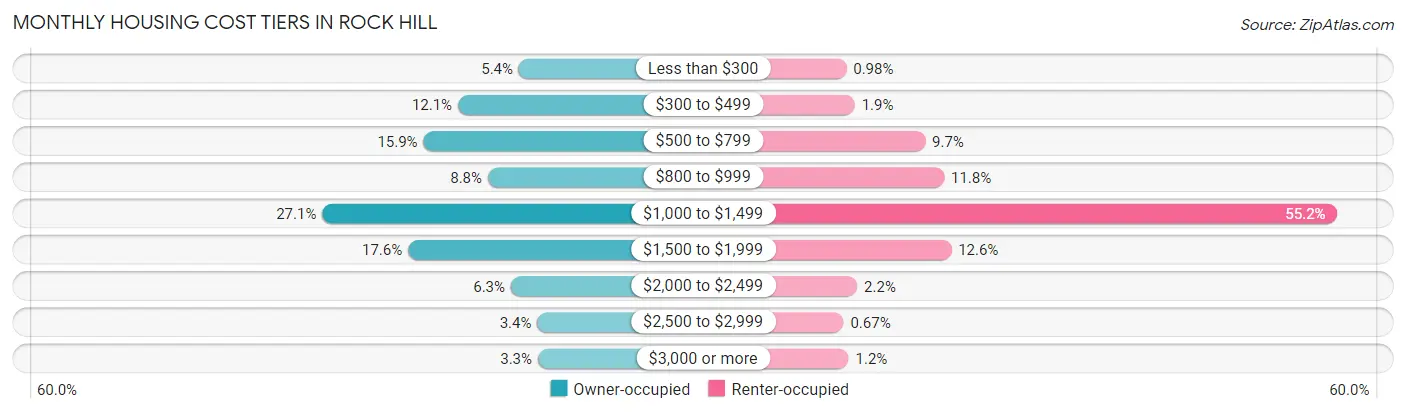
| Monthly Cost | Owner-occupied | Renter-occupied |
| Less than $300 | 852 (5.4%) | 144 (1.0%) |
| $300 to $499 | 1,914 (12.1%) | 281 (1.9%) |
| $500 to $799 | 2,514 (15.9%) | 1,423 (9.7%) |
| $800 to $999 | 1,392 (8.8%) | 1,729 (11.8%) |
| $1,000 to $1,499 | 4,278 (27.1%) | 8,109 (55.2%) |
| $1,500 to $1,999 | 2,783 (17.6%) | 1,845 (12.6%) |
| $2,000 to $2,499 | 991 (6.3%) | 320 (2.2%) |
| $2,500 to $2,999 | 530 (3.4%) | 99 (0.7%) |
| $3,000 or more | 521 (3.3%) | 181 (1.2%) |
| Total | 15,775 (100.0%) | 14,682 (100.0%) |
Physical Housing Characteristics in Rock Hill
Housing Structures in Rock Hill
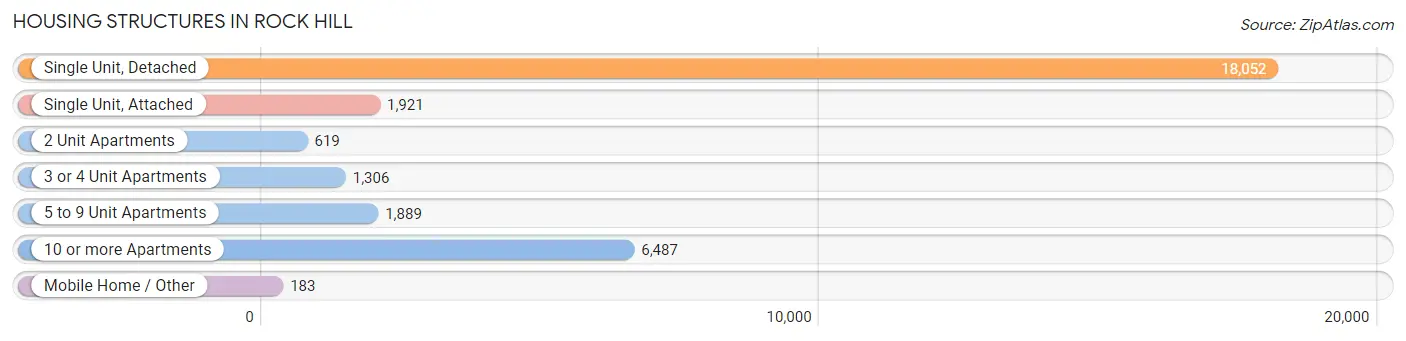
| Structure Type | # Housing Units | % Housing Units |
| Single Unit, Detached | 18,052 | 59.3% |
| Single Unit, Attached | 1,921 | 6.3% |
| 2 Unit Apartments | 619 | 2.0% |
| 3 or 4 Unit Apartments | 1,306 | 4.3% |
| 5 to 9 Unit Apartments | 1,889 | 6.2% |
| 10 or more Apartments | 6,487 | 21.3% |
| Mobile Home / Other | 183 | 0.6% |
| Total | 30,457 | 100.0% |
Housing Structures by Occupancy in Rock Hill
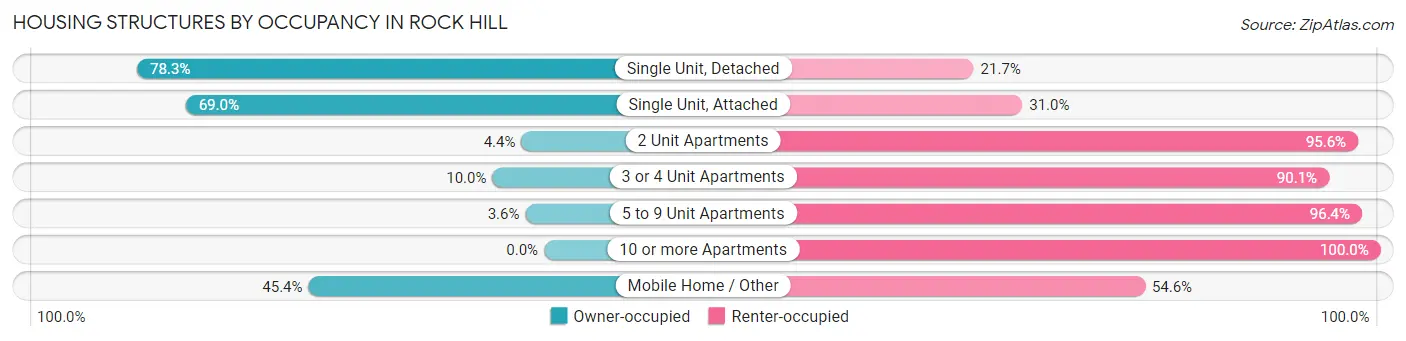
| Structure Type | Owner-occupied | Renter-occupied |
| Single Unit, Detached | 14,142 (78.3%) | 3,910 (21.7%) |
| Single Unit, Attached | 1,325 (69.0%) | 596 (31.0%) |
| 2 Unit Apartments | 27 (4.4%) | 592 (95.6%) |
| 3 or 4 Unit Apartments | 130 (10.0%) | 1,176 (90.0%) |
| 5 to 9 Unit Apartments | 68 (3.6%) | 1,821 (96.4%) |
| 10 or more Apartments | 0 (0.0%) | 6,487 (100.0%) |
| Mobile Home / Other | 83 (45.4%) | 100 (54.6%) |
| Total | 15,775 (51.8%) | 14,682 (48.2%) |
Housing Structures by Number of Rooms in Rock Hill
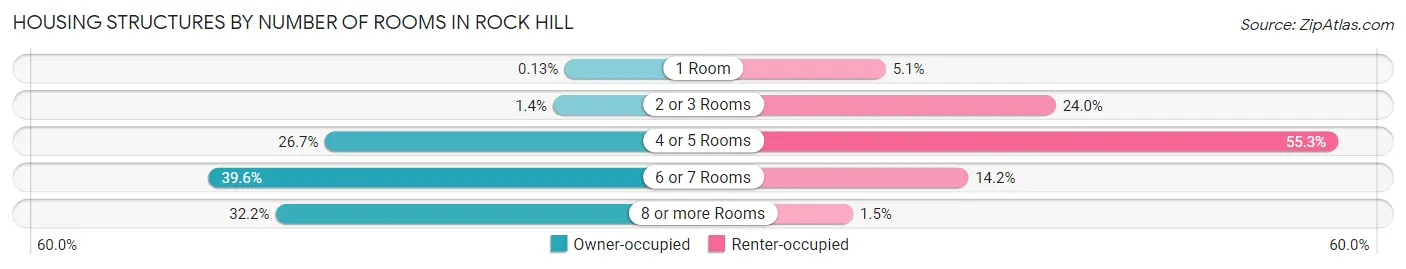
| Number of Rooms | Owner-occupied | Renter-occupied |
| 1 Room | 21 (0.1%) | 746 (5.1%) |
| 2 or 3 Rooms | 217 (1.4%) | 3,516 (23.9%) |
| 4 or 5 Rooms | 4,216 (26.7%) | 8,115 (55.3%) |
| 6 or 7 Rooms | 6,244 (39.6%) | 2,091 (14.2%) |
| 8 or more Rooms | 5,077 (32.2%) | 214 (1.5%) |
| Total | 15,775 (100.0%) | 14,682 (100.0%) |
Housing Structure by Heating Type in Rock Hill
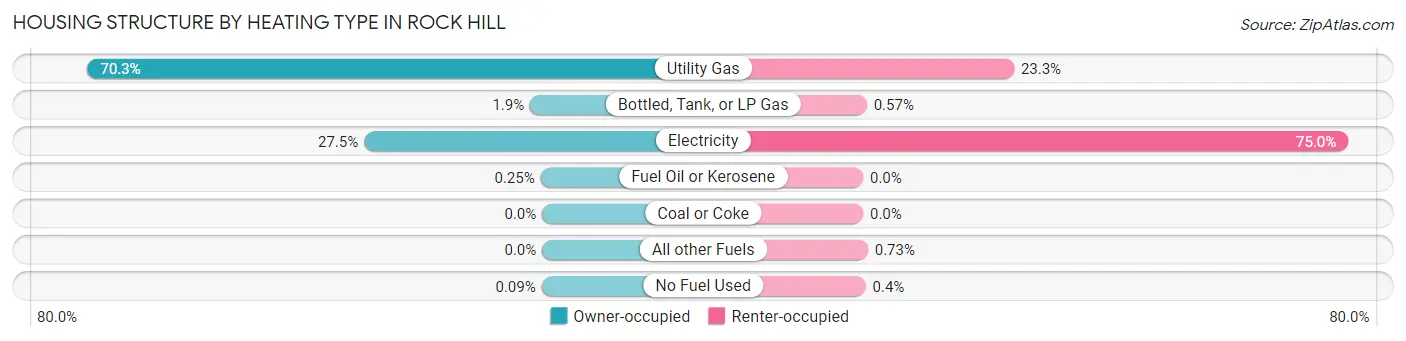
| Heating Type | Owner-occupied | Renter-occupied |
| Utility Gas | 11,088 (70.3%) | 3,426 (23.3%) |
| Bottled, Tank, or LP Gas | 293 (1.9%) | 83 (0.6%) |
| Electricity | 4,341 (27.5%) | 11,008 (75.0%) |
| Fuel Oil or Kerosene | 39 (0.3%) | 0 (0.0%) |
| Coal or Coke | 0 (0.0%) | 0 (0.0%) |
| All other Fuels | 0 (0.0%) | 107 (0.7%) |
| No Fuel Used | 14 (0.1%) | 58 (0.4%) |
| Total | 15,775 (100.0%) | 14,682 (100.0%) |
Household Vehicle Usage in Rock Hill
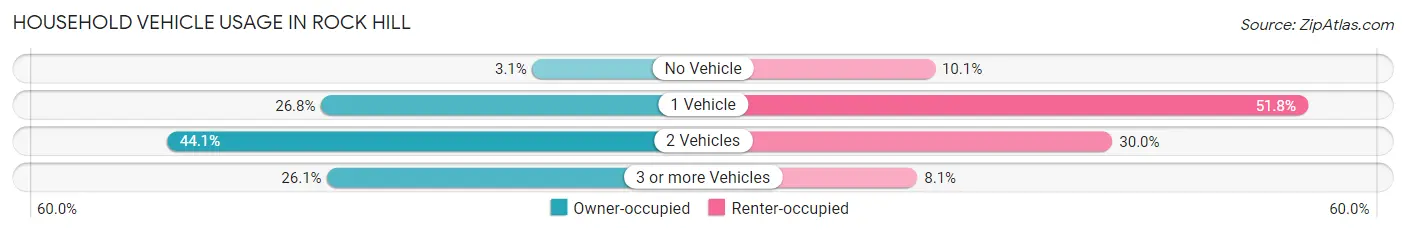
| Vehicles per Household | Owner-occupied | Renter-occupied |
| No Vehicle | 488 (3.1%) | 1,482 (10.1%) |
| 1 Vehicle | 4,222 (26.8%) | 7,611 (51.8%) |
| 2 Vehicles | 6,951 (44.1%) | 4,398 (30.0%) |
| 3 or more Vehicles | 4,114 (26.1%) | 1,191 (8.1%) |
| Total | 15,775 (100.0%) | 14,682 (100.0%) |
Real Estate & Mortgages in Rock Hill
Real Estate and Mortgage Overview in Rock Hill
| Characteristic | Without Mortgage | With Mortgage |
| Housing Units | 4,766 | 11,009 |
| Median Property Value | $200,800 | $243,800 |
| Median Household Income | $57,073 | $2,252 |
| Monthly Housing Costs | $474 | $521 |
| Real Estate Taxes | $1,216 | $260 |
Property Value by Mortgage Status in Rock Hill
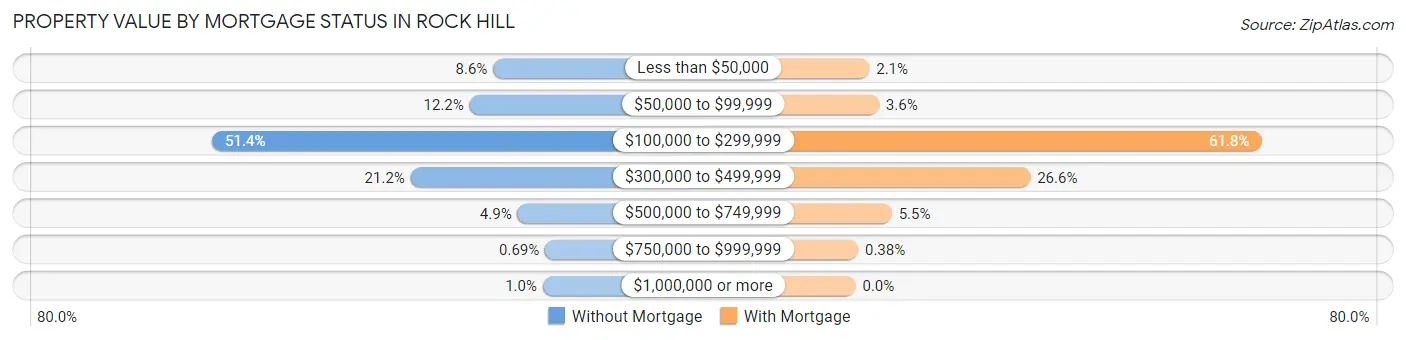
| Property Value | Without Mortgage | With Mortgage |
| Less than $50,000 | 410 (8.6%) | 230 (2.1%) |
| $50,000 to $99,999 | 581 (12.2%) | 392 (3.6%) |
| $100,000 to $299,999 | 2,451 (51.4%) | 6,807 (61.8%) |
| $300,000 to $499,999 | 1,009 (21.2%) | 2,931 (26.6%) |
| $500,000 to $749,999 | 233 (4.9%) | 607 (5.5%) |
| $750,000 to $999,999 | 33 (0.7%) | 42 (0.4%) |
| $1,000,000 or more | 49 (1.0%) | 0 (0.0%) |
| Total | 4,766 (100.0%) | 11,009 (100.0%) |
Household Income by Mortgage Status in Rock Hill
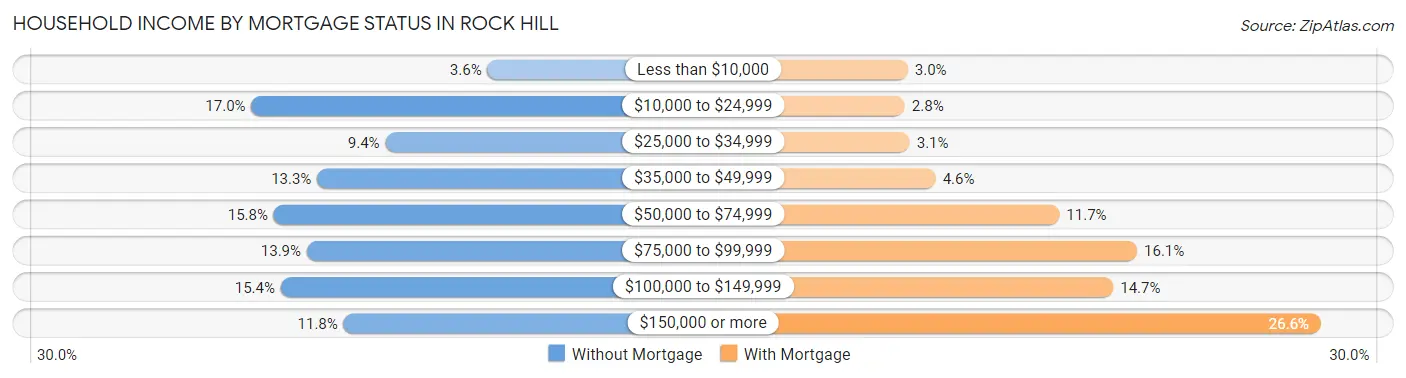
| Household Income | Without Mortgage | With Mortgage |
| Less than $10,000 | 169 (3.5%) | 329 (3.0%) |
| $10,000 to $24,999 | 812 (17.0%) | 310 (2.8%) |
| $25,000 to $34,999 | 447 (9.4%) | 341 (3.1%) |
| $35,000 to $49,999 | 633 (13.3%) | 504 (4.6%) |
| $50,000 to $74,999 | 751 (15.8%) | 1,282 (11.7%) |
| $75,000 to $99,999 | 661 (13.9%) | 1,771 (16.1%) |
| $100,000 to $149,999 | 732 (15.4%) | 1,622 (14.7%) |
| $150,000 or more | 561 (11.8%) | 2,927 (26.6%) |
| Total | 4,766 (100.0%) | 11,009 (100.0%) |
Property Value to Household Income Ratio in Rock Hill
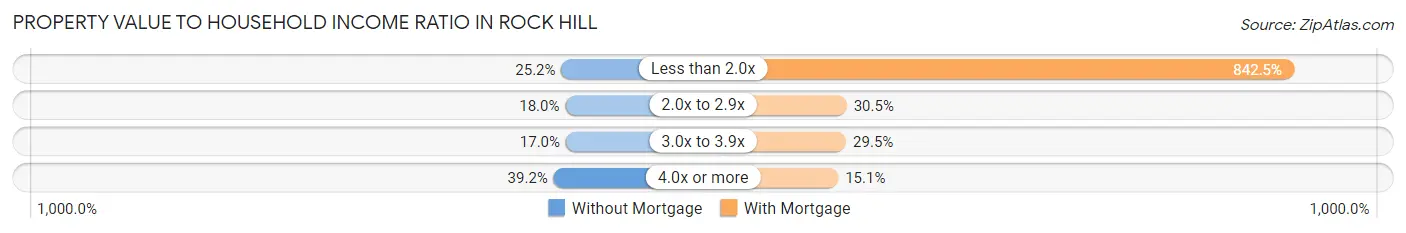
| Value-to-Income Ratio | Without Mortgage | With Mortgage |
| Less than 2.0x | 1,199 (25.2%) | 92,748 (842.5%) |
| 2.0x to 2.9x | 857 (18.0%) | 3,362 (30.5%) |
| 3.0x to 3.9x | 811 (17.0%) | 3,249 (29.5%) |
| 4.0x or more | 1,866 (39.2%) | 1,666 (15.1%) |
| Total | 4,766 (100.0%) | 11,009 (100.0%) |
Real Estate Taxes by Mortgage Status in Rock Hill
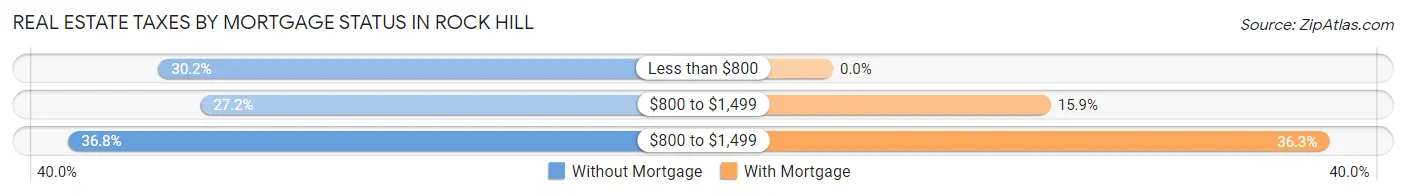
| Property Taxes | Without Mortgage | With Mortgage |
| Less than $800 | 1,441 (30.2%) | 0 (0.0%) |
| $800 to $1,499 | 1,295 (27.2%) | 1,752 (15.9%) |
| $800 to $1,499 | 1,754 (36.8%) | 3,991 (36.2%) |
| Total | 4,766 (100.0%) | 11,009 (100.0%) |
Health & Disability in Rock Hill
Health Insurance Coverage by Age in Rock Hill
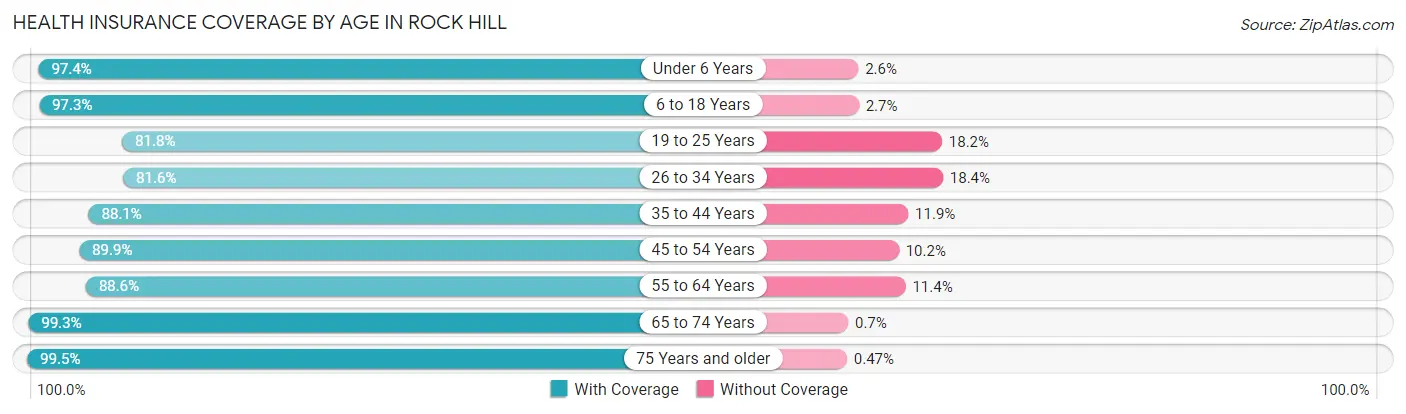
| Age Bracket | With Coverage | Without Coverage |
| Under 6 Years | 5,298 (97.4%) | 141 (2.6%) |
| 6 to 18 Years | 12,103 (97.3%) | 334 (2.7%) |
| 19 to 25 Years | 7,464 (81.8%) | 1,660 (18.2%) |
| 26 to 34 Years | 8,476 (81.6%) | 1,909 (18.4%) |
| 35 to 44 Years | 7,456 (88.1%) | 1,008 (11.9%) |
| 45 to 54 Years | 7,929 (89.8%) | 896 (10.2%) |
| 55 to 64 Years | 7,443 (88.6%) | 959 (11.4%) |
| 65 to 74 Years | 6,403 (99.3%) | 45 (0.7%) |
| 75 Years and older | 3,780 (99.5%) | 18 (0.5%) |
| Total | 66,352 (90.5%) | 6,970 (9.5%) |
Health Insurance Coverage by Citizenship Status in Rock Hill
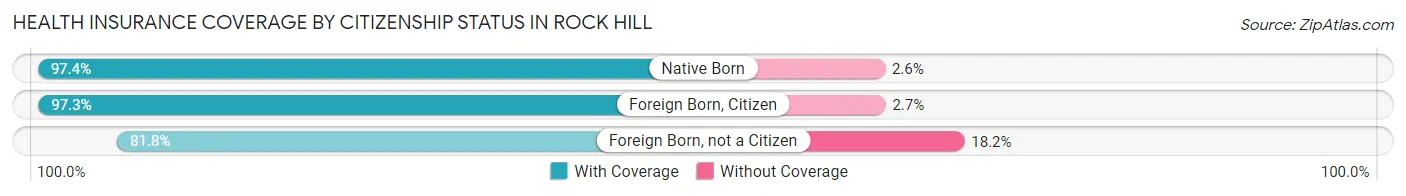
| Citizenship Status | With Coverage | Without Coverage |
| Native Born | 5,298 (97.4%) | 141 (2.6%) |
| Foreign Born, Citizen | 12,103 (97.3%) | 334 (2.7%) |
| Foreign Born, not a Citizen | 7,464 (81.8%) | 1,660 (18.2%) |
Health Insurance Coverage by Household Income in Rock Hill
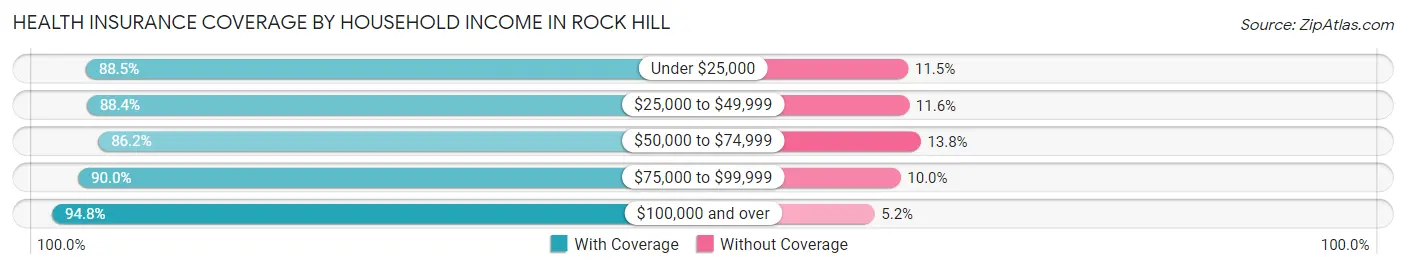
| Household Income | With Coverage | Without Coverage |
| Under $25,000 | 7,507 (88.5%) | 973 (11.5%) |
| $25,000 to $49,999 | 12,756 (88.4%) | 1,680 (11.6%) |
| $50,000 to $74,999 | 10,729 (86.2%) | 1,718 (13.8%) |
| $75,000 to $99,999 | 10,245 (90.0%) | 1,143 (10.0%) |
| $100,000 and over | 22,786 (94.8%) | 1,242 (5.2%) |
Public vs Private Health Insurance Coverage by Age in Rock Hill
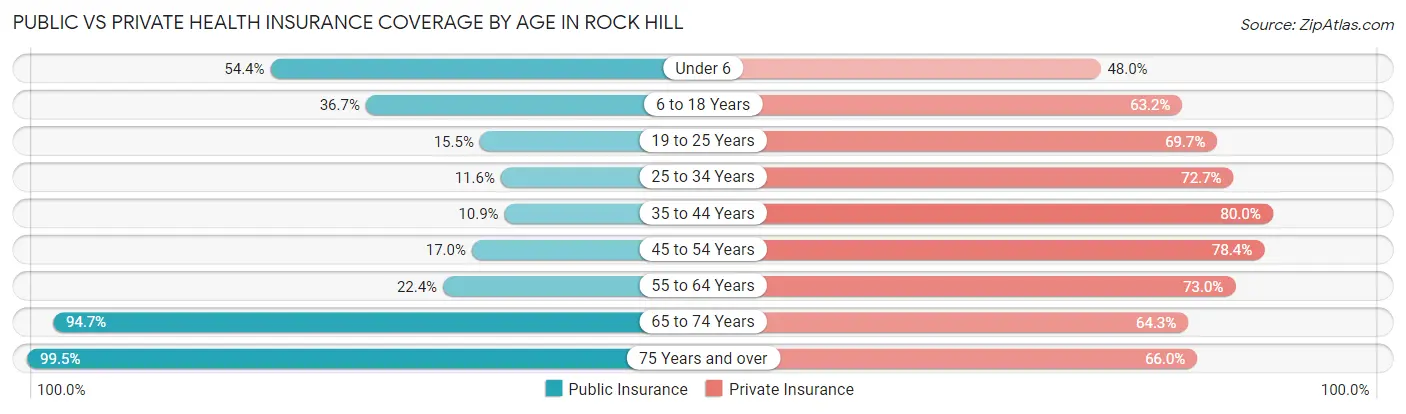
| Age Bracket | Public Insurance | Private Insurance |
| Under 6 | 2,958 (54.4%) | 2,611 (48.0%) |
| 6 to 18 Years | 4,562 (36.7%) | 7,859 (63.2%) |
| 19 to 25 Years | 1,416 (15.5%) | 6,358 (69.7%) |
| 25 to 34 Years | 1,207 (11.6%) | 7,548 (72.7%) |
| 35 to 44 Years | 926 (10.9%) | 6,769 (80.0%) |
| 45 to 54 Years | 1,500 (17.0%) | 6,916 (78.4%) |
| 55 to 64 Years | 1,878 (22.4%) | 6,134 (73.0%) |
| 65 to 74 Years | 6,108 (94.7%) | 4,145 (64.3%) |
| 75 Years and over | 3,780 (99.5%) | 2,505 (66.0%) |
| Total | 24,335 (33.2%) | 50,845 (69.3%) |
Disability Status by Sex by Age in Rock Hill
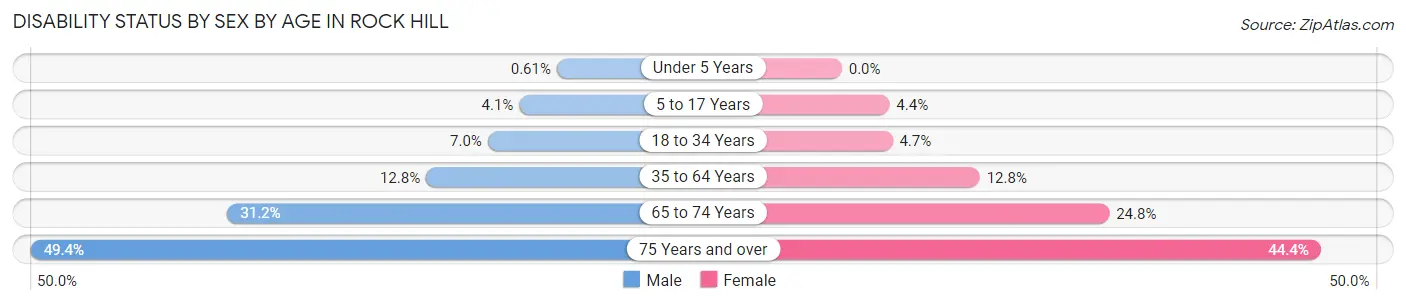
| Age Bracket | Male | Female |
| Under 5 Years | 14 (0.6%) | 0 (0.0%) |
| 5 to 17 Years | 245 (4.1%) | 278 (4.4%) |
| 18 to 34 Years | 667 (7.0%) | 523 (4.7%) |
| 35 to 64 Years | 1,519 (12.8%) | 1,764 (12.8%) |
| 65 to 74 Years | 865 (31.2%) | 912 (24.8%) |
| 75 Years and over | 655 (49.4%) | 1,099 (44.4%) |
Disability Class by Sex by Age in Rock Hill
Disability Class: Hearing Difficulty
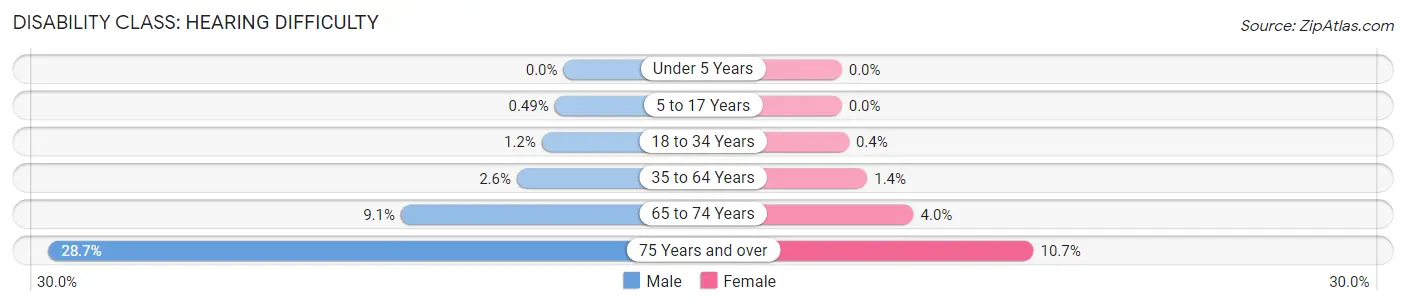
| Age Bracket | Male | Female |
| Under 5 Years | 0 (0.0%) | 0 (0.0%) |
| 5 to 17 Years | 29 (0.5%) | 0 (0.0%) |
| 18 to 34 Years | 115 (1.2%) | 45 (0.4%) |
| 35 to 64 Years | 309 (2.6%) | 196 (1.4%) |
| 65 to 74 Years | 251 (9.0%) | 147 (4.0%) |
| 75 Years and over | 380 (28.7%) | 264 (10.7%) |
Disability Class: Vision Difficulty
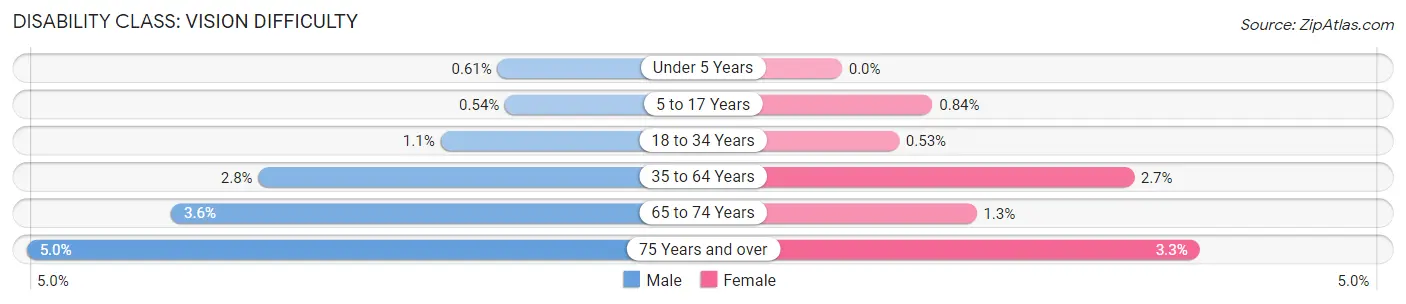
| Age Bracket | Male | Female |
| Under 5 Years | 14 (0.6%) | 0 (0.0%) |
| 5 to 17 Years | 32 (0.5%) | 53 (0.8%) |
| 18 to 34 Years | 108 (1.1%) | 59 (0.5%) |
| 35 to 64 Years | 337 (2.8%) | 373 (2.7%) |
| 65 to 74 Years | 101 (3.6%) | 46 (1.3%) |
| 75 Years and over | 66 (5.0%) | 82 (3.3%) |
Disability Class: Cognitive Difficulty
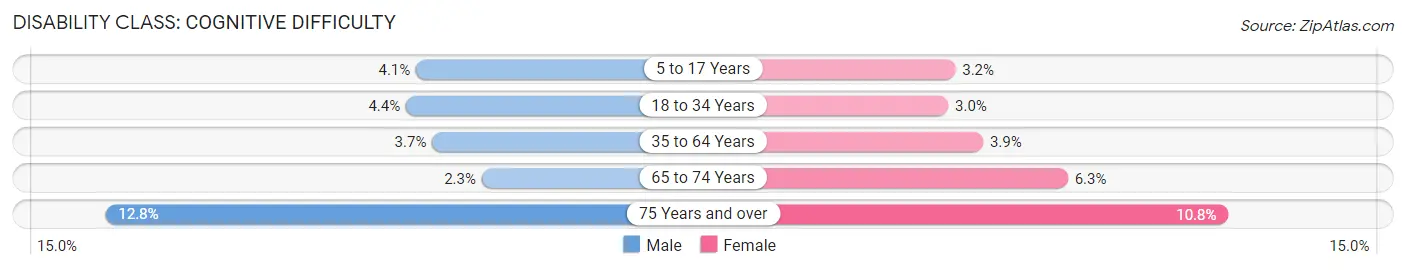
| Age Bracket | Male | Female |
| 5 to 17 Years | 245 (4.1%) | 199 (3.2%) |
| 18 to 34 Years | 416 (4.4%) | 329 (3.0%) |
| 35 to 64 Years | 435 (3.6%) | 542 (3.9%) |
| 65 to 74 Years | 63 (2.3%) | 231 (6.3%) |
| 75 Years and over | 169 (12.8%) | 266 (10.8%) |
Disability Class: Ambulatory Difficulty
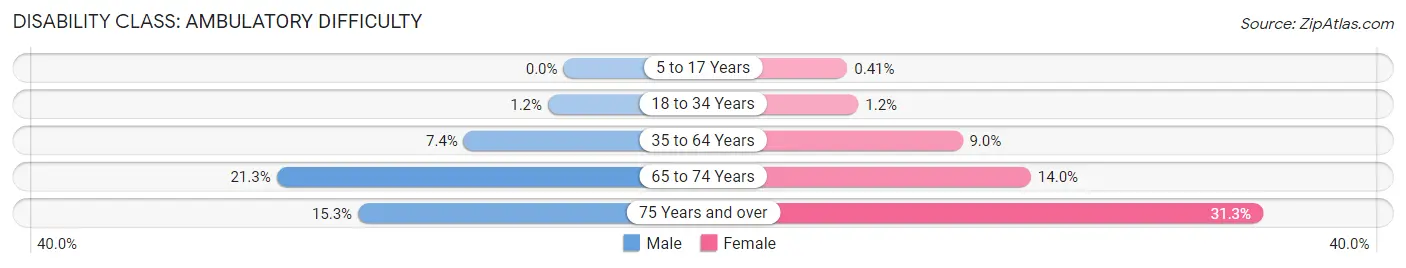
| Age Bracket | Male | Female |
| 5 to 17 Years | 0 (0.0%) | 26 (0.4%) |
| 18 to 34 Years | 109 (1.1%) | 137 (1.2%) |
| 35 to 64 Years | 882 (7.4%) | 1,234 (9.0%) |
| 65 to 74 Years | 591 (21.3%) | 516 (14.0%) |
| 75 Years and over | 202 (15.2%) | 773 (31.3%) |
Disability Class: Self-Care Difficulty
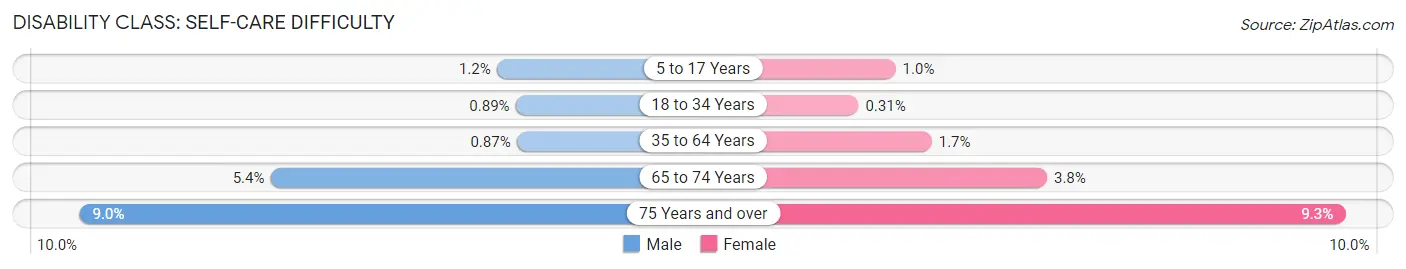
| Age Bracket | Male | Female |
| 5 to 17 Years | 74 (1.2%) | 63 (1.0%) |
| 18 to 34 Years | 85 (0.9%) | 34 (0.3%) |
| 35 to 64 Years | 104 (0.9%) | 230 (1.7%) |
| 65 to 74 Years | 151 (5.4%) | 140 (3.8%) |
| 75 Years and over | 119 (9.0%) | 231 (9.3%) |
Technology Access in Rock Hill
Computing Device Access in Rock Hill
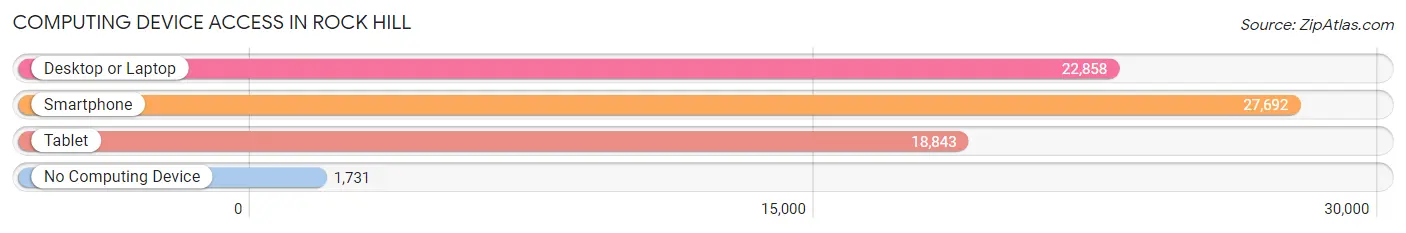
| Device Type | # Households | % Households |
| Desktop or Laptop | 22,858 | 75.0% |
| Smartphone | 27,692 | 90.9% |
| Tablet | 18,843 | 61.9% |
| No Computing Device | 1,731 | 5.7% |
| Total | 30,457 | 100.0% |
Internet Access in Rock Hill
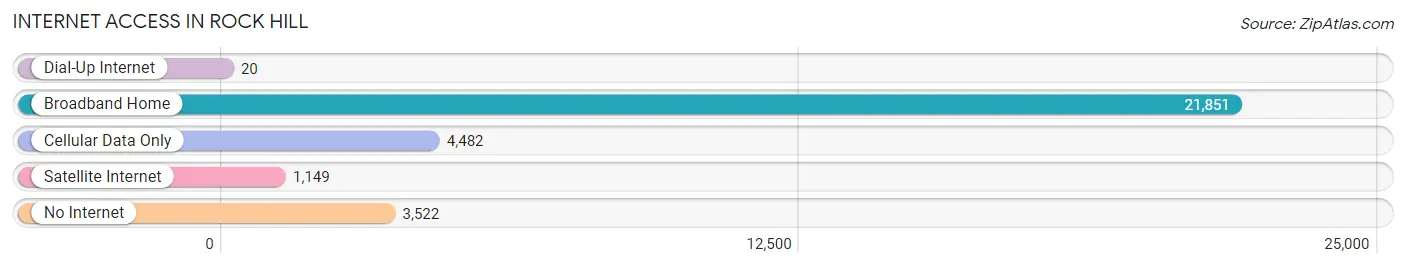
| Internet Type | # Households | % Households |
| Dial-Up Internet | 20 | 0.1% |
| Broadband Home | 21,851 | 71.7% |
| Cellular Data Only | 4,482 | 14.7% |
| Satellite Internet | 1,149 | 3.8% |
| No Internet | 3,522 | 11.6% |
| Total | 30,457 | 100.0% |
Rock Hill Summary
Introduction
Rock Hill is a city located in York County, South Carolina, United States. It is the largest city in the county and the fifth-largest city in the state. The city is situated approximately 25 miles south of Charlotte, North Carolina and approximately 70 miles north of Columbia, South Carolina. Rock Hill is the birthplace of the first African-American president of the United States, Barack Obama.
History
Rock Hill was founded in 1852 by John Roddey, a cotton planter from Chester County, South Carolina. The city was named after a large rock outcropping located on the property of Roddey's plantation. The city was incorporated in 1870 and has since grown to become the largest city in York County.
Geography
Rock Hill is located in the Piedmont region of South Carolina, approximately 25 miles south of Charlotte, North Carolina and approximately 70 miles north of Columbia, South Carolina. The city is situated on the Catawba River and is surrounded by rolling hills and forests. The city has a total area of 24.2 square miles, of which 24.1 square miles is land and 0.1 square miles is water.
Economy
Rock Hill is home to a diverse economy, with a variety of industries including manufacturing, healthcare, education, and retail. The city is home to several major employers, including 3M, Comporium, and the Rock Hill School District. The city is also home to a number of small businesses, including restaurants, shops, and other services.
Demographics
As of the 2010 census, Rock Hill had a population of 66,154. The racial makeup of the city was 63.2% White, 28.7% African American, 0.4% Native American, 1.7% Asian, 0.1% Pacific Islander, 3.2% from other races, and 2.7% from two or more races. Hispanic or Latino of any race were 6.7% of the population.
Conclusion
Rock Hill is a city located in York County, South Carolina, United States. It is the largest city in the county and the fifth-largest city in the state. The city is situated approximately 25 miles south of Charlotte, North Carolina and approximately 70 miles north of Columbia, South Carolina. Rock Hill was founded in 1852 by John Roddey and has since grown to become the largest city in York County. The city is home to a diverse economy, with a variety of industries including manufacturing, healthcare, education, and retail. As of the 2010 census, Rock Hill had a population of 66,154, with a racial makeup of 63.2% White, 28.7% African American, 0.4% Native American, 1.7% Asian, 0.1% Pacific Islander, 3.2% from other races, and 2.7% from two or more races.
Common Questions
What is Per Capita Income in Rock Hill?
Per Capita income in Rock Hill is $34,480.
What is the Median Family Income in Rock Hill?
Median Family Income in Rock Hill is $79,736.
What is the Median Household income in Rock Hill?
Median Household Income in Rock Hill is $60,807.
What is Income or Wage Gap in Rock Hill?
Income or Wage Gap in Rock Hill is 24.1%.
Women in Rock Hill earn 75.9 cents for every dollar earned by a man.
What is Family Income Deficit in Rock Hill?
Family Income Deficit in Rock Hill is $9,525.
Families that are below poverty line in Rock Hill earn $9,525 less on average than the poverty threshold level.
What is Inequality or Gini Index in Rock Hill?
Inequality or Gini Index in Rock Hill is 0.44.
What is the Total Population of Rock Hill?
Total Population of Rock Hill is 74,170.
What is the Total Male Population of Rock Hill?
Total Male Population of Rock Hill is 34,343.
What is the Total Female Population of Rock Hill?
Total Female Population of Rock Hill is 39,827.
What is the Ratio of Males per 100 Females in Rock Hill?
There are 86.23 Males per 100 Females in Rock Hill.
What is the Ratio of Females per 100 Males in Rock Hill?
There are 115.97 Females per 100 Males in Rock Hill.
What is the Median Population Age in Rock Hill?
Median Population Age in Rock Hill is 34.5 Years.
What is the Average Family Size in Rock Hill
Average Family Size in Rock Hill is 3.0 People.
What is the Average Household Size in Rock Hill
Average Household Size in Rock Hill is 2.3 People.
How Large is the Labor Force in Rock Hill?
There are 40,076 People in the Labor Forcein in Rock Hill.
What is the Percentage of People in the Labor Force in Rock Hill?
67.6% of People are in the Labor Force in Rock Hill.
What is the Unemployment Rate in Rock Hill?
Unemployment Rate in Rock Hill is 5.3%.