Cities with the Most Immigrants from Argentina in the United States
RELATED REPORTS & OPTIONS
Argentina
United States
Compare Cities
Map of Cities with the Most Immigrants from Argentina in the United States
0
15,000
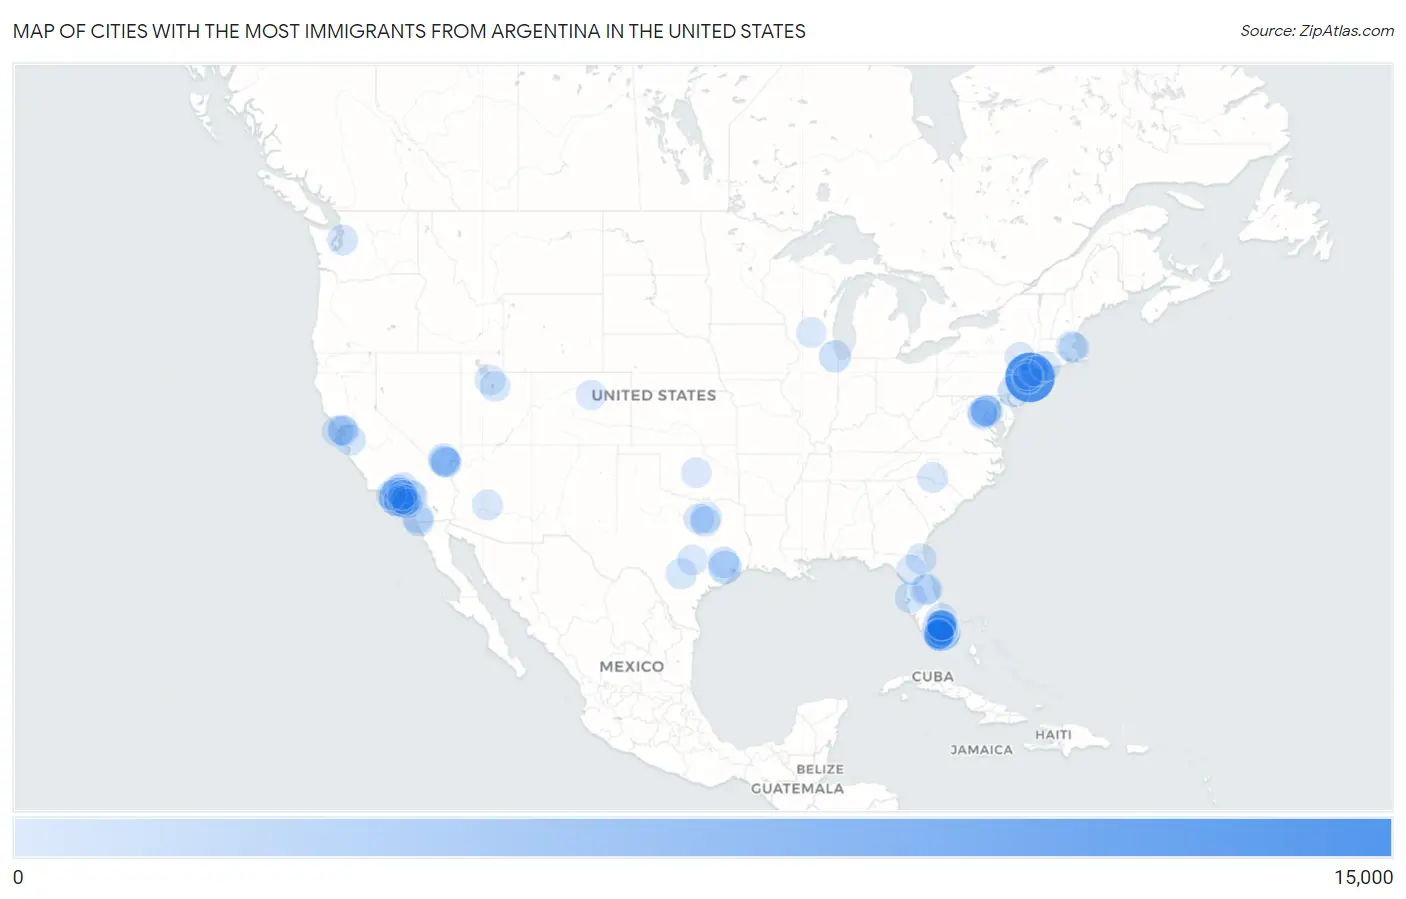
Cities with the Most Immigrants from Argentina in the United States
| City | Argentina | vs State | vs National | |
| 1. | New York | 12,718 | 21,928(58.00%)#1 | 200,110(6.36%)#1 |
| 2. | Los Angeles | 5,915 | 33,960(17.42%)#1 | 200,110(2.96%)#2 |
| 3. | Miami | 4,815 | 57,263(8.41%)#1 | 200,110(2.41%)#3 |
| 4. | Miami Beach | 3,752 | 57,263(6.55%)#2 | 200,110(1.87%)#4 |
| 5. | Hollywood | 2,514 | 57,263(4.39%)#3 | 200,110(1.26%)#5 |
| 6. | Houston | 2,040 | 13,034(15.65%)#1 | 200,110(1.02%)#6 |
| 7. | Weston | 1,976 | 57,263(3.45%)#4 | 200,110(0.99%)#7 |
| 8. | Key Biscayne | 1,582 | 57,263(2.76%)#5 | 200,110(0.79%)#8 |
| 9. | Chicago | 1,316 | 3,955(33.27%)#1 | 200,110(0.66%)#9 |
| 10. | Philadelphia | 1,303 | 4,113(31.68%)#1 | 200,110(0.65%)#10 |
| 11. | Aventura | 1,244 | 57,263(2.17%)#6 | 200,110(0.62%)#11 |
| 12. | Doral | 1,176 | 57,263(2.05%)#7 | 200,110(0.59%)#12 |
| 13. | Fort Lauderdale | 1,088 | 57,263(1.90%)#8 | 200,110(0.54%)#13 |
| 14. | Washington | 1,026 | 1,026(100.00%)#1 | 200,110(0.51%)#14 |
| 15. | San Diego | 1,021 | 33,960(3.01%)#2 | 200,110(0.51%)#15 |
| 16. | The Woodlands | 941 | 13,034(7.22%)#2 | 200,110(0.47%)#16 |
| 17. | Sunny Isles Beach | 873 | 57,263(1.52%)#9 | 200,110(0.44%)#17 |
| 18. | North Miami Beach | 856 | 57,263(1.49%)#10 | 200,110(0.43%)#18 |
| 19. | Las Vegas | 813 | 2,867(28.36%)#1 | 200,110(0.41%)#19 |
| 20. | The Hammocks | 796 | 57,263(1.39%)#11 | 200,110(0.40%)#20 |
| 21. | Sunrise | 778 | 57,263(1.36%)#12 | 200,110(0.39%)#21 |
| 22. | Ojus | 757 | 57,263(1.32%)#13 | 200,110(0.38%)#22 |
| 23. | Hallandale Beach | 743 | 57,263(1.30%)#14 | 200,110(0.37%)#23 |
| 24. | Tampa | 734 | 57,263(1.28%)#15 | 200,110(0.37%)#24 |
| 25. | Hialeah | 733 | 57,263(1.28%)#16 | 200,110(0.37%)#25 |
| 26. | San Francisco | 713 | 33,960(2.10%)#3 | 200,110(0.36%)#26 |
| 27. | San Antonio | 711 | 13,034(5.45%)#3 | 200,110(0.36%)#27 |
| 28. | North Miami | 710 | 57,263(1.24%)#17 | 200,110(0.35%)#28 |
| 29. | San Jose | 701 | 33,960(2.06%)#4 | 200,110(0.35%)#29 |
| 30. | Wellington | 687 | 57,263(1.20%)#18 | 200,110(0.34%)#30 |
| 31. | Ives Estates | 686 | 57,263(1.20%)#19 | 200,110(0.34%)#31 |
| 32. | Long Beach | 642 | 33,960(1.89%)#5 | 200,110(0.32%)#32 |
| 33. | Stamford | 626 | 3,583(17.47%)#1 | 200,110(0.31%)#33 |
| 34. | Coral Gables | 620 | 57,263(1.08%)#20 | 200,110(0.31%)#34 |
| 35. | Orlando | 614 | 57,263(1.07%)#21 | 200,110(0.31%)#35 |
| 36. | Jersey City | 611 | 10,607(5.76%)#1 | 200,110(0.31%)#36 |
| 37. | Rancho Cucamonga | 608 | 33,960(1.79%)#6 | 200,110(0.30%)#37 |
| 38. | Kendall | 606 | 57,263(1.06%)#22 | 200,110(0.30%)#38 |
| 39. | Pembroke Pines | 589 | 57,263(1.03%)#23 | 200,110(0.29%)#39 |
| 40. | Coral Springs | 559 | 57,263(0.98%)#24 | 200,110(0.28%)#40 |
| 41. | Dallas | 554 | 13,034(4.25%)#4 | 200,110(0.28%)#41 |
| 42. | Seattle | 551 | 2,284(24.12%)#1 | 200,110(0.28%)#42 |
| 43. | Miramar | 529 | 57,263(0.92%)#25 | 200,110(0.26%)#43 |
| 44. | Phoenix | 525 | 2,126(24.69%)#1 | 200,110(0.26%)#44 |
| 45. | Spring Valley | 523 | 2,867(18.24%)#2 | 200,110(0.26%)#45 |
| 46. | Fountainebleau | 517 | 57,263(0.90%)#26 | 200,110(0.26%)#46 |
| 47. | Jacksonville | 483 | 57,263(0.84%)#27 | 200,110(0.24%)#47 |
| 48. | Bethesda | 481 | 4,282(11.23%)#1 | 200,110(0.24%)#48 |
| 49. | Fort Worth | 470 | 13,034(3.61%)#5 | 200,110(0.23%)#49 |
| 50. | Country Club | 469 | 57,263(0.82%)#28 | 200,110(0.23%)#50 |
| 51. | Cambridge | 444 | 3,727(11.91%)#1 | 200,110(0.22%)#51 |
| 52. | West Jordan | 439 | 3,570(12.30%)#1 | 200,110(0.22%)#52 |
| 53. | Charlotte | 431 | 3,710(11.62%)#1 | 200,110(0.22%)#53 |
| 54. | Paradise | 424 | 2,867(14.79%)#3 | 200,110(0.21%)#54 |
| 55. | Provo | 415 | 3,570(11.62%)#2 | 200,110(0.21%)#55 |
| 56. | Glendale | 413 | 33,960(1.22%)#7 | 200,110(0.21%)#56 |
| 57. | Liberty | 402 | 21,928(1.83%)#2 | 200,110(0.20%)#57 |
| 58. | Santa Monica | 401 | 33,960(1.18%)#8 | 200,110(0.20%)#58 |
| 59. | Redondo Beach | 400 | 33,960(1.18%)#9 | 200,110(0.20%)#59 |
| 60. | Santa Clarita | 394 | 33,960(1.16%)#10 | 200,110(0.20%)#60 |
| 61. | Boston | 393 | 3,727(10.54%)#2 | 200,110(0.20%)#61 |
| 62. | Davie | 392 | 57,263(0.68%)#29 | 200,110(0.20%)#62 |
| 63. | Fontana | 391 | 33,960(1.15%)#11 | 200,110(0.20%)#63 |
| 64. | Desoto | 390 | 13,034(2.99%)#6 | 200,110(0.19%)#64 |
| 65. | Cutler Bay | 388 | 57,263(0.68%)#30 | 200,110(0.19%)#65 |
| 66. | Elizabeth | 387 | 10,607(3.65%)#2 | 200,110(0.19%)#66 |
| 67. | Henderson | 385 | 2,867(13.43%)#4 | 200,110(0.19%)#67 |
| 68. | Palmdale | 380 | 33,960(1.12%)#12 | 200,110(0.19%)#68 |
| 69. | Olympia Heights | 377 | 57,263(0.66%)#31 | 200,110(0.19%)#69 |
| 70. | Arlington | 375 | 4,997(7.50%)#1 | 200,110(0.19%)#70 |
| 71. | Chula Vista | 370 | 33,960(1.09%)#13 | 200,110(0.18%)#71 |
| 72. | Fair Lawn Borough | 370 | 10,607(3.49%)#3 | 200,110(0.18%)#72 |
| 73. | Oakland | 369 | 33,960(1.09%)#14 | 200,110(0.18%)#73 |
| 74. | Fullerton | 352 | 33,960(1.04%)#15 | 200,110(0.18%)#74 |
| 75. | Coconut Creek | 340 | 57,263(0.59%)#32 | 200,110(0.17%)#75 |
| 76. | Huntington Beach | 339 | 33,960(1.00%)#16 | 200,110(0.17%)#76 |
| 77. | Deerfield Beach | 331 | 57,263(0.58%)#33 | 200,110(0.17%)#77 |
| 78. | Berkeley | 320 | 33,960(0.94%)#17 | 200,110(0.16%)#78 |
| 79. | Austin | 317 | 13,034(2.43%)#7 | 200,110(0.16%)#79 |
| 80. | Anaheim | 315 | 33,960(0.93%)#18 | 200,110(0.16%)#80 |
| 81. | Oklahoma City | 314 | 719(43.67%)#1 | 200,110(0.16%)#81 |
| 82. | Lake Ridge | 313 | 4,997(6.26%)#2 | 200,110(0.16%)#82 |
| 83. | Miami Shores | 312 | 57,263(0.54%)#34 | 200,110(0.16%)#83 |
| 84. | Madison | 308 | 1,622(18.99%)#1 | 200,110(0.15%)#84 |
| 85. | Tamarac | 299 | 57,263(0.52%)#35 | 200,110(0.15%)#85 |
| 86. | Margate | 296 | 57,263(0.52%)#36 | 200,110(0.15%)#86 |
| 87. | Irvine | 292 | 33,960(0.86%)#19 | 200,110(0.15%)#87 |
| 88. | The Crossings | 290 | 57,263(0.51%)#37 | 200,110(0.14%)#88 |
| 89. | Torrance | 286 | 33,960(0.84%)#20 | 200,110(0.14%)#89 |
| 90. | Harrison | 286 | 21,928(1.30%)#3 | 200,110(0.14%)#90 |
| 91. | Fairfax | 282 | 4,997(5.64%)#3 | 200,110(0.14%)#91 |
| 92. | New Haven | 276 | 3,583(7.70%)#2 | 200,110(0.14%)#92 |
| 93. | Alafaya | 273 | 57,263(0.48%)#38 | 200,110(0.14%)#93 |
| 94. | Denver | 270 | 3,016(8.95%)#1 | 200,110(0.13%)#94 |
| 95. | Thousand Oaks | 267 | 33,960(0.79%)#21 | 200,110(0.13%)#95 |
| 96. | Clifton | 267 | 10,607(2.52%)#4 | 200,110(0.13%)#96 |
| 97. | Gainesville | 261 | 57,263(0.46%)#39 | 200,110(0.13%)#97 |
| 98. | Downey | 260 | 33,960(0.77%)#22 | 200,110(0.13%)#98 |
| 99. | Tamiami | 260 | 57,263(0.45%)#40 | 200,110(0.13%)#99 |
| 100. | Pasadena | 255 | 33,960(0.75%)#23 | 200,110(0.13%)#100 |
Common Questions
What are the Top 10 Cities with the Most Immigrants from Argentina in the United States?
Top 10 Cities with the Most Immigrants from Argentina in the United States are:
#1
12,718
#2
5,915
#3
4,815
#4
3,752
#5
2,514
#6
2,040
#7
1,976
#8
1,582
#9
1,316
#10
1,303
What city has the Most Immigrants from Argentina in the United States?
New York has the Most Immigrants from Argentina in the United States with 12,718.
What is the Total Immigrants from Argentina in the United States?
Total Immigrants from Argentina in the United States is 200,110.