Cities with the Largest Lithuanian Community in the United States
RELATED REPORTS & OPTIONS
Lithuanian
United States
Compare Cities
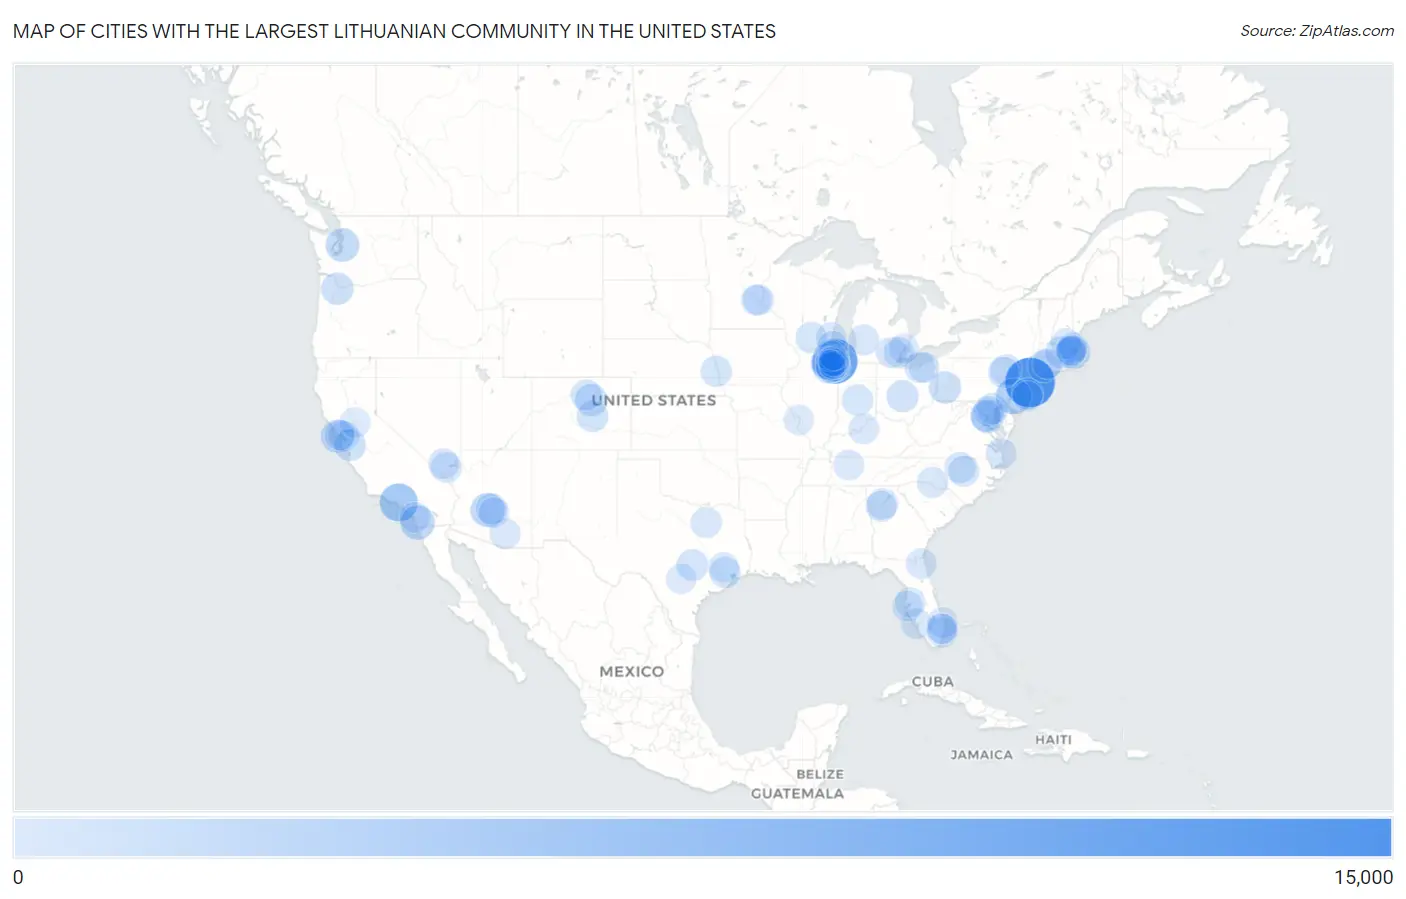
Map of Cities with the Largest Lithuanian Community in the United States
0
15,000
Cities with the Largest Lithuanian Community in the United States
| City | Lithuanian | vs State | vs National | |
| 1. | New York | 12,873 | 40,416(31.85%)#1 | 613,139(2.10%)#1 |
| 2. | Chicago | 9,926 | 72,255(13.74%)#1 | 613,139(1.62%)#2 |
| 3. | Los Angeles | 5,322 | 44,962(11.84%)#1 | 613,139(0.87%)#3 |
| 4. | Philadelphia | 4,010 | 63,027(6.36%)#1 | 613,139(0.65%)#4 |
| 5. | San Diego | 3,031 | 44,962(6.74%)#2 | 613,139(0.49%)#5 |
| 6. | Phoenix | 2,765 | 11,984(23.07%)#1 | 613,139(0.45%)#6 |
| 7. | Seattle | 2,536 | 12,543(20.22%)#1 | 613,139(0.41%)#7 |
| 8. | Washington | 2,487 | 2,487(100.00%)#1 | 613,139(0.41%)#8 |
| 9. | San Francisco | 2,360 | 44,962(5.25%)#3 | 613,139(0.38%)#9 |
| 10. | Boston | 2,234 | 41,646(5.36%)#1 | 613,139(0.36%)#10 |
| 11. | Lemont | 1,736 | 72,255(2.40%)#2 | 613,139(0.28%)#11 |
| 12. | Portland | 1,727 | 5,668(30.47%)#1 | 613,139(0.28%)#12 |
| 13. | Pittsburgh | 1,726 | 63,027(2.74%)#2 | 613,139(0.28%)#13 |
| 14. | Denver | 1,707 | 12,878(13.26%)#1 | 613,139(0.28%)#14 |
| 15. | Naperville | 1,666 | 72,255(2.31%)#3 | 613,139(0.27%)#15 |
| 16. | Waterbury | 1,657 | 25,587(6.48%)#1 | 613,139(0.27%)#16 |
| 17. | Worcester | 1,643 | 41,646(3.95%)#2 | 613,139(0.27%)#17 |
| 18. | Columbus | 1,513 | 21,079(7.18%)#1 | 613,139(0.25%)#18 |
| 19. | San Jose | 1,511 | 44,962(3.36%)#4 | 613,139(0.25%)#19 |
| 20. | Joliet | 1,420 | 72,255(1.97%)#4 | 613,139(0.23%)#20 |
| 21. | Orland Park | 1,393 | 72,255(1.93%)#5 | 613,139(0.23%)#21 |
| 22. | Austin | 1,309 | 16,437(7.96%)#1 | 613,139(0.21%)#22 |
| 23. | Colorado Springs | 1,275 | 12,878(9.90%)#2 | 613,139(0.21%)#23 |
| 24. | Lakewood | 1,144 | 30,104(3.80%)#1 | 613,139(0.19%)#24 |
| 25. | Downers Grove | 1,124 | 72,255(1.56%)#6 | 613,139(0.18%)#25 |
| 26. | Indianapolis | 1,109 | 9,782(11.34%)#1 | 613,139(0.18%)#26 |
| 27. | Baltimore | 1,078 | 15,806(6.82%)#1 | 613,139(0.18%)#27 |
| 28. | Madison | 1,077 | 13,525(7.96%)#1 | 613,139(0.18%)#28 |
| 29. | Houston | 1,066 | 16,437(6.49%)#2 | 613,139(0.17%)#29 |
| 30. | Homer Glen | 1,064 | 72,255(1.47%)#7 | 613,139(0.17%)#30 |
| 31. | Omaha | 1,061 | 2,251(47.13%)#1 | 613,139(0.17%)#31 |
| 32. | Oak Lawn | 1,053 | 72,255(1.46%)#8 | 613,139(0.17%)#32 |
| 33. | Scranton | 1,031 | 63,027(1.64%)#3 | 613,139(0.17%)#33 |
| 34. | Tinley Park | 1,018 | 72,255(1.41%)#9 | 613,139(0.17%)#34 |
| 35. | Boulder | 988 | 12,878(7.67%)#3 | 613,139(0.16%)#35 |
| 36. | Durham | 969 | 11,130(8.71%)#1 | 613,139(0.16%)#36 |
| 37. | Raleigh | 964 | 11,130(8.66%)#2 | 613,139(0.16%)#37 |
| 38. | Scottsdale | 947 | 11,984(7.90%)#2 | 613,139(0.15%)#38 |
| 39. | Wilkes Barre | 915 | 63,027(1.45%)#4 | 613,139(0.15%)#39 |
| 40. | Charlotte | 887 | 11,130(7.97%)#3 | 613,139(0.14%)#40 |
| 41. | Dallas | 869 | 16,437(5.29%)#3 | 613,139(0.14%)#41 |
| 42. | Cleveland | 857 | 21,079(4.07%)#2 | 613,139(0.14%)#42 |
| 43. | Ann Arbor | 849 | 28,794(2.95%)#1 | 613,139(0.14%)#43 |
| 44. | Sandy Springs | 842 | 7,887(10.68%)#1 | 613,139(0.14%)#44 |
| 45. | Oakland | 841 | 44,962(1.87%)#5 | 613,139(0.14%)#45 |
| 46. | Newton | 839 | 41,646(2.01%)#3 | 613,139(0.14%)#46 |
| 47. | Grand Rapids | 837 | 28,794(2.91%)#2 | 613,139(0.14%)#47 |
| 48. | Atlanta | 836 | 7,887(10.60%)#2 | 613,139(0.14%)#48 |
| 49. | Dearborn | 833 | 28,794(2.89%)#3 | 613,139(0.14%)#49 |
| 50. | Tucson | 816 | 11,984(6.81%)#3 | 613,139(0.13%)#50 |
| 51. | Carlsbad | 794 | 44,962(1.77%)#6 | 613,139(0.13%)#51 |
| 52. | Henderson | 790 | 4,111(19.22%)#1 | 613,139(0.13%)#52 |
| 53. | Milwaukee | 787 | 13,525(5.82%)#2 | 613,139(0.13%)#53 |
| 54. | St Paul | 779 | 5,734(13.59%)#1 | 613,139(0.13%)#54 |
| 55. | Jacksonville | 777 | 38,740(2.01%)#1 | 613,139(0.13%)#55 |
| 56. | Aurora | 747 | 72,255(1.03%)#10 | 613,139(0.12%)#56 |
| 57. | Hickory Hills | 742 | 72,255(1.03%)#11 | 613,139(0.12%)#57 |
| 58. | Arlington | 737 | 12,883(5.72%)#1 | 613,139(0.12%)#58 |
| 59. | Bolingbrook | 737 | 72,255(1.02%)#12 | 613,139(0.12%)#59 |
| 60. | Virginia Beach | 730 | 12,883(5.67%)#2 | 613,139(0.12%)#60 |
| 61. | Minneapolis | 730 | 5,734(12.73%)#2 | 613,139(0.12%)#61 |
| 62. | Oswego | 717 | 72,255(0.99%)#13 | 613,139(0.12%)#62 |
| 63. | Nashua | 704 | 6,605(10.66%)#1 | 613,139(0.11%)#63 |
| 64. | Peabody | 702 | 41,646(1.69%)#4 | 613,139(0.11%)#64 |
| 65. | Las Vegas | 700 | 4,111(17.03%)#2 | 613,139(0.11%)#65 |
| 66. | Louisville | 700 | 2,952(23.71%)#1 | 613,139(0.11%)#66 |
| 67. | Cape Coral | 686 | 38,740(1.77%)#2 | 613,139(0.11%)#67 |
| 68. | Nashville | 683 | 4,993(13.68%)#1 | 613,139(0.11%)#68 |
| 69. | Mesa | 677 | 11,984(5.65%)#4 | 613,139(0.11%)#69 |
| 70. | Oak Park | 670 | 72,255(0.93%)#14 | 613,139(0.11%)#70 |
| 71. | St Petersburg | 661 | 38,740(1.71%)#3 | 613,139(0.11%)#71 |
| 72. | Kenosha | 652 | 13,525(4.82%)#3 | 613,139(0.11%)#72 |
| 73. | Dunmore Borough | 643 | 63,027(1.02%)#5 | 613,139(0.10%)#73 |
| 74. | Plainfield | 632 | 72,255(0.87%)#15 | 613,139(0.10%)#74 |
| 75. | Lockport | 631 | 72,255(0.87%)#16 | 613,139(0.10%)#75 |
| 76. | Sacramento | 623 | 44,962(1.39%)#7 | 613,139(0.10%)#76 |
| 77. | Fort Lauderdale | 614 | 38,740(1.58%)#4 | 613,139(0.10%)#77 |
| 78. | Tamalpais Homestead Valley | 611 | 44,962(1.36%)#8 | 613,139(0.10%)#78 |
| 79. | Cambridge | 608 | 41,646(1.46%)#5 | 613,139(0.10%)#79 |
| 80. | New Britain | 606 | 25,587(2.37%)#2 | 613,139(0.10%)#80 |
| 81. | St Louis | 600 | 6,214(9.66%)#1 | 613,139(0.10%)#81 |
| 82. | Toms River | 598 | 30,104(1.99%)#2 | 613,139(0.10%)#82 |
| 83. | Oak Forest | 597 | 72,255(0.83%)#17 | 613,139(0.10%)#83 |
| 84. | Westmont | 589 | 72,255(0.82%)#18 | 613,139(0.10%)#84 |
| 85. | New Lenox | 588 | 72,255(0.81%)#19 | 613,139(0.10%)#85 |
| 86. | Palos Hills | 585 | 72,255(0.81%)#20 | 613,139(0.10%)#86 |
| 87. | West Palm Beach | 583 | 38,740(1.50%)#5 | 613,139(0.10%)#87 |
| 88. | Parkland | 580 | 38,740(1.50%)#6 | 613,139(0.09%)#88 |
| 89. | San Antonio | 576 | 16,437(3.50%)#4 | 613,139(0.09%)#89 |
| 90. | Lyndhurst | 576 | 21,079(2.73%)#3 | 613,139(0.09%)#90 |
| 91. | Somerville | 564 | 41,646(1.35%)#6 | 613,139(0.09%)#91 |
| 92. | Arlington Heights | 557 | 72,255(0.77%)#21 | 613,139(0.09%)#92 |
| 93. | The Woodlands | 545 | 16,437(3.32%)#5 | 613,139(0.09%)#93 |
| 94. | Tampa | 543 | 38,740(1.40%)#7 | 613,139(0.09%)#94 |
| 95. | Highland Park | 542 | 72,255(0.75%)#22 | 613,139(0.09%)#95 |
| 96. | Romeoville | 541 | 72,255(0.75%)#23 | 613,139(0.09%)#96 |
| 97. | Columbia | 528 | 15,806(3.34%)#2 | 613,139(0.09%)#97 |
| 98. | St Clair Shores | 521 | 28,794(1.81%)#4 | 613,139(0.08%)#98 |
| 99. | Boca Raton | 520 | 38,740(1.34%)#8 | 613,139(0.08%)#99 |
| 100. | Berwyn | 520 | 72,255(0.72%)#24 | 613,139(0.08%)#100 |
Common Questions
What are the Top 10 Cities with the Largest Lithuanian Community in the United States?
Top 10 Cities with the Largest Lithuanian Community in the United States are:
#1
12,873
#2
9,926
#3
5,322
#4
4,010
#5
3,031
#6
2,765
#7
2,536
#8
2,487
#9
2,360
#10
2,234
What city has the Largest Lithuanian Community in the United States?
New York has the Largest Lithuanian Community in the United States with 12,873.
What is the Total Lithuanian Population in the United States?
Total Lithuanian Population in the United States is 613,139.